Article

Research on the Coordination of Transportation Network and Ecological Corridors Based on Maxent Model and Circuit Theory in the Giant Panda National Park, China

1
School of Architecture and Design, Beijing Jiaotong University, Beijing 100044, China
2
Territorial Space and Transport Coordinated Development Institute, Beijing Jiaotong University, Beijing 100044, China
*
Author to whom correspondence should be addressed.
Land 2025, 14(7), 1465; https://doi.org/10.3390/land14071465
Submission received: 6 June 2025 / Revised: 7 July 2025 / Accepted: 10 July 2025 / Published: 14 July 2025
(This article belongs to the Special Issue Territorial Space and Transportation Coordinated Development)

Abstract

National parks serve as critical spatial units for conserving ecological baselines, maintaining genetic diversity, and delivering essential ecosystem services. However, accelerating socio-economic development has increasingly intensified the conflict between ecological protection and transportation infrastructure. Ecologically sustainable transportation planning is, therefore, essential to mitigate habitat fragmentation, facilitate species migration, and conserve biodiversity. This study examines the Giant Panda National Park and its buffer zone, focusing on six mammal species: giant panda, Sichuan snub-nosed monkey, leopard cat, forest musk deer, rock squirrel, and Sichuan takin. By integrating Maxent ecological niche modeling with circuit theory, it identified ecological source areas and potential corridors, and employed a two-step screening approach to design species-specific wildlife crossings. In total, 39 vegetated overpasses were proposed to serve all target species; 34 underpasses were integrated using existing bridge and culvert structures to minimize construction costs; and 27 canopy bridges, incorporating suspension cables and elevated pathways, were designed to connect forest canopies for arboreal species. This study established a multi-species and multi-scale conservation framework, providing both theoretical insights and practical strategies for ecologically integrated transportation planning in national parks, contributing to the synergy between biodiversity conservation and sustainable development goals.

1. Introduction

National parks are critical to global biodiversity conservation and serve as exemplary models of human–nature coexistence [1]. However, with the rapid acceleration of global urbanization and the continuous expansion of infrastructure development, habitat fragmentation within national parks is intensifying, disrupting species migration and gene flow, and ultimately reducing habitat ranges, shrinking population sizes, and raising extinction risks [2,3]. As a flagship species endemic to China, the conservation of giant panda habitats is a crucial component of the country’s ecological civilization initiatives. The official establishment of the Giant Panda National Park in 2021 marked a new milestone in China’s ecological protection efforts. This park spans the transitional zone between the eastern edge of the Tibetan Plateau and the Sichuan Basin, encompassing diverse ecosystems and rich biodiversity. However, it simultaneously faces significant challenges, such as ecological fragmentation and transportation-induced disturbances. Ecological corridors, which link fragmented habitats and facilitate species movement, are essential for mitigating habitat fragmentation [4]. Meanwhile, wildlife crossings are a key strategy for incorporating ecological principles into transport infrastructure and minimizing their disruption to wildlife habitats. Therefore, accurately predicting the potential distribution of species habitats and scientifically optimizing ecological corridors and wildlife crossing designs are vital for achieving a balance between biodiversity conservation and transportation development [5].
In recent years, the integration of ecological conservation and transportation planning has emerged as a key topic in international academic research. Numerous studies have demonstrated the critical role of ecological corridors in mitigating habitat fragmentation and facilitating species movement and gene flow [6]. Reports from the International Union for Conservation of Nature (IUCN) have emphasized the ecological function of corridors in promoting landscape connectivity. A World Wildlife Fund report highlighted that large-scale infrastructure projects, such as those under the Belt and Road Initiative, may disrupt the habitats of many endangered species, further highlighting the urgency and importance of ecological corridor construction [7]. In Road Ecology: Science and Solutions, Forman et al. emphasized the theoretical foundation and practical strategies of road ecology, identifying wildlife crossings as an effective measure to mitigate the ecological impacts of transportation infrastructure [8,9]. Recent years have seen significant advances in corridor siting, structural design, habitat guidance, and performance monitoring. For example, Clevenger et al., in the Wildlife Crossing Structure Handbook, provided comprehensive guidelines for the design and evaluation of wildlife crossings in North America [10]. Moreover, advancements in technologies such as infrared camera monitoring, track analysis, and molecular techniques have greatly expanded research capacity in this field [11,12]. Despite these advancements, current research still faces several limitations. Most studies focus on single-species conservation, lacking a holistic understanding of multi-species ecological requirements, thus falling short of supporting comprehensive biodiversity goals. Moreover, the design of wildlife crossings often inadequately accounts for species-specific behavioral and ecological traits, limiting their functional effectiveness [13]. Therefore, strengthening research on multi-species collaborative protection, improving the design methods of wildlife crossings, and promoting the formulation of relevant standard systems are of great significance for enhancing the coordination of ecological corridors and transportation networks.
This study takes the Giant Panda National Park and its buffer zone as the study area and develops an ecological optimization approach for transportation networks based on the Maxent model and circuit theory [14], identifies ecological sources and corridors, optimizes transportation routes, and designs composite wildlife crossings to alleviate conflicts between ecological protection and transportation planning, thereby promoting regional ecological balance and sustainable development. The innovations of this study are reflected in the following three aspects: at the theoretical level, it proposes a four-stage ecological road network construction framework of ‘analysis-evaluation-construction-optimization’, which can systematically resolve the conflicts between the protection of the giant panda habitat and the traffic planning; at the methodological level, it innovatively uses the two-step screening method to realize the scientific siting of the composite wildlife crossings and the optimization of the ecological network; at the spatial level [15], the study breaks through the limitations of traditional small-scale research and builds a multi-species collaborative conservation planning system covering the Giant Panda National Park and its buffer zone. The findings offer theoretical insights and practical guidance for optimizing transportation networks in national parks, contributing to global biodiversity conservation and sustainable ecological infrastructure development.

2. Materials and Methods
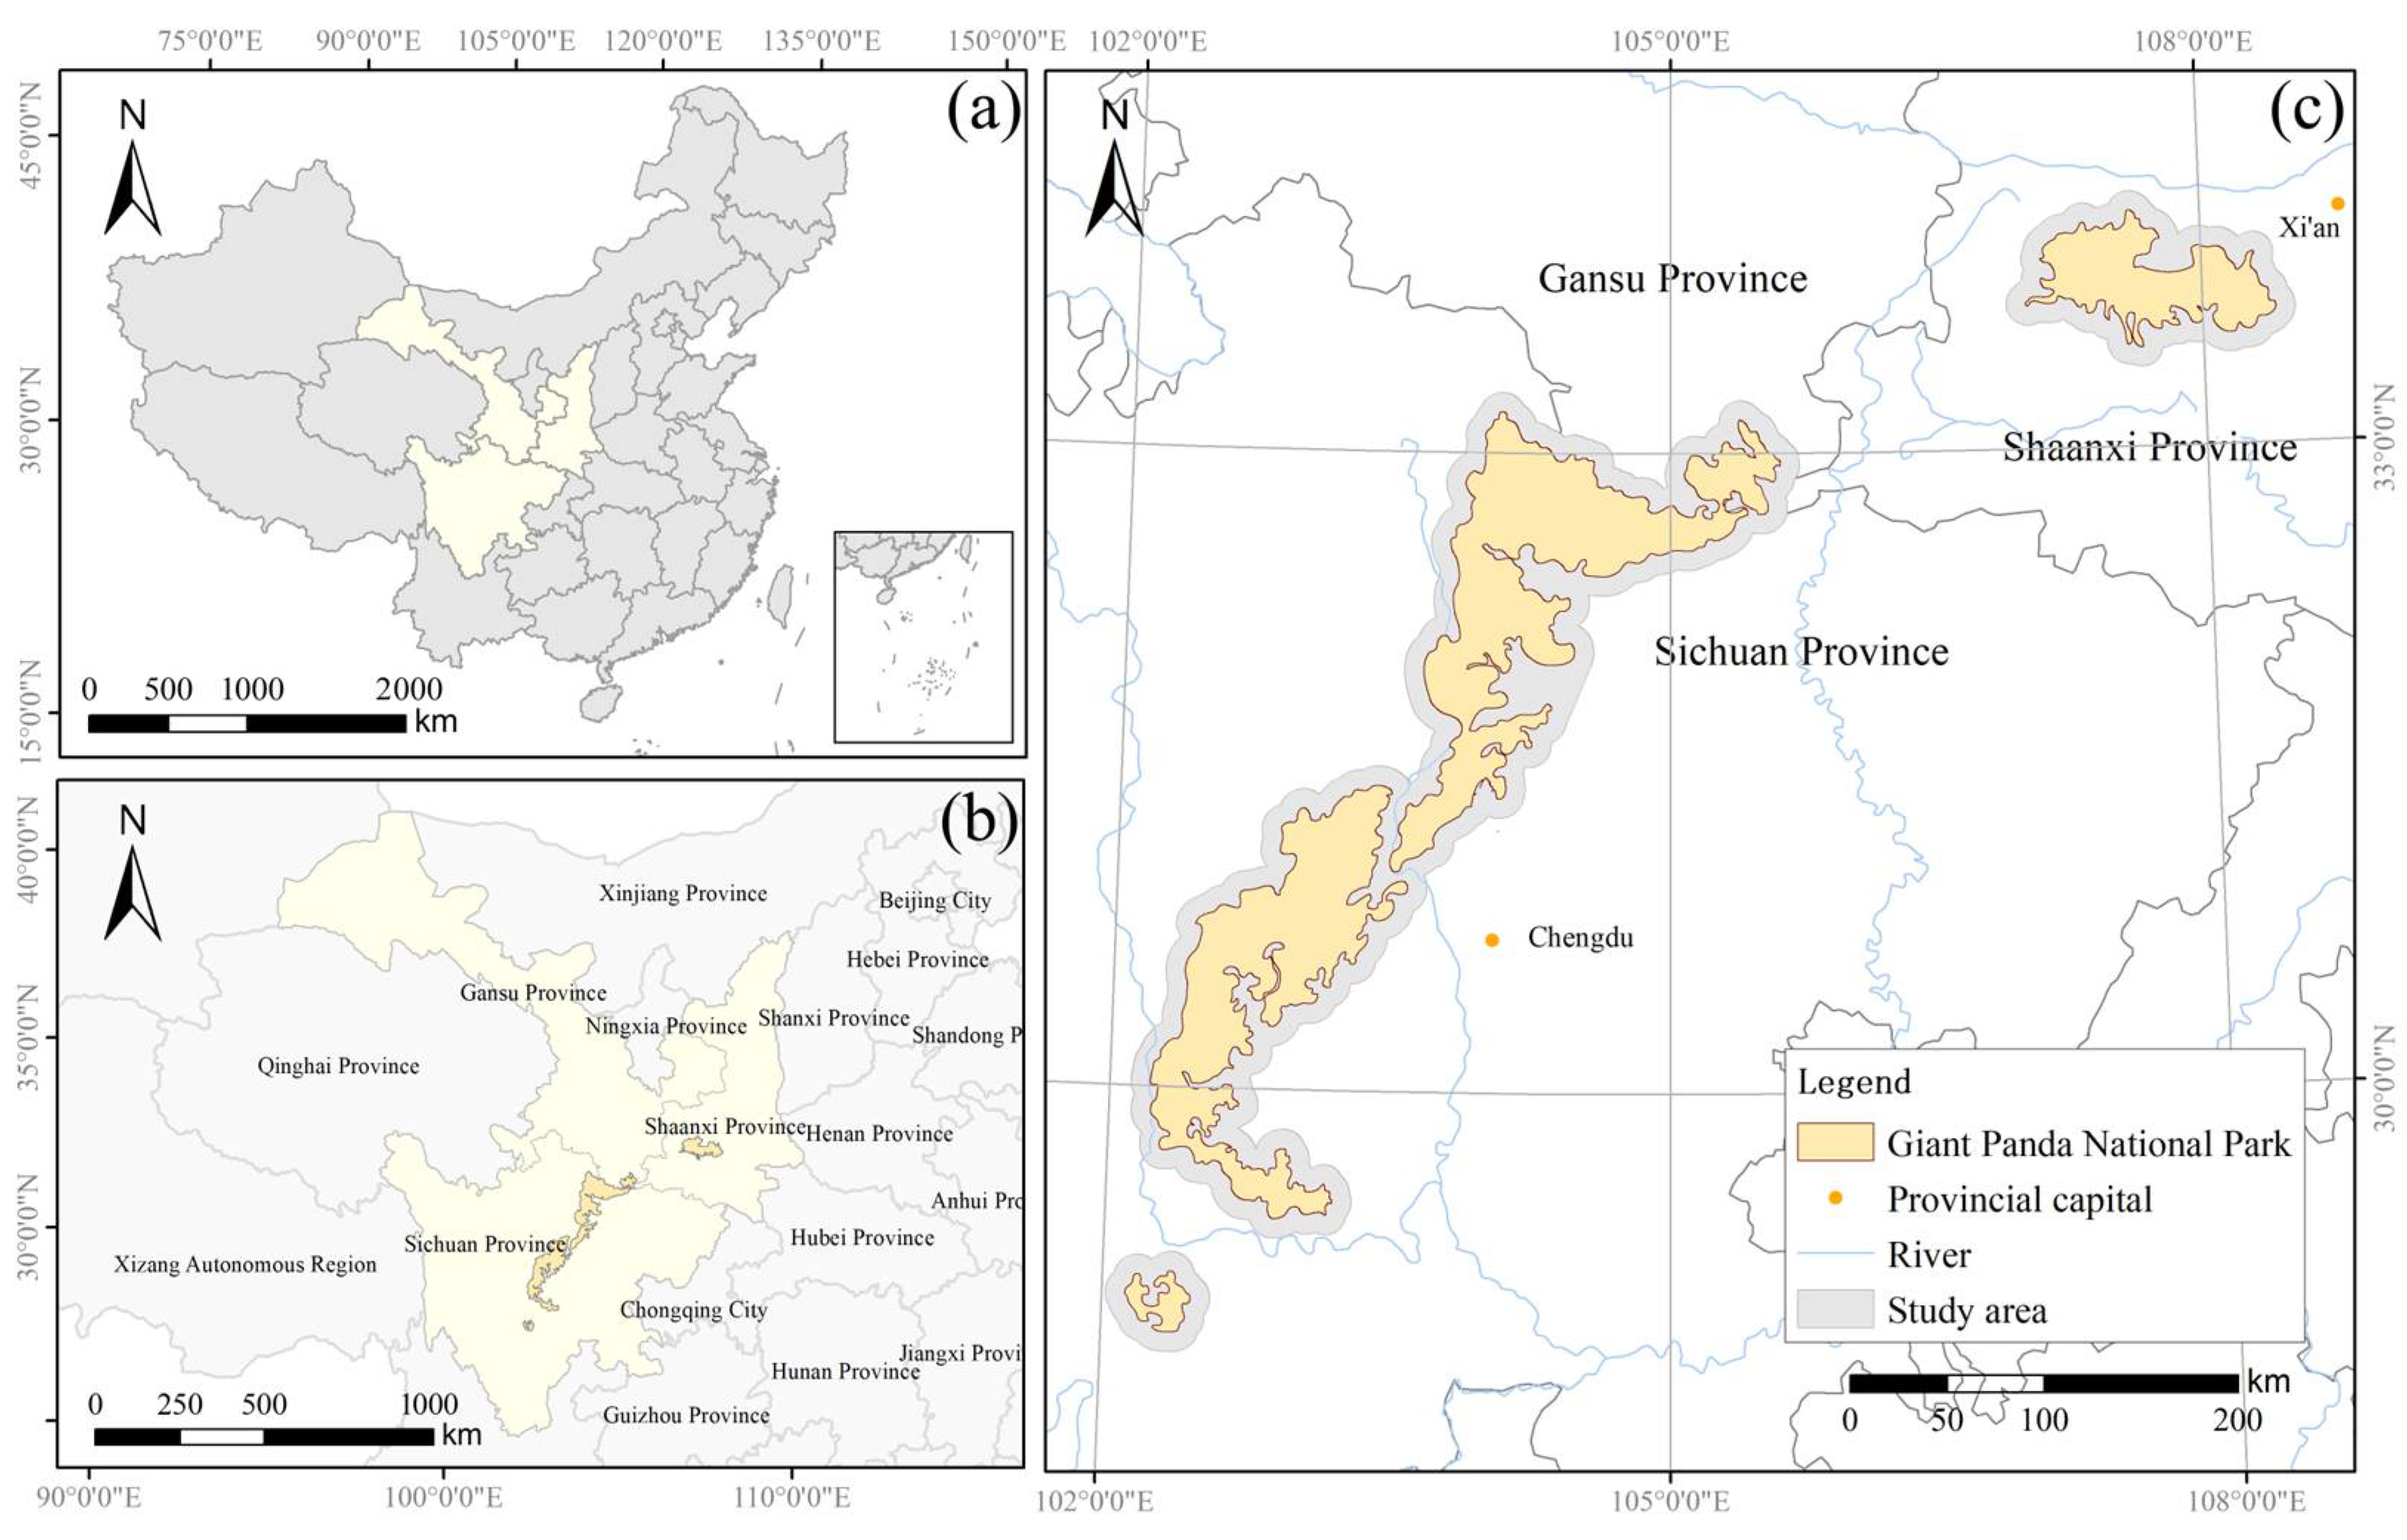
2.1. Study Area

The Giant Panda National Park is located along the boundary between the first and second steps of China’s topographic ladder, on the eastern edge of the Qinghai–Tibet Plateau. It lies within the alpine valley regions of the Min Mountains, Qionglai Mountains, and the Xiaoxiangling–Daxiangling ranges, which form the transitional zone between the Sichuan Basin and the Qinghai–Tibet Plateau. The region features highly complex terrain, with steep mountains, deep valleys, and a dense river network. The park’s hydrological system drains into three major tributaries of the Yangtze River Basin: the Jialing River, Min River, and Tuo River. The total area of the park is approximately 22,000 square kilometers. The region experiences a continental monsoon climate that transitions from the northern subtropical zone to the warm temperate zone. It is generally humid and rainy, with a diverse and complex climatic pattern. Annual precipitation ranges between approximately 500 mm and 1200 mm [16].
Since the activity range of giant pandas cannot be confined within the boundaries of the national park, this study defines the research scope as encompassing both the Giant Panda National Park and a 10 km buffer zone surrounding it (Figure 1). The total study area, therefore, spans approximately 52,800 square kilometers.

2.2. Data Source and Pre-Processing

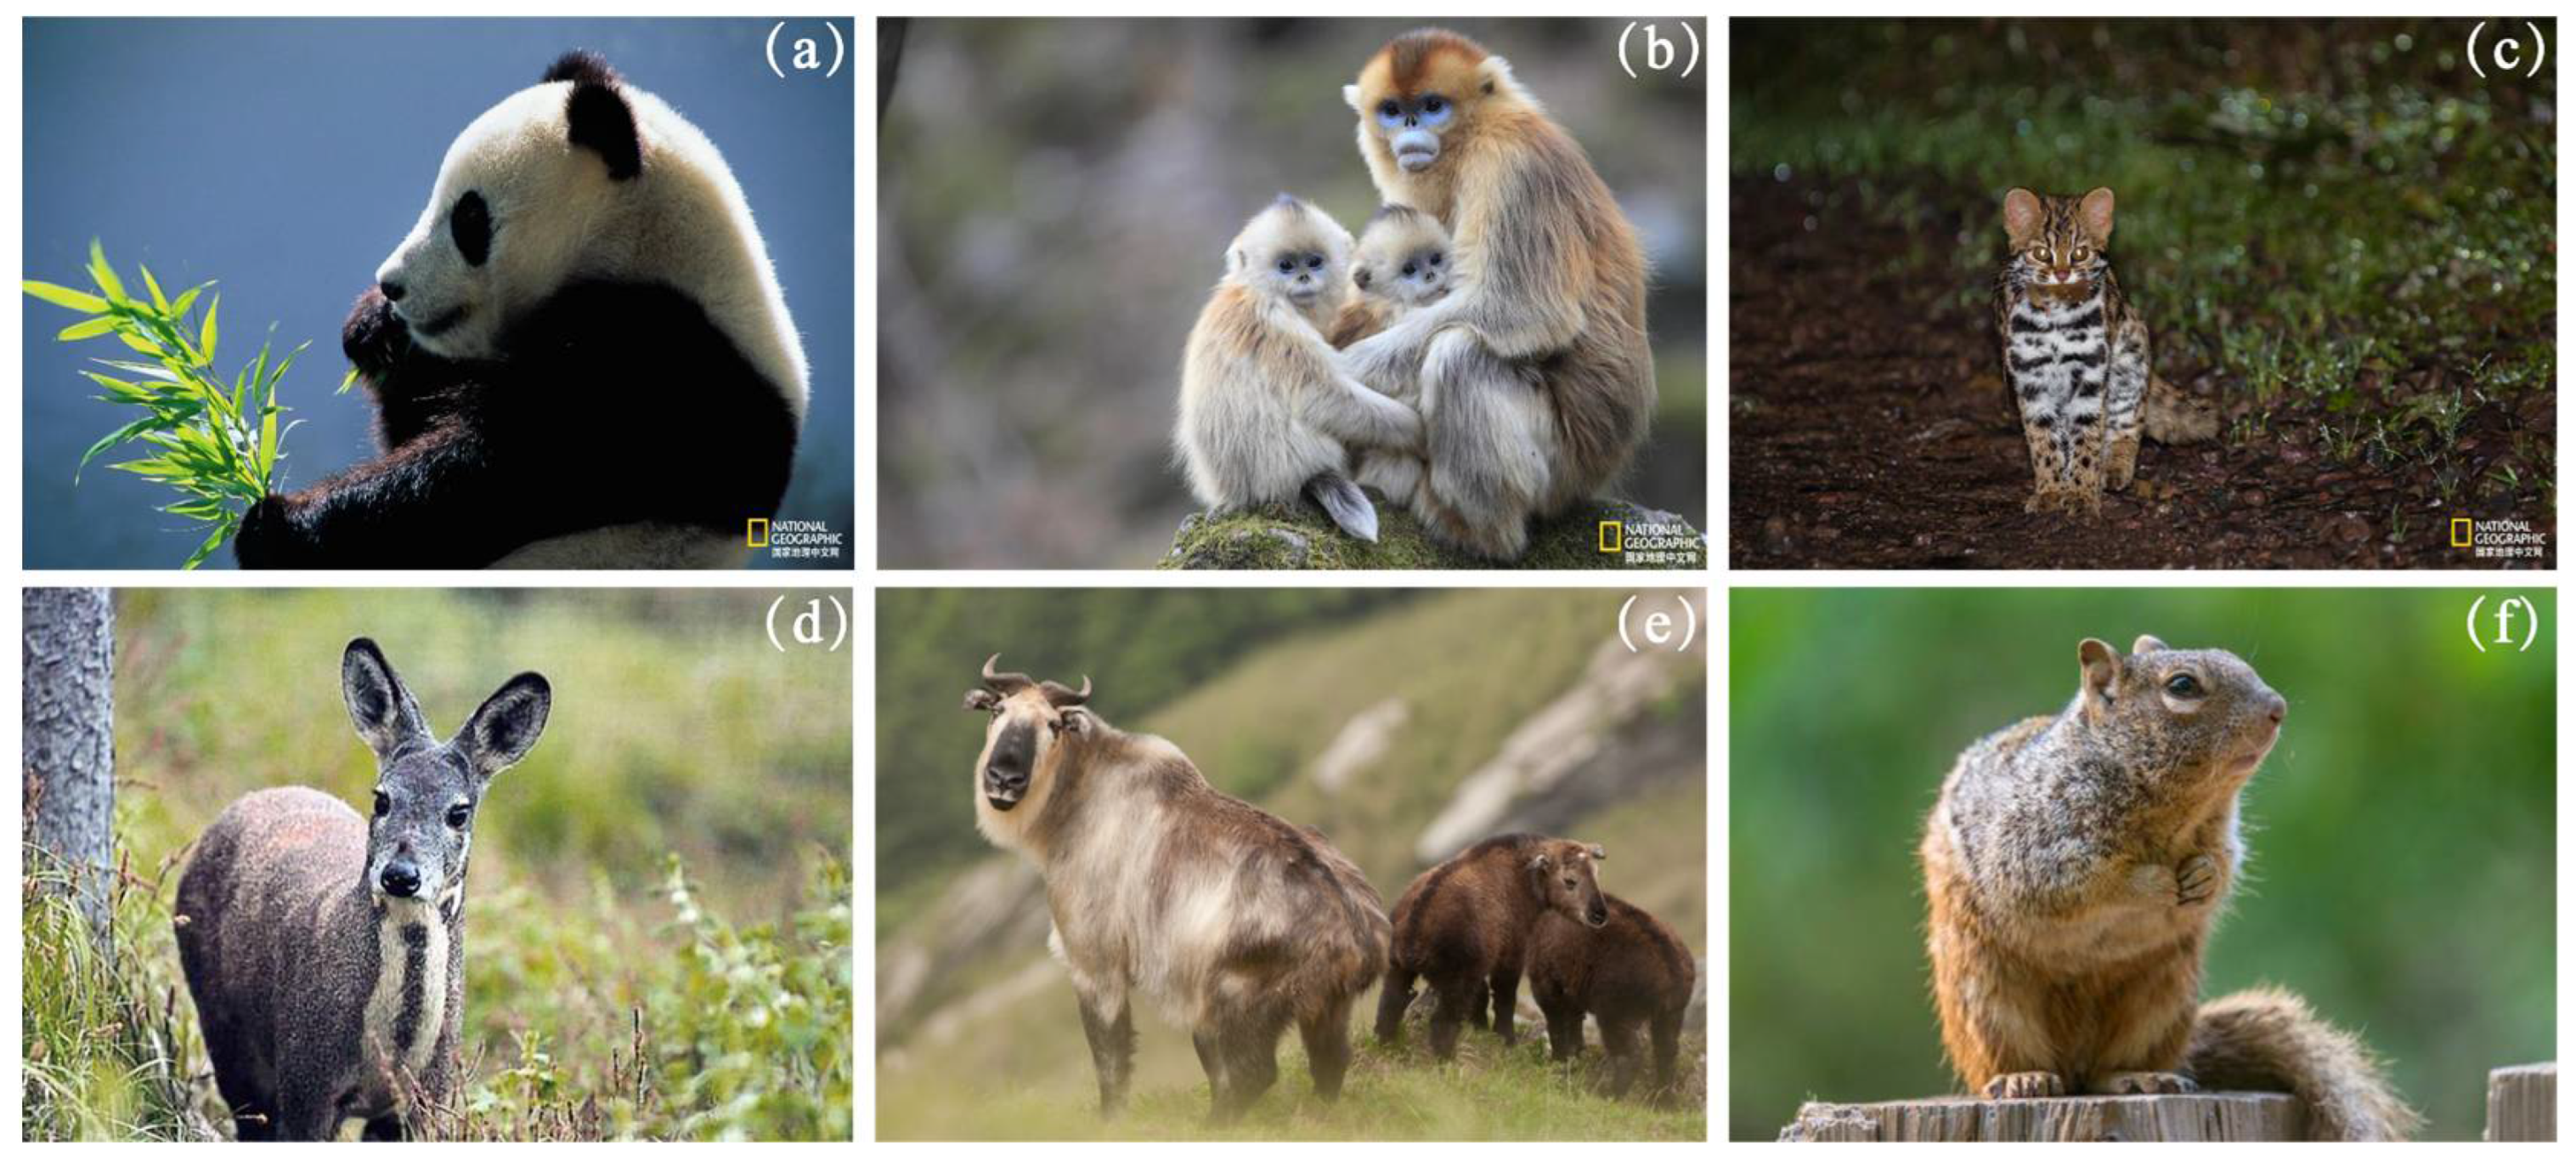
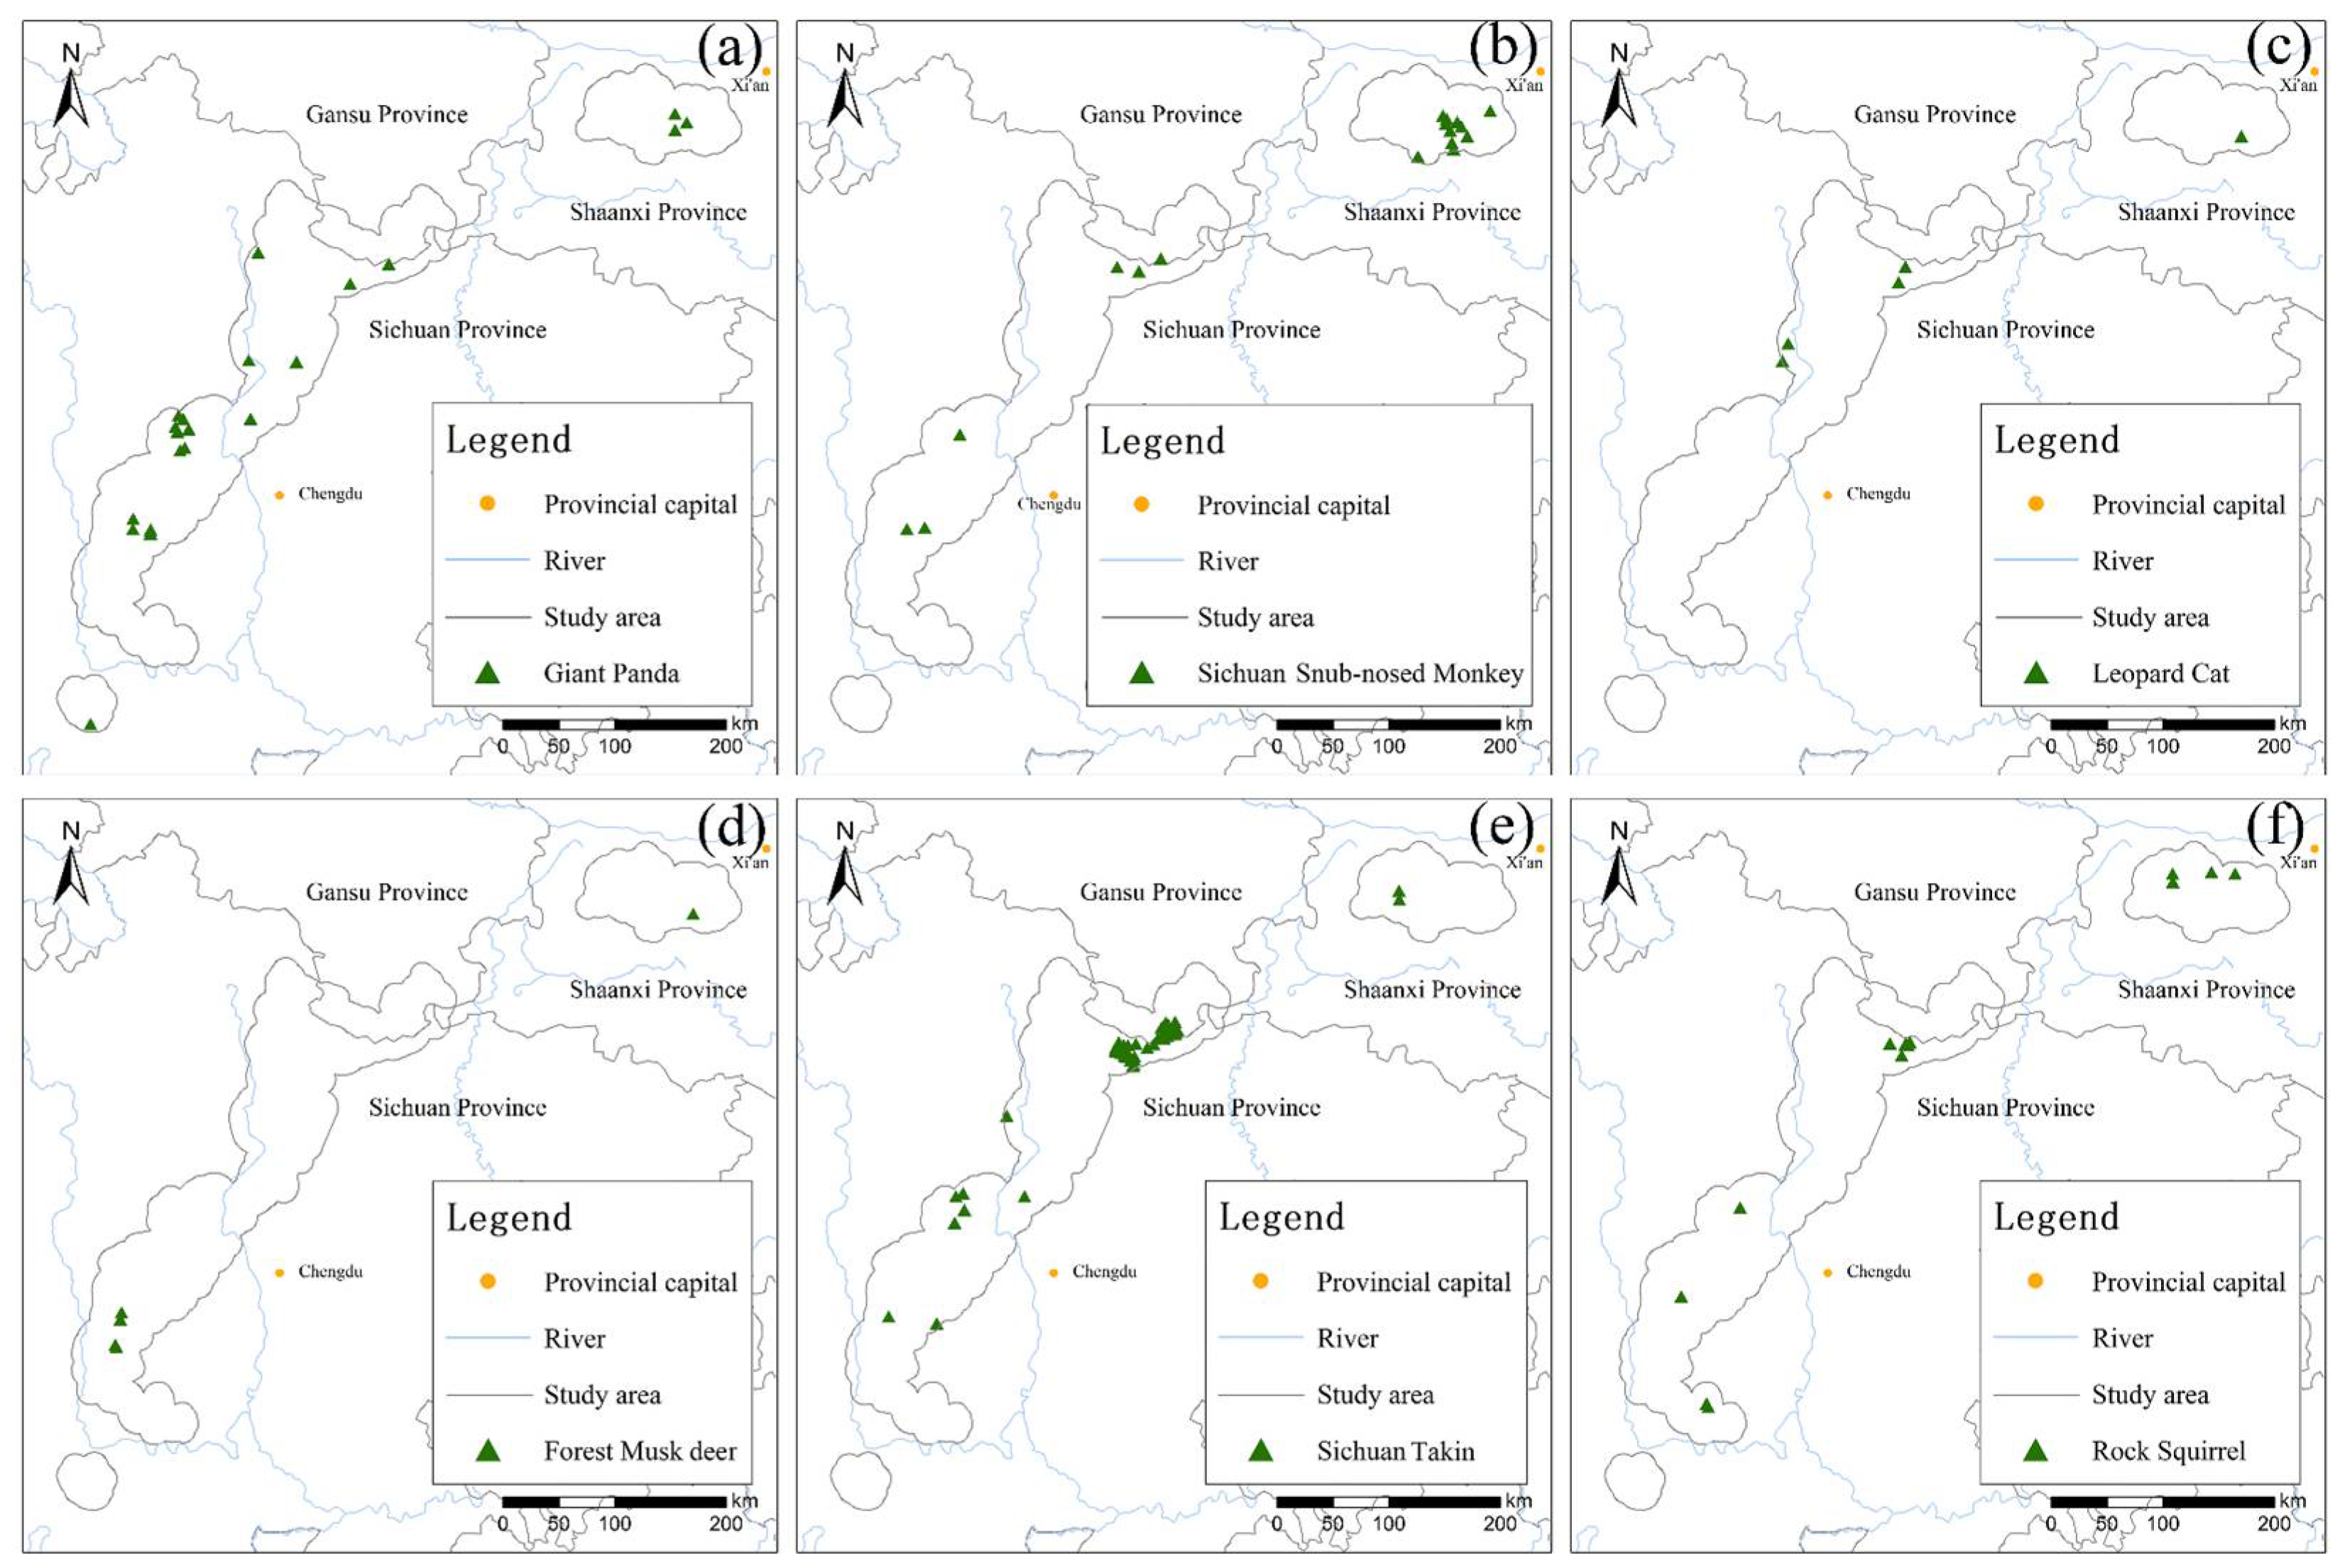
2.2.1. Distribution Data

Based on extensive literature review and comprehensive consideration of species records within Giant Panda National Park, national protection levels, species categories, and IUCN assessment statuses, this study selected six target terrestrial mammal species of varying sizes for analysis: giant panda (Ailuropoda melanoleuca), Sichuan snub-nosed monkey (Rhinopithecus roxellana), leopard cat (Prionailurus bengalensis), forest musk deer (Moschus berezovskii), Sichuan takin (Budorcas tibetana), and rock squirrel (Sciurotamias davidianus) (Figure 2). Figure 3 presents the statistics of the selected species used in this study. Species distribution data were obtained from occurrence point datasets downloaded from the Global Biodiversity Information Facility (GBIF) database (https://www.gbif.org/) (accessed on 12 September 2024). The geographical distribution of occurrence points for each species is shown in Figure 4.

2.2.2. Road Data

The current railway and highway data of Sichuan, Shaanxi, and Gansu provinces are obtained from Open Street Map; the planned railway, highway, and provincial highway data are obtained from the traffic planning maps of Sichuan, Gansu, and Shaanxi provinces and are geographically calibrated by ArcGIS 10.8.

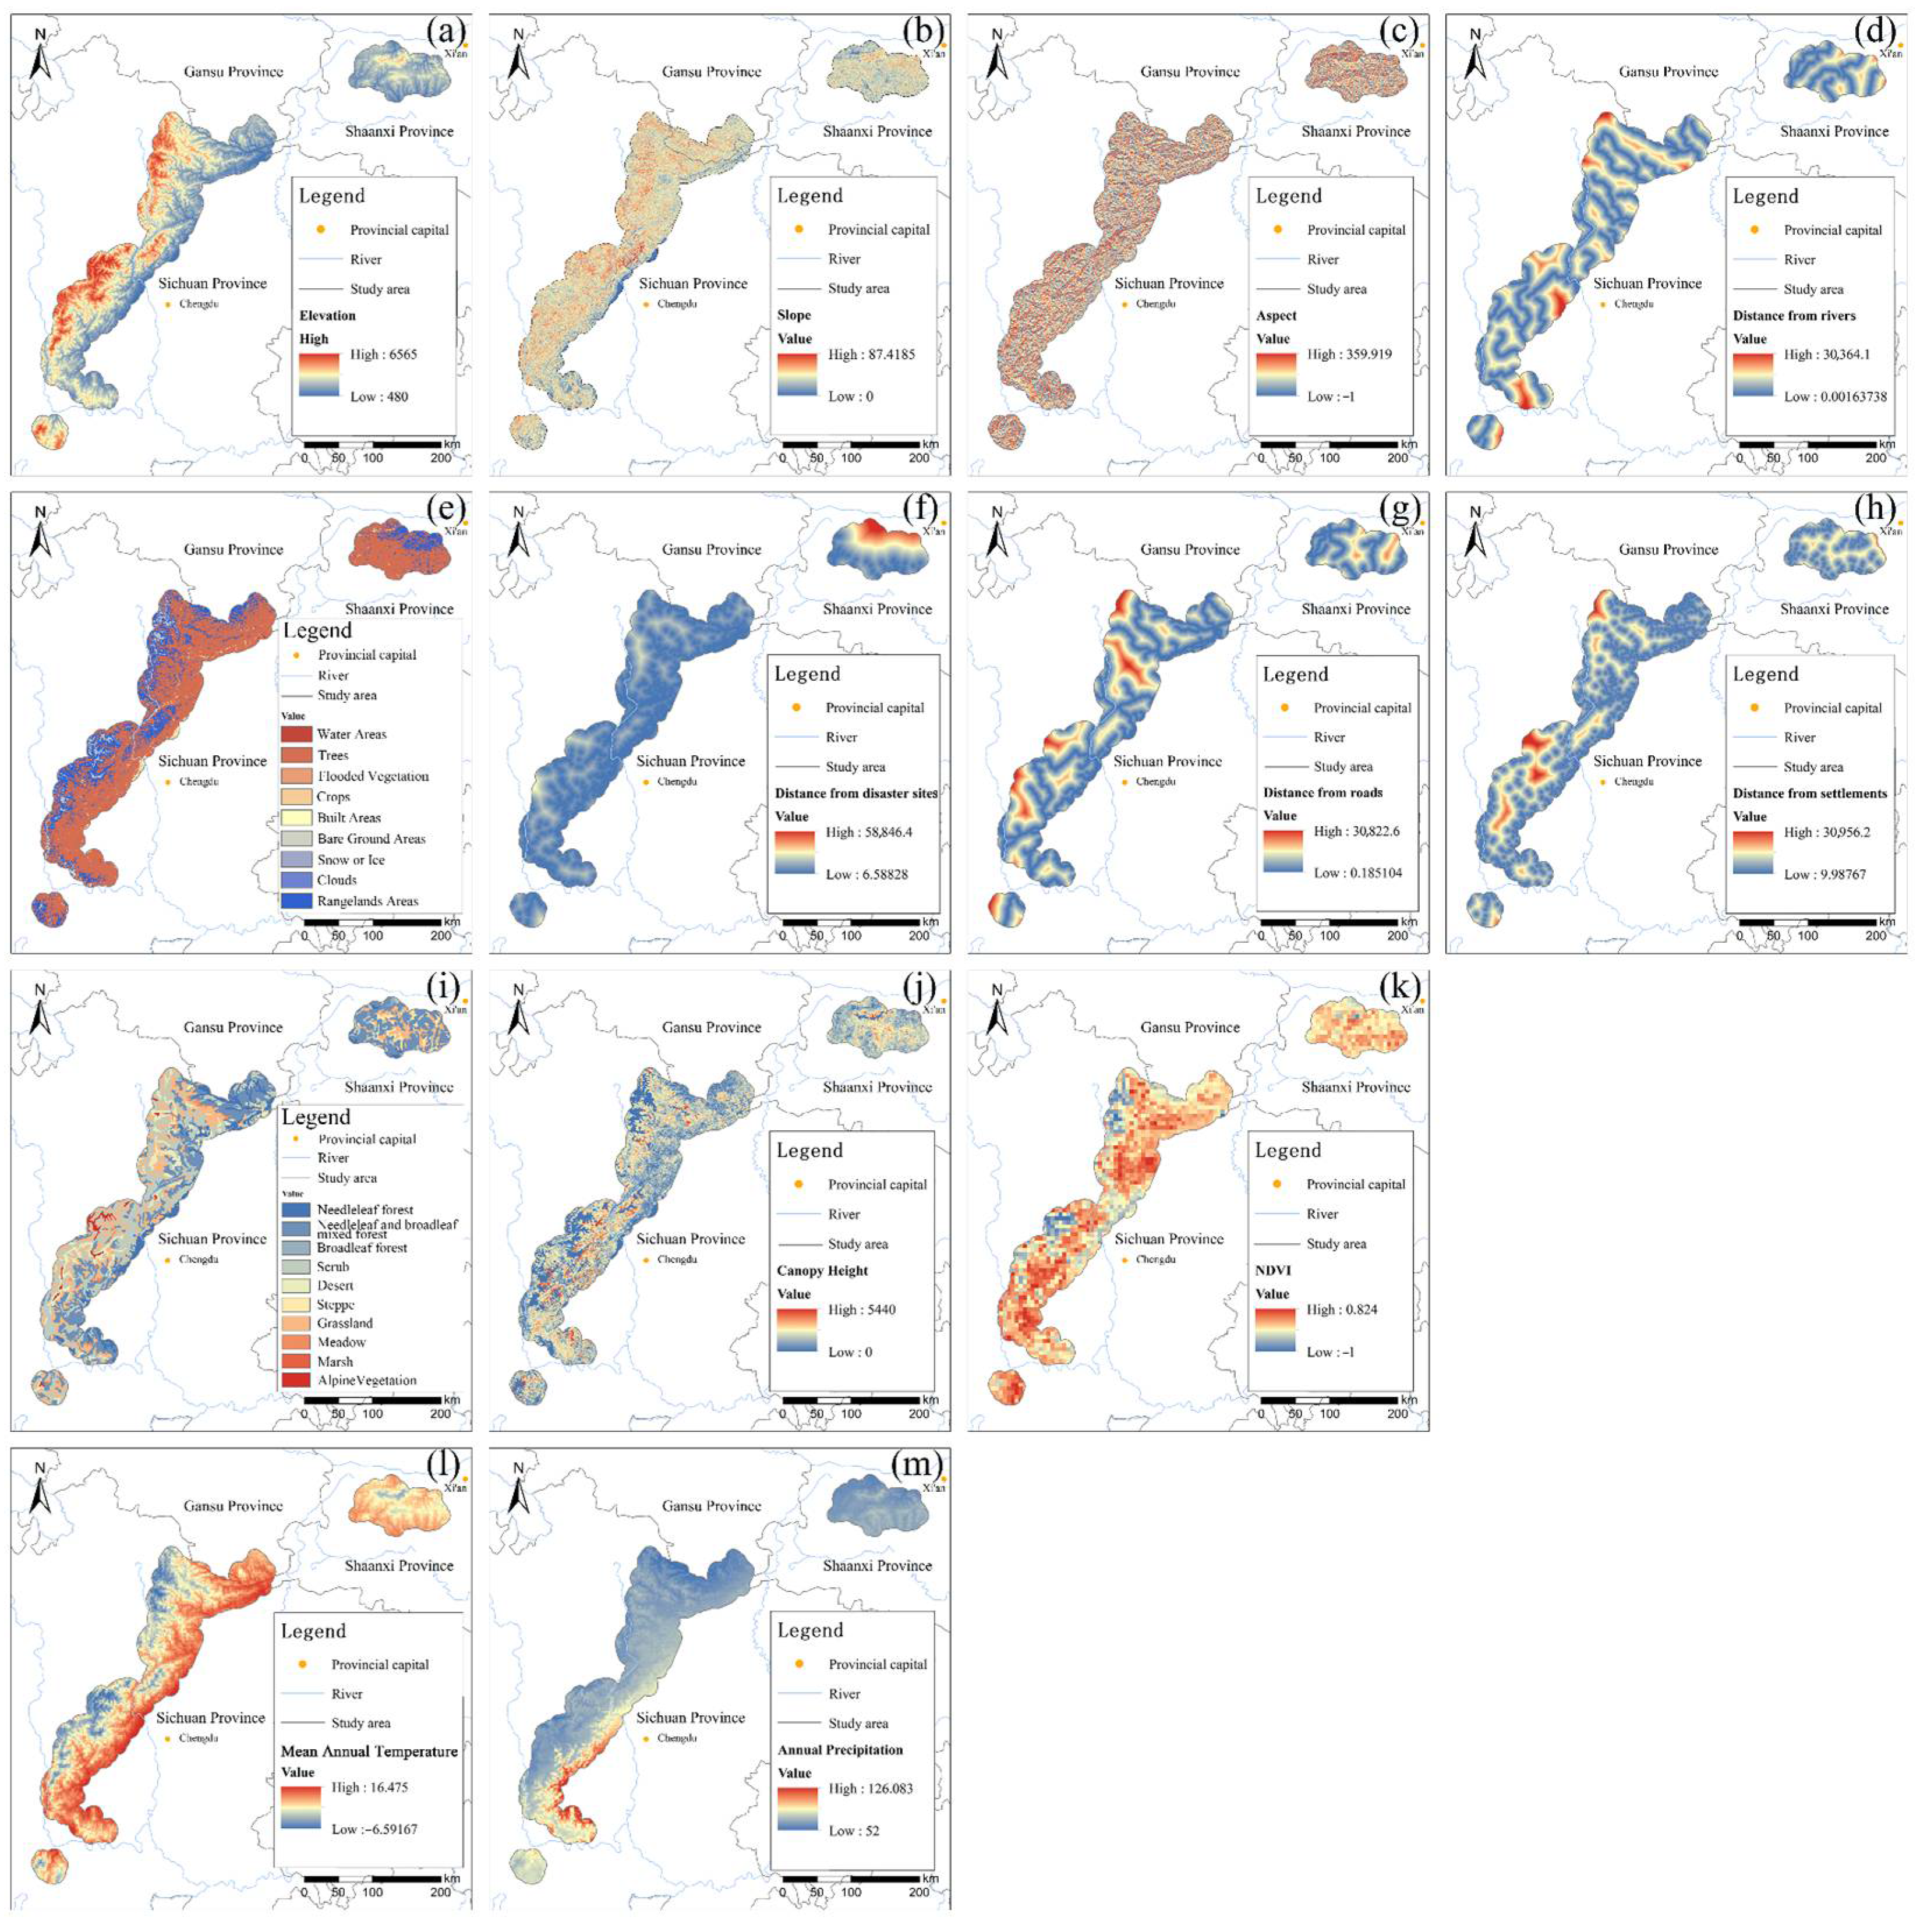
2.2.3. Environmental Data

Based on the habitat selection characteristics, living habits and literature studies of the selected wildlife, a comprehensive habitat factor index system was constructed by considering and determining the influencing factors from four aspects, namely, geographic environment, climatic factors, biological factors, and disturbance factors (Table 1). From the Geospatial Data Cloud Platform (GDCP), 30 m precision DEM data were obtained, and elevation, slope, and direction were calculated from DEM data by the spatial analysis tool of ArcGIS 10.8. The water source data were obtained from Open Street Map, annual precipitation and mean annual temperature were obtained from the official website of World Clim, canopy height data were obtained from https://www.3decology.org/ (accessed on 19 September 2024), the Normalized Difference Vegetation Index (NDVI) is obtained from the Resource and Environment Science and Data Center of the Chinese Academy of Sciences, and 1:1 million vegetation type distribution data were obtained from the National Glacier Frost and Frost Service Platform. The type distribution data is from the National Glacial and Permafrost Desert Science Data Centre, the settlement data is from the National Bureau of Statistics, the 10 m accuracy land cover data is from Esri|Sentinel-2 Land Cover Explorer, and the natural disaster point data is from the Centre for Resource and Environmental Science and Data (Table 2).

2.2.4. Data Processing

In ArcGIS 10.8, all data required for the research were unified into the GCS_Beijing_1954 projection coordinate system, and the point data of six species were unified into CSV format. All environmental variable data were converted into raster format and resampled to a resolution of 30 m × 30 m (Figure 5). Subsequently, the raster files of various environmental variables were converted into ASCII format required for the Maxent model and then input into Maxent for operation.

2.3. Methods

2.3.1. Maxent Modeling and Circuit Theory

This study employed the Maxent model and circuit theory to identify species ecological corridors. The Maxent 3.4.4 [18], based on Maximum Entropy Machine Learning (MEML), uses ecological niche modeling and species occurrence data to analyze the relationship between species distribution and environmental variables. By iteratively fitting the model, it calculates the probability distribution with maximum entropy, thereby predicting the potential geographic distribution of the species [19]. The result can visually represent suitable habitat distribution and facilitate habitat suitability assessment.
Circuit theory, applied in landscape ecology, is grounded in the random walk model from probability theory. The Linkage Mapper 3.0.0 (The Nature Conservancy, https://linkagemapper.org/) (accessed on 8 October 2024), based on circuit theory, identifies adjacent ecological sources through neighborhood and distance data, constructs a regional network between ecological sources, calculates the cost-weighted distance from each grid on the resistance surface to the ecological sources, and superimposes it on the ecological sources to find out the path with the lowest cumulative cost between the ecological sources [20,21]. The ecological corridor is the path that minimizes the cumulative cost between ecological sources.
Species distribution data and corresponding environmental variables were input into the Maxent model and iteratively fitted to estimate the probability distribution at maximum entropy, thus characterizing species distribution patterns. The relative importance of variables was evaluated using the Jackknife procedure, and 10-fold cross-validation was performed to minimize random errors in model predictions [22].
The habitat suitability outputs (TIF files) from the Maxent model were reclassified using the Reclassify tool in ArcGIS 10.8 (Esri Inc., Redlands, CA, USA), Habitat suitability was divided into five levels based on value thresholds: 0–0.2 as unsuitable areas, 0.2–0.4 as low-suitability areas, 0.4–0.6 as moderate-suitability areas, 0.6–0.8 as high-suitability areas, and 0.8–1.0 as very high-suitability areas [23]. Areas classified as moderate suitability and above (≥0.4) were identified as ecological core areas. Considering differences in species habits, as well as the size and number of core patches, patches larger than 8–30 km2 were selected as ecological source areas.
Based on the Jackknife test results provided by the Maxent 3.4.4, the importance of each environmental variable to species distribution was evaluated. A higher training gain under the condition of a single variable indicates greater independent explanatory power of that variable, and thus a more significant impact on the species’ distribution. According to this principle, the variable contribution rates and Jackknife gain values were extracted for each species during the modeling process, and the five most influential variables were selected as key resistance factors [24]. Given the variability in species’ ecological responses to environmental factors, a unified weighting scheme would be insufficient to capture their specific behavioral and habitat preferences. Therefore, species-specific resistance factors were identified, and differentiated weights were assigned based on the variable contributions of each species. The contribution values of the five factors were then normalized to ensure their sum equals 1 and were further adjusted with reference to the relevant literature and expert opinions, thereby generating the final weighting coefficients used in the construction of the integrated resistance surface.
In ArcGIS 10.8, each resistance factor was reclassified into five resistance levels (1 representing the lowest resistance and 5 representing the highest) using the Natural Breaks (Jenks) method. The Raster Calculator was then used to apply weighted overlay of the five factors based on their corresponding weights, resulting in the integrated resistance surface for each species [25]. This surface was subsequently used for least-cost path analysis in the construction of ecological corridors.

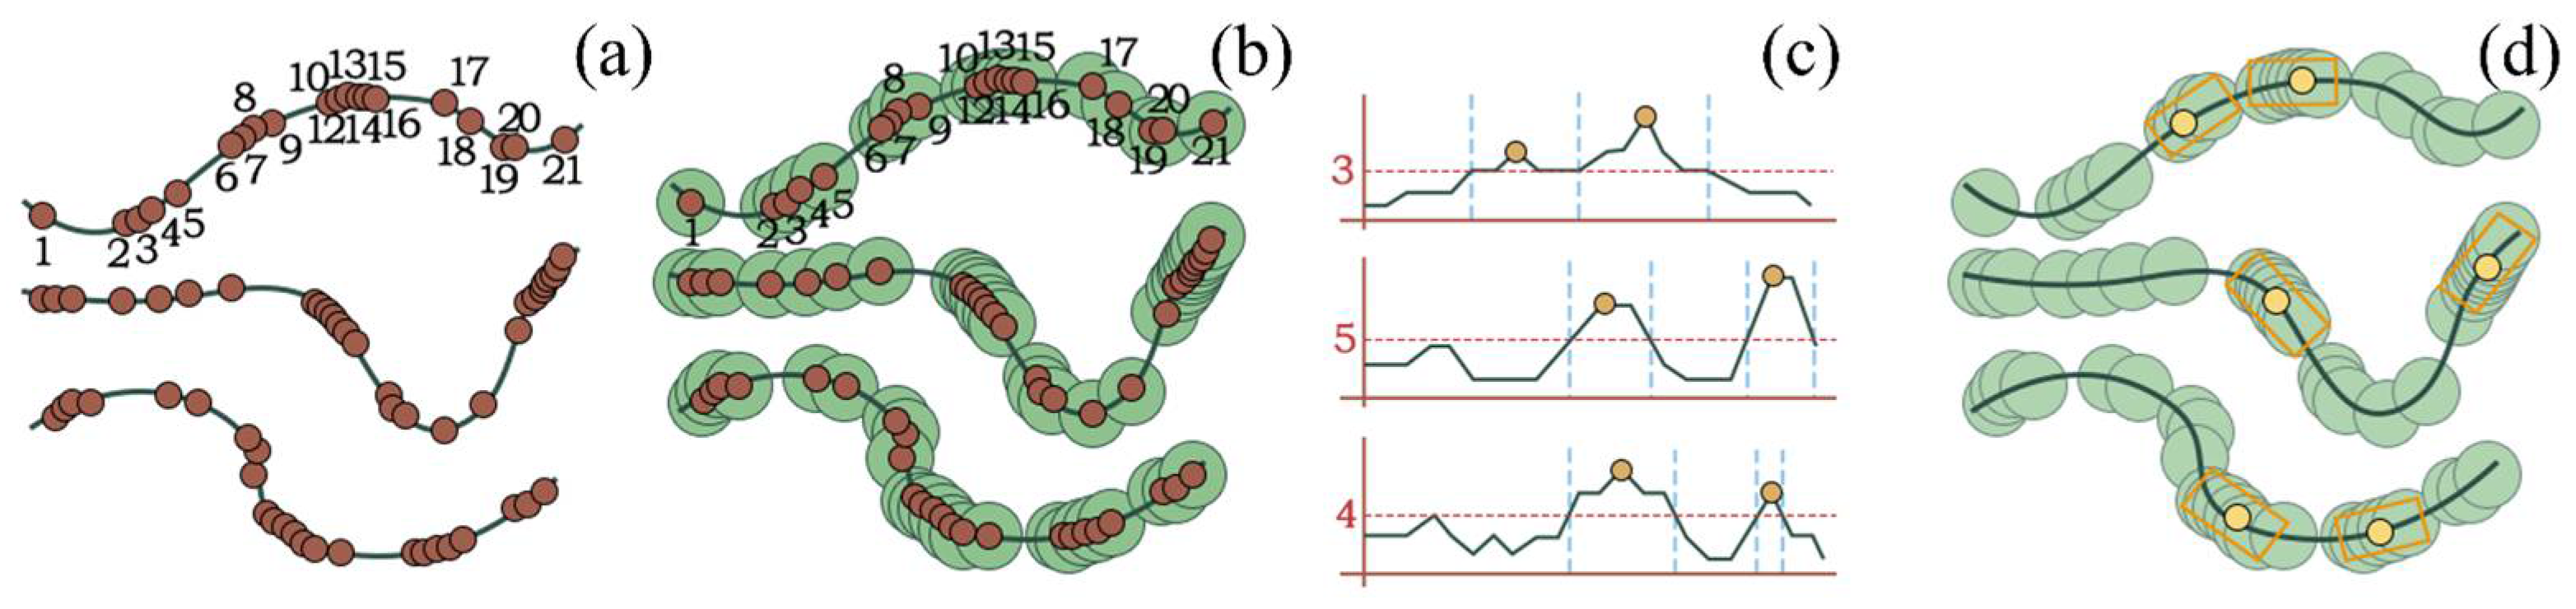
2.3.2. Two-Step Screening Method

In this study, intersections between planned and existing railways and highways with ecological corridors and source areas of multiple species within Giant Panda National Park were defined as conflict points. These points were categorized into multiple sets based on the type of wildlife crossing. For each road, the number of conflict points was counted, and roads containing more than five conflict points were selected for analysis using the two-step screening method.
The two-step screening method was developed to identify suitable locations for constructing composite wildlife corridors. In the first step, all ecological conflict points were sequentially numbered, and a fixed-radius buffer zone was established around each point. Then, the number of surrounding conflict points within each buffer was counted to assess the degree of spatial clustering. In the second step, points located at the peak of a clustering interval—representing local hotspots of ecological conflict—were selected as priority locations for corridor construction. The overall screening framework is illustrated in Figure 6.

2.4. Study Framework

This study proposes a systematic framework for the ecological development of the transportation network within the Giant Panda National Park. Based on the Maxent model, we conducted an integrated analysis of species distribution data and environmental variables to evaluate habitat suitability and identify ecological sources. A minimum cumulative resistance model was constructed by quantifying the impact of environmental variables on animal habitats. By integrating circuit theory with the Linkage Mapper tool and the minimum resistance surface, we delineated ecological corridors by identifying least-cost paths between ecological sources. Multi-species corridor overlay analysis and a two-step screening method were used to locate spatial conflict points. In response to the ecological impacts of existing roads, three types of composite wildlife crossings were designed based on the biological characteristics of different species, optimizing the synergy between ecological corridors and the transportation network. This provides scientific basis and practical guidance for balancing biodiversity conservation and infrastructure development in national parks. The overall technical framework of the study is illustrated in Figure 7.

3. Results

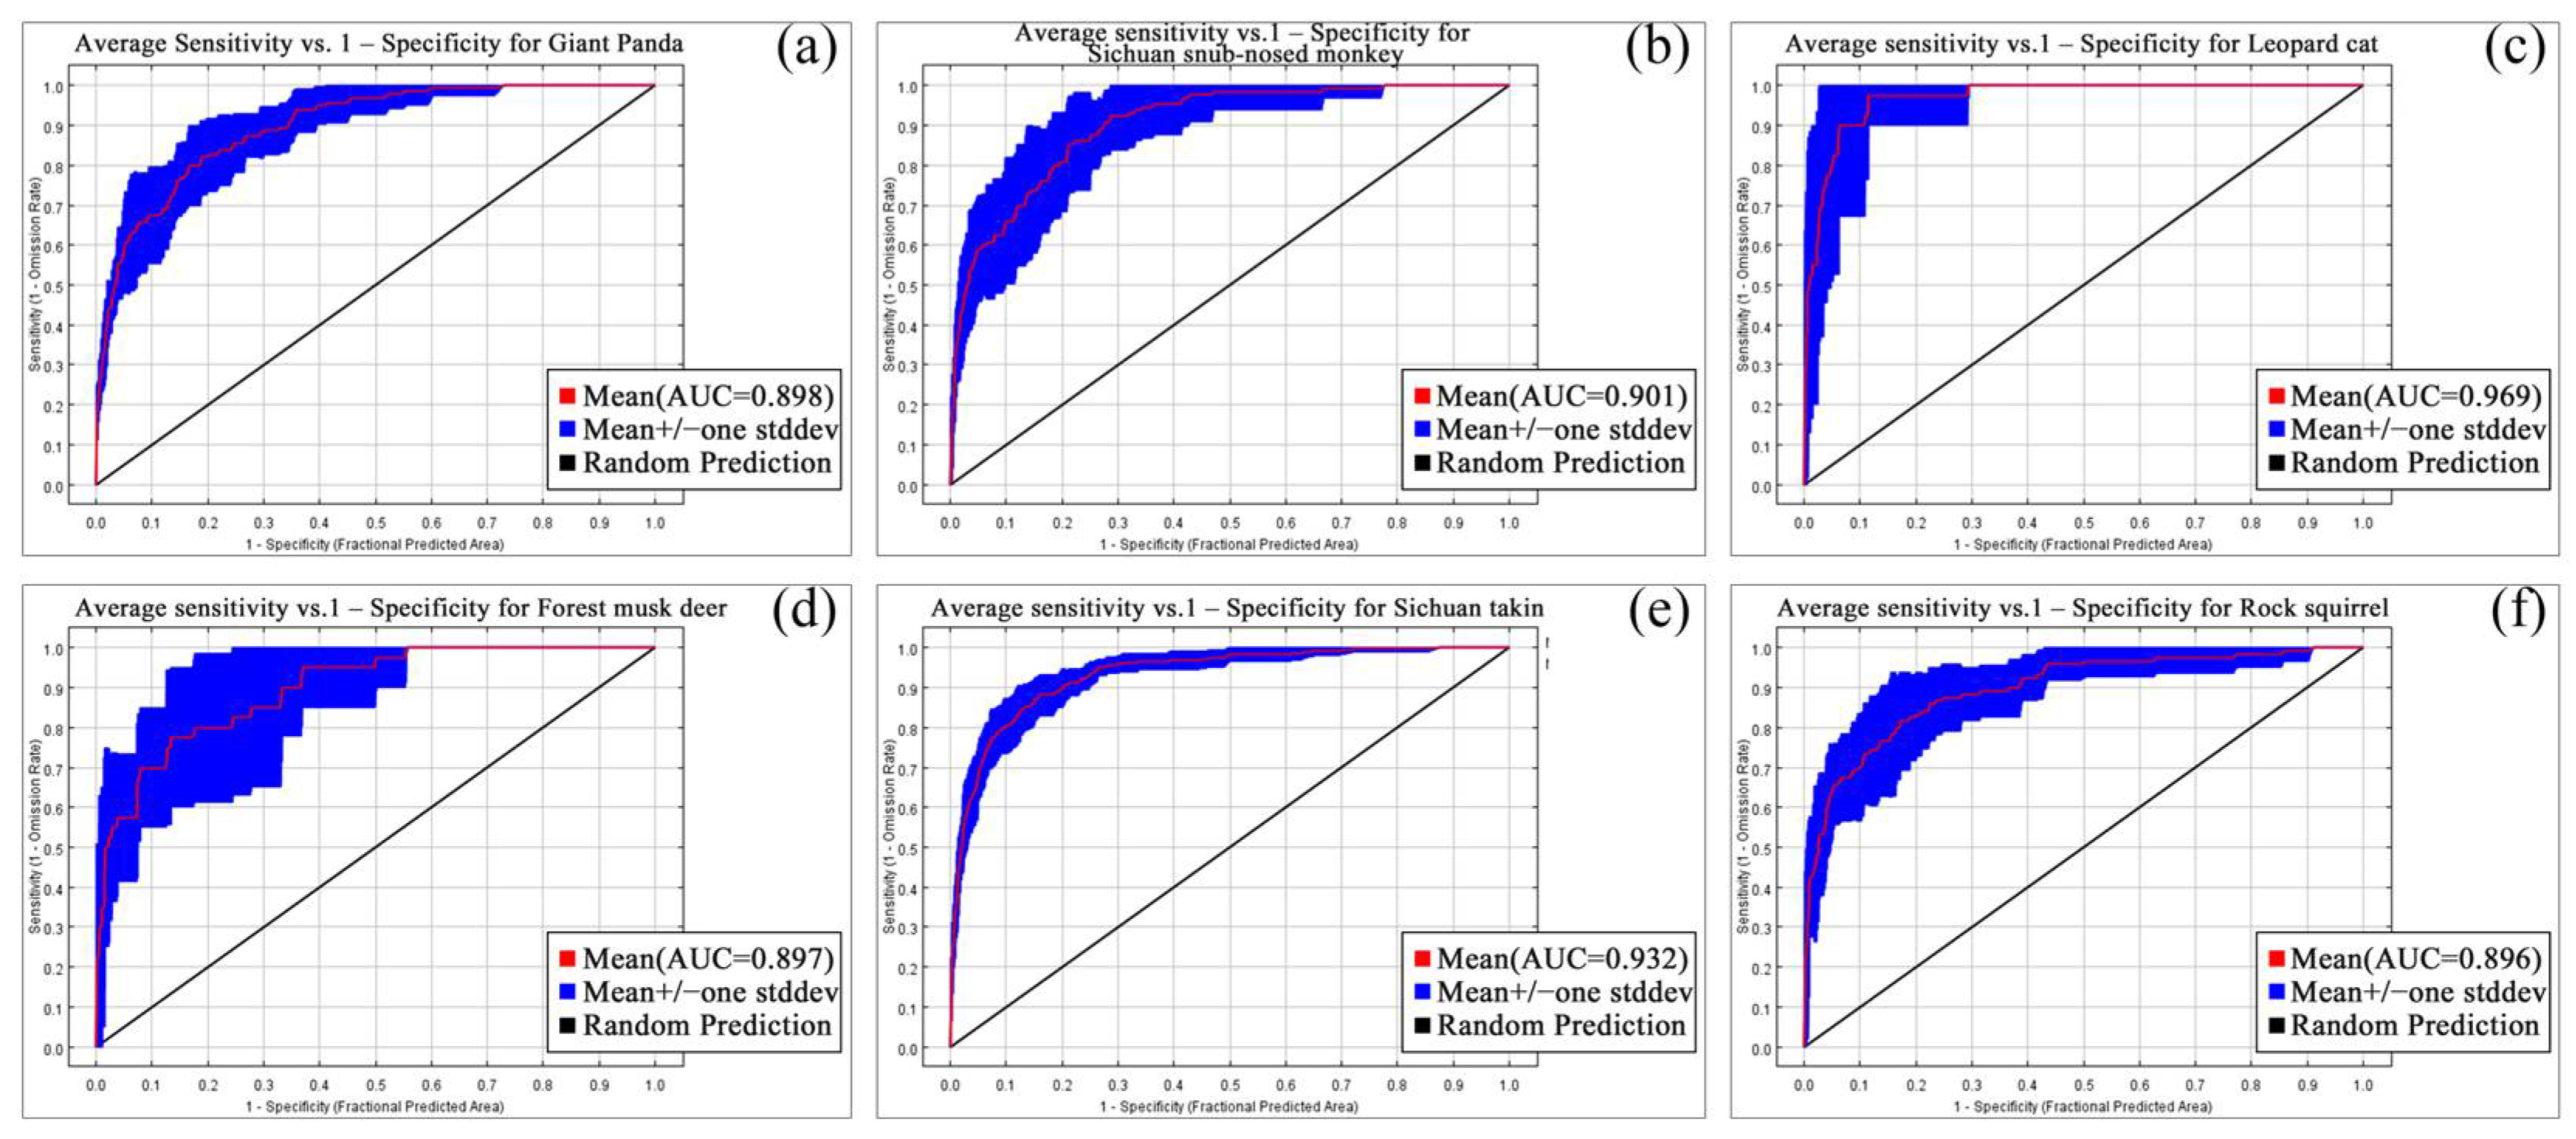
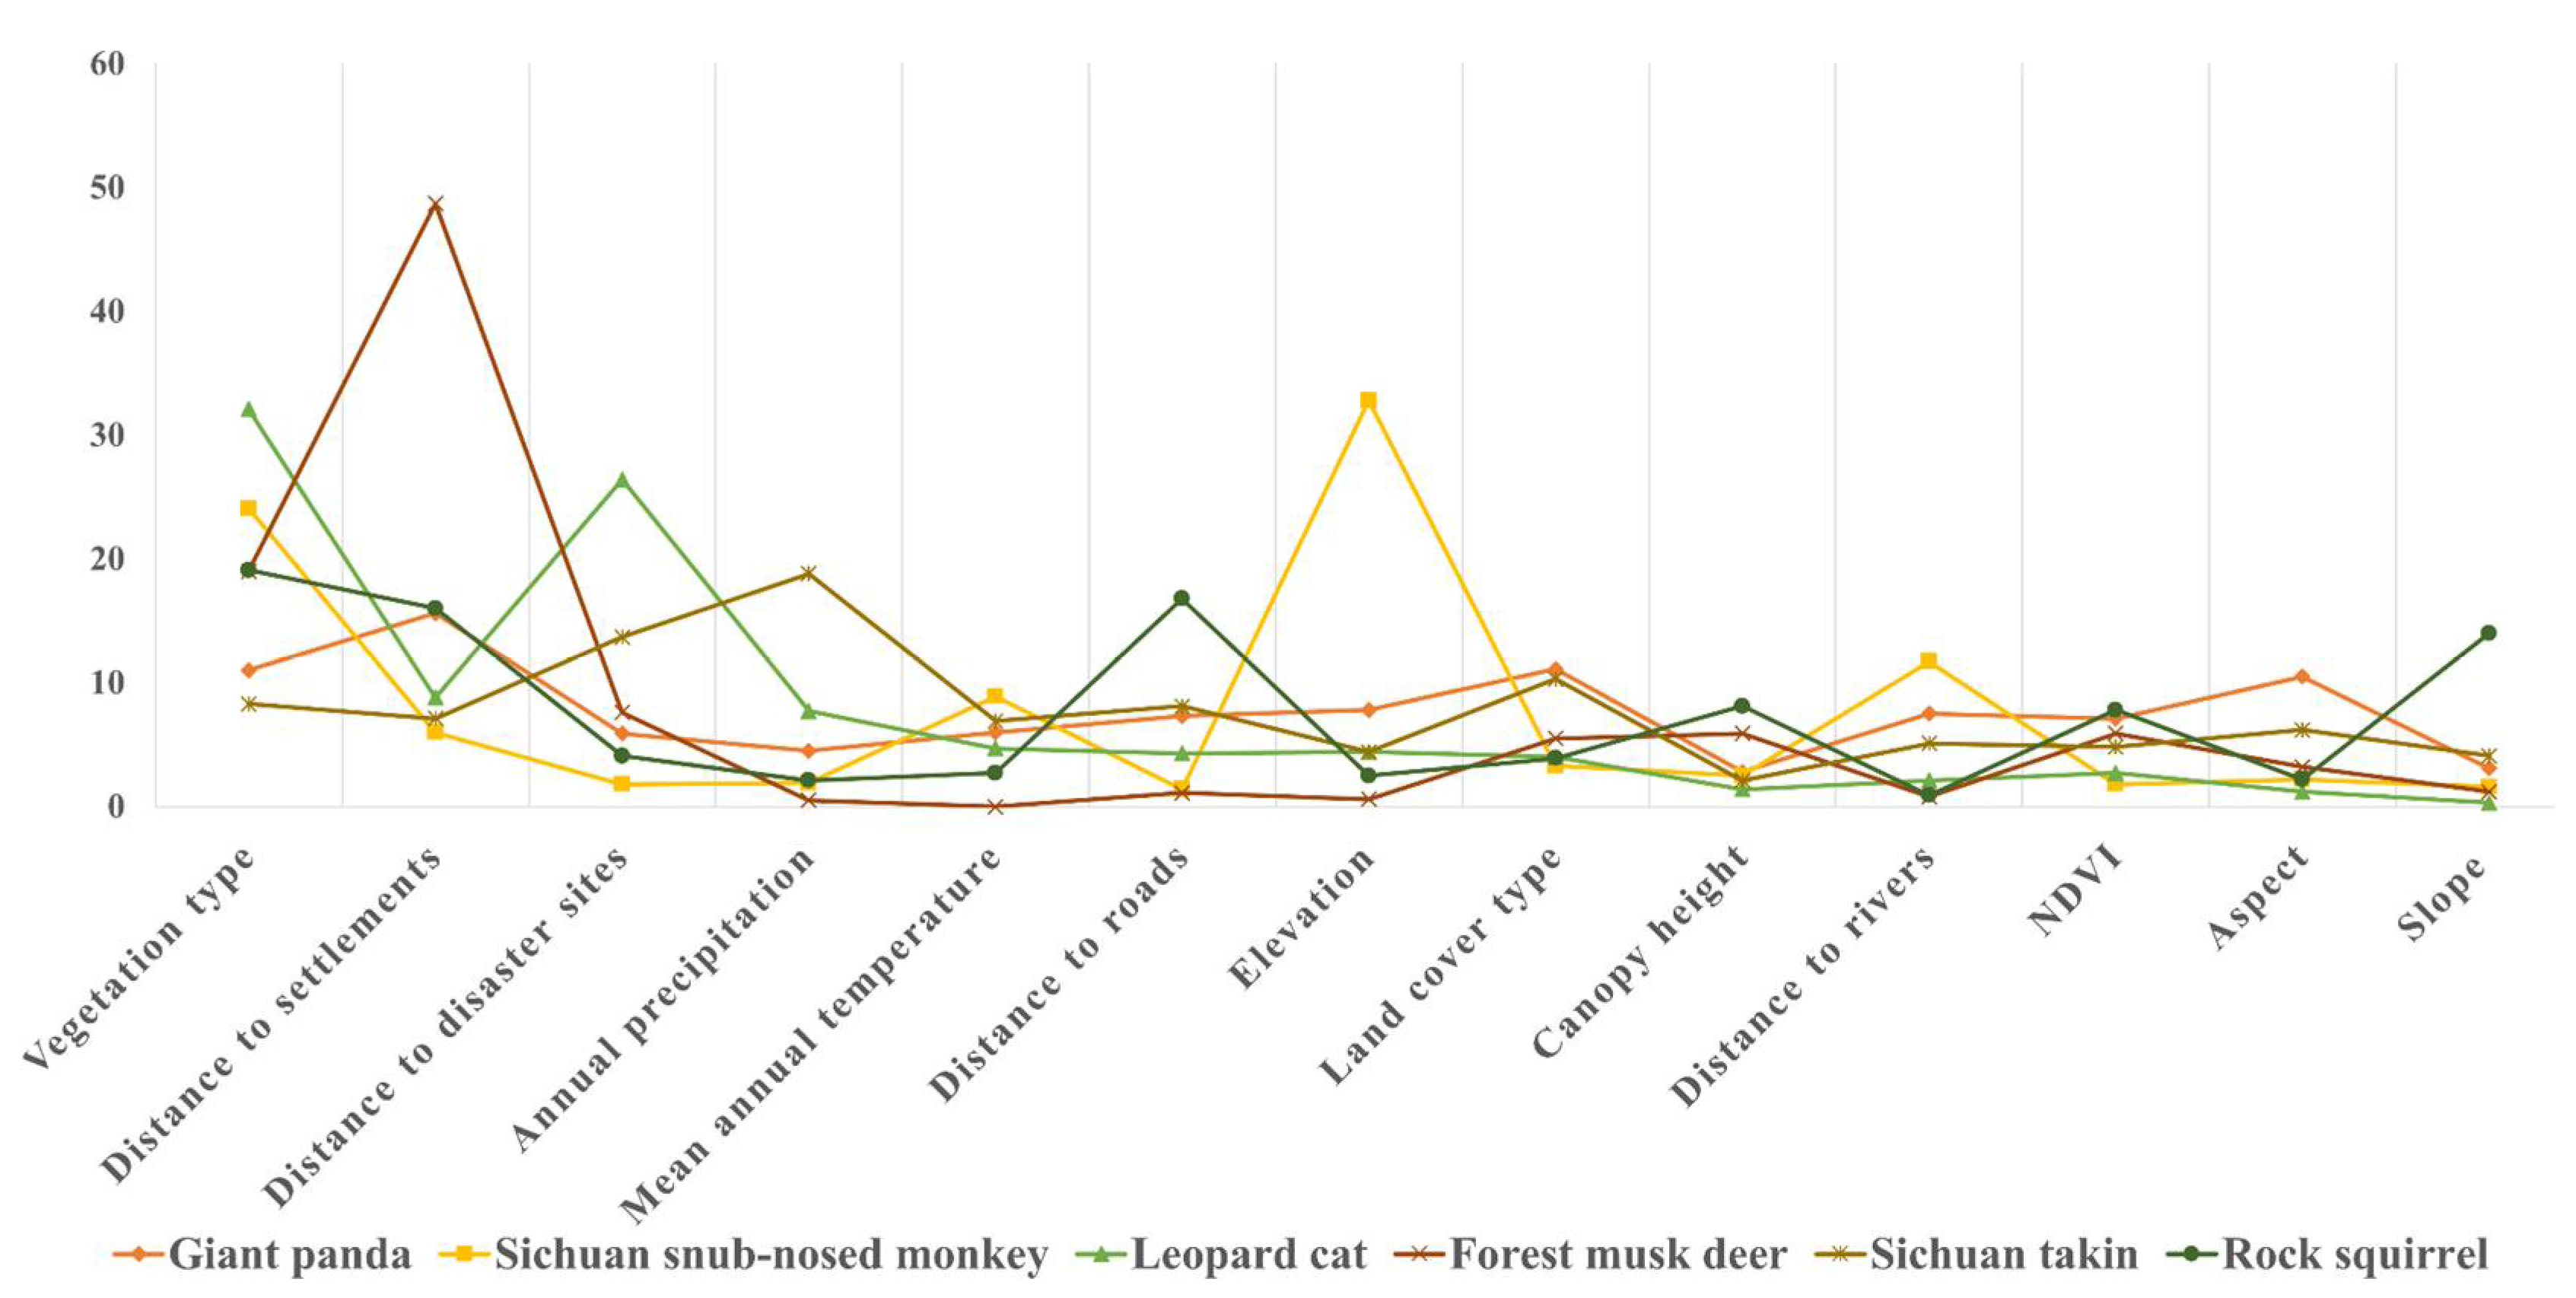
3.1. Habitat Suitability Assessment Based on the Maxent Model

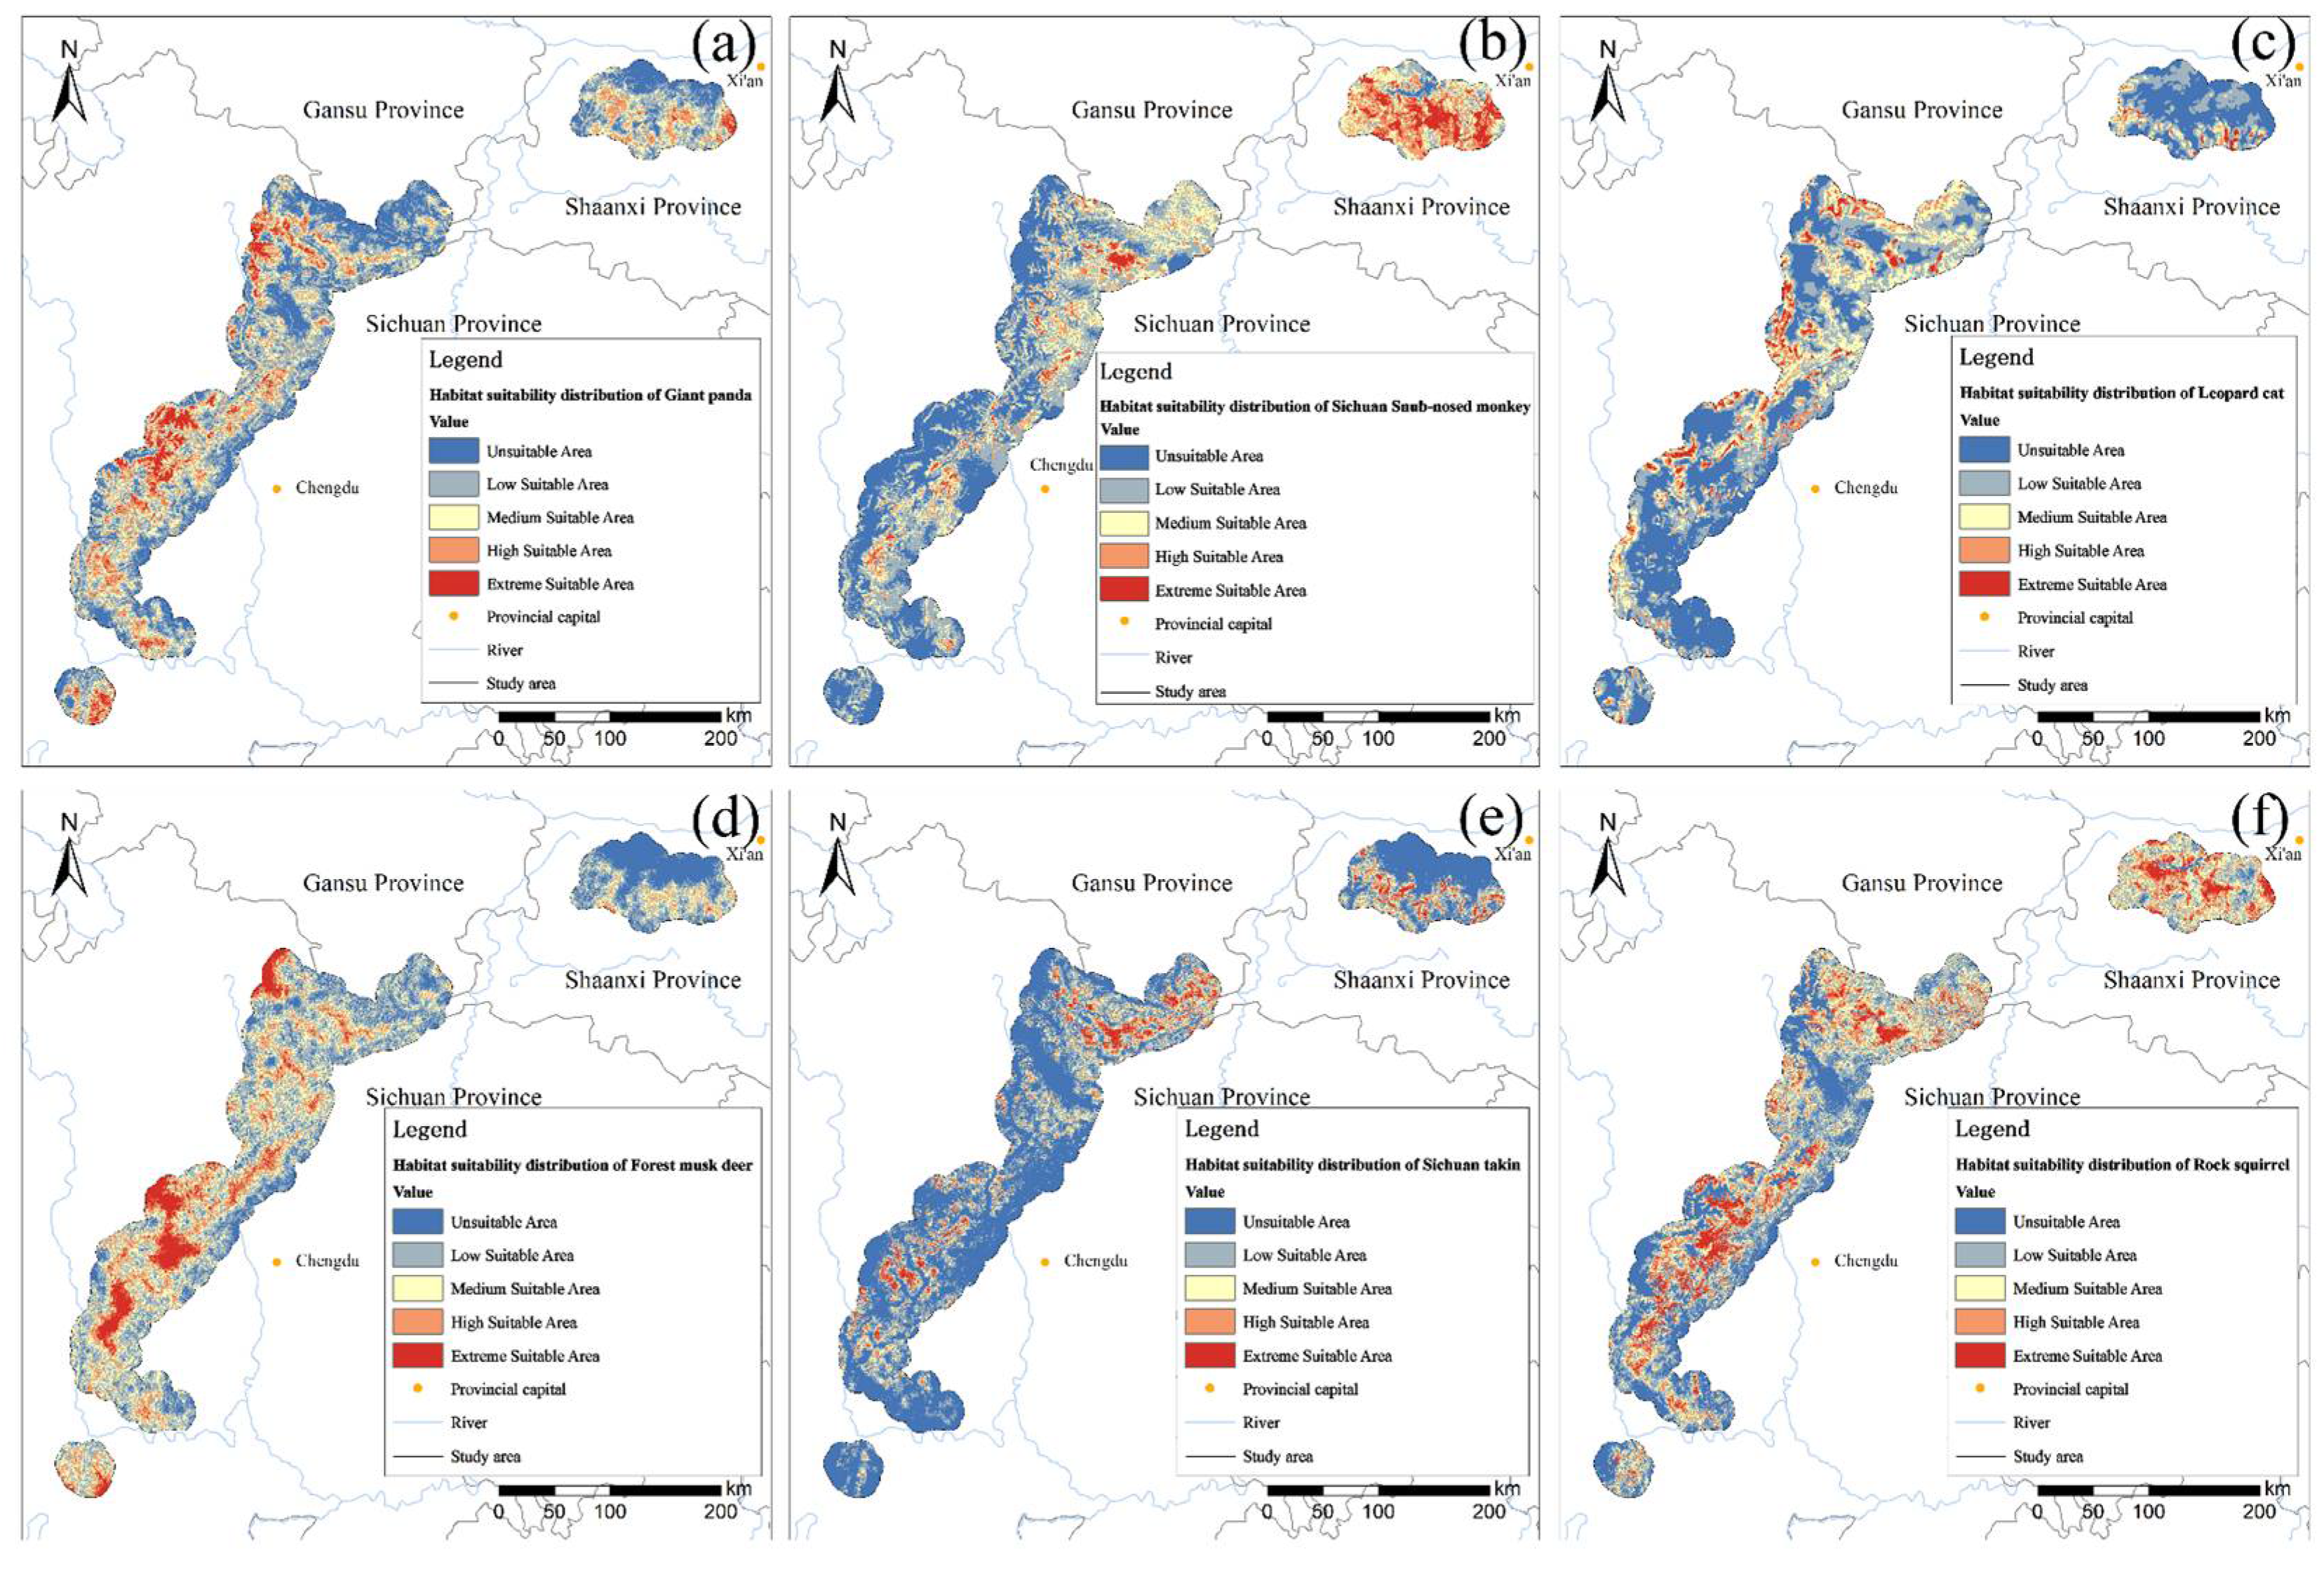
3.1.1. Habitat Suitability Distribution

Based on the results of the habitat suitability evaluation using the Maxent model, the average AUC value across the six species was 0.915 (with values above 0.9 indicating high accuracy), as shown in Figure 8 [26,27]. This demonstrates that the Maxent model reliably predicted suitable habitats, successfully identifying the potential distribution ranges for each species.
Figure 9 shows the spatial distribution of habitat suitability for each target species. The results indicate that suitable habitats for the giant panda are primarily located in the central and western regions of the study area within Sichuan Province, as well as in the northern portion of Shaanxi Province. Suitable areas for the Sichuan snub-nosed monkey are mainly located in the northern part of the study area in Shaanxi, with some distribution in the northern part of Sichuan. The leopard cat exhibits a broader yet more fragmented distribution, extending from Sichuan and Shaanxi into southern Gansu Province. Suitable habitats for the forest musk deer are mainly found in the central and southern parts of the study area in Sichuan, with limited distribution in the mountainous regions of Shaanxi. The Sichuan takin is primarily distributed in the northern part of the study area in Sichuan and the southern mountainous areas of Shaanxi. The rock squirrel’s habitat is relatively widespread, spanning the central mountainous areas of both Shaanxi and Sichuan, and extending into southern Gansu. The scale and proportion of habitat suitability zones for each species are summarized in Table 3.

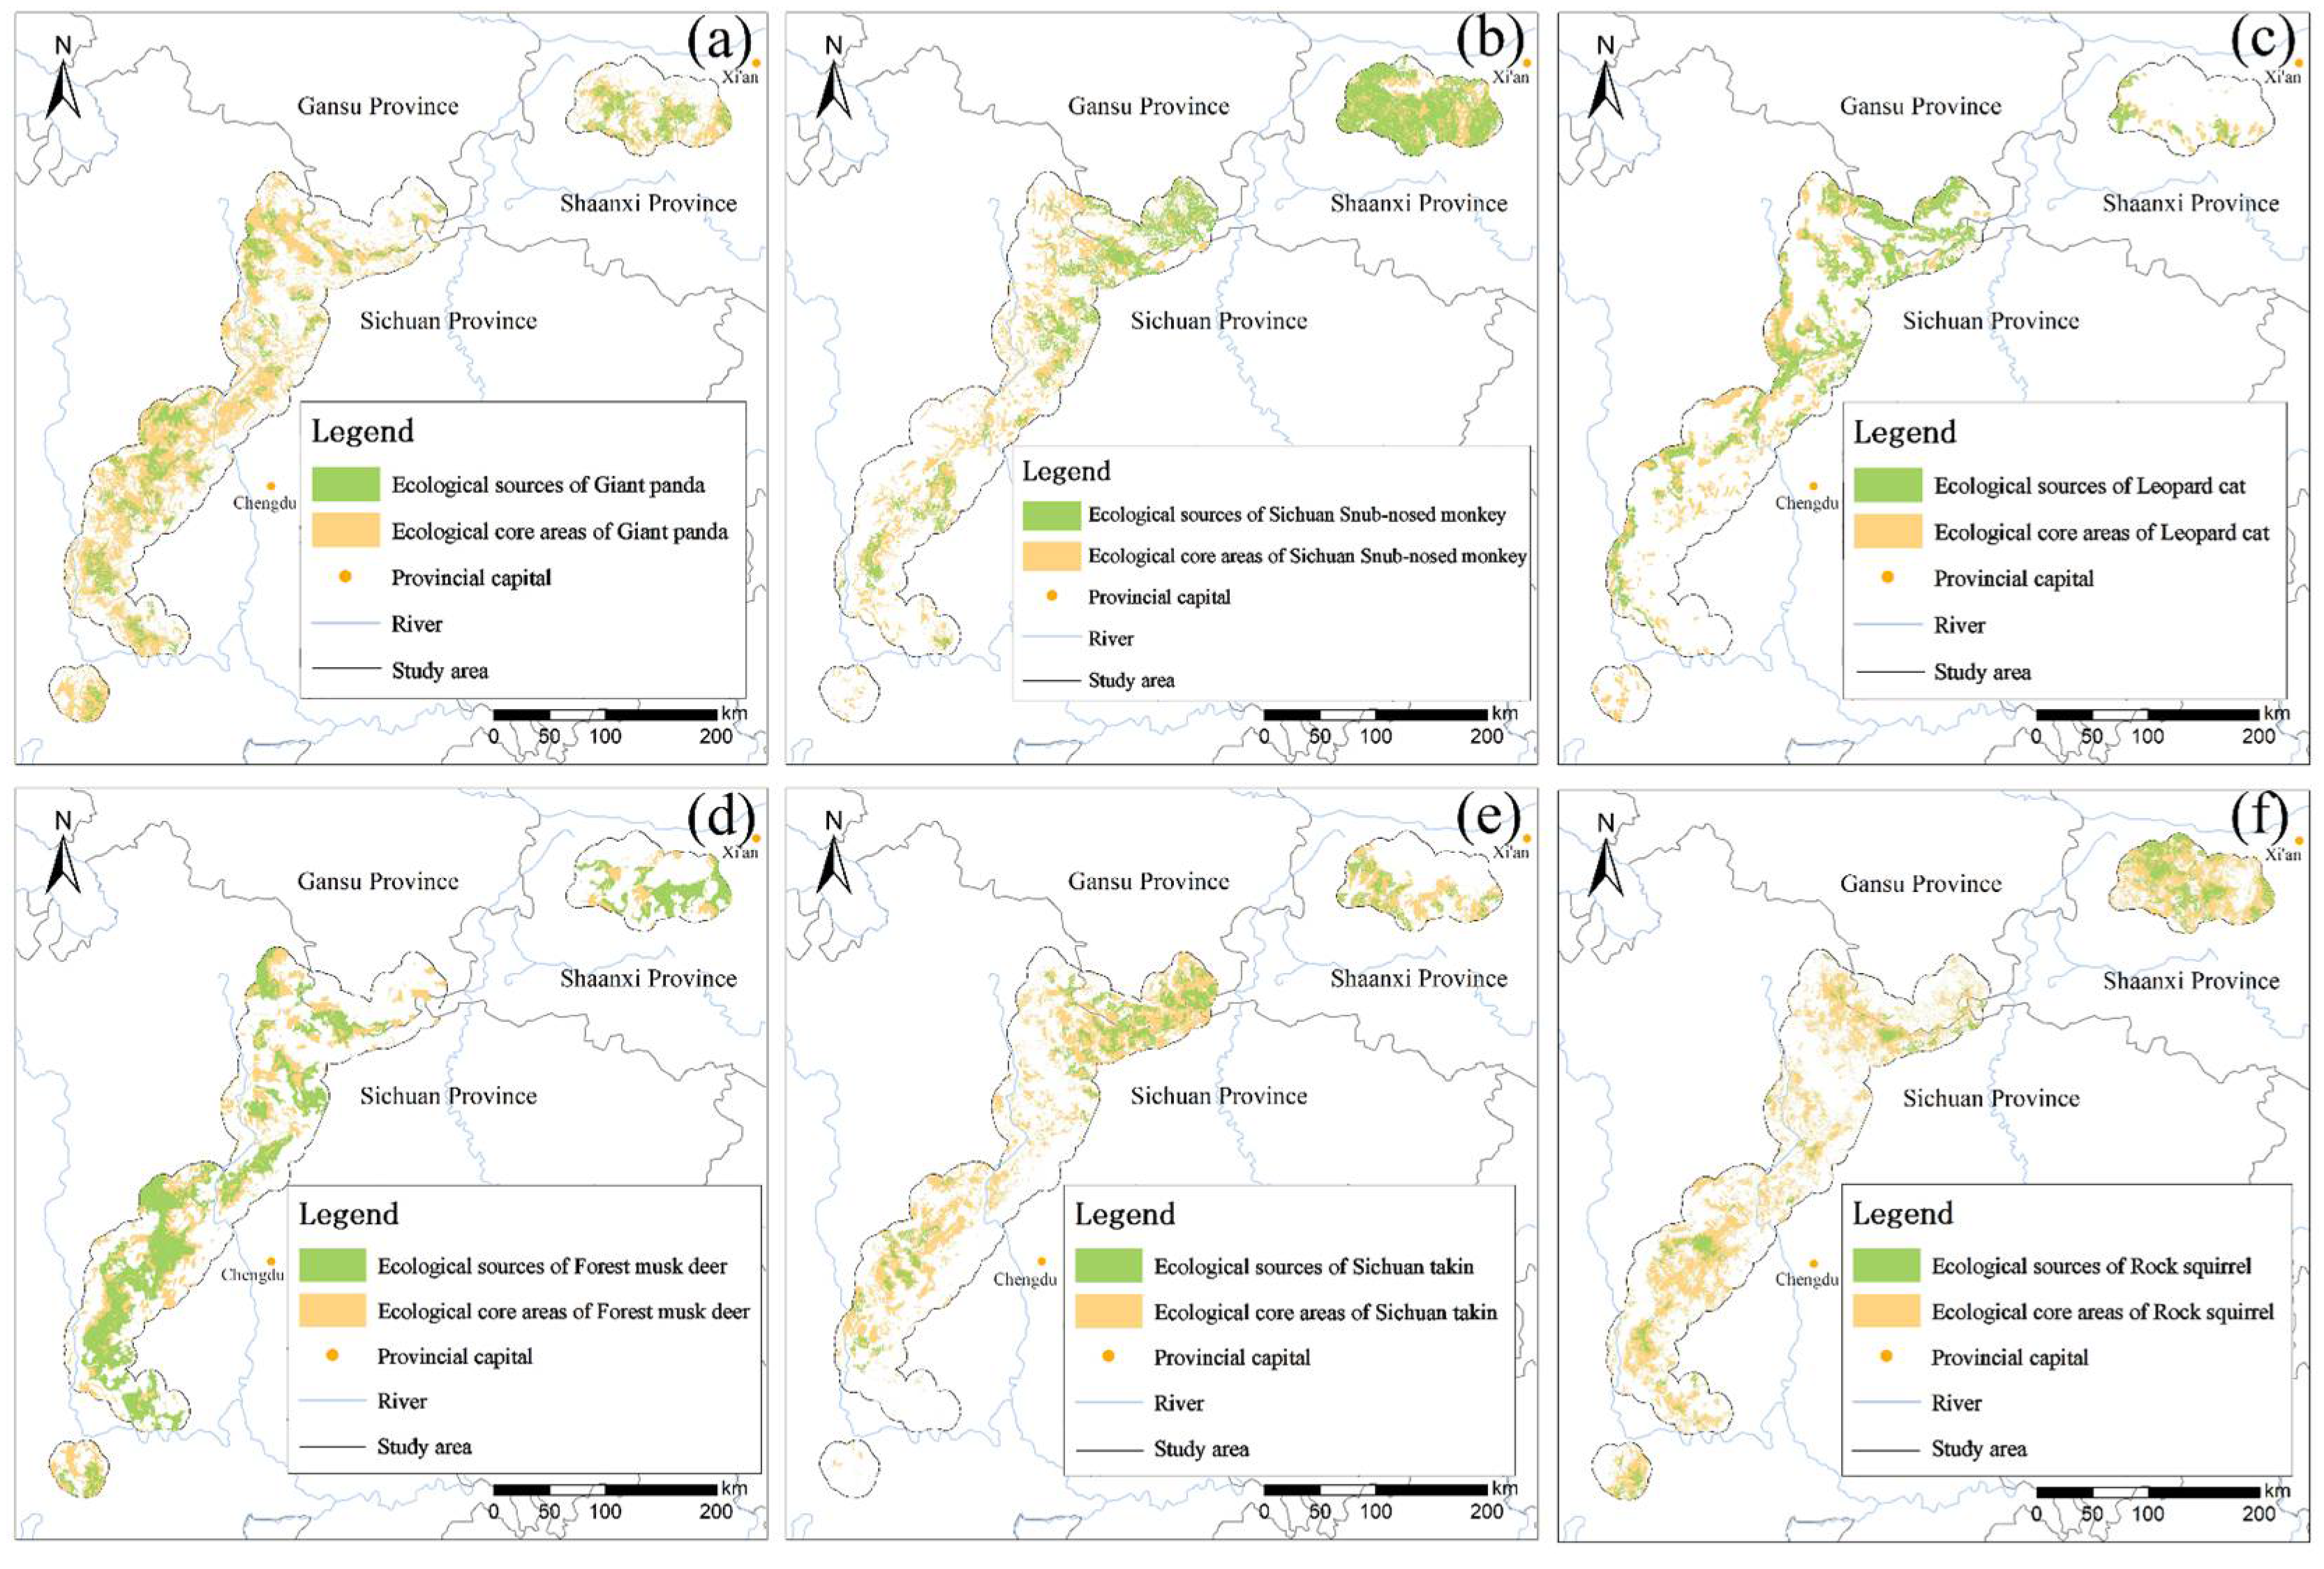
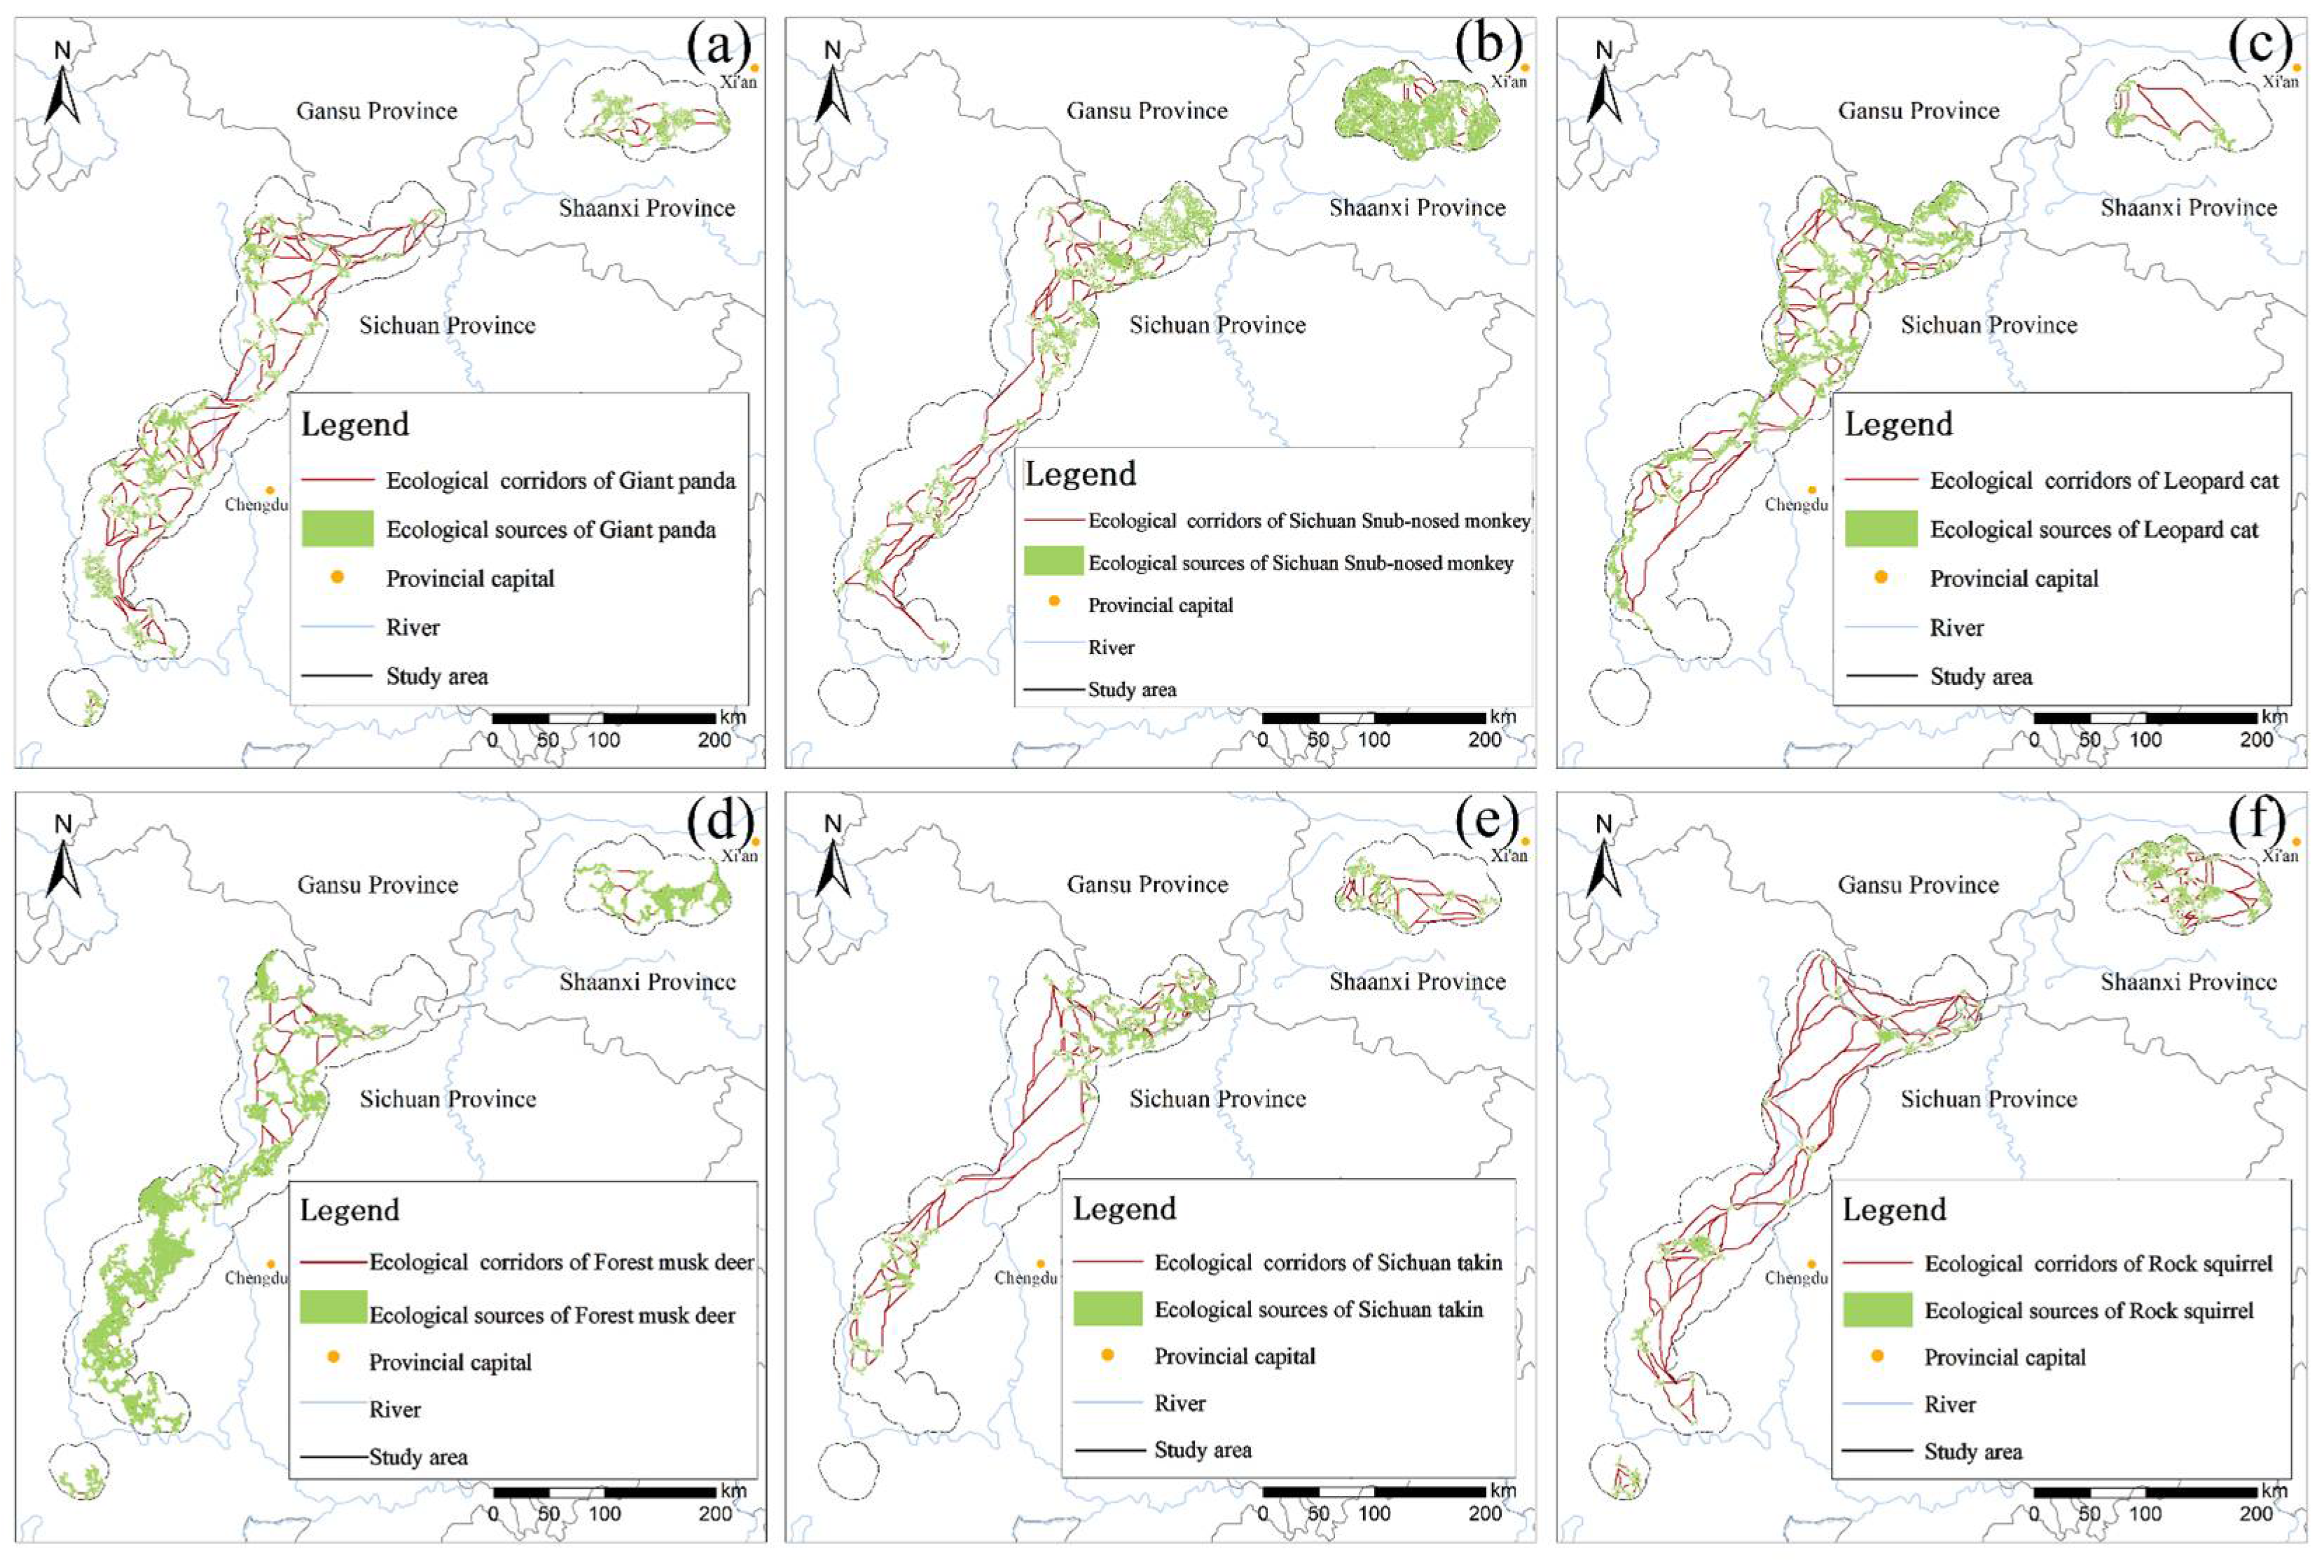
3.1.2. Ecological Source Distribution of Species

Based on the extraction results of ecological source areas for each species in ArcGIS 10.8, the ecological sources of the giant panda are relatively dispersed yet evenly distributed, covering multiple mountain ranges. Table 4 summarizes the number, total area, and proportional coverage of ecological source regions for each species. The ecological sources of the Sichuan snub-nosed monkey are predominantly located in the Minshan region of Shaanxi Province, with a tendency to concentrate at higher latitudes. The ecological sources of the leopard cat are primarily located in the Minshan and Baishuijiang regions, with a slightly higher concentration in the northern part of Sichuan Province. The forest musk deer’s sources are mainly distributed in the central and southern sections of the Qionglai Mountains. The rock squirrel’s ecological sources are highly fragmented and limited in size, with moderate clustering in the central and northern Qinling Mountains. The ecological sources of the Sichuan takin are mainly distributed in the Minshan and Baishuijiang regions, near the border between Sichuan and Gansu Provinces (Figure 10).

3.2. Construction of Wildlife Ecological Corridors Based on Circuit Theory

3.2.1. Integrated Species Resistance Surface Construction

In the standard training gain model [28], a higher score indicates that the environmental variable has greater importance in predicting species distribution and contributes more significantly to the model’s performance. The results demonstrated that the primary environmental factors influencing habitat suitability varied considerably among the six target species, reflecting distinct ecological adaptations. The contribution rates of all environmental variables to the predicted habitat suitability of each species are presented in Figure 11.
The weight values of the top five most influential environmental variables for each species are presented in Table 5. For the giant panda, the most influential variable was distance to settlements, followed by land cover type, vegetation type, aspect, and elevation. This suggests a strong avoidance of human disturbance and a preference for complex mountainous environments far from populated areas. The habitat suitability of the Sichuan snub-nosed monkey was primarily affected by elevation, followed by vegetation type, distance to rivers, distance to settlements, and mean annual temperature, indicating a tendency to inhabit mid- to high-elevation forested areas with abundant vegetation and water availability. For the leopard cat, the most important factor was vegetation type, followed by distance to disaster sites, annual precipitation, distance to settlements, and mean annual temperature, highlighting its dependence on concealed habitats and specific climatic conditions. The forest musk deer showed a similar pattern, with distance to settlements being the dominant factor, followed by vegetation type, distance to disaster sites, canopy height, and vegetation cover, indicating a preference for less disturbed montane mixed-forest environments. The habitat suitability of the Sichuan takin was most influenced by distance to roads, vegetation type, land cover type, distance to disaster sites, and annual precipitation, reflecting its sensitivity to infrastructure and preference for forest–meadow ecotones. For the rock squirrel, vegetation type was again the most influential factor, followed by distance to roads, distance to settlements, slope, and canopy height, indicating its preference for needleleaf–broadleaf mixed forests and environments buffered from human activity.
Based on the top five most influential environmental variables for each species, integrated resistance surface models were constructed accordingly. The results are presented in Figure 12.

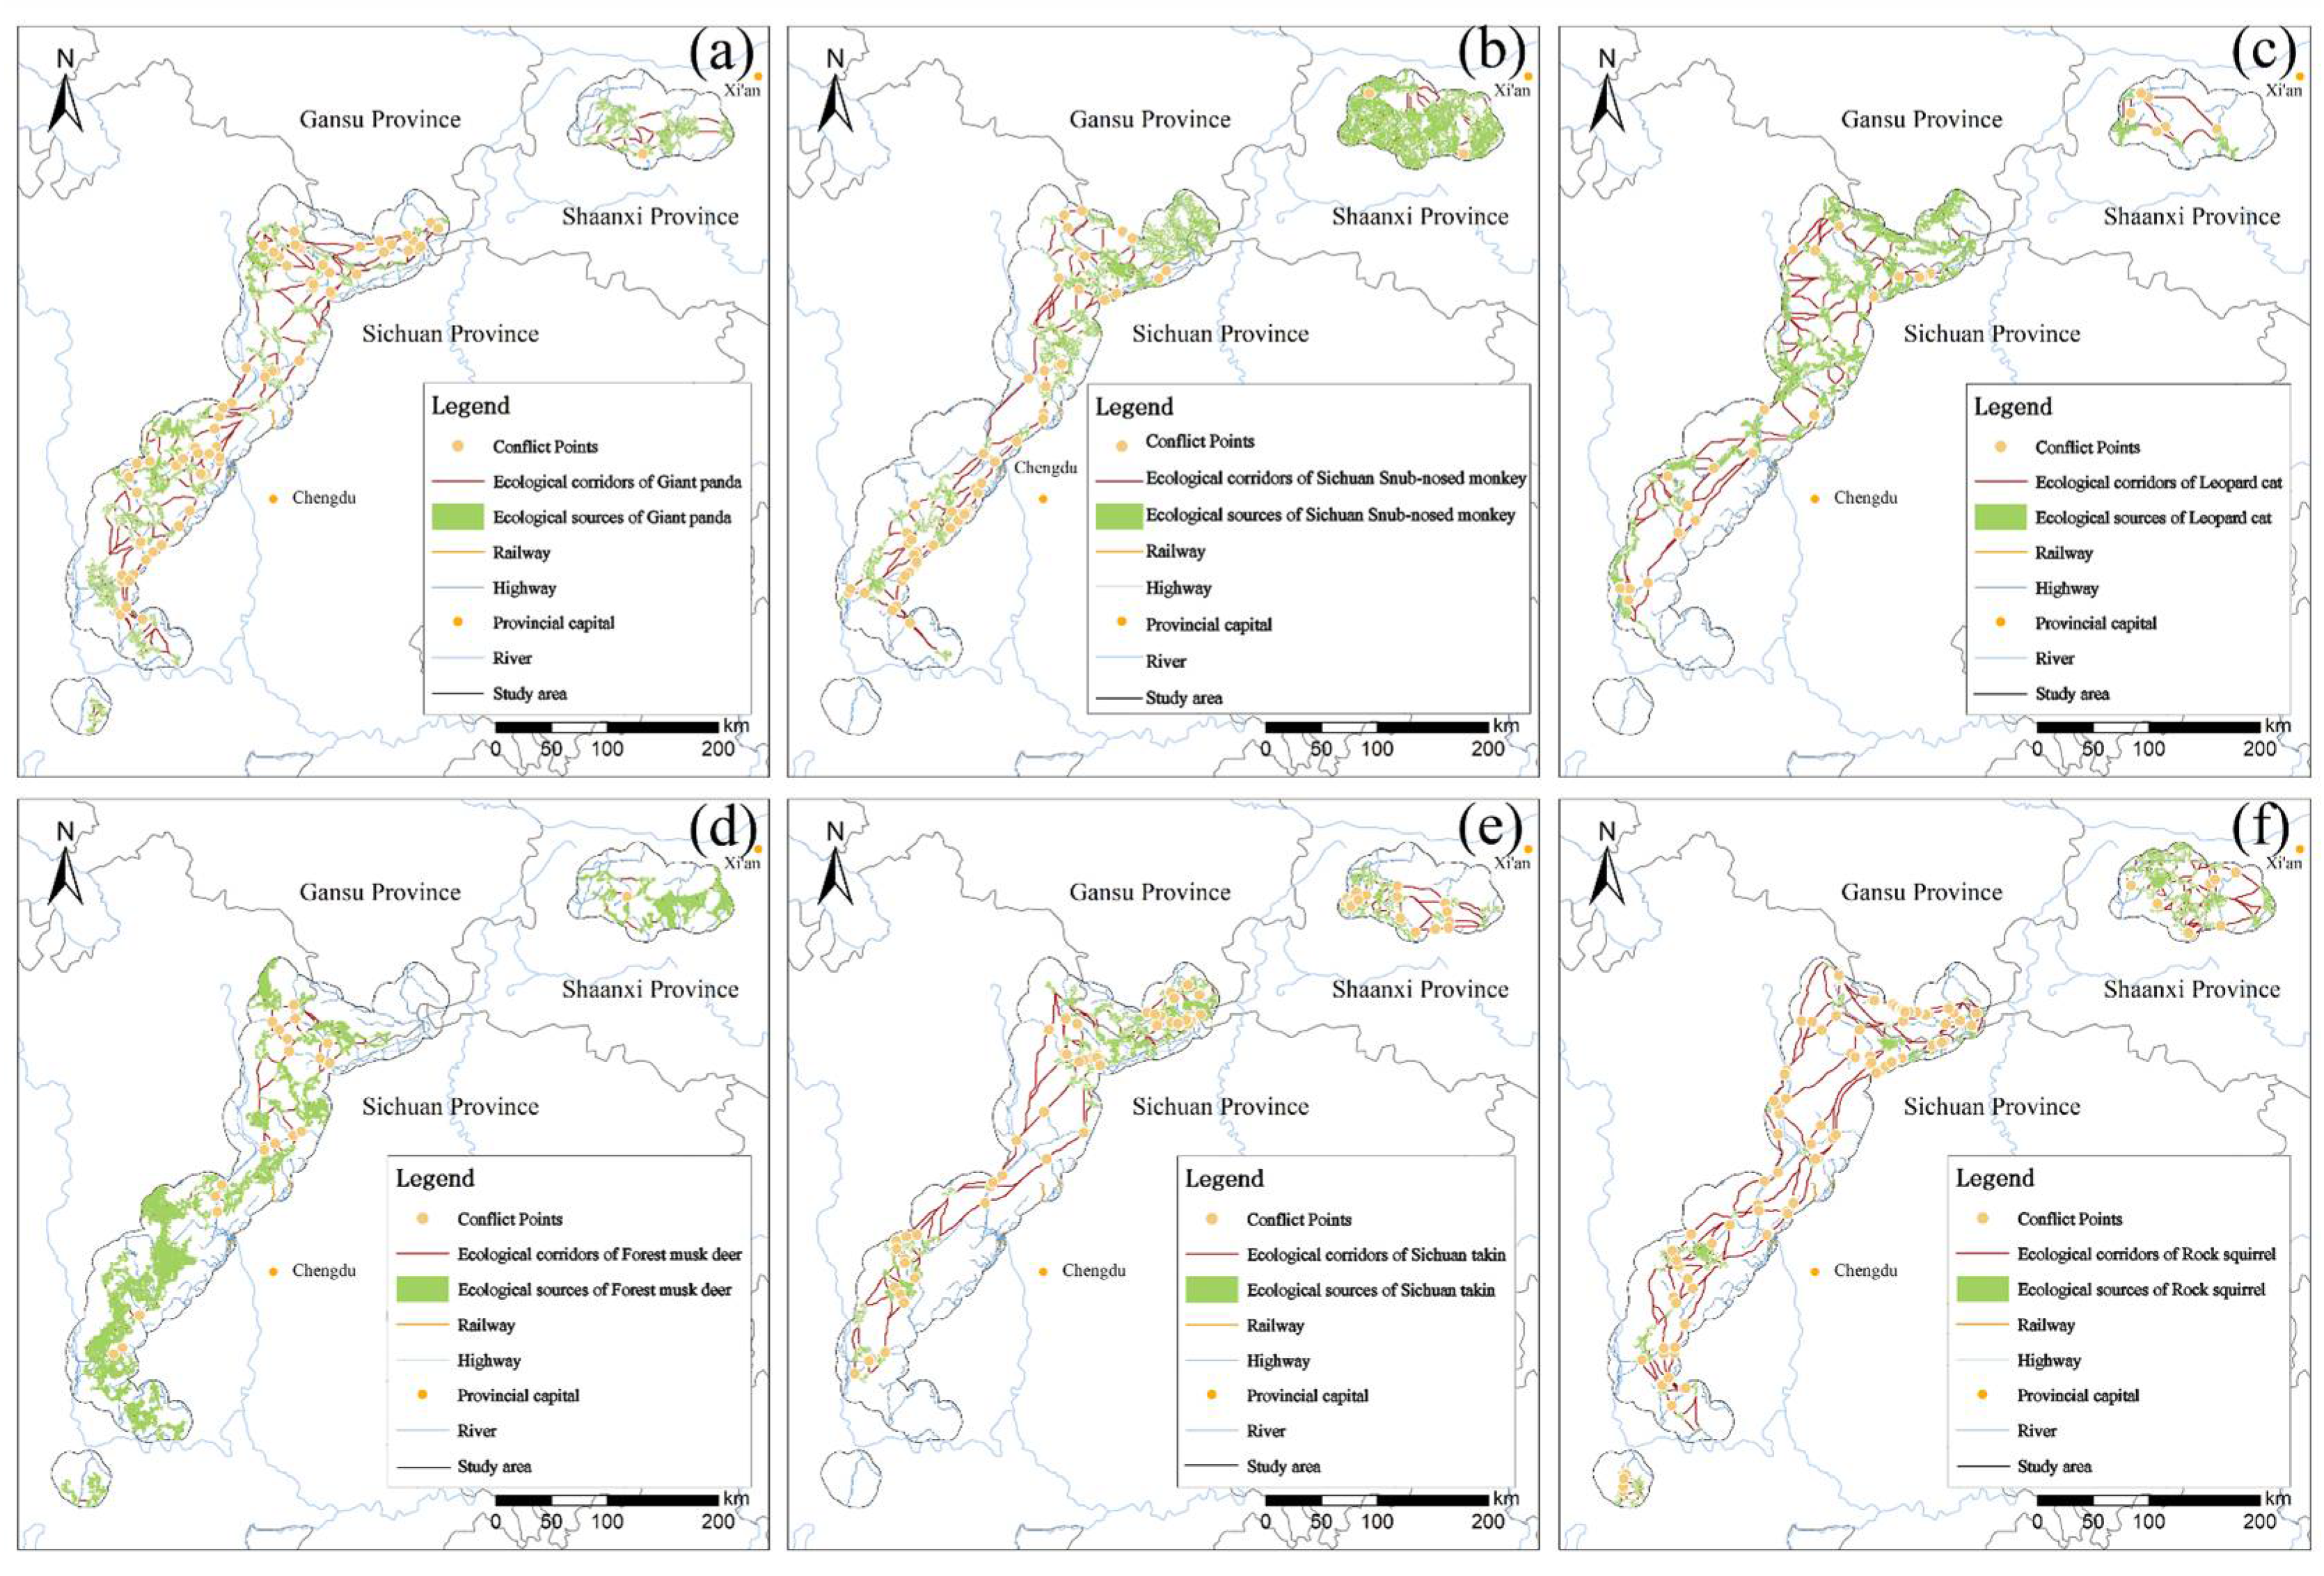
3.2.2. Construction of Species Ecological Corridors and Identification of Ecological Conflict Points

Based on the ecological source areas and integrated resistance surfaces for each species [29,30], ecological corridors were constructed separately using the Linkage Mapper tool. As shown in Figure 13, the results yielded 172 ecological corridors connecting 86 ecological sources for giant pandas; 180 ecological corridors for Sichuan snub-nosed monkeys, connecting 86 ecological sources; 136 ecological corridors for leopard cats, connecting 69 ecological sources; 78 ecological corridors for forest musk deer, connecting 50 ecological sources; 192 ecological corridors for rock squirrels, connecting 90 ecological sources; and 154 ecological corridors for Sichuan takins, connecting 75 ecological sources. 75 ecological source areas.
The intersections of planned railways, highways, provincial highways, and existing railways and roads in the Giant Panda National Park with the ecological corridors of the six species and the ecological sources of each species were designated as ecological conflict points (Figure 14). Finally, we obtained 138 ecological conflict points between giant pandas and roads, 100 ecological conflict points between Sichuan snub-nosed monkeys and roads, 54 ecological conflict points between leopard cats and roads, 37 ecological conflict points between forest musk deer and roads, 205 ecological conflict points between rock squirrels and roads, and 129 ecological conflict points between Sichuan takins and roads.

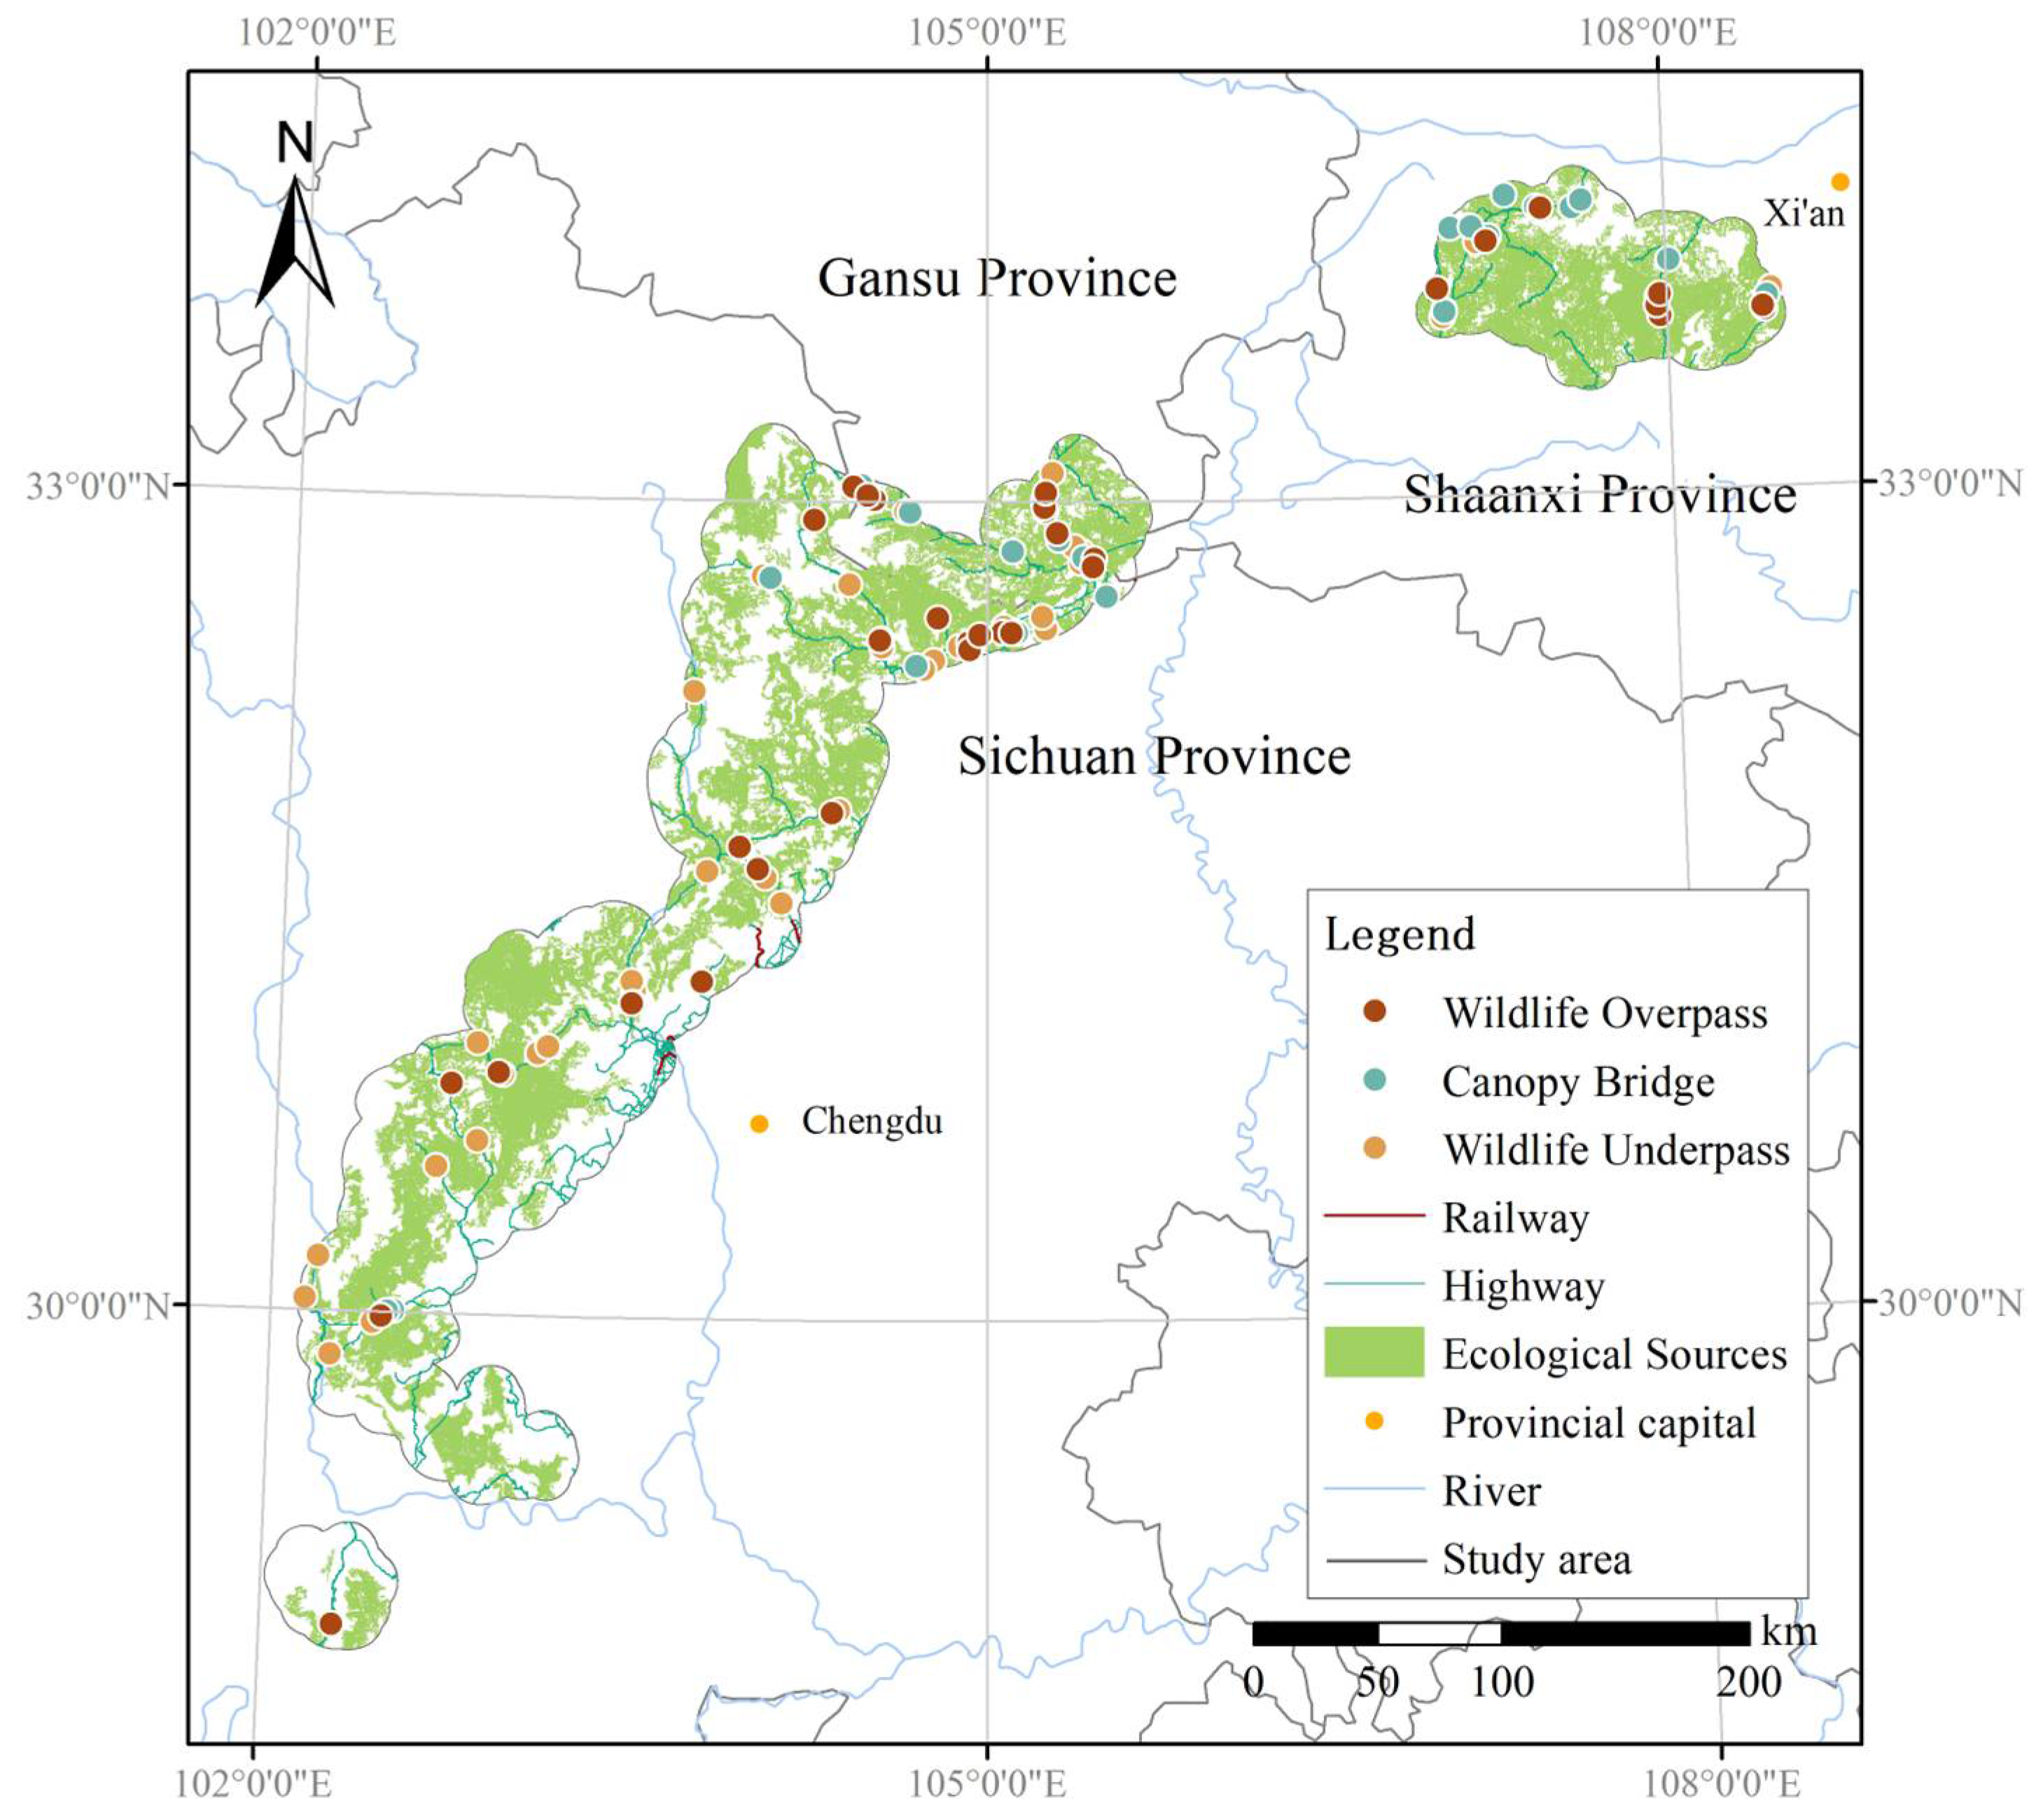
3.3. Site Selection for Multifunctional Wildlife Crossings

The intersections of planned railways, expressways, provincial roads, and existing railways and highways in the Giant Panda National Park with the ecological corridors and ecological sources of six target species were identified as ecological conflict points, and the conflict points of the species involved in the under-penetrating wildlife crossings applicable to non-arboreal wildlife, the canopy wildlife crossings of arboreal wildlife, and the wildlife overpasses of large mammals can be extracted through the two-step screening method, and the conflict point of the wildlife involved in the wildlife crossings can be selected as the construction site location of wildlife crossings.
A 5 km buffer zone was established around each conflict point. The selection of the buffer radius was mainly based on empirical research on the ecological impact range of roads and related infrastructure on mammals. Studies have shown that the negative effects of roads and infrastructure on wildlife are most significant within the 0–5 km range [31]. Therefore, the 5 km buffer provides a reasonable balance and adaptability for different species. Based on this framework, the number of conflict points within each buffer zone was counted. Line graphs were then plotted based on the data of each point, revealing fluctuations that indicate the presence of clustering. Taking the G5 Expressway as an example, the graph shows clustering between points 5 to 17 and points 25 to 33. Peak points 12 and 27 were selected as the preferred locations for wildlife crossings within these clusters. The same method was applied to 30 roads to determine the final set of priority crossing sites. The clustering analysis and site prioritization process along the G5 Expressway is exemplified in Figure 15.
Based on these three types of conflict points, a total of 39 overpasses, 34 underpasses, and 27 canopy bridges were identified as sites for the construction of wildlife crossings (Figure 16).

3.4. Design of Multifunctional Wildlife Crossings

The design and selection of wildlife crossing types are influenced by species-specific ecological traits, topographic conditions, engineering feasibility, and construction costs. This study designs three types of composite wildlife crossings—overpasses, underpasses, and canopy bridges—tailored to species assemblages, with the aim of minimizing movement disruption and population fragmentation while enhancing habitat connectivity. Figure 17 displays the specific locations for each type of wildlife crossing.
Overpasses are primarily designed for large mammals and are applicable to all six target species in this study. The soil above the pass is planted with locally dominant plants, such as alpine rhododendron and fir trees, to simulate the natural environment and provide hiding and foraging sites, while bamboos and shrubs are planted around the fences to reduce the interference, and fallen logs are installed inside the pass to guide the wildlife to traverse the crossing, which is a good solution to meet the crossing needs of various wildlife types, despite the high cost of construction [32]. Although the construction cost is high, it can meet the needs of various types of wildlife.
Underpasses are suitable for species of varying body sizes. In this study, they are mainly designed for four target species: the giant panda, leopard cat, forest musk deer, and Sichuan takin. These structures can be integrated into traffic bridges and culverts, which are low-cost and convenient to set up. The design of the crossings takes into account geological stability and ecological consistency and makes use of natural paths combined with drainage facilities to ensure safe passage in the rainy season. This design also sets up attractive vegetation at the entrances and exits and increases the natural elements in the interior to attract wildlife to use them [33,34], which has cross-border and cross-strait advantages. Other advantages include its large span, small area, and low cost.
Canopy bridges are specifically designed for arboreal species, including the Sichuan snub-nosed monkey and rock squirrel. These structures mimic natural canopy pathways using slings and rattan bridges anchored to stable trees, with bionic materials employed to minimize landscape disturbance. They enable arboreal species to move between canopy layers, reducing their dependence on ground-level travel [35].
Each crossing type offers distinct features that address the specific needs of different species, achieving a balance between ecological conservation and engineering feasibility.

4. Discussion

4.1. Comparative Analysis of Existing Studies

In recent years, the planning and construction of wildlife crossing structures within national parks have become a central topic in ecological conservation research. North America and Europe were early pioneers in this field and have developed relatively mature systems [36]. For instance, Banff National Park in Canada has established 44 wildlife crossing structures—comprising 6 vegetated overpasses and 38 underpasses—along an 82 km section of the Trans-Canada Highway, achieving a corridor density of 0.54 crossings per kilometer [37,38]. These crossings primarily serve large mammals such as grizzly bears, American black bears, and elk, forming one of the most representative road-ecological connectivity systems worldwide. In the western United States and countries like the Netherlands [39], wildlife crossings have been adapted to species size and topography, including multifunctional overpasses and canopy bridges for smaller species, with continuous monitoring to optimize design performance [40].
By contrast, although China entered this field relatively late, it has made significant progress in recent years with the advancement of ecological civilization policies. National-level standards, such as the Technical Specification for Terrestrial Wildlife Corridor Design, have been issued, and key demonstration projects—such as those along the Qinghai–Tibet Railway and the Beijing–Xinjiang Expressway—have been implemented [41]. Nevertheless, most existing practices still focus on single species and rely heavily on underpasses, which are insufficient for ungulates that prefer open environments [42].
There remains substantial room for optimization in terms of corridor density and structural diversity.
This study takes the Giant Panda National Park as the research area and establishes an integrated ecological network of composite wildlife corridors, considering six representative terrestrial mammal species with varied ecological traits. A total of 100 candidate corridors were identified, including 39 vegetated overpasses, 34 underpasses, and 27 canopy bridges, each matched to specific species groups. Although the overall corridor density (0.017 crossings per km) is lower than that of Banff National Park, the study area features greater species diversity, more complex terrain, and a higher degree of ecological fragmentation. Unlike the traditional site-based layout methods used in Banff, this study employed a data-driven approach combining Maxent modeling and Linkage Mapper analysis to identify optimal corridor locations based on resistance surfaces and habitat suitability, offering greater reproducibility and regional adaptability.
The corridor identification process established a complete spatial analysis chain from species distribution modeling and resistance surface construction to least-cost path identification. Compared to expert-based or field-oriented methods, this approach improves methodological transparency and transferability. The proposed method for identifying composite wildlife corridors enhances the scientific basis for corridor design and better addresses the conservation needs of multiple species in complex national park ecosystems, providing a quantitative foundation for future decision-making in corridor planning.

4.2. Policy Recommendations

While China has made significant strides in the design and implementation of wildlife crossings, several critical challenges still hinder their widespread application and long-term effectiveness. To further promote the ecological development of transportation networks within national parks and enhance the effectiveness of wildlife corridors for biodiversity conservation, the following policy recommendations are proposed.
(1) Improve the legal and regulatory framework and standard system.
At present, China lacks a comprehensive legal and regulatory system specifically dedicated to the construction of wildlife crossings. To better facilitate the ecological development of transportation infrastructure in national parks, it is imperative to formulate and refine relevant laws, regulations, and technical standards [43]. These should clearly define key aspects such as design criteria, construction standards, and monitoring and evaluation mechanisms, thereby providing a legal foundation for the scientific planning and effective implementation of wildlife corridors.
(2) Enhance cross-sectoral coordination and collaboration. A routine coordination mechanism should be established among the departments of transportation, ecological environment, forestry, and natural resources. Regular joint meetings should be convened to discuss issues related to ecological protection in transportation projects. During project implementation, these departments should collaborate on construction oversight to minimize ecological damage [44]. Additionally, an efficient information-sharing platform should be developed to facilitate the timely exchange of project updates and ecological monitoring data, enabling early identification and resolution of emerging issues.
(3) Increase financial investment and policy support.
The government should establish a dedicated wildlife crossing construction fund to support the planning, construction, and maintenance of wildlife corridors in national parks. Policies such as tax incentives and financial subsidies should be introduced to encourage private enterprises and social capital to participate in these projects [45]. For companies engaged in ecologically friendly business practices, targeted fiscal support should be provided to stimulate broader societal involvement in the ecological development of transportation networks.
(4) Promote international cooperation and academic exchange.
China should actively participate in activities organized by international wildlife conservation organizations and establish long-term partnerships with countries and regions that have advanced experience in this field. Regular international conferences should be held to explore new technologies and innovative approaches in wildlife corridor construction. Through international collaboration, China can enhance its global influence and voice in this domain, contributing to the advancement of global biodiversity conservation efforts [46,47].

5. Conclusions

As core areas for biodiversity conservation, national parks are increasingly challenged by habitat fragmentation caused by the expansion of transportation networks. This study focused on six terrestrial mammal species within the Giant Panda National Park, analyzing their distribution and behavioral patterns. A total of 13 variables across four categories were selected to construct a comprehensive evaluation framework. The Maxent model was employed to assess habitat suitability for each target species and to identify ecological source areas. Through weighted integration of geographic, biological, and anthropogenic factors, potential dispersal pathways were identified, and a composite ecological corridor network was established.
Building upon the integration of ecological corridors and transportation infrastructure, this study identified ecological conflict zones and proposed multifunctional wildlife crossings benefiting multiple species. A two-step selection method was adopted to determine optimal locations for these crossings, resulting in the design of three types of wildlife crossing structures—overpasses, underpasses, and canopy bridges—tailored to the needs of Giant Panda National Park.
This study contributes both theoretical insights and practical tools for the ecological design of transportation networks. Theoretically, this study enriches the conceptual framework of wildlife crossing design and provides a comprehensive and in-depth theoretical basis. Practically, it offers design solutions for three types of wildlife crossings that mitigate traffic-induced disturbances and enhance biodiversity conservation, setting a reference model for other protected areas and advancing the ecological integration of transportation networks.
Although this study has made significant progress in advancing the ecological integration of transportation networks within national parks, several limitations warrant further improvement.
One notable limitation is that the identification of habitat suitability factors in this study primarily focused on environmental variables for individual species, without fully accounting for interspecific ecological interactions. Future research could benefit from integrating food web or ecological network perspectives to better capture the combined effects of predation, competition, and niche overlap on species distribution.
Moreover, the predictive accuracy of the Maxent model remains limited by the spatial precision and reliability of species occurrence data. To reduce uncertainty and improve model robustness, future studies should consider incorporating higher-quality datasets, such as those derived from remote sensing, infrared camera monitoring, and UAV observations.
In addition, the current process of wildlife crossing design and site selection warrants further refinement. Although this study identified ecological conflict zones based on species distribution patterns, practical implementation should also address terrain complexity, land-use heterogeneity, and socioeconomic constraints. A more adaptive planning framework is recommended—one that integrates factors such as accessibility, human disturbance intensity, and structural safety. Furthermore, the use of a fixed buffer distance in the two-step screening method may oversimplify species-specific behavioral variation. Buffer zones should instead be adjusted based on species’ movement ranges and ecological dependencies, while also considering the coupled effects of topography and anthropogenic activity. Field-based validation will be essential to ensure the ecological functionality and operational feasibility of the proposed strategies.

Author Contributions

Conceptualization, G.Z.; methodology, X.L. and Y.P.; software, X.L., L.W. and J.S.; formal analysis, X.L., J.S. and L.W.; investigation, X.L., J.S. and L.W.; resources, X.L. and G.Z.; data curation, X.L., Y.P. and J.S.; validation, G.Z. and Y.P.; visualization, X.L.; writing—original draft preparation, X.L., J.S. and L.W.; writing—review and editing, G.Z. and Y.P.; supervision, G.Z.; project administration, G.Z.; funding acquisition, G.Z. All authors have read and agreed to the published version of the manuscript.

Funding

This work was supported by the National Natural Science Foundation of China (No. 42471119) and the Hainan Provincial Transportation Technology Project (HNJTT-KXC-2024-2-27-01).

Data Availability Statement

The original contributions presented in the study are included in the article, further inquiries can be directed to the corresponding author.

Acknowledgments

We thank the reviewers for their constructive comments on the original manuscript.

Conflicts of Interest

The authors declare no conflicts of interest.

References

  1. Watson, J.E.; Dudley, N.; Segan, D.B.; Hockings, M. The performance and potential of protected areas. Nature 2014, 515, 67–73. [Google Scholar] [CrossRef]
  2. Tucker, M.A.; Böhning-Gaese, K.; Fagan, W.F.; Fryxell, J.M.; Van Moorter, B.; Alberts, S.C.; Ali, A.H.; Allen, A.M.; Attias, N.; Avgar, T.; et al. Moving in the Anthropocene: Global reductions in terrestrial mammalian movements. Science 2018, 359, 466–469. [Google Scholar] [CrossRef] [PubMed]
  3. Haddad, N.M.; Brudvig, L.A.; Clobert, J.; Davies, K.F.; Gonzalez, A.; Holt, R.D.; Lovejoy, T.E.; Sexton, J.O.; Austin, M.P.; Collins, C.D.; et al. Habitat fragmentation and its lasting impact on Earth′s ecosystems. Sci. Adv. 2015, 1, e1500052. [Google Scholar] [CrossRef]
  4. Dickson, B.G.; Albano, C.M.; Anantharaman, R.; Beier, P.; Fargione, J.; Graves, T.A.; Gray, M.E.; Hall, K.R.; Lawler, J.J.; Leonard, P.B.; et al. Circuit-theory applications to connectivity science and conservation. Conserv. Biol. 2019, 33, 239–249. [Google Scholar] [CrossRef] [PubMed]
  5. Phillips, S.J.; Anderson, R.P.; Dudík, M.; Schapire, R.E.; Blair, M.E. Opening the black box: An open-source release of Maxent. Ecography 2017, 40, 887–893. [Google Scholar] [CrossRef]
  6. LaPoint, S.; Balkenhol, N.; Hale, J.; Sadler, J.; van der Ree, R. Ecological connectivity research in urban areas. Funct. Ecol. 2015, 29, 868–878. [Google Scholar] [CrossRef]
  7. Hughes, A.C. Understanding and minimizing environmental impacts of the Belt and Road Initiative. Conserv. Biol. 2019, 33, 883–894. [Google Scholar] [CrossRef]
  8. Das, T.K. Road ecology: Science and solutions by Richard T. T. Forman, Daniel Sperling, John A. Bissonette, Anthony P. Clevenger, Carol D. Cutshall, Virginia H. Dale, Lenore Fahrig, Robert France, Charles R. Goldman, Kevin Heanue, Julia A. Jones, Frederick J. Swanson, Thomas Turrentine, and Thomas C. Winter Island Press Covelo, WA, and London, UK (2002) 481 pages ISBN 1-55963-932-6 (cloth) U.S. List Price: $55.00 ISBN 1-55963-933-4 (paper) U.S. List Price: $27.50. Environ. Prog. 2003, 22, O16. [Google Scholar]
  9. Forman, R.; Alexander, L.E. Roads and their major ecological effects. Annu. Rev. Ecol. Syst. 1998, 29, 207–231. [Google Scholar] [CrossRef]
  10. Glista, D.J.; DeVault, T.L.; DeWoody, J.A. A review of mitigation measures for reducing wildlife mortality on roadways. Landsc. Urban Plan. 2009, 91, 1–7. [Google Scholar] [CrossRef]
  11. Soanes, K.; Taylor, A.C.; Sunnucks, P.; Vesk, P.A.; Cesarini, S.; van der Ree, R. Evaluating the success of wildlife crossing structures using genetic approaches and an experimental design: Lessons from a gliding mammal. J. Appl. Ecol. 2018, 55, 129–138. [Google Scholar] [CrossRef]
  12. Steenweg, R.; Hebblewhite, M.; Kays, R.; Ahumada, J.; Fisher, J.T.; Burton, C.; Townsend, S.E.; Carbone, C.; Rowcliffe, J.M.; Whittington, J.; et al. Scaling-up camera traps: Monitoring the planet′s biodiversity with networks of remote sensors. Front. Ecol. Environ. 2017, 15, 26–34. [Google Scholar] [CrossRef]
  13. Ascensão, F.; Fahrig, L.; Clevenger, A.P.; Corlett, R.T.; Jaeger, J.A.; Laurance, W.F.; Pereira, H.M. Environmental challenges for the Belt and Road Initiative. Nat. Sustain. 2018, 1, 206–209. [Google Scholar] [CrossRef]
  14. Zeller, K.A.; McGarigal, K.; Whiteley, A.R. Estimating landscape resistance to movement: A review. Landsc. Ecol. 2012, 27, 777–797. [Google Scholar] [CrossRef]
  15. Beier, P.; Noss, R.F. Do Habitat Corridors Provide Connectivity? Conserv. Biol. 1998, 12, 1241–1252. [Google Scholar] [CrossRef]
  16. Shen, W.; Kang, Y.; Zhang, X.; Liu, Y.; Zhou, X.; Li, J. Spatio-temporal variation of vegetaton and its topographic diferentiation in the Sichuan area of Giant Panda National Park. Acta Ecol. Sin. 2024, 44, 9081–9093. [Google Scholar]
  17. Liu, X.; Su, Y.; Hu, T.; Yang, Q.; Liu, B.; Deng, Y.; Tang, H.; Tang, Z.; Fang, J.; Guo, Q. Neural network guided interpolation for mapping canopy height of China′s forests by integrating GEDI and ICE-Sat-2 data. Remote Sens. Environ. 2022, 269, 112844. [Google Scholar] [CrossRef]
  18. Phillips, S.J.; Anderson, R.P.; Schapire, R.E. Maximum entropy modeling of species geographic distributions. Ecol. Model. 2006, 190, 231–259. [Google Scholar] [CrossRef]
  19. Elith, J.; Phillips, S.J.; Hastie, T.; Dudík, M.; Chee, Y.E.; Yates, C.J. A statistical explanation of MaxEnt for ecologists. Divers. Distrib. 2011, 17, 43–57. [Google Scholar] [CrossRef]
  20. McRae, B.H.; Beier, P. Circuit theory predicts gene flow in plant and animal populations. Proc. Natl. Acad. Sci. USA 2007, 104, 19885–19890. [Google Scholar] [CrossRef]
  21. Peterman, W.E. ResistanceGA: An R package for the optimization of resistance surfaces using genetic algorithms. Methods Ecol. Evol. 2018, 9, 1638–1647. [Google Scholar] [CrossRef]
  22. Naimi, B.; Araújo, M.B. sdm: A reproducible and extensible R platform for species distribution modelling. Ecography 2016, 39, 368–375. [Google Scholar] [CrossRef]
  23. Torres, A.; Jaeger, J.A.G.; Alonso, J.C. Assessing large-scale wildlife responses to human infrastructure development. Proc. Natl. Acad. Sci. USA 2016, 113, 8472–8477. [Google Scholar] [CrossRef] [PubMed]
  24. Gueta, T.; Carmel, Y. Quantifying the value of user-level data cleaning for big data: A case study using mammal distribution models. Ecol. Inform. 2016, 34, 139–145. [Google Scholar] [CrossRef]
  25. Koen, E.L.; Garroway, C.J.; Wilson, P.J.; Bowman, J. The Effect of Map Boundary on Estimates of Landscape Resistance to Animal Movement. PLoS ONE 2010, 5, e11785. [Google Scholar] [CrossRef]
  26. Shcheglovitova, M.; Anderson, R.P. Estimating optimal complexity for ecological niche models: A jackknife approach for species with small sample sizes. Ecol. Model. 2013, 269, 9–17. [Google Scholar] [CrossRef]
  27. Wisz, M.S.; Hijmans, R.J.; Li, J.; Peterson, A.T.; Graham, C.H.; Guisan, A. Effects of sample size on the performance of species distribution models. Divers. Distrib. 2008, 14, 763–773. [Google Scholar] [CrossRef]
  28. Adriaensen, F.; Chardon, J.P.; De Blust, G.; Swinnen, E.; Villalba, S.; Gulinck, H.; Matthysen, E. The application of ‘least-cost’ modelling as a functional landscape model. Landsc. Urban Plan. 2003, 64, 233–247. [Google Scholar] [CrossRef]
  29. Rayfield, B.; Fortin, M.; Fall, A. Connectivity for conservation: A framework to classify network measures. Ecology 2011, 92, 847–858. [Google Scholar] [CrossRef]
  30. Pinto, N.; Keitt, T.H. Beyond the least-cost path: Evaluating corridor redundancy using a graph-theoretic approach. Landsc. Ecol. 2009, 24, 253–266. [Google Scholar] [CrossRef]
  31. Benítez-López, A.; Alkemade, R.; Verweij, P.A. The impacts of roads and other infrastructure on mammal and bird populations: A meta-analysis. Biol. Conserv. 2010, 143, 1307–1316. [Google Scholar] [CrossRef]
  32. Mata, C.; Hervás, I.; Herranz, J.; Suárez, F.; Malo, J.E. Are motorway wildlife passages worth building? Vertebrate use of road-crossing structures on a Spanish motorway. J. Environ. Manag. 2008, 88, 407–415. [Google Scholar] [CrossRef] [PubMed]
  33. Lesbarrères, D.; Fahrig, L. Measures to reduce population fragmentation by roads: What has worked and how do we know? Trends Ecol. Evol. 2012, 27, 374–380. [Google Scholar] [CrossRef] [PubMed]
  34. Bissonette, J.A.; Cramer, P.C. Evaluation of the Use and Effectiveness of Wildlife Crossings; The National Academies Press: Washington, DC, USA, 2008; p. 161. [Google Scholar]
  35. Teixeira, F.Z.; Coelho, A.V.; Esperandio, I.B.; Kindel, A. Vertebrate road mortality estimates: Effects of sampling methods and carcass removal. Biol. Conserv. 2013, 157, 317–323. [Google Scholar] [CrossRef]
  36. Bissonette, J.A.; Adair, W. Restoring habitat permeability to roaded landscapes with isometrically-scaled wildlife crossings. Biol. Conserv. 2008, 141, 482–488. [Google Scholar] [CrossRef]
  37. Stewart, L.; Russell, B.; Zelig, E.; Patel, G.; Whitney, K.S. Wildlife Crossing Design Influences Effectiveness for Small and Large Mammals in Banff National Park. Case Stud. Environ. 2020, 4, 1231752. [Google Scholar] [CrossRef]
  38. Clevenger, A.P.; Chruszcz, B.; Gunson, K.E. Highway mitigation fencing reduces wildlife-vehicle collisions. Wildl. Soc. Bull. 2001, 29, 646–653. [Google Scholar]
  39. Clevenger, A.P.; Waltho, N. Performance indices to identify attributes of highway crossing structures facilitating movement of large mammals. Biol. Conserv. 2005, 121, 453–464. [Google Scholar] [CrossRef]
  40. Clevenger, A.P.; Huijser, M.P. Wildlife Crossing Structure Handbook: Design and Evaluation in North America; Central Federal Lands Highway Division: Lakewood, CO, USA, 2011; FHWA-CFL-TD-11-003.
  41. Wang, Y.; Guan, L.; Yang, Y.; Zhou, H.; Wang, Y.; Cao, G.; Kong, Y. A Review of Highway Wildlife Crossing Structures. Transp. Res. 2019, 5, 79–87+109. [Google Scholar]
  42. Cushman, S.A.; Landguth, E.L. Multi-taxa population connectivity in the Northern Rocky Mountains. Ecol. Model. 2012, 231, 101–112. [Google Scholar] [CrossRef]
  43. Trombulak, S.C.; Frissell, C.A. Review of ecological effects of roads on terrestrial and aquatic communities. Conserv. Biol. 2000, 14, 18–30. [Google Scholar] [CrossRef]
  44. Cash, D.W.; Adger, W.N.; Berkes, F.; Garden, P.; Lebel, L.; Olsson, P.; Pritchard, L.; Young, O. Scale and Cross-Scale Dynamics: Governance and Information in a Multilevel World. Ecol. Soc. 2006, 11, 8. [Google Scholar] [CrossRef]
  45. Baylis, K.; Honey-Rosés, J.; Börner, J.; Corbera, E.; Ezzine-de-Blas, D.; Ferraro, P.J.; Lapeyre, R.; Persson, U.M.; Pfaff, A.; Wunder, S. Mainstreaming Impact Evaluation in Nature Conservation. Conserv. Lett. 2016, 9, 58–64. [Google Scholar] [CrossRef]
  46. Laurance, W.F.; Clements, G.R.; Sloan, S.; O’connell, C.S.; Mueller, N.D.; Goosem, M.; Venter, O.; Edwards, D.P.; Phalan, B.; Balmford, A.; et al. A global strategy for road building. Nature 2014, 513, 229–232. [Google Scholar] [CrossRef]
  47. Hilty, J.; Worboys, G.L.; Keeley, A.; Woodley, S.; Lausche, B.J.; Locke, H.; Carr, M.; Pulsford, I.; Pittock, J.; White, J.W.; et al. Guidelines for Conserving Connectivity Through Ecological Networks and Corridors; IUCN: Gland, Switzerland, 2020. [Google Scholar]
Figure 1. Study area boundary. (a) Administrative locations of Sichuan, Shaanxi, and Gansu Provinces in China; (b) spatial extent of the Giant Panda National Park; (c) river systems and the boundary of the study area.
Land 14 01465 g001
Figure 2. Photographs of the six target terrestrial mammal species. (a) Giant panda; (b) Sichuan snub-nosed monkey; (c) leopard cat; (d) forest musk deer; (e) Sichuan takin; (f) rock squirrel. (ae) Source: National Geographic Media, 2025, available at https://www.natgeomedia.com (accessed on 30 June 2025); (f) source: Getty Images, 2025, available at https://www.gettyimages.com (accessed on 30 June 2025).
Land 14 01465 g002
Figure 3. Statistics of selected species in Giant Panda National Park.
Land 14 01465 g003
Figure 4. Distribution of species occurrence points. (a) Distribution points of the giant panda; (b) distribution points of the Sichuan snub-nosed monkey; (c) distribution points of the leopard cat; (d) distribution points of the forest musk deer; (e) distribution points of the Sichuan takin; (f) distribution points of the rock squirrel.
Land 14 01465 g004
Figure 5. Habitat factors. (a) Elevation; (b) slope; (c) aspect; (d) distance to river; (e) land cover type; (f) distance to disaster sites; (g) distance to road; (h) distance to settlements; (i) vegetation type; (j) canopy height; (k) NDVI; (l) mean annual temperature; (m) annual precipitation.
Land 14 01465 g005
Figure 6. Two-step screening approach. (a) Numbering the ecological conflict points in order (red points); (b) creating a 5 km buffer for each conflict point (green circles); (c) selection of points where the number of aggregated points in the buffer zone is at its peak (orange points); (d) screening of completed points to be optimized (yellow points).
Land 14 01465 g006
Figure 7. Technical framework.
Land 14 01465 g007
Figure 8. Accuracy verification ROC Curves of each species. (a) ROC Curves of the giant panda; (b) ROC Curves of the Sichuan snub-nosed monkey; (c) ROC Curves of the leopard cat; (d) ROC Curves of the forest musk deer; (e) ROC Curves of the Sichuan takin; (f) ROC Curves of the rock squirrel.
Land 14 01465 g008
Figure 9. Habitat suitability evaluation of species. (a) Habitat suitability evaluation of the giant panda; (b) habitat suitability evaluation of the Sichuan snub-nosed monkey; (c) habitat suitability evaluation of the leopard cat; (d) habitat suitability evaluation of the forest musk deer; (e) habitat suitability evaluation of the Sichuan takin; (f) habitat suitability evaluation of the rock squirrel.
Land 14 01465 g009
Figure 10. Ecological sources of each species. (a) Ecological sources of the Giant panda; (b) ecological sources of the Sichuan snub-nosed monkey; (c) ecological sources of the leopard cat; (d) ecological sources of the forest musk deer; (e) ecological sources of the Sichuan takin; (f) ecological sources of the rock squirrel.
Land 14 01465 g010
Figure 11. The Jackknife test results for the variable importance of each species.
Land 14 01465 g011
Figure 12. Integrated resistance surfaces of each species. (a) Integrated resistance surfaces of the Giant panda; (b) integrated resistance surfaces of the Sichuan snub-nosed monkey; (c) integrated resistance surfaces of the leopard cat; (d) integrated resistance surfaces of the forest musk deer; (e) integrated resistance surfaces of the Sichuan takin; (f) integrated resistance surfaces of the rock squirrel.
Land 14 01465 g012
Figure 13. Ecological corridors of each species. (a) Ecological corridors of the Giant panda; (b) ecological corridors of the Sichuan snub-nosed monkey; (c) ecological corridors of the leopard cat; (d) ecological corridors of the forest musk deer; (e) ecological corridors of the Sichuan takin; (f) ecological corridors of the rock squirrel.
Land 14 01465 g013
Figure 14. Ecological conflict points of species. (a) Ecological conflict points of the Giant panda; (b) ecological conflict points of the Sichuan snub-nosed monkey; (c) ecological conflict points of the leopard cat; (d) ecological conflict points of the forest musk deer; (e) ecological conflict points of the Sichuan takin; (f) ecological conflict points of the rock squirrel.
Land 14 01465 g014
Figure 15. Example of G5 high-speed point selection method; red dots indicate the peak points selected as priority wildlife crossing sites.
Land 14 01465 g015
Figure 16. Wildlife crossing masterplan.
Land 14 01465 g016
Figure 17. Locations of different types of wildlife crossings. (a) Locations of overpasses; (b) locations of underpasses; (c) locations of canopy bridges.
Land 14 01465 g017
Table 1. Integrated habitat factor indicator system.
Variable CategorySub Variable
GeographySlope
Elevation
Aspect
Distance to rivers
Climatic factorsAnnual precipitation
Mean annual temperature
Biological factorsCanopy height
Vegetation type
NDVI
DisturbancesLand cover type
Distance to settlements
Distance to roads
Distance to disaster sites
Table 2. Data sources.
DataSourcesSpatial Accuracy
Species distribution data GBIF Global Biodiversity Information Facility https://www.gbif.org/ (accessed on 12 September 2024)——
DEM dataGeospatial Data Cloud30 m
Water dataOpen Street Map——
Precipitation dataWorld Clim Global Climate Data official website——
Temperature dataWorld Clim Global Climate Data official website——
Vegetation canopy heightNeural network guided interpolation for mapping canopy height of China′s forests by integrating GEDI and ICE-Sat-2 data. [17]30 m
NDVI datahttp://www.nesdc.org.cn/ (accessed on 19 September 2024)30 m
Vegetation typeNational Cryosphere Desert Data Center1:100 million
Settlement dataNational Bureau of Statistics——
Land cover dataEsri | Sentinel-2 Land Cover Explorer10 m
Natural disaster sitesResource and Environmental Science Data Platform——
Roads dataOpen Street Map——
Table 3. Scale of habitat suitability areas for each species.
Habitat Suitability ZoneMedium-Suitability Area (km2)Medium-Suitability Percentage (%)High-Suitability Area (km2)High-Suitability Percentage (%)Extreme High-Suitability Area (km2)Extreme High-Suitability Percentage (%)
Giant panda 11,7795.51767414.57290222.36
Leopard cat903517.1538657.3417233.27
Sichuan snub-nosed monkey10,96720.8261811.732695.11
Forest musk deer137026.0177614.7338797.36
Rock squirrel11,96622.72846816.0847459.01
Sichuan takin609511.5736606.9522724.31
Table 4. Ecological source area for each species.
SpeciesEcological Source Area (km2)Number (Pcs)Percentage of Study Area Occupied (%)
Giant panda53198610.06
Leopard cat70456913.33
Sichuan snub-nosed monkey98718618.67
Forest musk deer12,0235022.75
Rock squirrel3338906.31
Sichuan takin3956757.48
Table 5. Habitat suitability of species.
SpeciesWeightEnvironment VariableGrading Criteria
12345
Giant panda0.30Distance to settlements15.8–30.9 km10.2–15.8 km6.4–10.2 km3.1–6.4 km≤3.1 km
0.20Land cover typetreeswater, rangelandssnow or icecropsbuilt, bare ground
0.20Vegetation typeneedleleaf and broadleaf mixed forestscrub, grasslanddesertneedleleaf, broadleaf foreststeppe, meadow, alpine vegetation
0.20Aspect−1–70.9°70.9–141.4°141.4–211.9°211.9–283.8°283.8–359.9°
0.10Elevation454–1466 m1466–2136 m2136–2877 m2877–3724 m3724–7107 m
Sichuan snub-nosed monkey0.40Elevation454–1466 m1466–2136 m2136–2877 m2877–3724 m3724–7107 m
0.30Vegetation typegrasslanddesertneedleleaf and broadleaf mixed forest, needleleaf forest, alpine vegetationbroadleaf forest, steppescrub
0.15Distance to rivers17,328–30,593 km11,472–17,328 km7289–11,472 km3466–7289 km≤3466 km
0.075Distance to settlements15.8–30.9 km10.2–15.8 km6.4–10.2 km3.1–6.4 km≤3.1 km
0.075Mean annual temperature11.9–16.6 °C8.8–11.9 °C5.5–8.8 °C1.5–5.5 °C−6.5–1.5 °C
Leopard cat0.40Vegetation typegrasslandscrubneedleleaf and broadleaf mixed forest, needleleaf, broadleaf forestdesert, steppe, meadowalpine vegetation
0.35Distance to disaster sites0.71–4142 km4142–9665 km9665–19,560 km19,560–33,828 km33,828–58,911 km
0.10Annual precipitation52–64.7 mm64.7–72.5 mm72.5–83.1 mm83.1–97.0 mm97.0–126.0 mm
0.10Distance to settlements15.8–30.9 km10.2–15.8 km6.4–10.2 km3.1–6.4 km≤3.1 km
0.05Mean annual temperature11.92–16.69 °C8.8–11.92 °C5.5–8.8 °C1.53–5.5 °C−6.59–1.53 °C
Forest musk deer0.50Distance to settlements15.8–30.9 km10.2–15.8 km6.4–10.2 km3.1–6.4 km≤3.1 km
0.20Vegetation typegrasslandneedleleaf and broadleaf mixed forestscrub, alpine vegetationneedleleaf, broadleaf forest, desert, steppemarsh
0.15Distance to disaster sites33.83–58.91 km19.56–33.83 km9.67–19.56 km4.14–9.67 km≤4.14 km
0.075Canopy height≤4.82 cm4.82–12.12 cm12.12–17.92 cm17.92–25 cm25–62.7 cm
0.075NDVI0.615–0.8240.521–0.6150.425–0.5210.293–0.425−1.293
Sichuan takin0.35Annual precipitation52–64.7 mm64.7–72.5 mm72.5–83.1 mm83.1–97.0 mm97.0–126.0 mm
0.25Distance to disaster sites17.9–30.8 km12.0–17.9 km7.3–12.0 km3.3–7.3 km≤4.1 km
0.20Land cover typeflooded vegetationrangelandswater, trees, crops, bare ground, cloudssnow or icebuilt
0.10Vegetation typescrub, steppegrasslandalpine vegetation, needleleaf and broadleaf mixed forestbroadleaf forest, meadowdesert
0.10Distance to roads15.8–30.9 km10.2–15.8 km6.4–10.2 km3.1–6.4 km≤3.3 km
Rock squirrel0.25Vegetation typeneedleleaf and broadleaf mixed forestcultivated vegetationneedleleaf forest, meadow, alpine vegetationdesert, grasslandscrub
0.20Distance to roads15.8–30.9 km10.2–15.8 km6.4–10.2 km3.1–6.4 km≤3.3 km
0.20Distance to settlements15.8–30.9 km10.2–15.8 km6.4–10.2 km3.1–6.4 km≤3.1 km
0.20Slope0–14.4°14.4–24.1°24.1–32.6°32.6–42.9°42.9–87.8°
0.15Canopy height25–62.7 cm17.9–2 cm12.1–17.9 cm4.8–12.1 cm≤4.8 cm
Disclaimer/Publisher’s Note: The statements, opinions and data contained in all publications are solely those of the individual author(s) and contributor(s) and not of MDPI and/or the editor(s). MDPI and/or the editor(s) disclaim responsibility for any injury to people or property resulting from any ideas, methods, instructions or products referred to in the content.

