
Water–Energy–Land–Food Nexus to Assess the Environmental Impacts from Coal Mining


Abstract
1. Introduction
2. Methodology
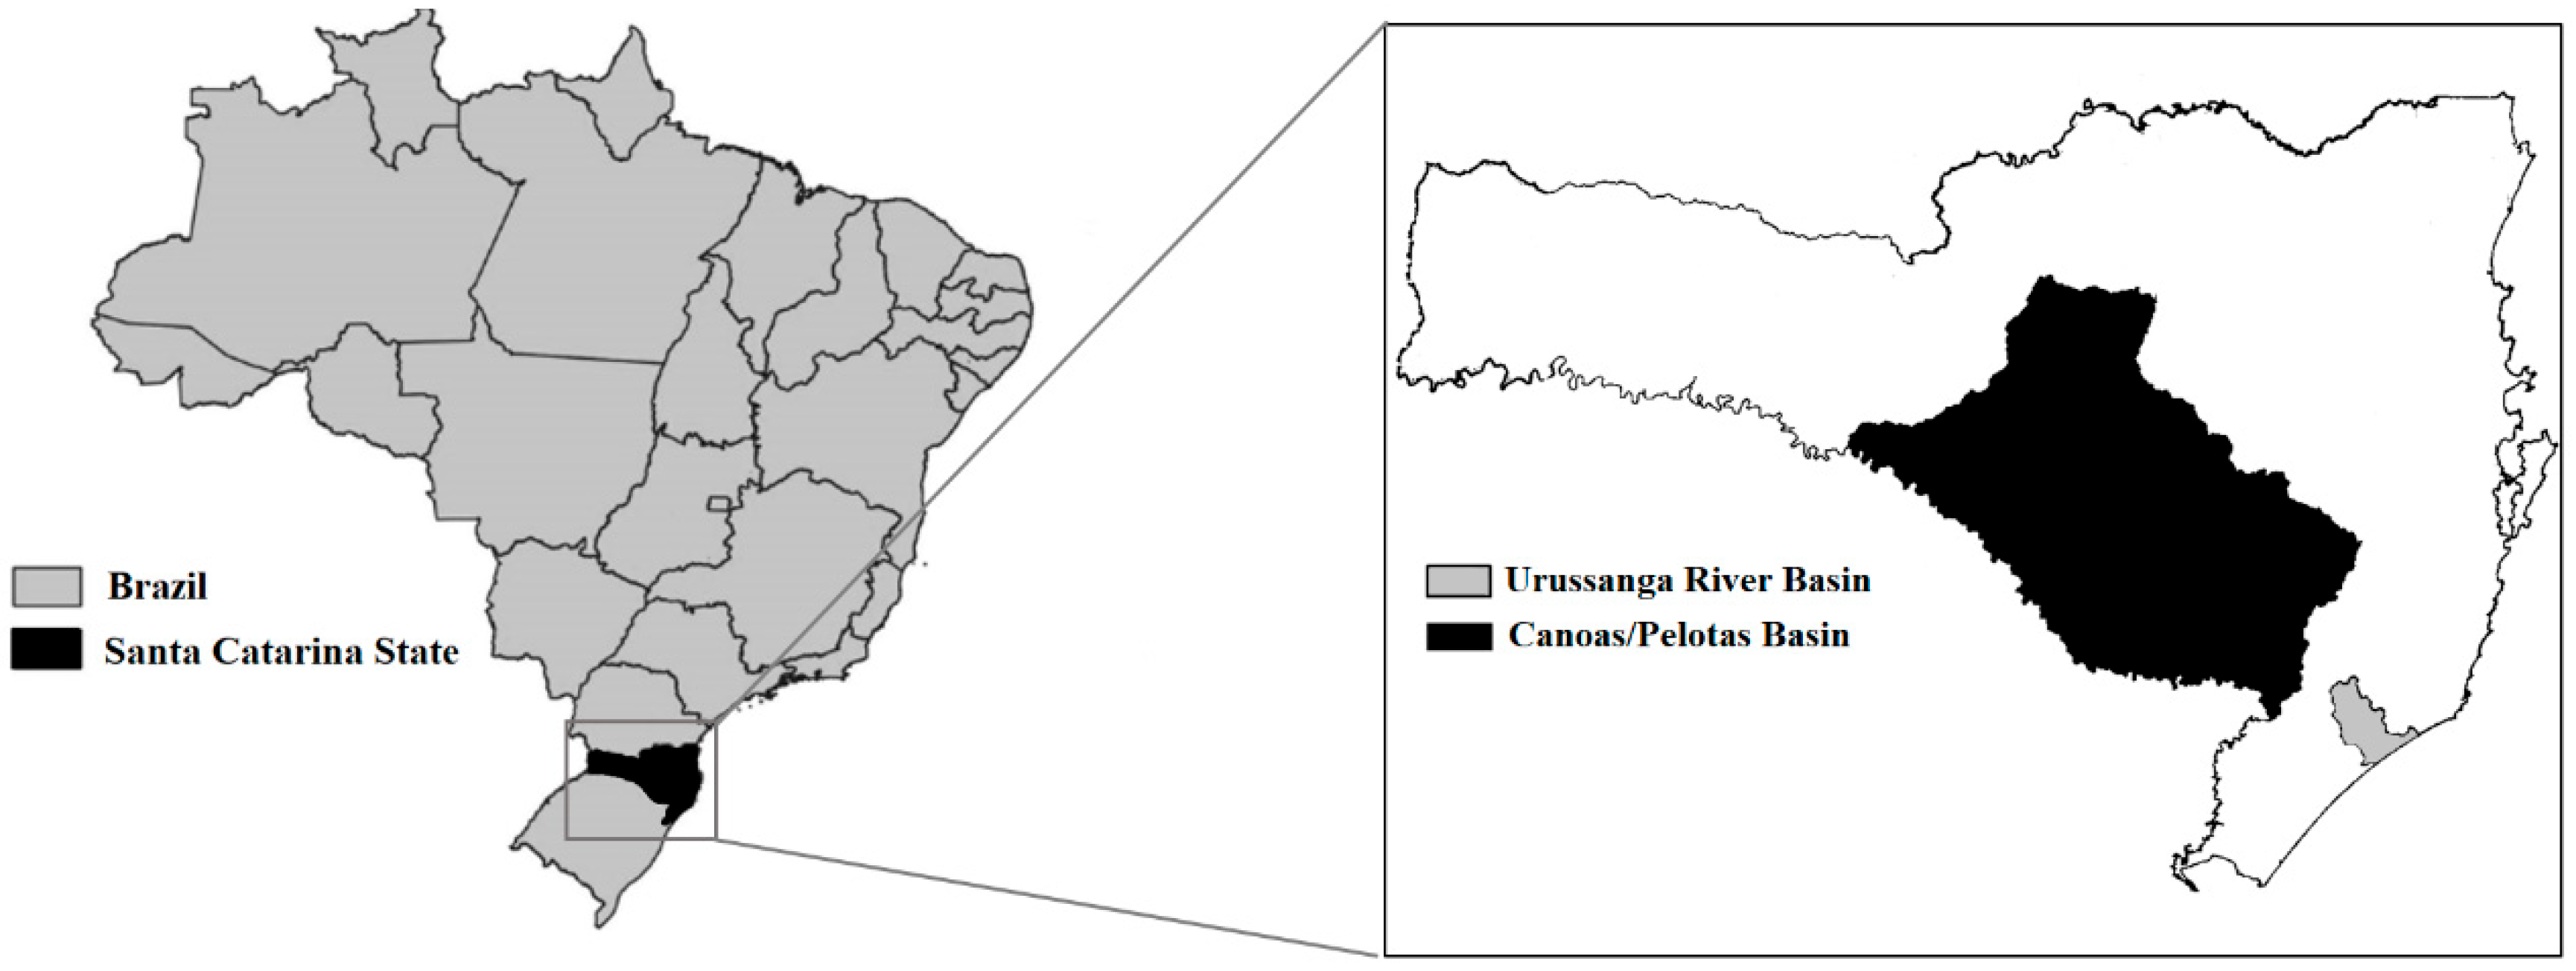
2.1. Study Areas
2.2. Data on Water, Energy, Food and Land
2.3. Coal Mining and Environmental Impacts
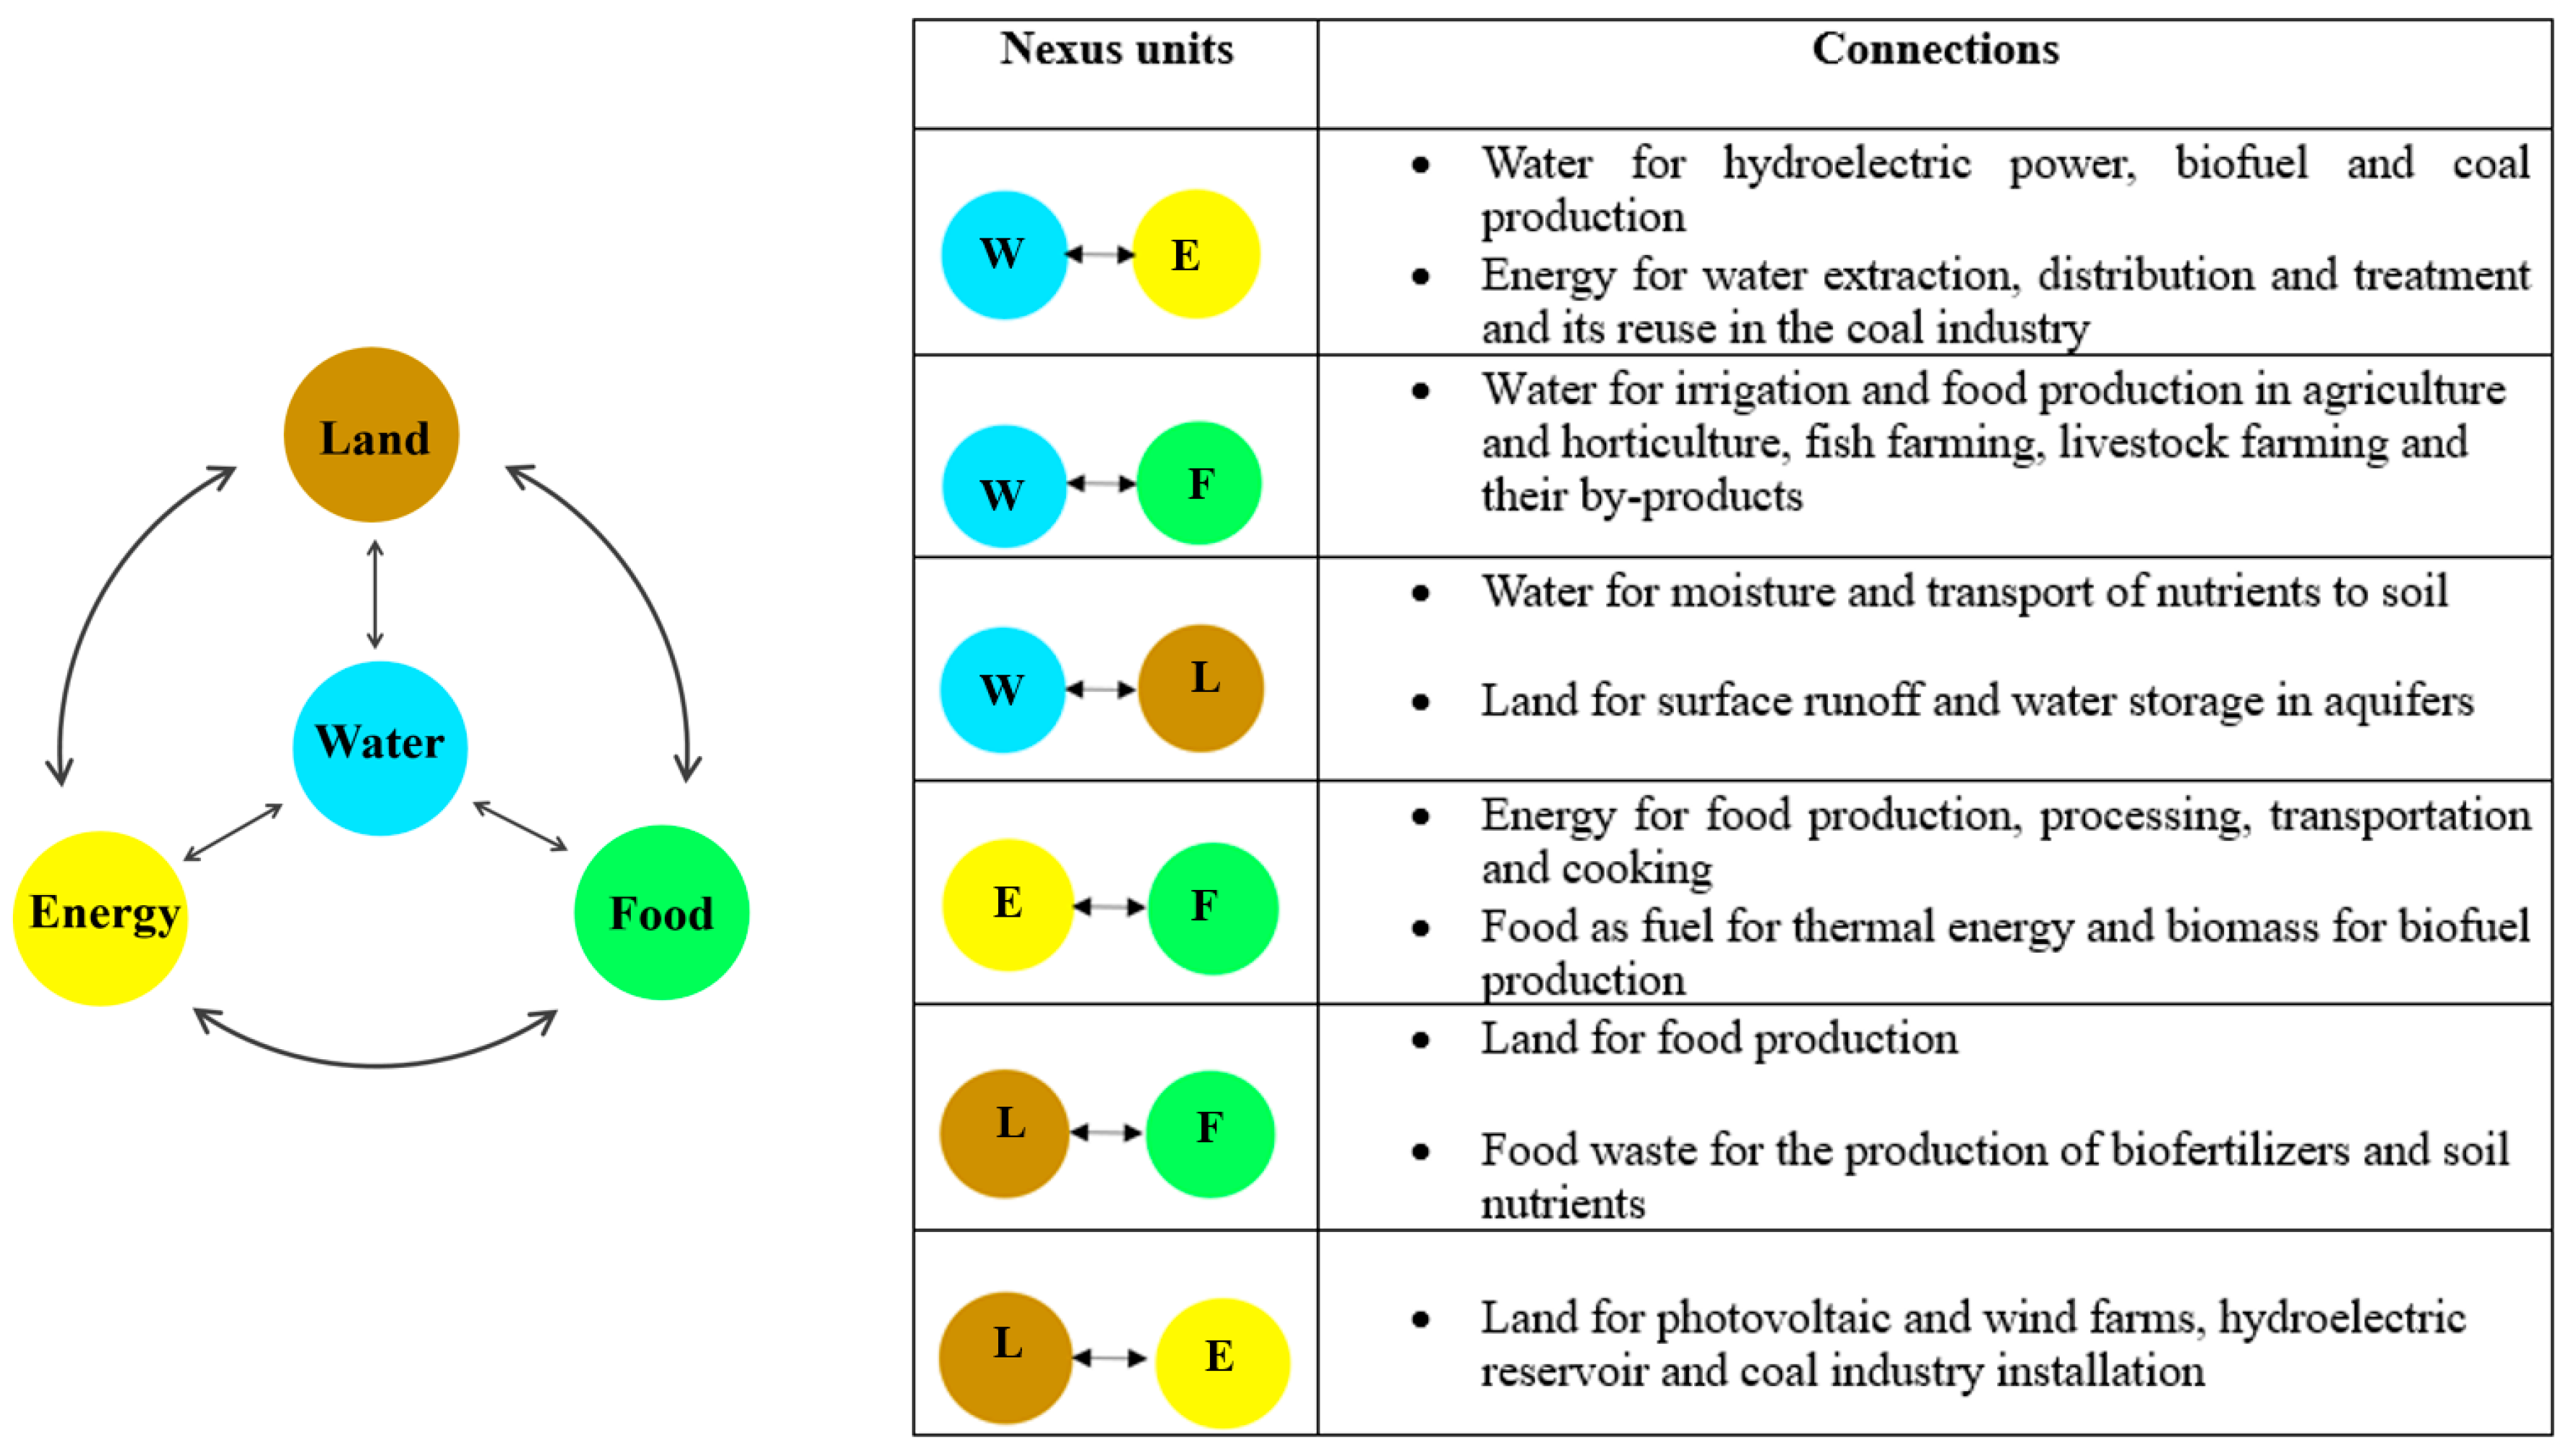
2.4. WELF Nexus Application

| Subsystem | Indicator | Unit | Dimension | Reference |
|---|---|---|---|---|
| Surface waters | Annual water consumption per capita | 1000 m3/ person | Robustness | [21,23,27,28] |
| Annual water consumption per cultivated area | 1000 m3/ha | Equilibrium | [21,27,28] | |
| Energy | Installed power electricity per capita | kW/person | Robustness | [23,29] |
| Food | Annual agricultural production per unit area | ton/ha | Reliability | [23,24] |
| Annual agricultural production per capita | ton/person | Robustness | [23,24] | |
| Land | Area degraded by coal mining | 1000 km2 | Robustness Reliability Equilibrium | [21] |
3. Results and Discussion
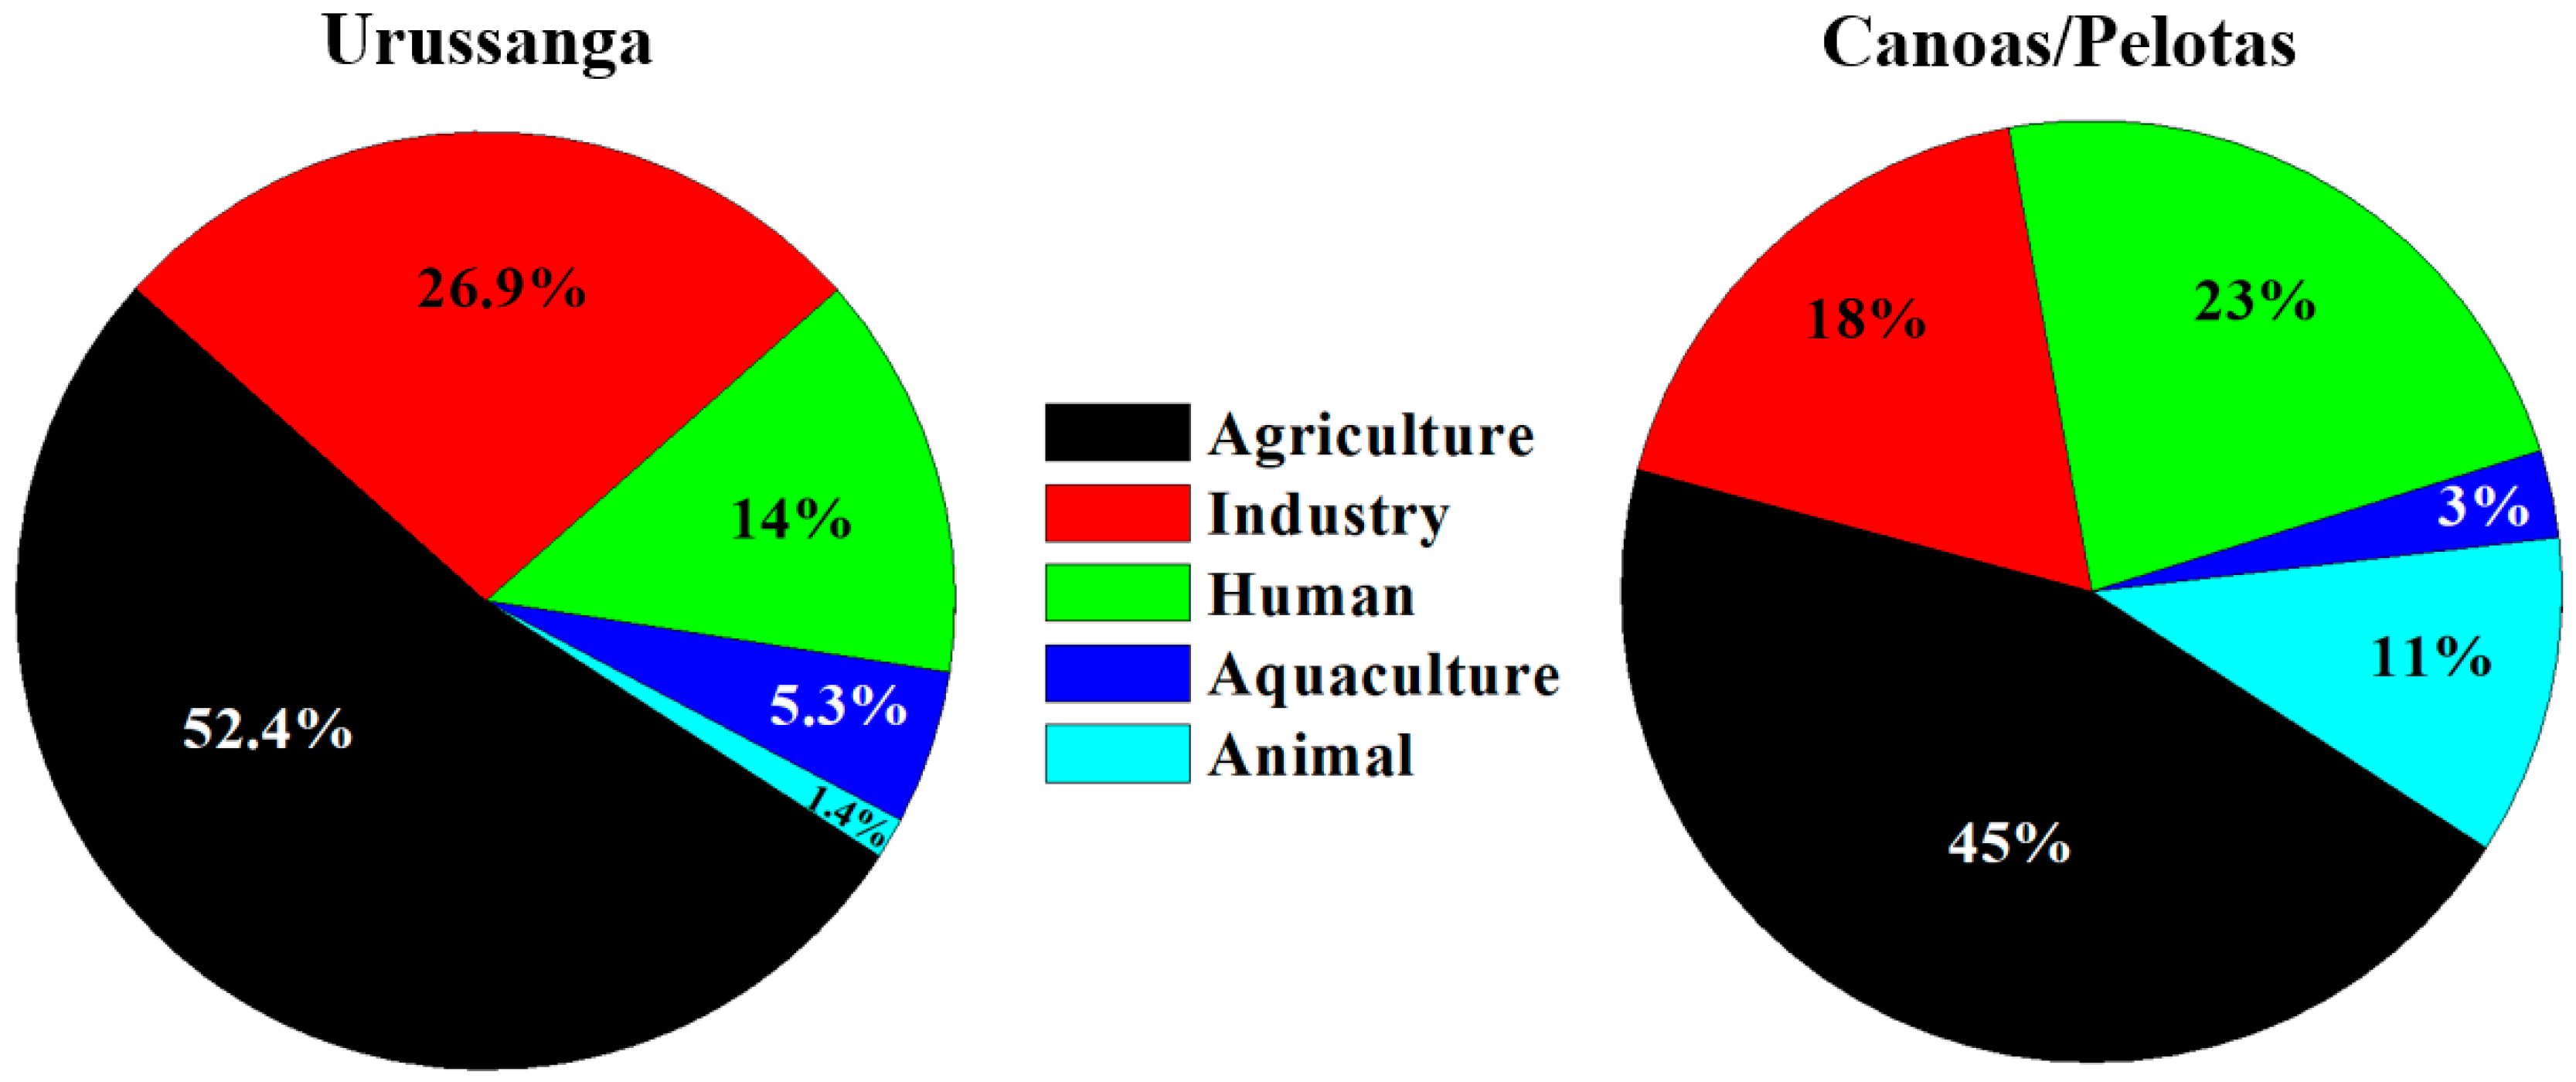
3.1. Water Data
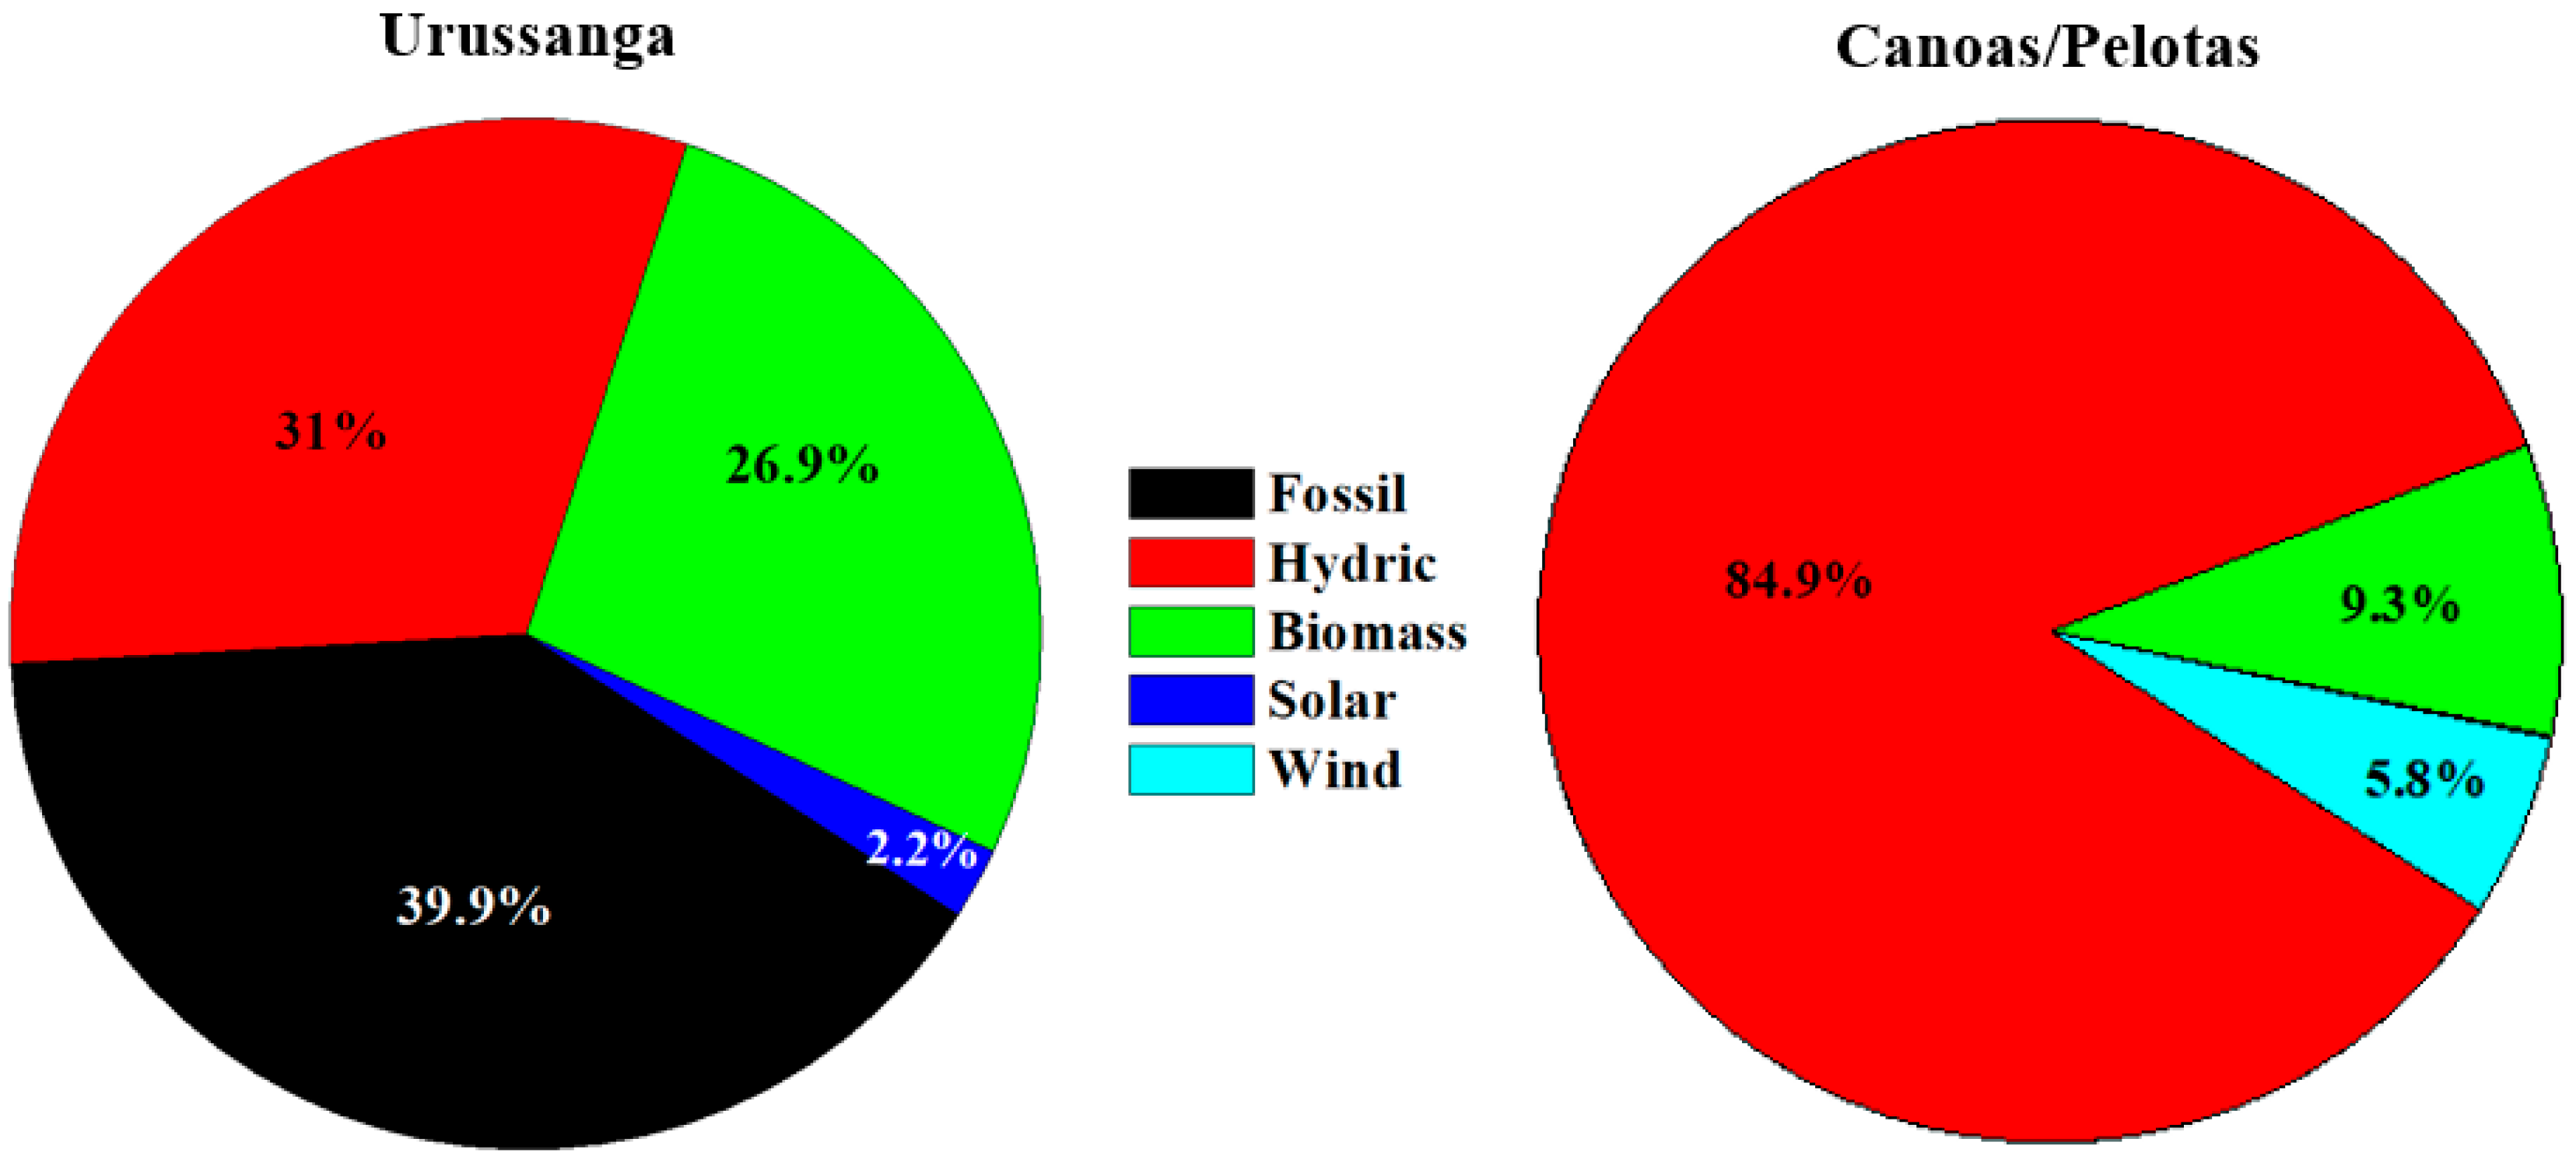
3.2. Energy Data
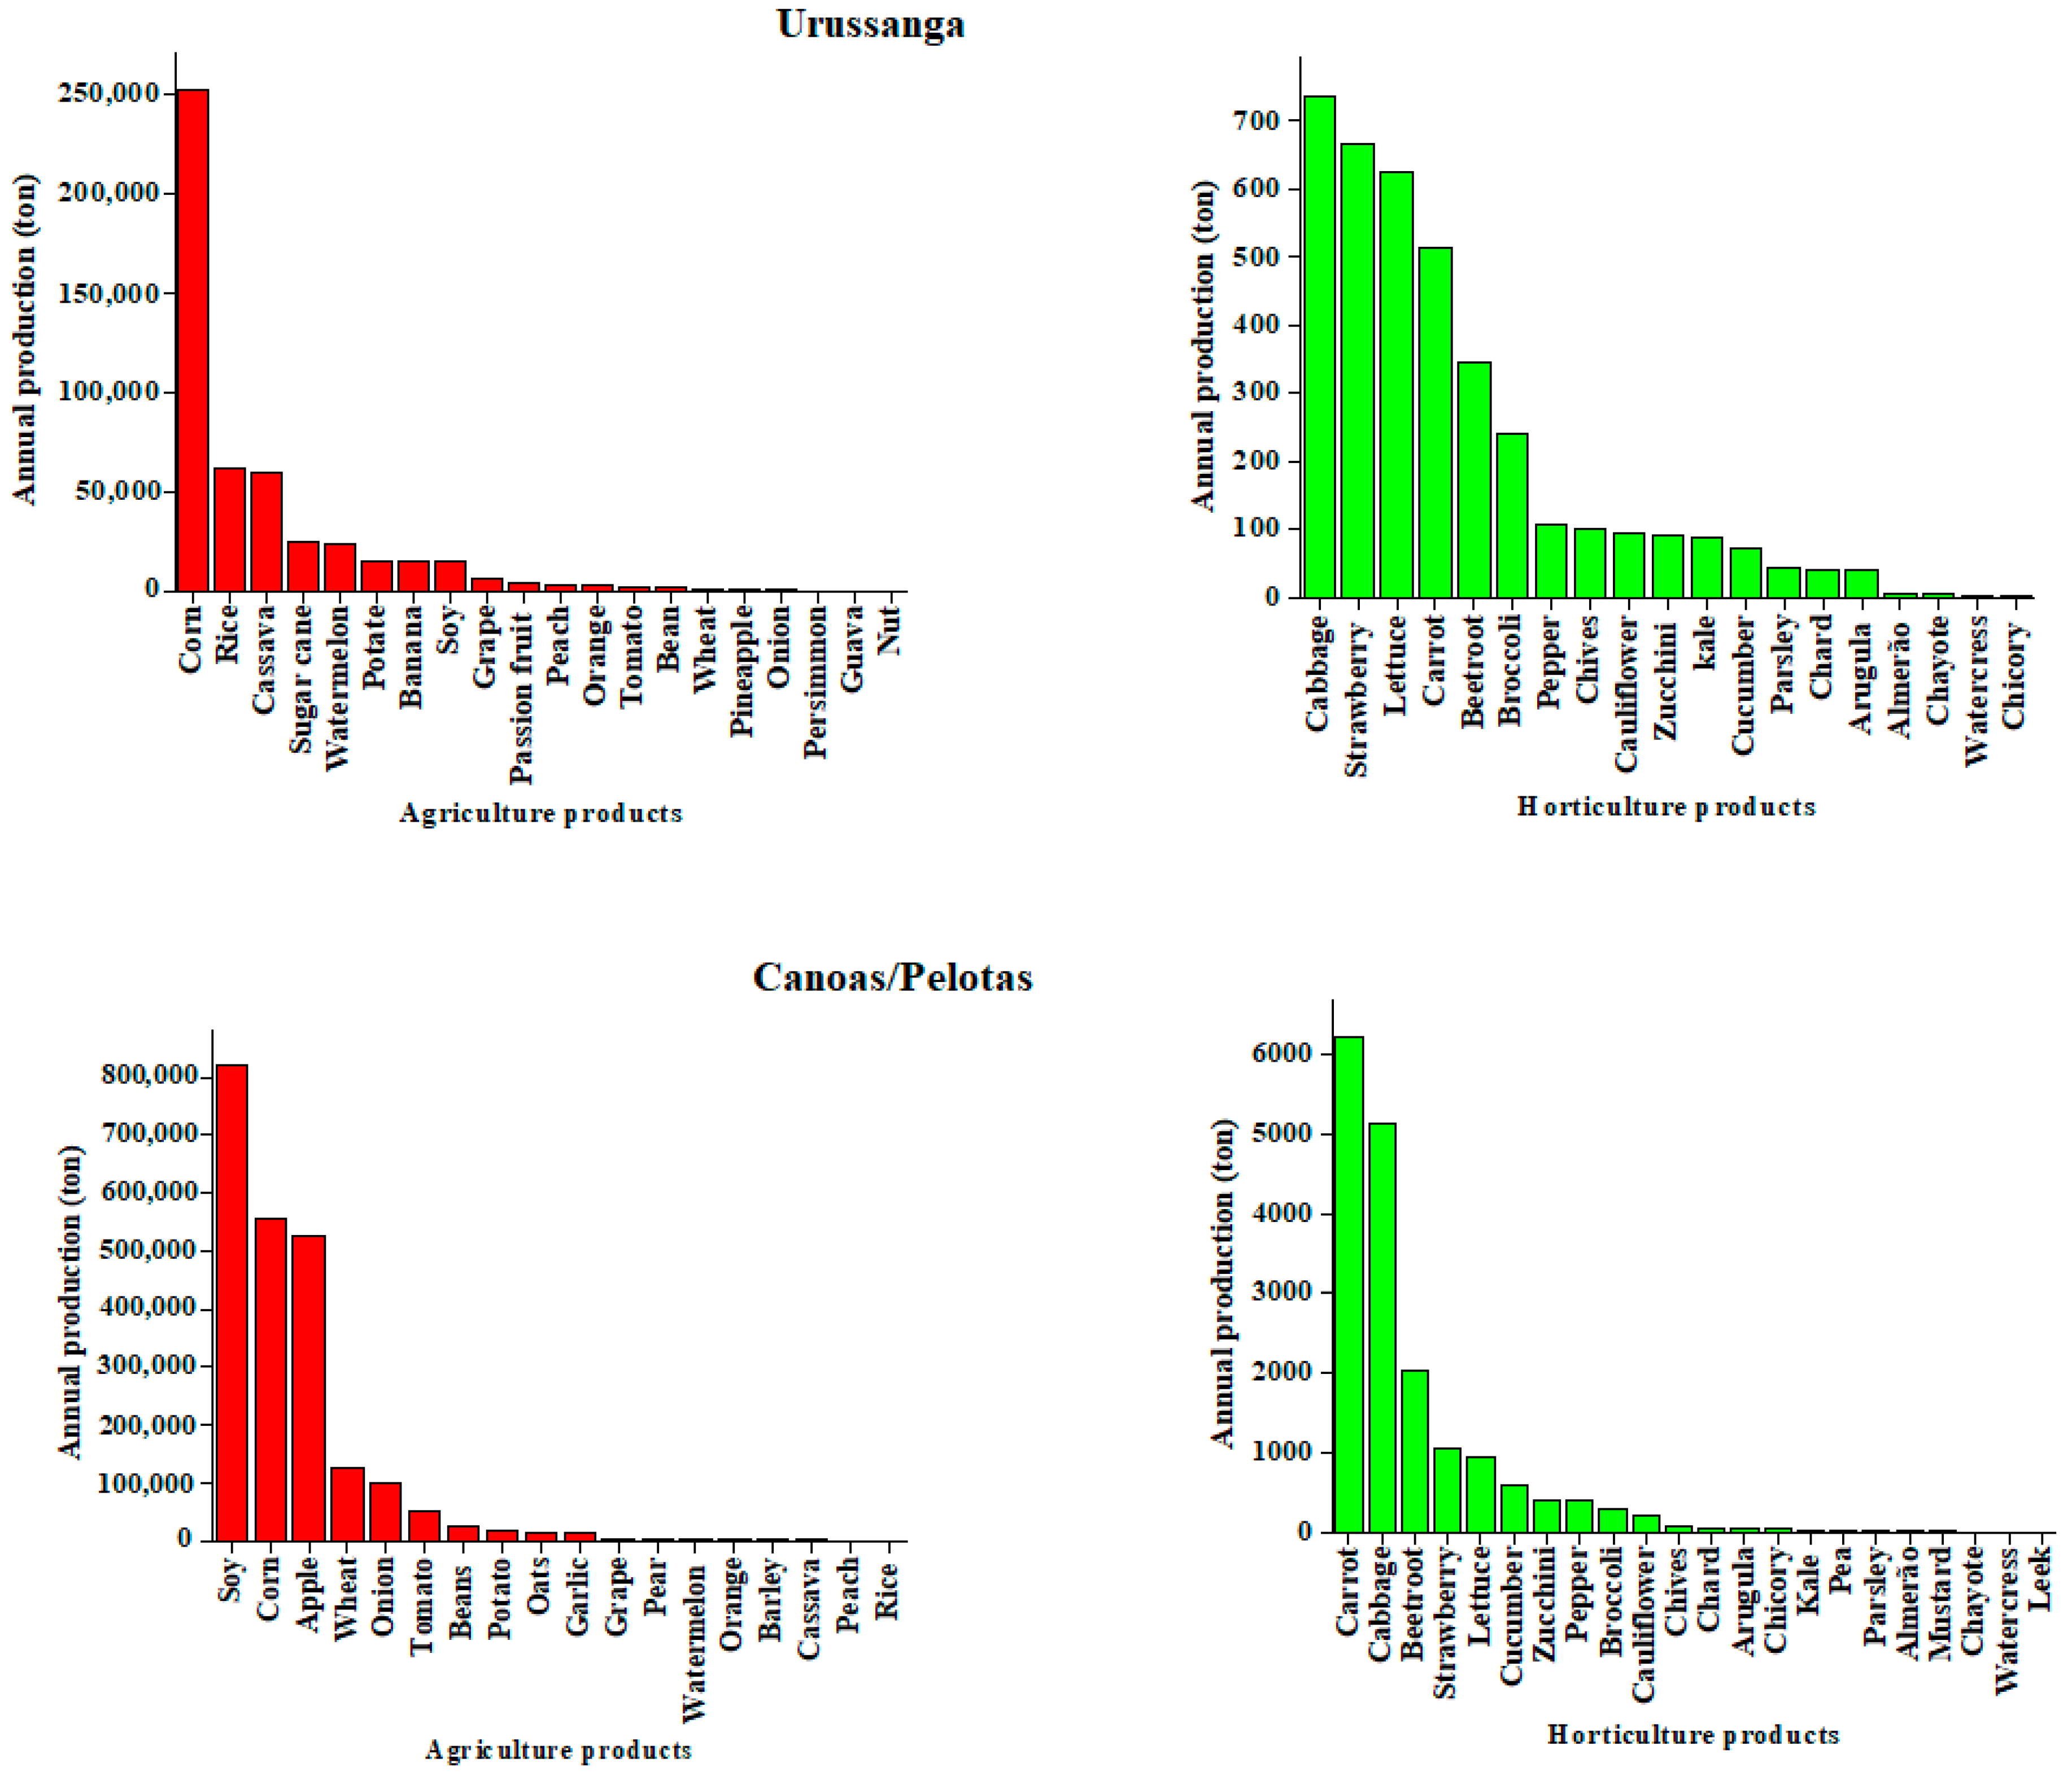
3.3. Food Production Data
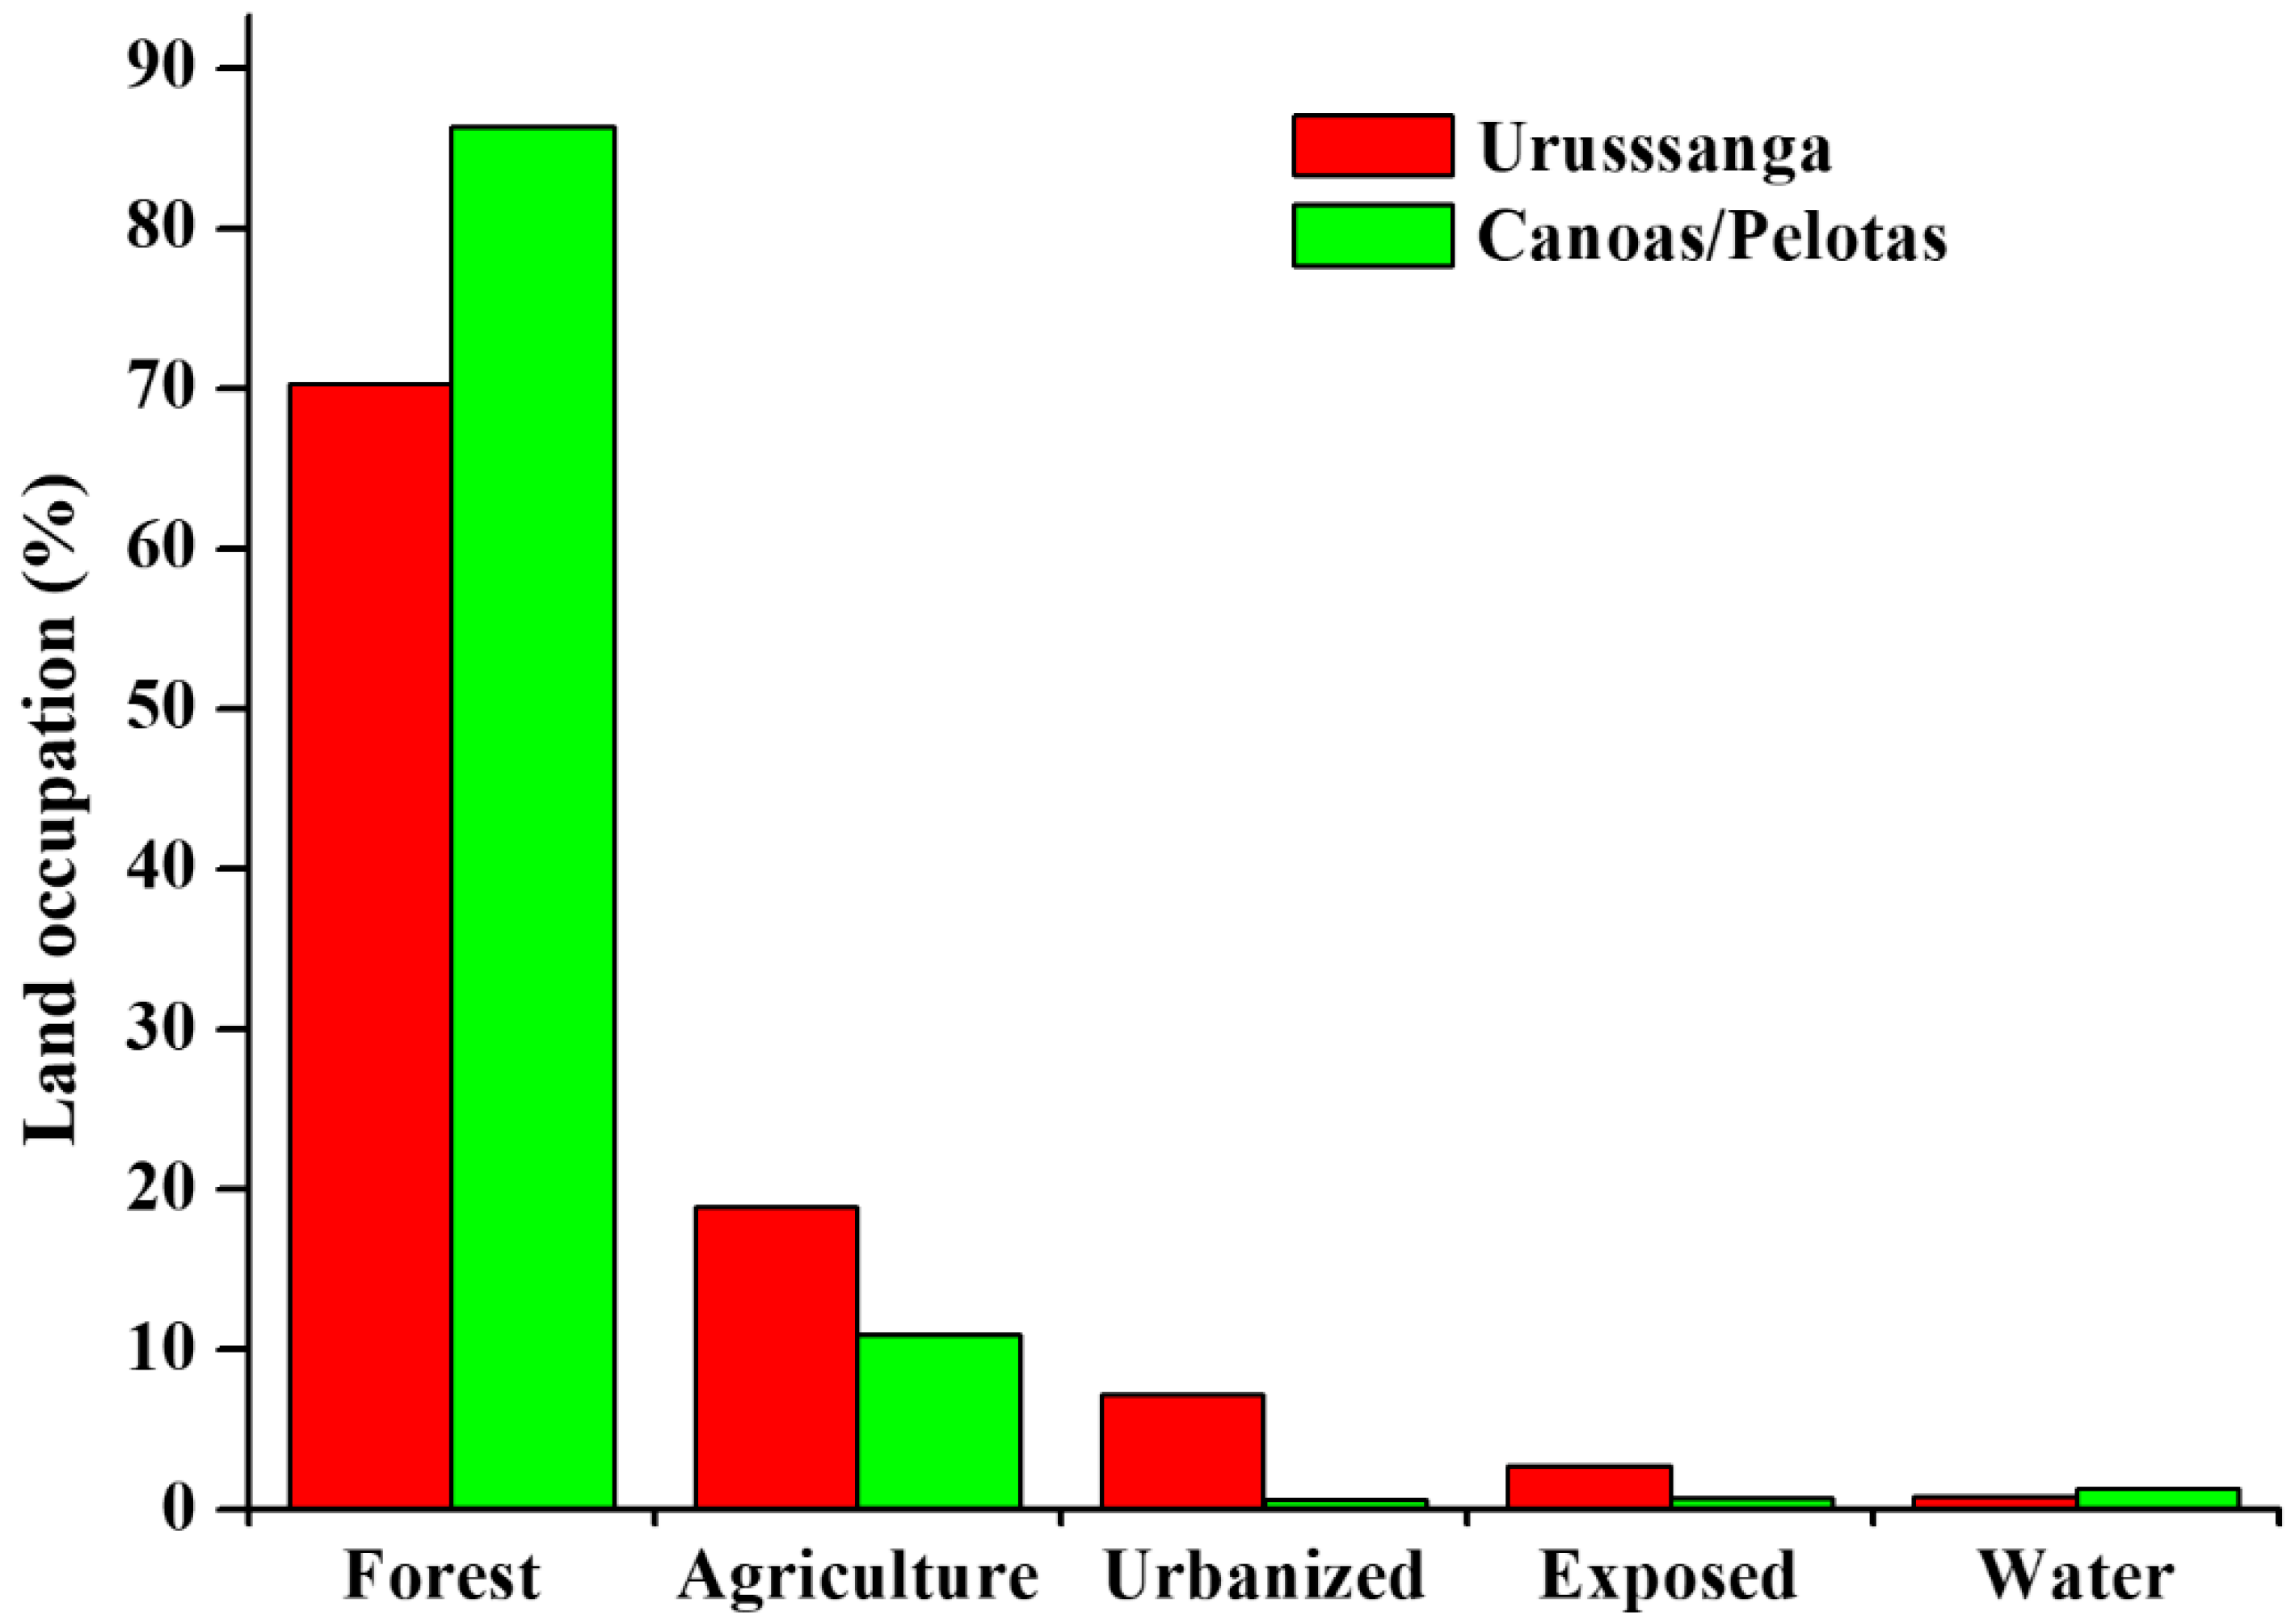
3.4. Land Data
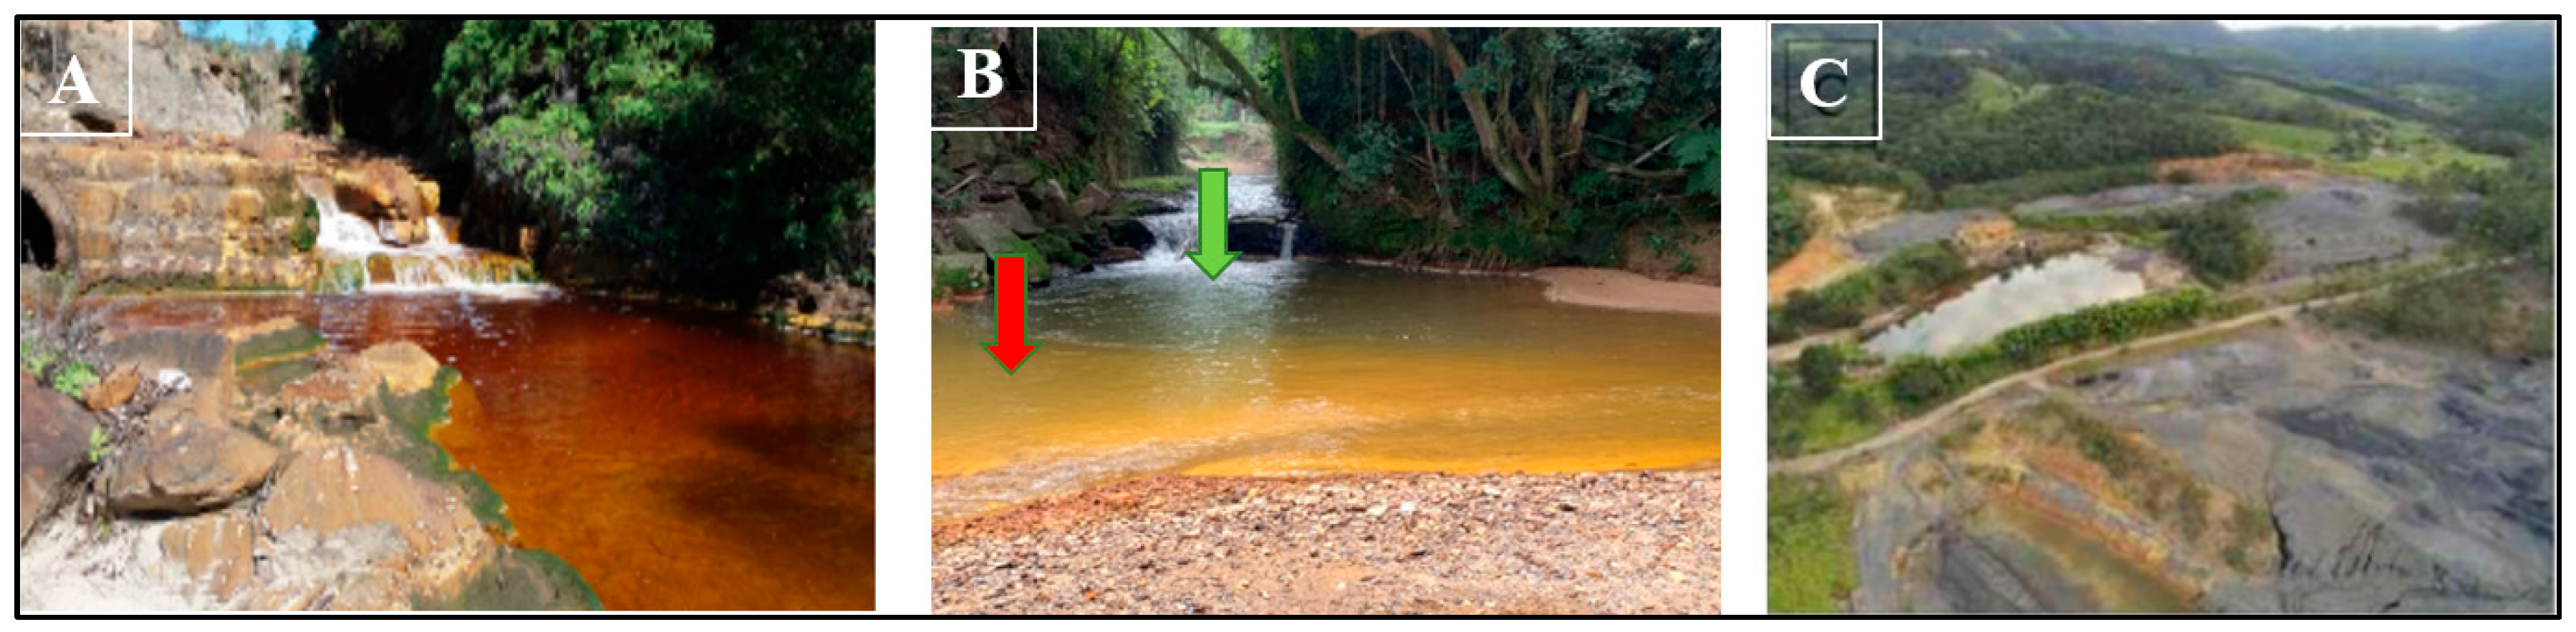
3.5. Coal Mining and Its Environmental Impacts
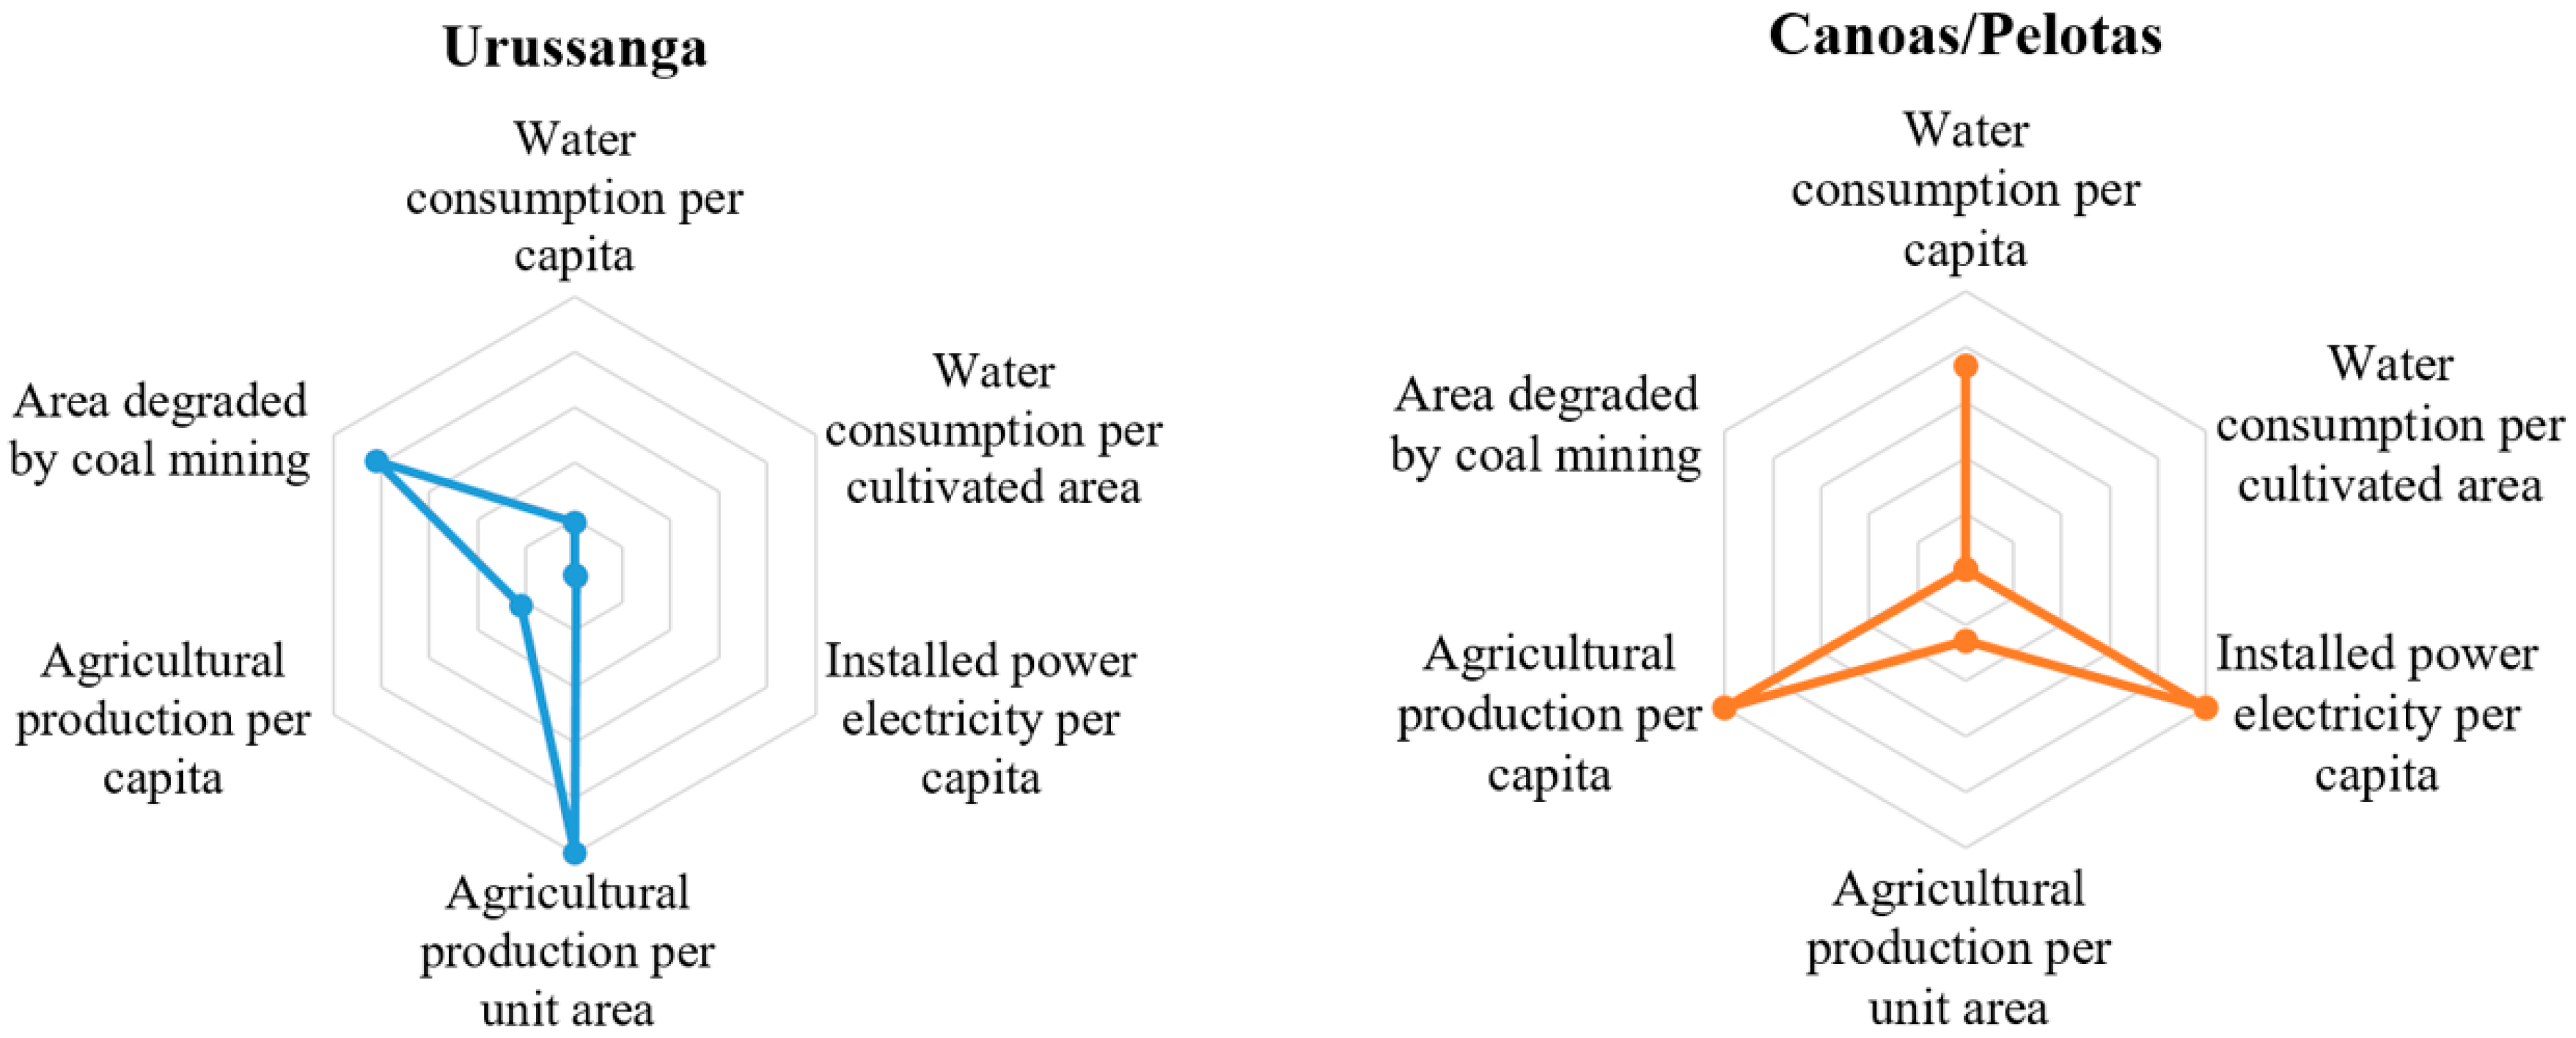
3.6. WELF Nexus Approach
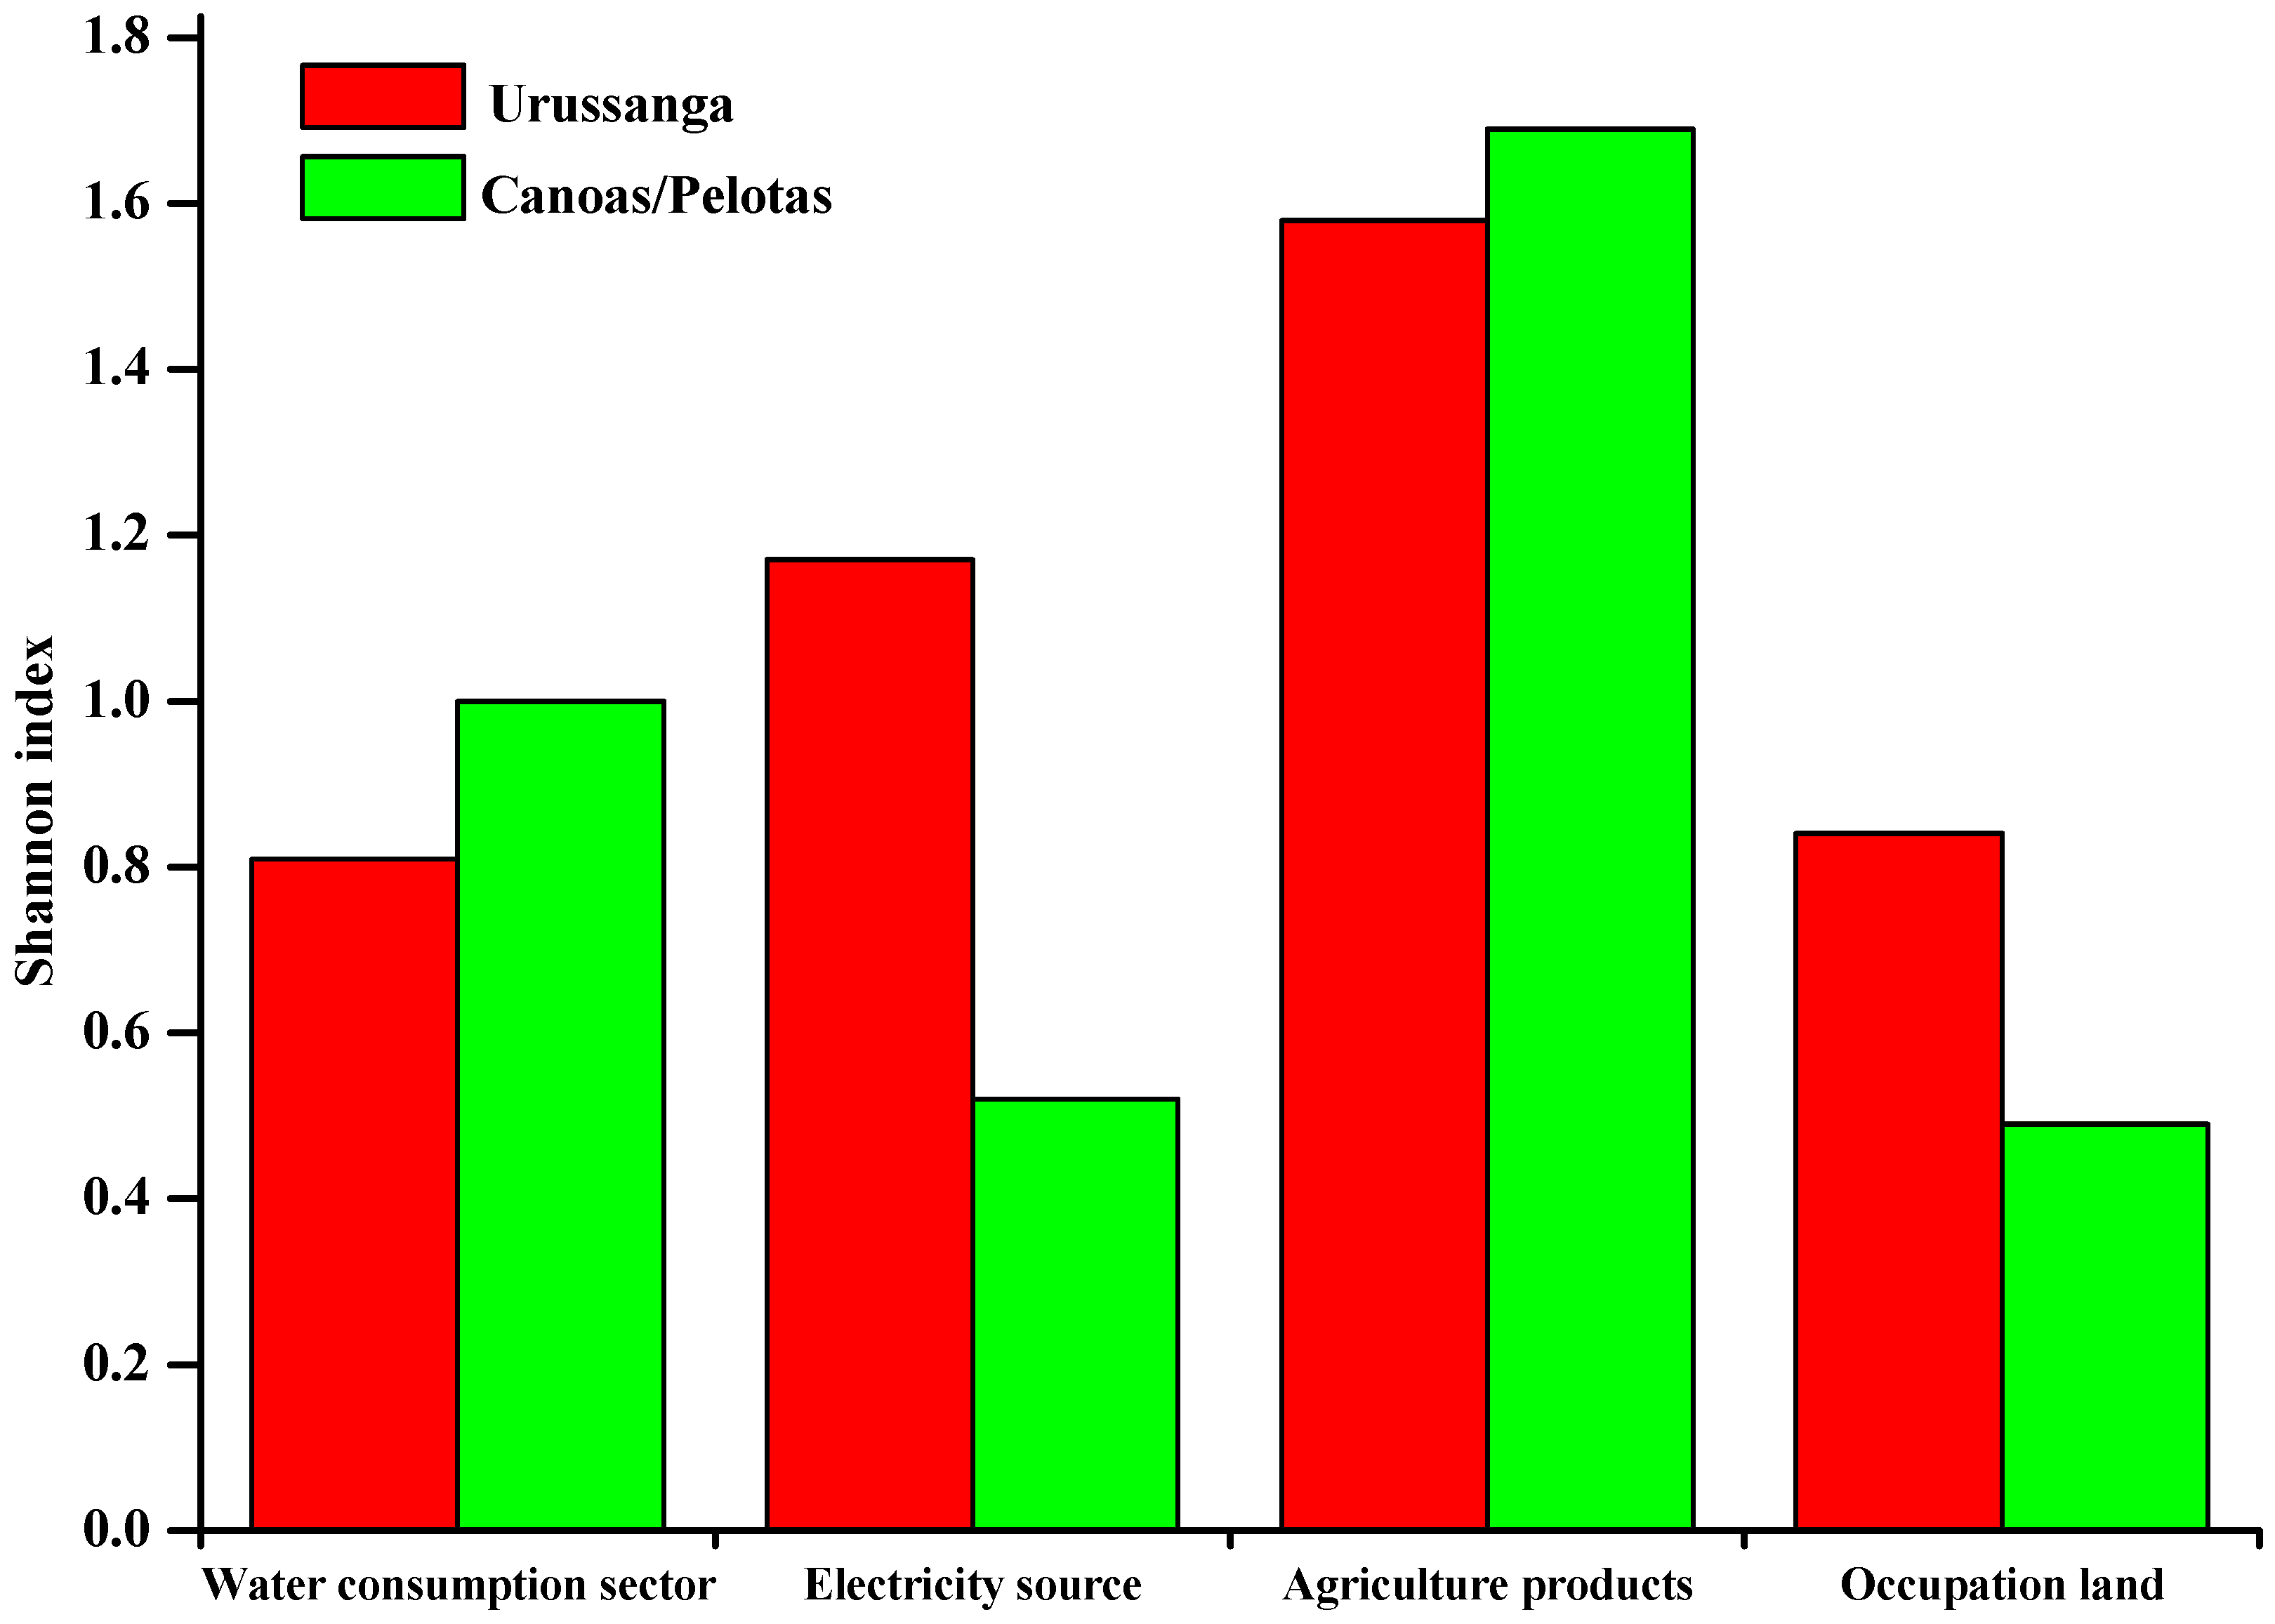
3.7. Shannon Diversity Index
4. Implications Based on the Results
5. Conclusions
Author Contributions
Funding
Data Availability Statement
Conflicts of Interest
References
- Taniguchi, M.; Masuhara, N.; Burnett, K. Water, energy, and food security in the Asia Pacific region. J. Hydrol. Reg. Stud. 2017, 11, 9–19. [Google Scholar] [CrossRef]
- Javan, k.; Darestani, M.; Ibrar, I.; Pignatta, G. Interrelated issues within the Water-Energy-Food nexus with a focus on environmental pollution for sustainable development: A review. Environ. Pollut. 2025, 368, 125706. [Google Scholar] [CrossRef] [PubMed]
- The Sustainable Development Goals Report 2022. Available online: https://unstats.un.org/sdgs/report/2022/The-Sustainable-Development-Goals-Report-2022.pdf (accessed on 21 May 2025).
- OECD. The Land-Water-Energy Nexus: Biophysical and Economic Consequences; OECD Publishing: Paris, France, 2017. [Google Scholar] [CrossRef]
- Kobiyama, M.; Fagundes, M.R.; Brighenti, T.M.; Stone, T.F.; Corseuil, C.W. Integrative approach for risk and disaster reduction: The water-energy-food-disaster-ecosystem nexus. In Teaching Geography and Disaster Risk Reduction in Urban and Rural Areas; Júnior, L.M., Magnoni, M.G.M., Cabral, M., Torres, M.M., Castro, C.E., Londe, L.R., Serrano-Notivoli, R., Figueiredo, W.S., Barbosa, H.A., Prieto, J.I., Eds.; CPS: São Paulo, Brazil, 2022; pp. 434–464. [Google Scholar]
- Endo, A.; Yamada, M.; Baba, K.; Miyashita, Y.; Sugimoto, R.; Ishii, A.; Nishijima, J.; Fujii, M.; Kato, T.; Hamamoto, H.; et al. Methodology for Nexus Approach Toward Sustainable Use of Geothermal Hot Spring Resources. Front. Water 2021, 3, 713000. [Google Scholar] [CrossRef]
- Bidoglio, G.; Vanham, D.; Bouraoui, F.; Barchiesi, S. The Water-Energy-Food-Ecosystems (WEFE) Nexus. In Encyclopedia of Ecology, 2nd ed.; Elsevier Inc.: North Andover, MA, USA, 2019; Volume 4, pp. 459–466. [Google Scholar]
- Abreu, M.R.; Machado, R.L. Water-energy-food-land nexus challenges and contributions to the biofuel supply chain: Systematic review and meta synthesis. Environ. Dev. 2023, 48, 100927. [Google Scholar] [CrossRef]
- Chang, H.; Zhang, B.; Han, J.; Zhao, Y.; Cao, Y.; Yao, J.; Shi, L. Evaluation of the Coupling Coordination and Sustainable Development of Water–Energy–Land–Food System on a 40-Year Scale: A Case Study of Hebei, China. Land 2024, 13, 1089. [Google Scholar] [CrossRef]
- Monie, S.M.; Gustafsson, M.; Onnered, S.; Guruvita, K. Renewable and integrated energy system resilience—A review and generic resilience index. Renew. Sustain. Energy Rev. 2025, 215, 115554. [Google Scholar] [CrossRef]
- Diop, T.B.; V’edrine, L. Did crop diversity criterion from CAP green payments affect both economic and environmental farm performances? Quasi-experimental evidence from France. Ecol. Econ. 2025, 227, 108405. [Google Scholar] [CrossRef]
- Qin, C.; He, J.; Yu, C.; Sun, A.; Li, K.; Hu, H.; Hu, T.; Ye, Y.; Yu, Y.; Wang, H. Evaluating the water quality of the rice–fish co-culture pattern based on the modified NSF water quality index model. Aquaculture 2025, 597, 741931. [Google Scholar] [CrossRef]
- Coal 2024, Analysis and Forecast to 2027. Available online: https://www.iea.org/reports/coal-2024 (accessed on 22 May 2025).
- Brazilian Energy Balance-2023. Available online: https://www.epe.gov.br/en (accessed on 25 June 2025).
- Menezes, C.T.B.; Ceni, G.; Martins, M.C.; Virtuoso, J.C. Perception of socio-environmental impacts and coastal management: Case study in a fishing community on the southern coast of Santa Catarina, Brazil. J. Environ. Manag. Sustain. 2019, 8, 457–481. (In Portuguese) [Google Scholar] [CrossRef]
- Simpson, G.B.; Badenhorst, J.; Jewitt, G.P.W.; Berchner, M.; Davies, E. Competition for Land: The Water-Energy-Food Nexus and Coal Mining in Mpumalanga Province, South Africa. Front. Environ. Sci. 2019, 7, 86. [Google Scholar] [CrossRef]
- Wu, H.; Zeng, X.; Zhang, L.; Liu, X.; Jiang, S.; Dong, Z.; Meng, X.; Wang, Q. Water-energy nexus embedded in coal supply chain of a coal-based city, China. Resour. Policy 2023, 85, 103812. [Google Scholar] [CrossRef]
- Wu, H.; Wang, Q.; Xu, Y.; Ye, Y. Coal life-cycle analysis embedded with land-energy nexus of a coal-based city in China. Resour. Environ. Sustain. 2023, 12, 100109. [Google Scholar] [CrossRef]
- Lazaro, L.L.B.; Giatti, L.L.; Bermann, C.; Giarolla, A.; Ometto, J. Policy and governance dynamics in the water-energy-food-land nexus of biofuels: Proposing a qualitative analysis model. Renew. Sustain. Energy Rev. 2021, 149, 111384. [Google Scholar] [CrossRef]
- Schnack, C.E.; Menezes, C.T.B.; Ceni, G.; Munari, A.B. Water quality in the Urussanga River estuary (SC, Brazil): An environment affected by acid mine drainage. Braz. J. Biosci. 2018, 3, 98–106. Available online: https://seer.ufrgs.br/index.php/rbrasbioci/article/view/114593 (accessed on 24 June 2025). (In Portuguese).
- Urussanga River Basin Water Resources Plan 2019. Available online: https://www.aguas.sc.gov.br/base-documental/planos-de-bacias (accessed on 22 May 2025). (In Portuguese)
- Virtuoso, J.C.; Menezes, C.T.B.; Assunção, V.K. As dinâmicas de poder na apropriação dos recursos hídricos: Estudo de caso da bacia hidrográfica do rio Urussanga, SC. Gaia Sci. 2020, 14, 74–93. (In Portuguese) [Google Scholar] [CrossRef]
- Brazilian Institute of Geography and Statistics, Census 2022. Available online: https://censo2022.ibge.gov.br/panorama/ (accessed on 22 May 2025). (In Portuguese)
- Santa Catarina Agricultural Observatory. Available online: https://www.observatorioagro.sc.gov.br/areas-tematicas/producao-agropecuaria/paineis/ (accessed on 22 May 2025). (In Portuguese)
- Bulletin of Fiscal Economic Indicators. 2024. Available online: https://www.seplan.sc.gov.br/download/boletim-economico-dezembro-2024/?wpdmdl=81754&refresh=6799589d49d751738102941 (accessed on 22 May 2025). (In Portuguese)
- Acordi, J.; Simão, L.; Faraco, M.N.S.; Borgert, C.H.; Olivo, E.; Montedo, O.R.K.; Raupp-Pereira, F. Waste valorization of coal mining waste from a circular economy perspective: A Brazilian case study based on environmental and physicochemical features. Resour. Policy 2023, 80, 103243. [Google Scholar] [CrossRef]
- Canoas River and Pelotas River Basin Plan. 2023. Available online: https://www.aguas.sc.gov.br/jsmallfib_top/Comite%20Rio%20Canoas/Publicacoes/Relatorio-Sintese-Projeto-CBH-Canoas-e-Pelotas-2023.pdf (accessed on 24 June 2025). (In Portuguese)
- National Water Agency. Available online: https://www.gov.br/ana/pt-br (accessed on 22 May 2025). (In Portuguese)
- National Electric Energy Agency. Available online: https://www.gov.br/aneel/pt-br (accessed on 22 May 2025). (In Portuguese)
- Brazilian Institute of Geography and Statistics. Agricultural Census 2017. Available online: https://www.ibge.gov.br/en/statistics/economic/agriculture-forestry-and-fishing/21929-2017-2017-censo-agropecuario-en.html (accessed on 22 May 2025). (In Portuguese)
- National search for Continuous Household Sample, Food Security. 2023. Available online: https://biblioteca.ibge.gov.br/visualizacao/livros/liv102084.pdf (accessed on 22 May 2025). (In Portuguese)
- Santa Catarina’s Coal Mining Industry Union. 2024. Available online: https://carvaomais.com.br/o-siecesc/ (accessed on 22 May 2025). (In Portuguese).
- Brazil. Decree No. 85,206 of September 25, 1980. Available online: https://www.planalto.gov.br/ccivil_03/atos/decretos/1980/d85206.html (accessed on 22 May 2025). (In Portuguese)
- Volpato, S.B.; Menezes, C.T.B.; Silva, J.V.C. Environmental recovery of aquatic ecosystems in estuarine regions: Studies applied for the treatment of contaminated sediments by acid mine drainage in Urussanga River Basin, in Santa Catarina, Brazil. Sanit. Environ. Eng. 2017, 22, 313–316. [Google Scholar]
- Santana, W.O.; Pezente, D.P. Multivariate statistical analysis of underground waters in the Urussanga River basin. Technol. Environ. J. 2017, 23, 43–60. Available online: https://periodicos.unesc.net/ojs/index.php/tecnoambiente/article/view/3905/3657 (accessed on 25 June 2025). (In Portuguese).
- Galatto, S.L.; Simão, G.; Pereira, J.L.; Alexandre, N.Z. River improvement of the Urussanga River belonging to the Urussanga River Basin, South of Santa Catarina. In Environmental Geology: Technologies for Sustainable Development, 1st ed.; Cardozo, E.L., Ed.; Atena Editora: Ponta Grossa, Brazil, 2017; Chapter XII; pp. 174–189. [Google Scholar]
- Trein, H.A. The Anthropogenic Implication in the Quality of Groundwater Resources in the Urussanga River Basin. Ph.D. Thesis, Geosciences and Environment, São Paulo State University, Rio Claro, Brazil, 2008. [Google Scholar]
- Silva, L.F.O.; Vallejuelo, S.F.O.; Martinez-Arkarazo, I.; Castro, K.; Oliveira, M.L.S.; Sampaio, C.H.; Brum, I.A.S.; Leão, F.B.; Taffarel, S.R.; Madariaga, J.M. Study of environmental pollution and mineralogical characterization of sediment rivers from Brazilian coal mining acid drainage. Sci. Total Environ. 2013, 447, 169–178. [Google Scholar] [CrossRef]
- Duarte, A.L.; DaBoit, K.; Oliveira, M.L.S.; Teixeira, E.C.; Schneider, I.L.; Silva, L.F.O. Hazardous elements and amorphous nanoparticles in historical estuary coal mining area. Geosci. Front. 2019, 10, 927–939. [Google Scholar] [CrossRef]
- Dias, C.L.; Oliveira, M.L.S.; Hower, J.C.; Taffarel, S.R.; Kautzmann, R.M.; Silva, L.F.O. Nanominerals and ultrafine particles from coal fires from Santa Catarina, South Brazil. Int. J. Coal Geol. 2014, 122, 50–60. [Google Scholar] [CrossRef]
- Rodriguez-Iruretagoiena, A.; Vallejuelo, S.F.O.; Gredilla, A.; Ramos, C.G.; Oliveira, M.L.S.; Arana, G.; Diego, A.; Madariaga, J.M.; Silva, L.F.O. Fate of hazardous elements in agricultural soils surrounding a coal power plant complex from Santa Catarina (Brazil). Sci. Total Environ. 2015, 508, 374–382. [Google Scholar] [CrossRef] [PubMed]
- Vallejuelo, S.F.O.; Gredilla, A.; Boit, K.; Teixeira, E.C.; Sampaio, C.H.; Madariaga, J.M.; Silva, L.F.O. Nanominerals and potentially hazardous elements from coal cleaning rejects of abandoned mines: Environmental impact and risk assessment. Chemosphere 2017, 169, 725–733. [Google Scholar] [CrossRef] [PubMed]
- Brazil. Resolution No. 237, of December 19, 1997. Available online: https://www.ibama.gov.br/sophia/cnia/legislacao/MMA/RE0237-191297.PDF (accessed on 25 June 2025). (In Portuguese)
| Products | Urussanga | Canoas/Pelotas |
|---|---|---|
| Chicken (unit) | 13,848,927 | 12,471,196 |
| Pig (unit) | 81,742 | 610,874 |
| Cattle (unit) | 16,671 | 76,873 |
| Fish (ton) | 1045 | 2815 |
| Milk (liter) | 13,724,000 | 141,097,000 |
| Honey (kg) | 303,774 | 1,256,675 |
| Chicken egg (unit) | 55,860,000 | 183,948,000 |
| Quail egg (unit) | 78,504,000 | 32,256,000 |
| Environmental Impacts | Reference |
|---|---|
| . Depletion of several fishing resources near the mouth of the Urussanga River, including fish of the species Pomatomus saltatrix and Mugil liza. . Perception by the population of a 90% reduction in the diversity of species of fishing resources in the estuarine environment of the basin. . Impacts associated with coal mining effluents. | [15] |
| . Contamination of sediments collected in the basin estuary by the metals Iron (76,100 mg·L−1) and Manganese (115 mg·L−1). . Contamination associated with pollutant loads from coal mining, with emphasis on acid mine drainage. | [34] |
| . Water samples collected in the estuarine region of the Urussanga River with high acidity (pH between 4.0 and 6.0) and significant concentration of Iron (5.32 mg·L−1), Aluminum (6.2 mg·L−1), Manganese (0.61 mg·L−1) and Zinc (0.1 mg·L−1) . Contamination associated with pollutant loads from coal mining | [20] |
| . Forecast of unsustainable demands for water in quantity and quality in the basin, suggesting the urgent need for continuous management interventions, accompanied by large investments. . Prognosis resulting from predatory economic activities, including coal mining. | [22] |
| . Contamination of aquifers by iron and sulfate metals in regions with abandoned coal mine tailings deposits. | [35] |
| . Anthropogenic transformation of the basin area due to different activities, including coal mining, with the following results: slightly degraded basin area (39.47%); area with regular degradation (23.12%); degraded area (27.15%); very degraded area (9.02%) | [36] |
| . Contamination of the basin’s aquifers by metals and acidity (pH < 5) resulting from coal mining. . Percentage of aquifer area with high vulnerability to contamination = 38.53% | [37] |
Disclaimer/Publisher’s Note: The statements, opinions and data contained in all publications are solely those of the individual author(s) and contributor(s) and not of MDPI and/or the editor(s). MDPI and/or the editor(s) disclaim responsibility for any injury to people or property resulting from any ideas, methods, instructions or products referred to in the content. |
© 2025 by the authors. Licensee MDPI, Basel, Switzerland. This article is an open access article distributed under the terms and conditions of the Creative Commons Attribution (CC BY) license (https://creativecommons.org/licenses/by/4.0/).
Share and Cite
Geremias, R.; Masuhara, N. Water–Energy–Land–Food Nexus to Assess the Environmental Impacts from Coal Mining. Land 2025, 14, 1360. https://doi.org/10.3390/land14071360
Geremias R, Masuhara N. Water–Energy–Land–Food Nexus to Assess the Environmental Impacts from Coal Mining. Land. 2025; 14(7):1360. https://doi.org/10.3390/land14071360
Chicago/Turabian StyleGeremias, Reginaldo, and Naoki Masuhara. 2025. "Water–Energy–Land–Food Nexus to Assess the Environmental Impacts from Coal Mining" Land 14, no. 7: 1360. https://doi.org/10.3390/land14071360
APA StyleGeremias, R., & Masuhara, N. (2025). Water–Energy–Land–Food Nexus to Assess the Environmental Impacts from Coal Mining. Land, 14(7), 1360. https://doi.org/10.3390/land14071360