Abstract
Research on the supply–demand relationships of ecosystem services (ESs) in alpine pastoral regions remains relatively scarce, yet it is crucial for regional ecological management and sustainable development. This study focuses on the Sanjiangyuan Region, a typical alpine pastoral area and significant ecological barrier, to quantitatively assess the supply–demand dynamics of key ESs and their spatial heterogeneity from 2000 to 2020. It further aims to elucidate the underlying driving mechanisms, thereby providing a scientific basis for optimizing regional ecological management. Four key ES indicators were selected: water yield (WY), grass yield (GY), soil conservation (SC), and habitat quality (HQ). ES supply and demand were quantified using an integrated approach incorporating the InVEST model, the Revised Universal Soil Loss Equation (RUSLE), and spatial analysis techniques. Building on this, the spatial patterns and temporal evolution characteristics of ES supply–demand relationships were analyzed. Subsequently, the Geographic Detector Model (GDM) and Geographically and Temporally Weighted Regression (GTWR) model were employed to identify key drivers influencing changes in the comprehensive ES supply–demand ratio. The results revealed the following: (1) Spatial Patterns: Overall ES supply capacity exhibited a spatial differentiation characterized by “higher values in the southeast and lower values in the northwest.” Areas of high ES demand were primarily concentrated in the densely populated eastern region. WY, SC, and HQ generally exhibited a surplus state, whereas GY showed supply falling short of demand in the densely populated eastern areas. (2) Temporal Dynamics: Between 2000 and 2020, the supply–demand ratios of WY and SC displayed a fluctuating downward trend. The HQ ratio remained relatively stable, while the GY ratio showed a significant and continuous upward trend, indicating positive outcomes from regional grass–livestock balance policies. (3) Driving Mechanisms: Climate and natural factors were the dominant drivers of changes in the ES supply–demand ratio. Analysis using the Geographical Detector’s q-statistic identified fractional vegetation cover (FVC, q = 0.72), annual precipitation (PR, q = 0.63), and human disturbance intensity (HD, q = 0.38) as the top three most influential factors. This study systematically reveals the spatial heterogeneity characteristics, dynamic evolution patterns, and core driving mechanisms of ES supply and demand in an alpine pastoral region, addressing a significant research gap. The findings not only provide a reference for ES supply–demand assessment in similar regions regarding indicator selection and methodology but also offer direct scientific support for precisely identifying priority areas for ecological conservation and restoration, optimizing grass–livestock balance management, and enhancing ecosystem sustainability within the Sanjiangyuan Region.
1. Introduction
Ecosystem services (ESs) refer to the goods and services that natural systems provide to humans, which are an important basis for sustainable human development [1,2]. Rapid urbanization and population growth in the 21st century have caused serious damage to ecosystems [3]. Increasing human demand has led to a bias between Ecosystem Service Supply (ESS) and Ecosystem Service Demand (ESD) at spatial and temporal scales [4,5]. The imbalance between ecosystem service supply and demand has become more pronounced and larger in scale [6,7]. The ecosystem service supply and demand is a dynamic bridge between ecosystems and human society, and the balance between supply and demand is key to maintaining ecosystem function and has become one of the four focal themes in the field of ecology in the past 30 years [8,9]. In order to formulate rational ecosystem protection and restoration policies, it is crucial to clarify the pattern of the ecosystem service supply and demand, dynamic trends, and driving factors [10,11].
The Sanjiangyuan Region was formally established in 2000 and elevated to national-level status in 2003, marking the initiation of systematic ecological conservation efforts in the region. Following the implementation of the Master Plan for Ecological Protection and Construction in Sanjiangyuan [12], scientific research on ecosystem services within the Sanjiangyuan Region commenced in earnest. In early research, Liu et al. pioneered the assessment of fundamental ecosystem service values, such as carbon sequestration, oxygen release, and wetland ecosystem functions [13,14]. Subsequently, the research scope and depth expanded significantly. Liu et al. developed an ecosystem assessment framework specifically for Sanjiangyuan grasslands based on the UN Millennium Ecosystem Assessment (MA) framework [15]. This provided a scientific basis for monitoring interannual degradation trends following the implementation of large-scale ecological projects. Concurrently, advances in satellite remote sensing technology and ecosystem service assessment models facilitated more systematic and precise evaluations of critical ecosystem services in the Sanjiangyuan Region—including carbon storage, soil conservation, and water retention—as exemplified by research from Fu Hua’s team [16,17,18]. The approval and implementation of the Second Phase Plan for Ecological Protection and Construction in Qinghai’s Sanjiangyuan further propelled research advancements [19], particularly stimulating extensive discussion on ecological compensation mechanisms [20,21]. In recent years, with the rise of landscape ecology research, scholars have focused on constructing regional ecological security patterns. For instance, Wang et al. integrated methods including ecosystem service assessment, morphological spatial pattern analysis (MSPA), and landscape connectivity to identify ecological source areas [22]. They constructed ecological resistance surfaces and utilized the Linkage Mapper tool to identify ecological corridors, thereby systematically establishing the ecological security pattern for the Sanjiangyuan Region. In summary, over more than two decades of development, ecosystem service research in Sanjiangyuan has evolved from early explorations of single functions to comprehensive, systematic, and in-depth integrated assessments. These research endeavors, working in tandem with continuously strengthened national conservation policies, have collectively advanced the Sanjiangyuan Region’s historic transition from “emergency conservation” to “systematic governance.”
Located in the central region of the Qinghai–Tibet Plateau, the Sanjiangyuan Region is an important water supply area in China, and its ecological stability is directly related to the sustainable development of China and Asia. Since 1950, the population in the region has grown more than seven-fold. As a result, the demand for food, energy, and habitation has inevitably put excessive pressure on the ecosystem [23]. Current research on ecosystem service (ES) supply and demand predominantly focuses on urban or agricultural systems, with alpine pastoral regions receiving insufficient attention. As a representative high-altitude pastoral ecosystem, the Sanjiangyuan Region exhibits distinctive structural characteristics (e.g., grass–livestock equilibrium) and service requirements (e.g., forage yield), necessitating the development of a tailored assessment framework. Traditional ES demand assessments relying on generalized indicators such as population density inadequately capture pastoral core demands (e.g., livestock carrying capacity). This study innovatively employs the “sheep unit” metric to quantify forage supply and demand, integrating NPP remote sensing data to develop a grass–livestock balance model, thereby providing a more precise supply–demand matching methodology for alpine pastoral regions. Due to the special geographic location of the region creating a special supply and demand relationship between people and ecology, this paper selects four indicators—water yield (WY), grass yield (GY), soil conservation (SC) and habitat quality (HQ)—to study the changes in the demand and supply of ESs as well as the driving mechanism of ESs in the Sanjiangyuan Region. The InVEST model and RUSLE model in use are recognized by many scholars as mature and accurate models [24,25,26]. The integration of Geographically and Temporally Weighted Regression (GTWR) and Geodetector enables a closed-loop analysis framework characterized by ‘global screening, local modeling, and spatiotemporal validation’ [27]. This approach not only identifies core driving factors and their interactions but also elucidates the dynamic patterns of their impacts. It is particularly well-suited for investigating multiscale driving mechanisms within complex human–environment systems, such as the Tibetan Plateau region.
The Sanjiangyuan Region serves as a critical water source area in China, whose ecological stability directly impacts sustainable development across China and Asia. However, current assessments of ES supply–demand dynamics in alpine pastoral ecosystems remain fragmented, particularly regarding integrated quantification of key provisioning–regulating–supporting services (e.g., water–grass–soil–habitat linkages). This study provides a reference for indicator selection in ES supply–demand assessments for plateau pastoral ecosystems by proposing a novel methodological approach that addresses the gap in traditional methods’ inability to capture complex human–natural feedback mechanisms, such as the grass–livestock equilibrium in high-altitude rangelands. The innovations in this study are as follows: ① Considering the situation of the plateau pastoral areas in the Sanjiangyuan Region, the assessment of the food production services is not based on the traditional farmland. Instead, GY is used as an indicator to assess the food supply of the pastoral areas and study the balance of forage and livestock, which gives guidance to the ecological protection and restoration of the region. ② Using the revised HQ as an indicator enhances the accuracy of the results.
2. Study Area
The Sanjiangyuan Region (31°39′–36°12′ N, 89°45′–102°23′ E) is located in the southern part of Qinghai Province (Figure 1). Containing three national parks, it is an important source of ecological protection on the Qinghai–Tibet Plateau. It is the birthplace of the Yangtze River, Yellow River, and Lancang River, known as the “Chinese Water Tower”. The ecological health of the Sanjiangyuan Region is related to the socio-economic development of many downstream urban agglomerations, and has inestimable conservation value. The topography of the area is dominated by mountain plateaus and canyon landscapes, with alpine meadow areas in the central-western and northern parts, which consist of an important marsh wetland ecosystem in China. There are a large number of precious wild animals, including 17 species of national-level key protected animals and 52 species of second-level key protected animals. In recent years, the implementation of a series of environmental protection policies has achieved certain results in the management of grassland degradation and soil erosion in the Sanjiangyuan Region [28,29], but the problems of declining vegetation cover, bare ground, and continued expansion of desertified areas remain serious.
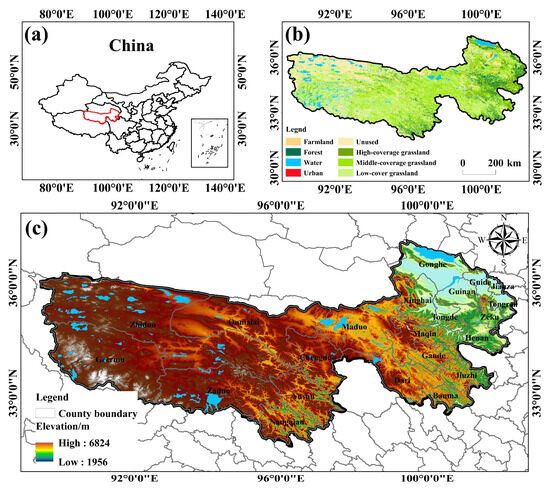
Figure 1.
Geospatial context of the Sanjiangyuan Region. (a) Location of the Sanjiangyuan Region within China; (b) land use/land cover (LULC) classification; (c) spatial distribution of elevation.
3. Materials and Methods
3.1. Data Sources and Preprocessing
The basic data of this study included boundary data, topographic data, land use data, climate and environmental data, socio-economic data, etc. (Table 1). The DEM data was from the spatial geographic data cloud, which was obtained by splicing the raw 90 m resolution elevation data of SRTMDEM. The slope gradient and slope length data were extracted on this basis. Boundary data, fractional vegetation cover data, and livestock density data (SU/km2) in the Sanjiangyuan Region were obtained from the Tibetan Plateau Data Center (TPDC). Land use data, population density data, and GDP density data were obtained from the Chinese Academy of Sciences (CAS) Resource and Environmental Sciences Data Platform, with a resolution of 1 km. Climate data was obtained from the National Earth System Science Data Center. The rest of the socio-economic data were from the Qinghai Provincial Statistical Yearbook and the Qinghai Provincial Water Resources Bulletin. Soil data were from the World Soil Database. The vegetation type map of China was obtained from the National Cryosphere Desert Science Data Center. NPP data was obtained from MODIS 17A3H data with a resolution of 500 m. Due to the missing data for 2000, data from 2001 was used instead. All datasets underwent preprocessing and were resampled to a 1 km spatial resolution. The preprocessing software was ArcGIS 10.8 and ENVI 5.

Table 1.
Data description.
3.2. Research Methodology
3.2.1. Selection of Indicators
According to the relationship between human and natural systems in the Sanjiangyuan Region, ecosystem service indicators were selected as follows: The indicator selection framework is depicted in Figure 2. Within the provisioning services, WY and GY were selected as representative indicators [30,31]; for supporting services, HQ was chosen as the indicator [32]; and SC served as the indicator for regulating services [33].
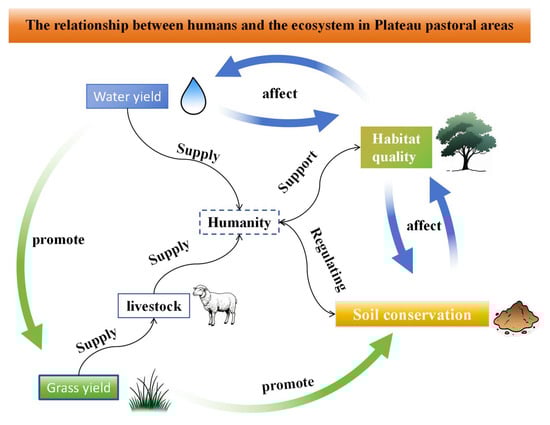
Figure 2.
Indicator selection description.
The novelty and superiority of selecting the combined indicators of WY, GY, SC, and HQ for studying ecosystem service supply–demand balance in the Sanjiangyuan Region lie in their direct relevance to pastoralists’ core livelihoods and national ecological security imperatives, while incorporating the fundamental mechanisms underpinning their sustainability [34]. This framework not only analyzes the supply and demand of GY (for humans) and WY (for regional security) but also innovatively integrates the inherent requirements of ecosystems for self-maintenance—represented by favorable SC and HQ conditions—into the balance framework [35]. It emphasizes that the sustainability of provisioning services (GY, WY) critically depends on the integrity of these underlying supporting/regulating services (SC, HQ). SC and HQ serve as critical constraints and health indicators for the long-term provision of GY and WY, making the analysis of their interrelationships (synergies/trade-offs) essential. Furthermore, these four indicators directly align with the core management objectives of the Three-River Headwaters National Park: water conservation, biodiversity protection, grassland ecosystem maintenance, and community co-development [36]. Consequently, this indicator combination constitutes a highly targeted, innovative, and robust analytical framework that provides strong support for evidence-based management decisions.
3.2.2. Quantifying Ecosystem Service Supply and Demand
WY was obtained using the Annual Water Yield module of the InVEST model, where potential evapotranspiration data were calculated via the Hargreaves method [37]. The “climate-z” parameter was set to 3.33 based on reference sources and its corresponding climate zoning classification [38]. Soil retention and erosion were quantified using the RUSLE model. Slope gradient was derived through the Slope tool in ArcGIS’s Spatial Analyst module. The slope factor (S) was subsequently calculated using the topographic algorithm established by Liu et al. [39]. Slope length was estimated via the Flow Accumulation function within ArcGIS’s Hydrology module, preceded by DEM depression filling, flow direction computation, and flow accumulation processing. The slope length factor (L) was then computed according to the method of Moore and Burch [40]. The LS factor was ultimately obtained by multiplying the S and L factors. Regional climate, vegetation, and other influencing factors would have a certain impact on HQ, and the same land use type in different regions provides different habitat environments and suitability for organisms. Therefore, it was necessary to construct HQ correction coefficients to correct the results of HQ in different grids. In this study, two indicators, FVC and NPP, were selected to construct HQ correction coefficients. FVC is an important factor affecting habitat, and NPP is the productive capacity of vegetation. Correcting HQ on the basis of these two indicators can clarify the spatial differences in habitat suitability capacity of the same secondary land classes and refine the HQ results of the InVEST model according to regional environmental conditions [41,42]. NPP and FVC capture HQ from functional and structural dimensions, respectively, and both are essential. The equal-weight integration of the two avoids subjective bias and minimizes subjective judgment biases. Although regional mean normalization may mask local extremes, in ecology, the significance of extreme values needs to be interpreted in their regional context. This study focuses on overall precision, making the adopted method well-founded.
Water demand was obtained from socio-economic data of farmland area, GDP density, and population density multiplied by the statistics of irrigation water use, water use per CNY 10,000 of GDP, and per capita water use with reference to the Qinghai Province Water Resources Bulletin. GY was estimated based on NPP [43], with root-to-shoot biomass ratios assigned according to grassland types [44]: 5.26 for temperate meadow steppe, 4.25 for temperate steppe, and 7.89 for both temperate desert steppe and temperate desert. A biomass-to-productivity conversion factor of 0.45 was applied [45]. The theoretical livestock carrying capacity was then calculated by dividing the estimated GY by the annual forage consumption per standard sheep unit (SU), with the final result expressed in sheep units (SUs). In order to obtain a more accurate spatial distribution of the actual livestock carrying capacity, grass demand is seen as the actual livestock carrying capacity. Based on the total livestock carrying capacity and registered household population data of county-level administrative units, the baseline value of per capita livestock carrying capacity in the county was calculated by the human–animal ratio method, and then the spatial distribution pattern of livestock carrying capacity was obtained by combining these results with the population density raster data. The final results for both GY and grass demand are in sheep units. A sheep unit refers to one sheep weighing 45 kg and consuming 1.8 kg of standard hay per day, or an equivalent number of other livestock. Various other livestock can be converted to sheep units using the conversion factor with reference to the “Calculation of Reasonable Livestock Carrying Capacity of Natural Grassland” issued by the Ministry of Agriculture. Following the methodology of Shi et al. [9], the demand for HQ was defined by the average HQ level across the study area.
The quantification methods and model parameters for the supply and demand of each ecosystem service indicator are shown in Table 2, and the specific research framework is shown in Figure 3.
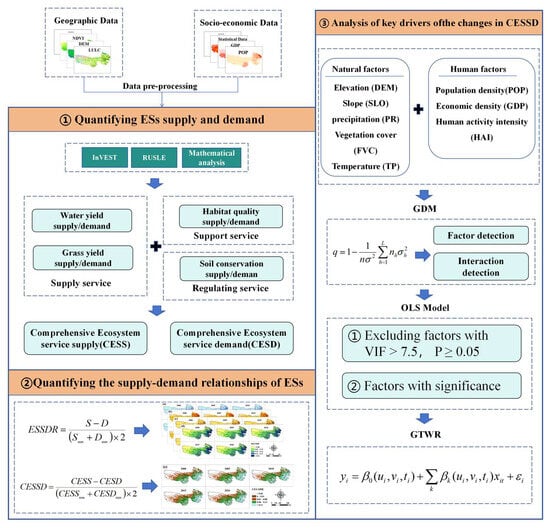
Figure 3.
Research framework. GDM, Geographic Detector Model. OLS Model, Ordinary Least Squares Model. GTWR, Geographically and Temporally Weighted Regression.
Table 2.
Introduction and methods for quantifying ecosystem services.
Table 2.
Introduction and methods for quantifying ecosystem services.
| Ecosystem Service | Calculation Formula | Explanation of the Index | |
|---|---|---|---|
| Water Yield (WY) | Water yield | : Annual Regional Water Yield (mm) : Annual Regional Precipitation (mm) : Annual Regional Actual Evapotranspiration (mm) | |
| Water demand | : Water Demand (mm) : Per Capita Water Use (mm) : Population Density : Water Use per CNY 10,000 GDP (mm) : GDP Density : Water Supply for Cultivated Land (km/mm) : Cultivated Land Area (km2) | ||
| Grass Yield (GY) | Theoretical carrying capacity | : Theoretical Livestock Carrying Capacity : Vegetation Net Primary Productivity (gC⋅m−2⋅a−1) : Grassland Biomass Conversion Coefficient : Belowground-to-Aboveground Biomass Ratio : Edible Proportion of Biomass : Grass Utilization Rate : Daily Livestock Forage Intake | |
| Livestock carrying capacity | : Actual Livestock Carrying Capacity : Population Density : Per Capita Livestock Carrying Capacity | ||
| Soil Conservation (SC) | Soil retention | : Soil Conservation Capacity (t⋅hm−2⋅a−1) : Rainfall Erosivity Factor : Soil Erodibility Factor : Slope Length and Steepness Factor : Cover-Management Factor : Support Practice Factor : Soil Loss : Annual Regional Precipitation : Slope Gradient : Flow Accumulation (0.1–0.2 km2) : Cell Size : Slope length Exponent, taken as 0.5. : Clay Gravel : Silt Gravel : Sand Gravel : Content of Soil Organic Carbon Derived from Soil Organic Matter | |
| Soil erosion | |||
| Habitat Quality (HQ) | HQ supply | : Habitat Quality of the x-th Patch in Land Use Type j : Habitat Stress Level of the x-th Patch in Land Use Type j : Habitat Suitability Level : Half-Saturation Constant : Adjusted Habitat Quality of Grid Cell x : Normalized Habitat Quality Adjustment Coefficient for Grid Cell x : Net Primary Productivity of Grid Cell x : Regional Mean Net Primary Productivity : Vegetation Coverage of Grid Cell x : Regional Mean Vegetation Coverage | |
| HQ demand | : Habitat Quality Demand Standard : Habitat Quality Supply Index of Grid Cell x : Study Area (km2) | ||
3.2.3. Ecosystem Service Supply–Demand Relationship
The ecosystem service supply–demand ratio (ESSDR) was employed to quantify the equilibrium between ecosystem service provision and human demand. This metric was calculated uniformly across four key services: WY, GY, SC, and HQ. Comprehensive ecosystem service indices were derived through equal-weighted aggregation of supply (Comprehensive Supply, CS) and demand (Comprehensive Demand, CD) across these four indicators. Subsequently, the comprehensive ecosystem service supply–demand ratio (CESSDR) was determined using an analogous computational framework to the individual ESSDR [46]. The resulting ESSDR and CESSDR were classified into four tiers using Jenks’ natural break classification method for visual representation. The computational formulas for ESSDR and CESSDR are defined as follows:
where is the supply volume of ecosystem services, is the demand volume of ecosystem services, is the maximum value of the supply volume, is the maximum value of the demand volume, is the supply volume of integrated ecosystem services, is the demand volume of integrated ecosystem services, is the maximum value of the supply volume, and is the maximum value of the demand volume. indicates that the capacity of ecosystem services exceeds demand; indicates that ecosystem services are in equilibrium between supply and demand; indicates that the ecosystem service supply exceeds demand. The comprehensive ecosystem service supply and demand ratio (CESSDR) remains the same.
To elucidate spatiotemporal trends in ES supply–demand relationships within the Sanjiangyuan Region, areas were classified based on the ESSDR into four categories: Supply–Demand-Deficit Zone (ESSDR < 0), Low-Supply Zone, Moderate-Supply Zone, and High-Supply Zone. Areas with ESSDR > 0 were further stratified using the Jenks natural break method. Threshold ranges for all five indicators are detailed in Table 3.
Table 3.
Supply and demand ratio grading standard.
3.2.4. Driver Selection and Factor Analysis Modeling
Changes in the supply and demand of ESs are influenced by a variety of factors, including but not limited to natural environmental factors, socio-economic factors, etc. [47]. In addition, population growth, urbanization, and economic development will also have a certain impact on the ecosystem. Under the comprehensive analysis, elevation (DEM), slope (SLO), annual precipitation (PR), fractional vegetation cover (FVC), and average annual temperature (TP) were selected as the natural environment factors, and population density (POP), GDP density (GDP), and human activity intensity (HAI) were selected as the human influence factors. The above data were preprocessed with a unified resolution of 1 km×1 km and a unified coordinate system of GCS_WGS_1984.
On the basis of the above, the Geographic Detector Model (GDM) was employed [48]. Its core is based on the assumption that the spatial distributions of independent and dependent variables are similar if the independent variable has an important effect on the dependent variable. Factor detection and interaction detection of the comprehensive ecosystem service supply and demand ratio (CESSDR) can reveal the explanatory power of each factor for its variation. Then, OLS global analysis was performed to screen the factors and estimate the regression coefficients of each independent variable by minimizing the sum of squares of errors to generate the strength of changes in the dependent variable and its mechanism of action in the prediction space [48]. To avoid the potential interference effect of collinearity on the results, improve the stability of coefficient estimation and the credibility of statistical tests, and enhance the interpretability and indirectness of the model, factors with variance inflation factor (VIF) > 7.5 and failed significance tests (p < 0.05) were excluded [49]. In the end, the screened factors were analyzed by GTWR modeling.
GTWR modeling quantified temporal and spatial non-stationarity in regression coefficients, clarifying associations between integrated ES supply–demand variations and contextual drivers at local scales [50]. The formula is as follows:
where is the spatiotemporal coordinates of the i sample, and are the latitude and longitude coordinates of the sample point, respectively; is the time; is the regression parameter of the sample point; is the random error term; and is the regression constant of the sample point, which is determined by the spatial location and time of the sample point .
4. Results
4.1. Changes in Spatial and Temporal Characteristics of Ecosystem Service Supply and Demand
The ecosystem service supply capacity of the Sanjiangyuan Region is in a fluctuating state, as shown in Figure 4. The spatial distribution of WY is characterized by “high in the south and low in the north”, with the high value located in the southeast of the region and the low value located in the north of the region, which is affected by the combination of DEM, FVC, and PR. From 2000 to 2020, the overall trend of WY is characterized by “growth first and then decline” (Figure 5a). The WY reaches the highest value in 2005, which is 581.31 × 10⁸ t, but the lowest value in 2005 is 354.75 × 10⁸ t. The spatial distribution of grass yield is characterized by “high in the southeast and low in the northwest”, with the high-value areas in the counties of Gonghe, Tongde, Zeku, and Henan. The overall change trend of GY during the period of 2000–2020 is consistent with that of WY; it shows an upward trend from 2000 to 2010 and reaches a maximum value of 139.18 × 10⁴ sheep units in 2010, followed by a downward trend after 2010 (Figure 5b). The spatial distribution of SC is characterized by “high in the southeast and low in the northwest” and is mainly affected by factors such as FVC and DEM, with high-value areas in Nangqian, Banma, and Jiuzhi counties. Low-value areas are located in the northwest of the region and in Maduo County. The trend of change is similar to that of WY, which rises to a maximum value (3.04 × 10⁸ t) from 2000 to 2005, but falls to a minimum value (2.12 × 10⁸ t) from 2005 to 2015 and begins to rise in 2020 (Figure 5c). HQ is distributed as “high in the southeast and low in the northwest”. High-value areas are located in the east of the region, such as in Henan, Tongde, Tongren, and Jianzha counties, while low-value areas are mainly located in the northwest of Ge’ermu, Zhiduo, and Qumalai counties (Figure 5d).
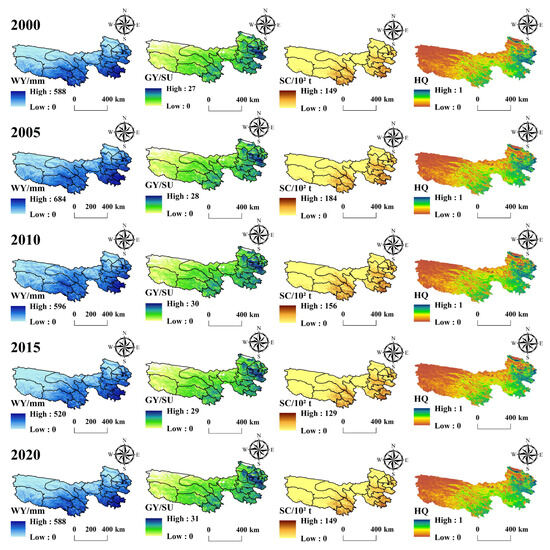
Figure 4.
Spatial pattern of ecosystem service supply in the Sanjiangyuan Region. WY, water yield. SY, grass yield. SC, soil conservation. HQ, habitat quality.
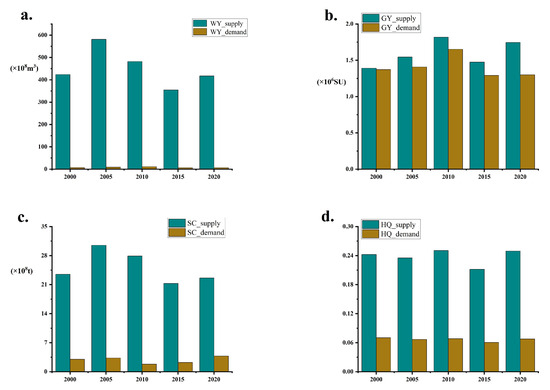
Figure 5.
Temporal changes in the supply and demand of ecosystem services from 2000 to 2020.
Changes in ecosystem service demand from 2000 to 2020 are detailed in Figure 6. Influenced by population distribution, areas of high water demand and forage demand are predominantly located in the southeastern region. The highest demand originates from Guide County, Jianzha County, Tongren City, and their adjacent counties in the eastern part of the study area. Due to the sparsely populated nature of the Sanjiangyuan Region, water demand is comparatively low. The peak water demand occurred in 2010 (1.111 billion tons), while the lowest demand was recorded in 2020 (695 million tons) (Figure 5a). The spatial distribution of forage demand resembles that of GY, exhibiting a pattern of “higher values in the southeast and lower values in the northwest,” with the eastern areas showing the highest demand. The maximum forage demand reached 1.65 million sheep units in 2020, whereas the minimum demand was 1.29 million sheep units in 2015 (Figure 5b). Regarding soil erosion, a decreasing trend was observed between 2000 and 2010, followed by an increasing trend from 2010 to 2020 (Figure 5c). Areas experiencing high erosion are primarily concentrated in Yushu City, Nangqian County, the northeastern part of Zaduo County, and the southeastern part of Zhiduo County. Most other areas within the region exhibit low erosion values. HQ demand showed minimal overall change throughout the 2000–2020 period (Figure 5d). Its spatial distribution is characterized by “higher demand in the northwest and lower demand in the southeast.” High-demand areas are primarily located in Zhiduo County and Golmud City.
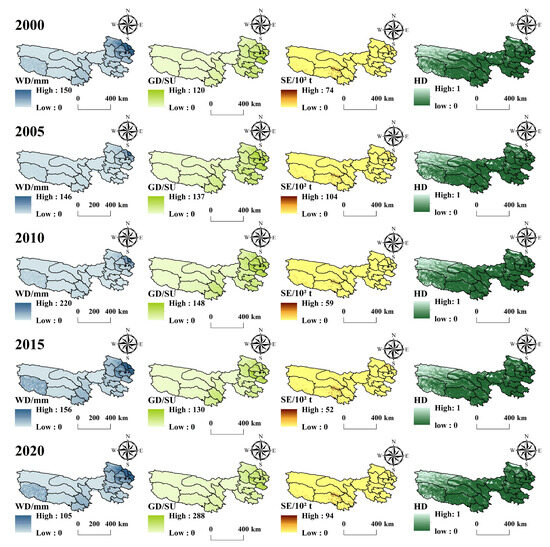
Figure 6.
Spatial pattern of ecosystem services demand in the Sanjiangyuan Region. WD, water demand. GD, grass demand. SE, soil erosion. HD, habitat quality demand.
4.2. Regional Ecosystem Service Supply and Demand
In terms of the spatial distribution of the supply and demand ratio (Figure 7a), the region with high GTWR values of the WY supply and demand ratio (supply exceeds demand) is mainly located in the southeastern region. The region with demand exceeding supply is mainly located in the northwestern region, which is characterized by high elevation, low precipitation, and low FVC, so that the region has high evaporation and poor water retention. High-value areas of the GY supply and demand ratio (Figure 7b) are located in central Maduo County and northwestern Zhiduo County, Zaduo County, and Ge’er’mu City, while areas where demand exceeds supply are mainly located in the east and south with dense population. The high-value area of the SC supply and demand ratio (Figure 7c) is mainly in the southeast, while fewer oversupply areas are in northwestern Ge’er’mu City, Zhiduo County, and Qumalai County. The high-value area of the HQ supply and demand ratio (Figure 7d) is in the southeast, while the oversupply areas are in northwestern Ge’er’mu City and northwestern Zhiduo County. High-value areas of the comprehensive ecosystem service supply and demand ratio (Figure 7e) are in the southeast, while the oversupply areas are in northwestern Ge’er’mu City, northwestern Zhiduo County, and Gonghe County.
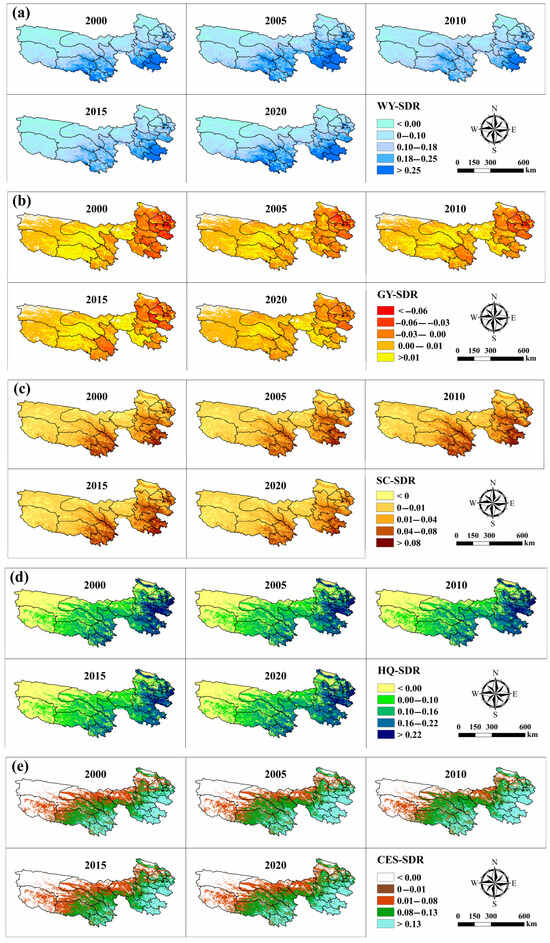
Figure 7.
Supply–demand ratio of various ecosystem services in the Sanjiangyuan Region. WY-SDR, water supply and demand ratio. GY, grass yield supply and demand ratio. SC-SDR, soil conservation supply and demand ratio. HQ-SDR, habitat quality supply and demand ratio. CES-CDR, comprehensive ecosystem service supply and demand ratio.
According to the temporal and spatial trends of the ecosystem service supply and demand ratio (Figure 8a), the overall ratio of WY follows the same trend as the supply of WY, increasing from 2000 to 2005, decreasing from 2005 to 2015, and then increasing in 2020. The regions where WY demand exceeds its supply (Figure 9a) shift to a downward trend from 2000 to 2010, decreasing from 15% to 9%. However, they are on an upward trend from 2010 to 2020, increasing from 9% to 15%. The overall supply and demand ratio of GY shows an upward trend from 2000 to 2020 (Figure 8b), with the greatest increase between 2015 and 2020, indicating that the Sanjiangyuan Region is gradually reaching the goal of forage and livestock balance. The proportion of areas where demand exceeds supply (Figure 9b) changes little from 2000 to 2010 and continues to be on a downward trend from 2010 to 2020, decreasing from 31% to 23%. The supply and demand ratio of SC is generally on an upward trend from 2000 to 2010 and reaches its highest value in 2010 (Figure 8c), but it is on a downward trend from 2010 to 2020 and falls to its lowest value in 2020. The over-demand area of SC (Figure 9c) is on a downward trend from 18% to 10% from 2000 to 2010 but increases from 10% to 17% from 2010 to 2020. The supply and demand ratio of HQ fluctuates from 2000 to 2020 (Figure 8d), showing a fluctuating upward trend from 2000 to 2010, declining to its lowest value from 2010 to 2015, but rising from 2015 to 2020. HQ has a large proportion of areas where supply exceeds demand (Figure 9d), with little overall change over the 2000–2020 period. The supply and demand ratio of the comprehensive ESs shows a fluctuating downward trend from 2000 to 2020, where the over-demand areas fluctuatingly decrease by 3%, and areas with lower supply have volatile changes (Figure 9e).
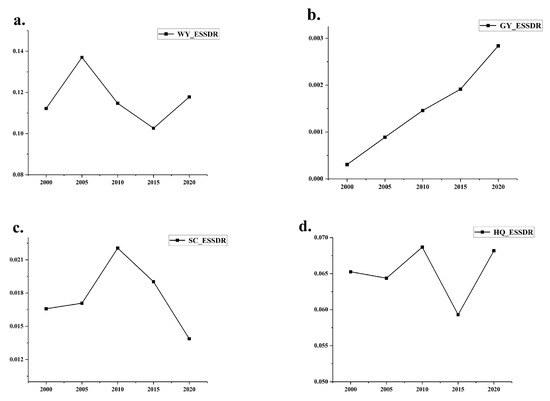
Figure 8.
Variation in the ecosystem service supply–demand ratio.
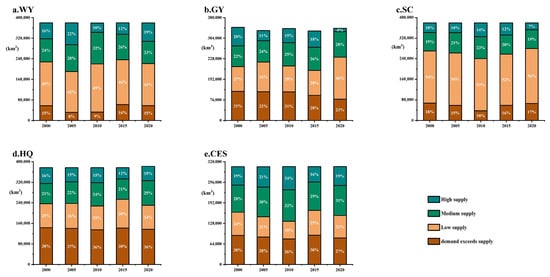
Figure 9.
Stacked chart of regional ecosystem service supply–demand ratios. CESs: comprehensive ESs.
4.3. Geographic Detection Results
4.3.1. Driving Factor Detection
Factor detector results are presented in Table 4. Changes in ecosystem service supply and demand in the Sanjiangyuan Region are jointly influenced by climate, fractional vegetation cover, topography, and human activities, and the top four indicators with the largest q values are FVC, PR, HAI, and DEM, with five-year average contribution rates of 0.72, 0.63, 0.38, and 0.29, respectively, which states the above indicators have the strongest explanatory power for the ecosystem service supply and demand ratio in the Sanjiangyuan Region. The contribution rate ranking of the eight indicators changes little from 2000 to 2010, but begins to change considerably from 2015, with the contribution rate of DEM slightly exceeding that of HAI, and SLO exceeding that of POP. The results show that meteorological factors and vegetation cover factors are the main factors influencing the spatial differentiation of the ecosystem service supply and demand ratio of the Sanjiangyuan Region.
Table 4.
Detection q value of the supply–demand ratio factor of comprehensive ecosystem services in the Sanjiangyuan Region.
4.3.2. Interaction Detection
According to the results of multi-factor interaction detection (Figure 10), changes in the ecosystem service supply and demand ratio are usually the result of a combination of socio-economic, topographic, and meteorological factors, indicating the complexity of the ecosystem service supply and demand relationship in the Sanjiangyuan Region. The interaction of FVC and PR has the strongest explanatory effect on the ecosystem service supply and demand ratio in the Sanjiangyuan Region. Meanwhile, FVC and PR also show a strong influence under mutual synergy with the rest of the factors. The interaction types of the top five indicators affecting the ecosystem service supply and demand ratio in the Sanjiangyuan Region are all two-factor enhancement indicators, and the top five interaction forces averaged over the five periods from 2000 to 2020 are as follows: PR ∩ FVC; HAI ∩ FVC; TP ∩ FVC; SLO ∩ FVC; and SLO ∩ FVC, DEM ∩ FVC. The above results show that the interaction between multiple factors enhanced the spatial differentiation of the ecosystem service supply and demand ratio in the Sanjiangyuan Region, and the spatial differentiation is formed by the interaction between multiple factors.
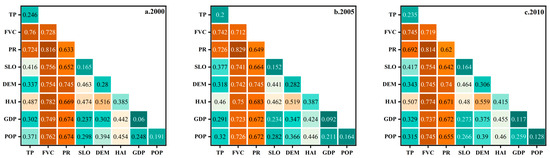
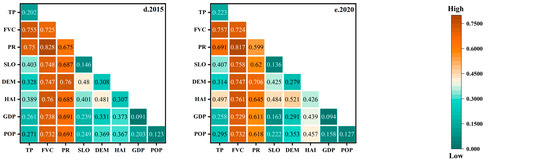
Figure 10.
The interaction situation of the selection indicators for the supply–demand ratio of ecosystem services.
4.4. GTWR Analysis Results
4.4.1. OLS Analysis
Before GTWR analysis is conducted, OLS is used to conduct multiple covariance tests on all standardized variables to effectively avoid high correlation between variables, and variables with a variance inflation factor (VIF) greater than 7.5 and those that fail to pass the significance test (p ≥ 0.05) are excluded. According to the results of the OLS test (Table 5), the variance inflation factor of all eight indicators is less than 7.5, but only three indicators, SLO, PR, and FVC, pass the significance test in all five periods.
Table 5.
OLS analysis results.
4.4.2. GTWR Analysis
According to the results of the regression analysis of the OLS model, the three explanatory variables of slope (OLS), PR, and FVC screened by the OLS model are selected for spatiotemporal geographically weighted regression analysis (Figure 11). Table 6 presents the parameter estimates of the GTWR model. In terms of goodness of fit, the R2 value exceeds 0.7, indicating satisfactory model performance. Furthermore, the negligible difference between R2 and adjusted R2 (as small as 0.0001) suggests an absence of redundant independent variables and demonstrates model robustness. The influence of each driving factor on the change of the ecosystem service supply and demand ratio in different periods in the Sanjiangyuan Region shows significant spatial differentiation, and the regression coefficients are generally suitably significant. The details are specifically shown as follows:
Figure 11.
Spatial and temporal heterogeneity of factors influencing the comprehensive ecosystem service supply–demand relationship.
Table 6.
Related parameters of GTWR.
- (1)
- SLO has both positive and negative effects on the change in the ecosystem service supply and demand ratio in the Sanjiangyuan Region. The positive high-value areas are in the northwest, such as in Zhiduo and Zaduo counties, and in the center, such as in Chindu, Maduo, and Dari counties. The negative areas are in Ge’er’mu City, Qumalai County, Gonghe County, and Guide County. The result shows that slope has a greater positive effect on the ecosystem service supply and demand ratio in the northwestern and central regions. From 2000 to 2020, the spatial distribution of the impact coefficients changes little overall, with the impact coefficients in the central region gradually declining and the negative areas in the central-west and northeast regions gradually expanding over time. Overall, the influence of slope on the change in the ecosystem service supply and demand ratio in the Sanjiangyuan Region remains relatively stable.
- (2)
- The influence of PR on changes in the ecosystem service supply and demand ratio in the Sanjiangyuan Region is overall predominantly positive, with high values located in the east and central-west, and negative values in the northwest. This result indicates that regions with higher precipitation generally have a good ecological foundation and improved ecological quality, which usually leads to ecosystem service supply exceeding its demand. Meanwhile, regions with low precipitation have high elevation and low FVC with poor survival conditions, leading to low ecosystem service supply capacity. From 2000 to 2020, the influence of the eastern region always shows an increasing trend. On the contrary, the influence of the central and western regions gradually decreases, and the negative regions change little overall.
- (3)
- The influence of FVC on the ecosystem service supply and demand ratio in the Sanjiangyuan Region is mainly positive, and the spatial component of the influence coefficient is similar to that of PR as a whole, with high-value areas in the eastern and central-western regions and negative-value areas in northwestern Zhiduo County and Ge’er’mu City. This result indicates that higher FVC usually provides higher ecological supply, making the ecosystem service supply exceed the ecosystem service demand. From 2000 to 2020, the influence of the central and western regions remains on an upward trend, and the eastern region changes little overall, which indicates that there is a continuous favorable trend of FVC in the central and western regions.
5. Discussion
5.1. Comparison with Existing Research on Ecosystem Service Supply and Demand
In terms of research methodology, the research method of this paper on ecosystem service supply and demand is mainly to select specific indicators for evaluation according to the study area, which is also one of the most commonly used methods. For example, Chen et al. select WY, food production, climate regulation, and recreation service indicators in the evaluation of ecosystem service supply and demand in Wuhan based on the importance of each ecosystem service indicator to Wuhan and data availability [51]. This method requires more data and is more complicated and not able to provide a comprehensive evaluation of the ecosystem service supply and demand in the region due to the limited data availability and the limitations of the research method. The Equivalent Factor Method is based on land use types [52] and has the advantage of being relatively easy to use for the calculation and comprehensive assessment of regulating, supporting, supplying, and cultural services, but this method lacks a certain degree of accuracy compared to analyzing individual indicators. In this study, the calculation of the ecological service demand is considered specifically and has a higher accuracy than calculations using human activity indicators such as population density [53]. The superiority of the methodology presented in this study is further evidenced in two key aspects: (1) Indicator Selection: A regionally tailored indicator system was constructed, meticulously aligned with the core functions and demands of the Sanjiangyuan Region as China’s “Water Tower,” an alpine pastoral area, and an ecological security barrier. This approach discards conventional indicators (e.g., cropland-based food production) ill-suited to this specific context. (2) Driving Mechanism Analysis: An integrated GDM-OLS-GTWR framework was employed, enabling core driver identification, interaction detection, and spatiotemporal dynamic elucidation [54]. These methodological refinements establish the distinct advancement of the proposed approach for ecosystem service supply–demand assessment in alpine pastoral regions, effectively addressing limitations inherent in traditional methods—such as indicator mismatch, imprecise quantification of core demands, and inadequate depth in mechanistic analysis.
In terms of research results, there are fewer studies on the ecosystem service supply and demand in the Sanjiangyuan Region, and the existing studies can only make certain comparisons and evaluations of ecosystem service supply. Li et al. study the WY of the Sanjiangyuan Region from 2000 to 2015 based on the SWAT model (Soil and Water Assessment Tool) [55], and the four-year average WY is 452 × 108 t. This paper is consistent with their study. Although the results are consistent in terms of total amount, there is a slight difference in the trend. The study of Li et al. shows WY is in an upward trend during the period of 2000–2010, while this paper shows a fluctuating upward trend. This divergence arises because the SWAT model more rigorously accounts for deep soil percolation losses, rendering it better suited for short-term hydrological response simulation [56], whereas the InVEST model derives WY directly from precipitation–actual evapotranspiration balances [57], making it inherently more appropriate for climate-driven trend assessments. Li’s paper evaluates the value of SC services, which also shows a trend of “high in the southeast and low in the northwest”. Yang studies the main ESs of the Sanjiangyuan based on the InVEST model [38], and the results also indicate that the spatial distribution of WY is “high in the south and low in the north”, and that of soil retention is “high in the southeast and low in the northwest”. The study also shows that the trend of HQ in the Sanjiangyuan Region is “increasing first and decreasing later”, which is consistent with the results of this paper. According to Mo and Ma et al.’s study, GY in the Sanjiangyuan Region shows a trend of “high in the southeast and low in the northwest”, and the overloaded areas are in the eastern densely populated areas, which is consistent with the results of this paper. Although HQ is based on different methods, the results are mostly the same. This is due to the sparsely populated and low-exploitation nature of the Sanjiangyuan Region, and its distribution is mostly consistent with the distribution of NPP and FVC [58].
5.2. Analysis of Factors Influencing the Change in the Ecosystem Service Supply and Demand Ratio in the Sanjiangyuan Region
Combined with the results of four indicators of the ecosystem service supply and demand, the changes in the ecosystem service supply and demand ratio in the Sanjiangyuan Region are mainly influenced by the natural environment and climate. The sequential average annual precipitation in the Sanjiangyuan Region during 2000–2020 was 420 mm, 499 mm, 473 mm, 392 mm, and 420 mm, respectively. The synchronous fluctuations between precipitation patterns and WY supply–demand ratios demonstrate that regional water resource availability is primarily governed by natural climatic factors rather than anthropogenic water consumption. Given that grasslands dominate the land cover of Sanjiangyuan, FVC effectively reflects variations in GY, thereby serving as a core factor regulating three critical ecosystem services: SC, GY, and HQ. Between 2000 and 2020, the regional mean FVC values were 0.60, 0.63, 0.66, 0.59, and 0.67, respectively. The spatiotemporal dynamics of FVC exerted dominant influences on the supply–demand patterns of these ecosystem services. The anthropogenic factors affect the supply and demand ratio through animal husbandry. This is different from most supply and demand studies in urban areas, where the main driving factors of changes in the supply and demand ratio are socio-economic factors [5,59], which is due to the special geographic situation and policies of the Sanjiangyuan Region. The Sanjiangyuan Region is sparsely populated, with limited industrialization and urbanization, and the production mode is dominated by animal husbandry. These features create a pattern of low demand for various ESs but high grass demand in the region. Under the implementation of a series of policies, the interference of human activities in the Sanjiangyuan Region has seen a further decline. For example, the Qinghai Sanjiangyuan Nature Reserve Ecological Protection and Construction Master Plan has been established and has become well-known [12,19]. During the period of implementing this planning project, Maqin County mentions in the project background that there is serious grassland degradation and overloading of livestock in the reserve, which seriously affects the production and local herders’ daily life. Therefore, effective measures should be applied to reduce livestock, pause and forbid grazing, and protect and manage the ecological environment, which are the keys to restoring the ecological function of the whole county [60]. These measures make the supply and demand ratio of GY in the Sanjiangyuan Region continue to rise, gradually keeping the forage–livestock balance.
Furthermore, interaction detection using the geographical detector revealed that the interaction between HAI and FVC exhibited a synergistic enhancement effect, significantly increasing their explanatory power. In 2005, the State Council approved the implementation of the Master Plan for Ecological Protection and Construction of the Sanjiangyuan Nature Reserve in Qinghai Province. After eight years of implementation, the trend of grassland degradation was preliminarily curbed, and aquatic and wetland ecosystems showed some recovery [61]. When implementing this plan, the Maqin County government highlighted in the project background that the reserve suffered from severe grassland degradation and livestock overloading. Implementing effective measures such as livestock reduction, rotational grazing, and grazing bans was deemed crucial for protecting and managing the county’s ecological environment and restoring its ecological functions. This underscores the detrimental impacts of livestock grazing on the grassland ecosystem in this region. In 2010, Qinghai Province initiated a pilot program for ecological compensation, issuing the Trial Measures for the Ecological Compensation Mechanism in Sanjiangyuan. This established 11 ecological compensation policies, subsequently launching initiatives such as skills training and employment transfer compensation for farmers and herders, as well as grass–livestock balance policies. In 2013, the State Council approved the implementation of the Second-phase Planning for Ecological Protection and Construction of Sanjiangyuan in Qinghai Province. As a continuation, expansion, and enhancement of the previous phase, its primary objectives included protecting forest and grassland vegetation, curbing the trend of desertification, enhancing water conservation and source water retention capacities, and improving the condition of wetland ecosystems and wildlife habitats. In 2019, the Qinghai Provincial Department of Ecology and Environment completed a comprehensive assessment of the mid-term ecological effectiveness of the second-phase project. This assessment employed an integrated approach combining ground observations, remote sensing monitoring, and model simulations. The results indicated that since the implementation of the second-phase project, the ecological environment of the Sanjiangyuan Region exhibited a trend of “overall stability, characterized by partial improvement alongside localized degradation.” Notably, the area of the grassland ecosystem decreased by 167.10 km2 during this period.
5.3. Limitations and Future Research Directions
(1) In this study, due to the availability of data and the limitations of the current research on quantifying the demand for regional ESs, the indicators that have more significant influences in the Sanjiangyuan Region are not sufficient enough to comprehensively evaluate the ecosystem service supply and demand in the region from the four aspects of supply services, regulating services, cultural services, and supporting services. (2) The quantification of forage–livestock balance in plateau pastoral areas has always been a complex problem. In this paper, the use of NPP directly assesses GY while ignoring the impacts of artificial pastures and other herbivorous wildlife and simplifying the complexity of the forage–livestock balance problem. In this case, the actual amount of grass consumption may be underestimated. (3) The adaptability of the RUSLE model and InVEST model to the complex topography and climate of alpine regions has yet to be demonstrated. Specifically, permafrost dynamics and snowmelt processes may significantly alter WY simulations, while intensified freeze–thaw cycles could substantially amplify the soil erosion modulus and sediment fluxes [62]. (4) When allocating county-level livestock totals based on population density, we implicitly assumed spatial homogeneity between grazing pressure and human population distribution. However, in Sanjiangyuan’s pastoral regions, herders frequently concentrate livestock in high-elevation townships with low population density, potentially causing population density to underestimate actual grazing pressure hotspots.
Based on the above issues, the indicator system should be improved in future research to further expand the scope of indicators of ESs and add indicators such as carbon sequestration and climate regulation to comprehensively reflect the ecosystem service supply and demand in the Sanjiangyuan Region and provide more basis for comprehensive assessment and management. In the method of accurate forage–livestock balance assessment, factors such as the construction and management of artificial pastures, the growth of pasture grasses in different seasons, and the herbivory demand of wild animals are taken into consideration when assessing the forage–livestock balance, so as to establish a more accurate forage–livestock balance assessment model and to more accurately grasp the actual relationship between forage–livestock and supply–demand. This study only analyzes the driving factors of CESSD changes at the grid scale. The mechanisms of driving CESSD should be further studied at the provincial, county and district levels, which would enable the driving factors to be analyzed at different spatial scales and help to reveal the correlations between different scales.
6. Conclusions
- (1)
- From 2000 to 2020, the supply of WY, GY, and SC services in the Sanjiangyuan Region fluctuated greatly, and there were no obvious changes in HQ. The supply of the four ecosystem service indicators shows a spatial distribution pattern of “high in the southeast and low in the northwest”.
- (2)
- From 2000 to 2020, water and grass demand in the Sanjiangyuan Region decreased, and soil erosion and HQ demand changed little. Water demand and grass demand mainly show a spatial distribution of “high in the southeast and low in the northwest”, with high soil erosion areas in central-western Zaduo County and southeastern Zhiduo County. The areas of high HQ demand are in northwestern Ge’er’mu City and Zhiduo County.
- (3)
- The supply and demand ratios of WY, SC, and HQ in the Sanjiangyuan Region fluctuated considerably over the five years, with WY increasing from 2000 to 2020. SC remains on an upward trend from 2000 to 2010 and on a downward trend from 2010 to 2020. HQ generally changes little. The supply and demand ratio of GY keeps increasing from 2000 to 2020, indicating that the policy of forage–livestock balance in the Sanjiangyuan Region has attained certain achievements. The overall supply of WY exceeds demand, with the areas of GY in short supply and excess demand in the southeast, and the areas of SC and HQ in short supply and excess demand in the northwest.
- (4)
- Natural environmental factors are the main factors affecting the supply and demand ratio in the Sanjiangyuan Region, and the top four indicators with the largest q values are FVC, PR, HAI, and DEM. According to the change in q values, the explanatory power of HAI for the ecosystem service supply and demand ratio is increasing.
- (5)
- According to the analysis results of the GTWR model, FVC and PR have positive effects on the ecosystem service supply and demand ratio in the Sanjiangyuan Region, showing a trend of continuous increase. The positive effects of SLO on the ratio of ecosystem service supply and demand in the Sanjiangyuan Region continue to weaken, and the negative effects gradually increase. The high values of FVC and PR are in the east and central-west, and the negative effects are in a small number of northwestern areas. The areas of positive effects of SLO are in the northwest and central-east regions, and the areas of negative effects are in the southeast and central-west regions.
Author Contributions
Conceptualization, W.G. and Q.S.; methodology, W.G.; software, W.G.; validation, W.G., Q.S. and H.Z.; formal analysis, S.W. and W.G.; investigation, J.D.; resources, Q.S.; data curation, W.G.; writing—original draft preparation, W.G.; writing—review and editing, W.G.; visualization, W.G.; supervision, Q.S.; project administration, Q.S.; funding acquisition, Q.S. All authors have read and agreed to the published version of the manuscript.
Funding
This research was funded by Qinghai Provincial Basic Research Programme Project: Study on the Spatiotemporal Evolution of Ecosystem Service Functions and Identification Methods of Key Areas for Ecological Management in the Yellow River Source Region over the Past 30 Years (2024-ZJ-953); Qinghai University Graduate Students’ Scientific Research and Practical Innovation Project: Research on the Coupled Effects of Land Use and Climate Change on the Ecological Health of the Yellow River Source Region (qdkc-2554).
Data Availability Statement
Data are contained within the article.
Conflicts of Interest
The authors declare no conflict of interest.
Abbreviations
The following abbreviations are used in this manuscript:
| ES | Ecosystem Service |
| WY | Water Yield |
| GY | Grass Yield |
| SC | Soil Conservation |
| HQ | Habitat Quality |
| DEM | Elevation |
| SLO | Slope |
| PR | Annual Precipitation |
| FVC | Fractional Vegetation Cover |
| TP | Average Annual Temperature |
| HAI | Human Activity Intensity |
| POP | Population Density |
| GDP | GDP Density |
References
- Costanza, R.; d’Arge, R.; de Groot, R.; Farber, S.; Grasso, M.; Hannon, B.; Limburg, K.; Naeem, S.; O’Neill, R.V.; Paruelo, J.; et al. The value of the world’s ecosystem services and natural capital. Nature 1997, 387, 253–260. [Google Scholar] [CrossRef]
- Jian, Z.; Sun, Y.; Wang, F.; Zhou, C.; Pan, F.; Meng, W.; Sui, M. Soil conservation ecosystem service supply-demand and multi scenario simulation in the Loess Plateau, China. Glob. Ecol. Conserv. 2024, 49, e02796. [Google Scholar] [CrossRef]
- Reid, W.V. Millennium Ecosystem Assessment: Ecosystems and Human Well-Being: Synthesis; Island Press: Washington, DC, USA, 2005. [Google Scholar]
- Kroll, F.; Müller, F.; Haase, D.; Fohrer, N. Rural-urban gradientanalysis of ecosystem services supply and demand dynamics. Land Use Policy 2012, 29, 521–535. [Google Scholar] [CrossRef]
- Wen, Y.; Li, M.; Chen, Z.; Li, W. Changes in ecosystem services supply-demand and key drivers in Jiangsu Province, China, from 2000 to 2020. Land Degrad. Dev. 2024, 35, 4666–4681. [Google Scholar] [CrossRef]
- Liu, B.; Pan, B.; Qi, Y.; Guan, X.; Li, J. Land use and land cover change in the Yellow River Basin from 1980 to 2015 and its impact on the ecosystem services. Land 2021, 10, 1080. [Google Scholar] [CrossRef]
- Fang, Y.; Cao, L.; Tang, Q.; Zhang, L.; Guo, X. Assessment and driving mechanisms for the supply–demand of ecosystem services in the central plains urban agglomeration, China: A water-soil-food-carbon nexus perspective. Ecol. Indic. 2025, 171, 113218. [Google Scholar] [CrossRef]
- Gai, Y.; Zhao, H.; Wang, F. Changes and Driving Factors of Ecosystem Services Supply and Demand in the Yellow River Basin. Environ. Sci. 2025, 46, 3672–3680. [Google Scholar] [CrossRef]
- Shi, Y.; Shi, D.; Zhou, L.; Fang, R. Identification of ecosystem services supply and demand areas and simulation of ecosystem service flows in Shanghai. Ecol. Indic. 2020, 115, 106418. [Google Scholar] [CrossRef]
- Ding, T.; Chen, J.; Fang, L.; Juan, J.; Fang, Z. Urban ecosystem services supply-demand assessment from the perspective of the water-energy-food nexus. Sustain. Cities Soc. 2023, 90, 104401. [Google Scholar] [CrossRef]
- Mashizi, A.K.; Sharafatmandrad, M. Investigating tradeoffs between supply, use and demand of ecosystem services and their effective drivers for sustainable environmental management. J. Environ. Manag. 2021, 289, 112534. [Google Scholar] [CrossRef]
- State Council (People’s Republic of China). Comprehensive Plan for Ecological Protection and Construction of the Sanjiangyuan Nature Reserve in Qinghai; State Council (People’s Republic of China): Qinghai, China, 2005; pp. 1–54. [Google Scholar]
- Liu, M.; Li, D.; Wen, Y. The Values of CO2 fixation and O2 release by vegetationecosystem in Sanjiangyuan region. Ecol. Environ. 2006, 3, 594–597. [Google Scholar] [CrossRef]
- Liu, M.; Li, D.; Wen, Y. Study on function and conservation of wetlands ecosystem in Sanjiangyuan region. Ecol. Sci. 2006, 1, 64–68. [Google Scholar]
- Liu, J.; Shao, Q.; Fan, J. The integrated assessment indicator system of grasslandecosystem in the Three-River Headwaters reqion. Geogr. Res. 2009, 28, 273–283. [Google Scholar]
- Zhang, Y. Assessment of Water Conservation Ecosystem Services in the Sanjiangyuan Region (1980–2005). Ph.D. Thesis, Capital Normal University, Beijing, China, 2012. [Google Scholar]
- Wen, L. Assessment of Soil Conservation Function in the Sanjiangyuan Ecosystem Using the InVEST Model. Ph.D. Thesis, Capital Normal University, Beijing, China, 2012. [Google Scholar]
- Yang, Y. Assessment of Carbon Storage and Sequestration Potential in the Sanjiangyuan Region Ecosystem. Ph.D. Thesis, Capital Normal University, Beijing, China, 2012. [Google Scholar]
- Qinghai Provincial People’s Government. Qinghai Three-River-Source Ecological Protection and Construction Phase II Project Plan; Qinghai Provincial People’s Government: Xining, China, 2013.
- Liu, J.; Wang, Q. AcFcounting methods research for ecological compensation standard in the Three River Headwaters Region based on supply cost. Res. Environ. Sci. 2017, 30, 82–90. [Google Scholar] [CrossRef]
- Li, F.; Zhu, F.; Di, Y.; Chao, S.; Yue, Q. Estimating ecological compensation payments in the Thre River Headwaters Region based on environmental protection cost. Res. Environ. Sci. 2017, 30, 91–100. [Google Scholar] [CrossRef]
- Wang, X.; Zhu, M.; Zhang, X.; Ma, J.; Zhou, J.; Cheng, T.; Zhen, Y.; Tu, Y.; Yao, W.; Ma, J. Ecological security pattem construction of the Three-river Source Region based on Source-Resistance-Corridor. Acta Ecol. Sin. 2024, 44, 4609–4623. [Google Scholar] [CrossRef]
- Xi, C.; Chi, Y.; Qian, T.; Zhang, W.; Wang, J. Simulation of Human Activity Intensity and Its Influence on Mammal Diversity in Sanjiangyuan National Park, China. Sustainability 2020, 12, 4601. [Google Scholar] [CrossRef]
- Cong, W.; Sun, X.; Guo, H.; Shan, R. Comparison of the SWAT and InVEST models to determine hydrological ecosystem service spatial patterns, priorities and trade-offs in a complex basin. Ecol. Indic. 2020, 112, 106089. [Google Scholar] [CrossRef]
- Yu, Y.; Sun, X.Q.; Wang, J.; Zhang, J. Using InVEST to evaluate water yield services in Shangri-La, Northwestern Yunnan, China. Environ. Sci. 2022, 10, e12804. [Google Scholar] [CrossRef]
- Hao, S.; Xie, K.; Lei, S.; Wang, X.; Yan, X. Soil erosion characteristics in an earthquake-impacted mountainous basin based on RUSLE model: Implications for geohazards. J. Soils Sediments 2023, 23, 3857–3878. [Google Scholar] [CrossRef]
- Xu, C.; Chen, Y.; Yang, X.; Chen, Z.; Dong, W.; Lin, X. Integrating Geodetector and GWR Models to Explore Spatiotemporal Variation in Human-Environment Interactions on the Qinghai-Tibet Plateau. Sci. Total Environ. 2021, 805, 150327. [Google Scholar] [CrossRef]
- Zhai, X.; Yan, C.; Xing, X.; Jia, H.; Wei, X.; Feng, K. Spatial-temporal changes and driving forces of aeolian desertification of grassland in the Sanjiangyuan region from 1975 to 2015 based on the analysis of Landsat images. Environ. Monit. Assess. 2020, 193, 2. [Google Scholar] [CrossRef] [PubMed]
- Zhu, P.; Liu, G.; He, J. Spatio-temporal variation and impacting factors of NPP from 2001 to 2020 in Sanjiangyuan region, China: A deep neural network-based quantitative estimation approach. Ecol. Inform. 2023, 78, 102345. [Google Scholar] [CrossRef]
- Gao, X.; Feng, Q.; Li, Z.; Deng, X.; Xue, J.; Zhang, B. Spatio-temporal paltemm and key inluencing factors of water conservalion value in the Three-River Source region. Acta Ecol. Sin. 2024, 44, 7074–7086. [Google Scholar] [CrossRef]
- Lv, X.; Wang, J.; Kang, H.; Zhao, Q.; Han, X.; Wang, Y. Spatio-temporal Changes of Grassland Production Based onMODIS NPP in the Three-River Source Regionfrom 2006 to 2015. J. Nat. Resour. 2017, 32, 1857–1868. [Google Scholar] [CrossRef]
- Liu, X.; Zhen, S.; Qiao, Z. Dynamic simulation ofland use change and habitat quality in the ThreeRiver Source Region based on the PLUS-InVEST models. Arid Zone Res. 2025, 42, 1080–1092. [Google Scholar] [CrossRef]
- She, H.; Li, P.; Wang, X.; Xiao, L.; Wang, Z.; Yang, X.; Ning, J.; Zhang, Z. Spatial and temporal changes and its driving factors of soil and waterconservation services in Sanjiangyuan region during 2000–2020. Bull. Soil Water Conserv. 2025, 45, 286–295. [Google Scholar] [CrossRef]
- Han, Z.; Song, W.; Deng, X.; Xu, X. Trade-Offs and Synergies in Ecosystem Service within the Three-Rivers Headwater Region, China. Water 2017, 9, 588. [Google Scholar] [CrossRef]
- Xue, J.; Li, Z.; Feng, Q.; Gui, J.; Zhang, B. Construction of ecological conservation pattern based on ecosystem services of Three River Headwaters, Western China. Glob. Ecol. Conserv. 2023, 44, e02491. [Google Scholar] [CrossRef]
- Zhen, D.; Hao, S.; Lv, L.; Wang, Y.; Wang, H. Spatial-temporal change and trade-off/synergy relationshipsamong multiple ecosystem services inThree-River-Source National Park. Geogr. Res. 2020, 39, 64–78. [Google Scholar] [CrossRef]
- Peng, S.; Ding, Y.; Liu, W.; Li, Z. 1 km monthly temperature and precipitation dataset for China from 1901 to 2017. Earth Syst. Sci. Data 2019, 11, 1931–1946. [Google Scholar] [CrossRef]
- Yang, L. Research on Service Trade-Off and Synergy of the Main Ecosystems in the Sanjiangyuan Region Based on the Invest Model. Master’s Thesis, Shanghai Normal University, Shanghai, China, 2020. [Google Scholar]
- Liu, B.; Nearing, M.; Shi, P.; Jia, Z. Slope length effection soil loss for steep slopes. Soil Soc. Am. J. 2000, 64, 1759–1763. [Google Scholar] [CrossRef]
- Moore, I.D.; Burch, G.J. Physical basis of the length-slope factor in the Universal Soil Loss Equation. Soil Sci. Soc. Am. J. 1986, 50, 1294–1298. [Google Scholar] [CrossRef]
- Ma, X. Research on the Trade-Off/Synergy Relationship and Evolution of Supply and Demand Pattern of Ecosystem Services in Qinghai Province. Master’s Thesis, Qinghai Normal University, Xining, China, 2024. [Google Scholar]
- Wang, Y.; Quan, D.; Zhu, W.; Lin, Z.; Jin, R. Habitat Quality Assessment under the Change of Vegetation Coverage in the Tumen River Cross-Border Basin. Sustainability 2023, 15, 9269. [Google Scholar] [CrossRef]
- Yan, L.; Kong, L.; Zhang, L.; Ouyang, Z.; Hu, J. The definition, methods and key issues of grassland ecosystem carrying capacity. Chin. J. Eco-Agric. 2022, 30, 1228–1237. [Google Scholar] [CrossRef]
- Piao, S.; Fang, J.; He, J.; Xiao, Y. Grassland vegetation biomass and its spatial distribution pattern in China. J. Plant Ecol. 2004, 28, 491–498. [Google Scholar] [CrossRef]
- Fang, J.Y.; Liu, G.H.; Xu, S.L. The Carbon Cycle of China’s Terrestrial Ecosystems and Its Global Significance; China Environmental Science Press: Beijing, China, 1996; pp. 129–139. [Google Scholar]
- Tu, W.; Zhao, W.; Liu, Y.; Zhang, Z. Ecological restoration zoning on the Loess Plateau based on the supply and demand of ecosystem services. Acta Ecol. Sin. 2024, 44, 9695–9707. [Google Scholar] [CrossRef]
- Wang, G. Analysis of the Influence of Meltwater Runoff During the Spring Thawing Period Under Freeze-Thaw Action on the Erosion of Sandy Soil Slopes. Ph.D. Thesis, Heilongjiang University, Harbin, China, 2023. [Google Scholar]
- Wang, H.; Liu, Y.; Zhang, B.; Xu, S.; Jia, K.; Hong, S. Analysis of driving forces of urban land expansion in Wuhan metropolitan area based on Logistic-GTWR model. Trans. Chin. Soc. Agric. Eng. 2018, 34, 248–257. [Google Scholar] [CrossRef]
- Zhang, Y.; Liu, B.; Sui, R. Evaluation and Driving Determinants of the Coordination between Ecosystem Service Supply and Demand: A Case Study in Shanxi Province. Appl. Sci. 2023, 13, 9262. [Google Scholar] [CrossRef]
- Haung, B.; Wu, B.; Barry, M. Geographically and temporally weighted regression for modeling spatio-temporal variation in house prices. Int. J. Geogr. Inf. Sci. 2008, 24, 383–401. [Google Scholar] [CrossRef]
- Chen, F.; Li, L.; Niu, J.; Lin, A.; Chen, S.; Hao, L. Evaluating Ecosystem Services Supply and Demand Dynamics and Ecological Zoning Management in Wuhan, China. Int. J. Environ. Res. Public Health 2019, 16, 2332. [Google Scholar] [CrossRef] [PubMed]
- Zhang, P.; Zhu, X.; He, Q.; Ouyang, X. Spatial-temporal differentiation and balance pattern of supply and demand of ecosystem services of the Yangtze River Economic Zone. Ecol. Sci. 2020, 39, 155–166. [Google Scholar] [CrossRef]
- Zhao, C.; Xiao, P.; Qian, P.; Xu, J.; Yang, L.; Wu, Y. Spatiotemporal Differentiation and Balance Pattern of Ecosystem Service Supply and Demand in the Yangtze River Economic Belt. Int. J. Environ. Res. Public Health 2022, 19, 7223. [Google Scholar] [CrossRef] [PubMed]
- Wang, X.; Zhao, X.; Xu, Y.; Ran, Y.; Ye, X.; Zhou, Y.; Wu, B.; Chu, B. Quantifying the supply-demand relationship of ecosystem services to identify ecological management zoning: A case study in mountainous areas of northwest Yunnan, China. Heliyon 2024, 10, e32006. [Google Scholar] [CrossRef]
- Li, F.; Sun, Q.; Wang, S.; Zhao, Y.; Ma, H.; Ji, W. Valuation of ecosystem services in Three-River Head waters Region from 2000 to 2015. J. Environ. Eng. Technol. 2020, 10, 786–797. [Google Scholar] [CrossRef]
- Wang, L.; Wei, X.; Xing, L. Runoff simulation of different runoff and evaporation patterns based on SWAT. Jilin Water Resour. 2014, 1, 1–8. [Google Scholar] [CrossRef]
- Lv, L.; Ren, T.; Li, S.; Han, Y. Analysis on Spatio-temporal Variation of Water Supply in Dalian City Based on InVEST Model. Bull. Soil Water Conserv. 2019, 39, 144–150+157. [Google Scholar] [CrossRef]
- Jiang, R.; Liu, J. Characterization and projection of spatial and temporal changes in habitat quality of Sanjiangyuan based on land use change. J. Geogr. Sci. 2024, 34, 1797–1821. [Google Scholar] [CrossRef]
- Li, Z.; Hu, B.; Qin, Y.; Cheng, X. Drivers of spatiotemporal disparities in the supply-demand budget of ecosystem services: A case study in the Beijing-Tianjin-Hebei urban agglomeration, China. Front. Environ. Sci. 2022, 10, 955876. [Google Scholar] [CrossRef]
- Gao, W.; Song, Q.; Zhang, H.; Wang, S. Analysis of spatial and temporal changes and driving factors of ecological vulnerability in Sanjiangyuan Region. Ecol. Environ. Sci. 2024, 33, 1648–1660. [Google Scholar] [CrossRef]
- Shao, Q.; Cao, W.; Fan, J.; Huang, L.; Xu, X. Effects of an ecological conservation andrestoration project in the Three-River SourceRegion, China. J. Geogr. Sci. 2017, 27, 183–204. [Google Scholar] [CrossRef]
- Cui, Z.; Li, P.; Ma, J.; Xiao, L.; Li, T.; Wang, Z.; Yang, X.; Ning, J.; Li, J. Report on Field Survey of Soil Erosion in The Sanjiangyuan Region. Bull. Soil Water Conserv. 2024, 44, 106–117. [Google Scholar] [CrossRef]
Disclaimer/Publisher’s Note: The statements, opinions and data contained in all publications are solely those of the individual author(s) and contributor(s) and not of MDPI and/or the editor(s). MDPI and/or the editor(s) disclaim responsibility for any injury to people or property resulting from any ideas, methods, instructions or products referred to in the content. |
© 2025 by the authors. Licensee MDPI, Basel, Switzerland. This article is an open access article distributed under the terms and conditions of the Creative Commons Attribution (CC BY) license (https://creativecommons.org/licenses/by/4.0/).