Article

Spatial Distribution and Management of Trace Elements in Arid Agricultural Systems: A Geostatistical Assessment of the Jordan Valley

by
Mamoun A. Gharaibeh
1,*,
Bernd Marschner
2,
Nicolai Moos
3 and
Nikolaos Monokrousos
4,*
1
Department of Natural Resources and the Environment, Faculty of Agriculture, Jordan University of Science and Technology, P.O. Box 3030, Irbid 22110, Jordan
2
Department of Soil Science/Soil Ecology, Institute of Geography, Ruhr-University Bochum, 44801 Bochum, Germany
3
Department of Geodesy, Bochum University of Applied Sciences, 44801 Bochum, Germany
4
University Center of International Programmes of Studies, International Hellenic University, 57001 Thessaloniki, Greece
*
Authors to whom correspondence should be addressed.
Land 2025, 14(7), 1325; https://doi.org/10.3390/land14071325 (registering DOI)
Submission received: 17 May 2025 / Revised: 18 June 2025 / Accepted: 18 June 2025 / Published: 21 June 2025
(This article belongs to the Special Issue Soil Ecological Risk Assessment Based on LULC)

Abstract

:
Sustainable land management in arid regions such as the Jordan Valley (JV) is essential as climate pressures and water shortages intensify. The extended use of treated wastewater (TWW) for irrigation, while necessary, brings potential risks related to the accumulation of trace elements and their impact on soil health and food safety. This study examined the spatial distribution, variability, and potential sources of five trace elements (Co, Hg, Mo, Mn, and Ni) in agricultural soils across a 305 km2 area. A total of 127 surface soil samples were collected from fields irrigated with either TWW or freshwater (FW). Trace element concentrations were consistently higher in TWW-irrigated soils, although all values remained below WHO/FAO recommended thresholds for agricultural use. Spatial modeling was conducted using both ordinary kriging (OK) and empirical Bayesian kriging (EBK), with EBK showing greater prediction accuracy based on cross-validation statistics. To explore potential sources, semivariogram modeling, principal component analysis (PCA), and hierarchical clustering were employed. PCA, spatial distribution patterns, correlation analysis, and comparisons between TWW and FW sources suggest that Co, Mn, Mo, and Ni are primarily influenced by anthropogenic inputs, including TWW irrigation, chemical fertilizers, and organic amendments. Co exhibited a stronger association with TWW, whereas Mn, Mo, and Ni were more closely linked to fertilizer application. In contrast, Hg appears to originate predominantly from geogenic sources. These findings provide a foundation for improved irrigation management and fertilizer application strategies, contributing to long-term soil sustainability in water-limited environments like the JV.

1. Introduction

Trace elements occur naturally in soils, primarily due to the mineral composition and weathering of parent geological materials. However, in modern agricultural systems, their levels are increasingly affected by human activities. The use of treated wastewater (TWW), various fertilizers, organic amendments, biosolids, and pesticides has introduced additional sources of these elements into the soil [1,2].
While many trace elements are stable and persist in the environment, their accumulation can become a concern, especially when concentrations rise to levels that may threaten ecological health or food safety. Elements like cobalt (Co), copper (Cu), manganese (Mn), molybdenum (Mo), and nickel (Ni) are vital for plant metabolism but can become harmful if they exceed threshold levels. Moreover, elements not directly required by plants, including chromium (Cr), selenium (Se), and vanadium (V), can still be absorbed into the food chain, posing risks to human and animal health [3,4].
Jordan, one of the most water-scarce countries globally, faces growing pressures on its agricultural sector. Climate variability, land degradation, and scarce renewable water resources are all contributing factors. The Jordan Valley (JV), a fertile strip extending over 35,000 hectares, plays a critical role in the nation’s food production, particularly for fruits and vegetables. Due to persistent water shortages, especially in the central and southern areas, farmers have been relying on TWW combined with surface runoff for irrigation for over forty years. While TWW provides nutrients and organic matter that can enhance soil fertility, its prolonged use may also lead to unwanted trace element accumulation, potentially compromising soil quality and food safety [5,6]. The irrigation water, primarily sourced from the As-Samra wastewater treatment plant and King Talal Dam (KTD), lacks tertiary treatment or metal-specific removal steps, which, along with prolonged reuse practices, likely contribute to trace element accumulation in JV soils.
Recent studies conducted in the JV have reported elevated concentrations of Cr, Cu, Zn, and Pb in soils irrigated with TWW. Although most concentrations remained within international safety limits (e.g., WHO/FAO guidelines), these investigations revealed varying sources of contamination: Cd, Cr, and Pb were largely traced back to TWW; Zn and Cu were linked to chemical fertilizers; and As appeared to originate from natural geological formations. However, these studies often lacked spatial detail and did not adequately account for uncertainty in trace element distribution, limiting their utility for practical land management [5].
To address such gaps, spatial modeling techniques and multivariate statistical tools offer valuable insights. Interpolation methods like ordinary kriging (OK) and empirical Bayesian kriging (EBK) are commonly used to predict the spatial variability of soil contaminants [7,8,9]. Using EBK improves the robustness of spatial estimates by incorporating repeated simulations of semivariograms, thereby reducing predictive uncertainty. Meanwhile, multivariate analyses—such as principal component analysis (PCA) and hierarchical cluster analysis—can help distinguish between natural and anthropogenic sources of trace elements [10,11].
While similar patterns of trace element enrichment have been documented in other Mediterranean and semi-arid environments, differences in soil type, land use, and climate mean that local assessments remain essential. For example, elevated copper levels in vineyards of southern Italy were associated with fungicide applications [12], whereas high concentrations of Co, Ni, and Cr in parts of Spain [13] were linked to geological sources. In Egypt, cultivated soils showed higher levels of Cd, Co, Mo, and Pb compared to nearby desert soils, highlighting the influence of land use on element accumulation [14]. These international examples underscore the importance of region-specific studies, especially in vulnerable ecosystems like the JV.
Considering growing climatic pressures and persistent water scarcity, understanding how trace elements behave across space is essential, not only for assessing contamination risks but also for shaping adaptive land management strategies. Accurate spatial mapping of trace element concentrations enables site-specific interventions, such as identifying zones where TWW use should be minimized, targeting low-risk areas for intensive cultivation, and refining fertilizer practices based on accumulated soil burdens. This type of data-driven decision-making can support sustainable agricultural planning in the JV, helping balance productivity with environmental stewardship [15].
To the best of our knowledge, this is the first study in the JV to examine a specific group of trace elements (Co, Hg, Mo, Mn, and Ni) chosen for their environmental importance and agronomic relevance within arid, alkaline agricultural systems. Unlike the well-studied heavy metals such as Pb, Cd, and Zn, these elements have received relatively little attention in the JV. Mn, although commonly found in soils, often becomes deficient under the alkaline conditions prevalent in the JV, which can negatively impact crop yields. Hg, while not essential to plants, is a highly toxic contaminant primarily introduced through human activities such as pesticide application and biosolid amendments. Its behavior in arid, irrigated soils remains largely unexplored.
This research fills critical knowledge gaps by assessing the spatial distribution and associated uncertainties of these trace elements using geostatistical methods such as OK and, for the first time in the region, EBK. As an advancement over previous studies that relied solely on OK for classical heavy metals, EBK enhances spatial prediction accuracy and quantifies uncertainty by incorporating semivariogram variability [5]. Furthermore, multivariate statistical techniques, including PCA and cluster analysis, were used to identify possible sources of these elements. The study also evaluates the long-term effects of TWW irrigation on trace element accumulation in soils and offers recommendations to guide adaptive land and water management amid growing challenges from climate change and water scarcity in the JV.

2. Materials and Methods

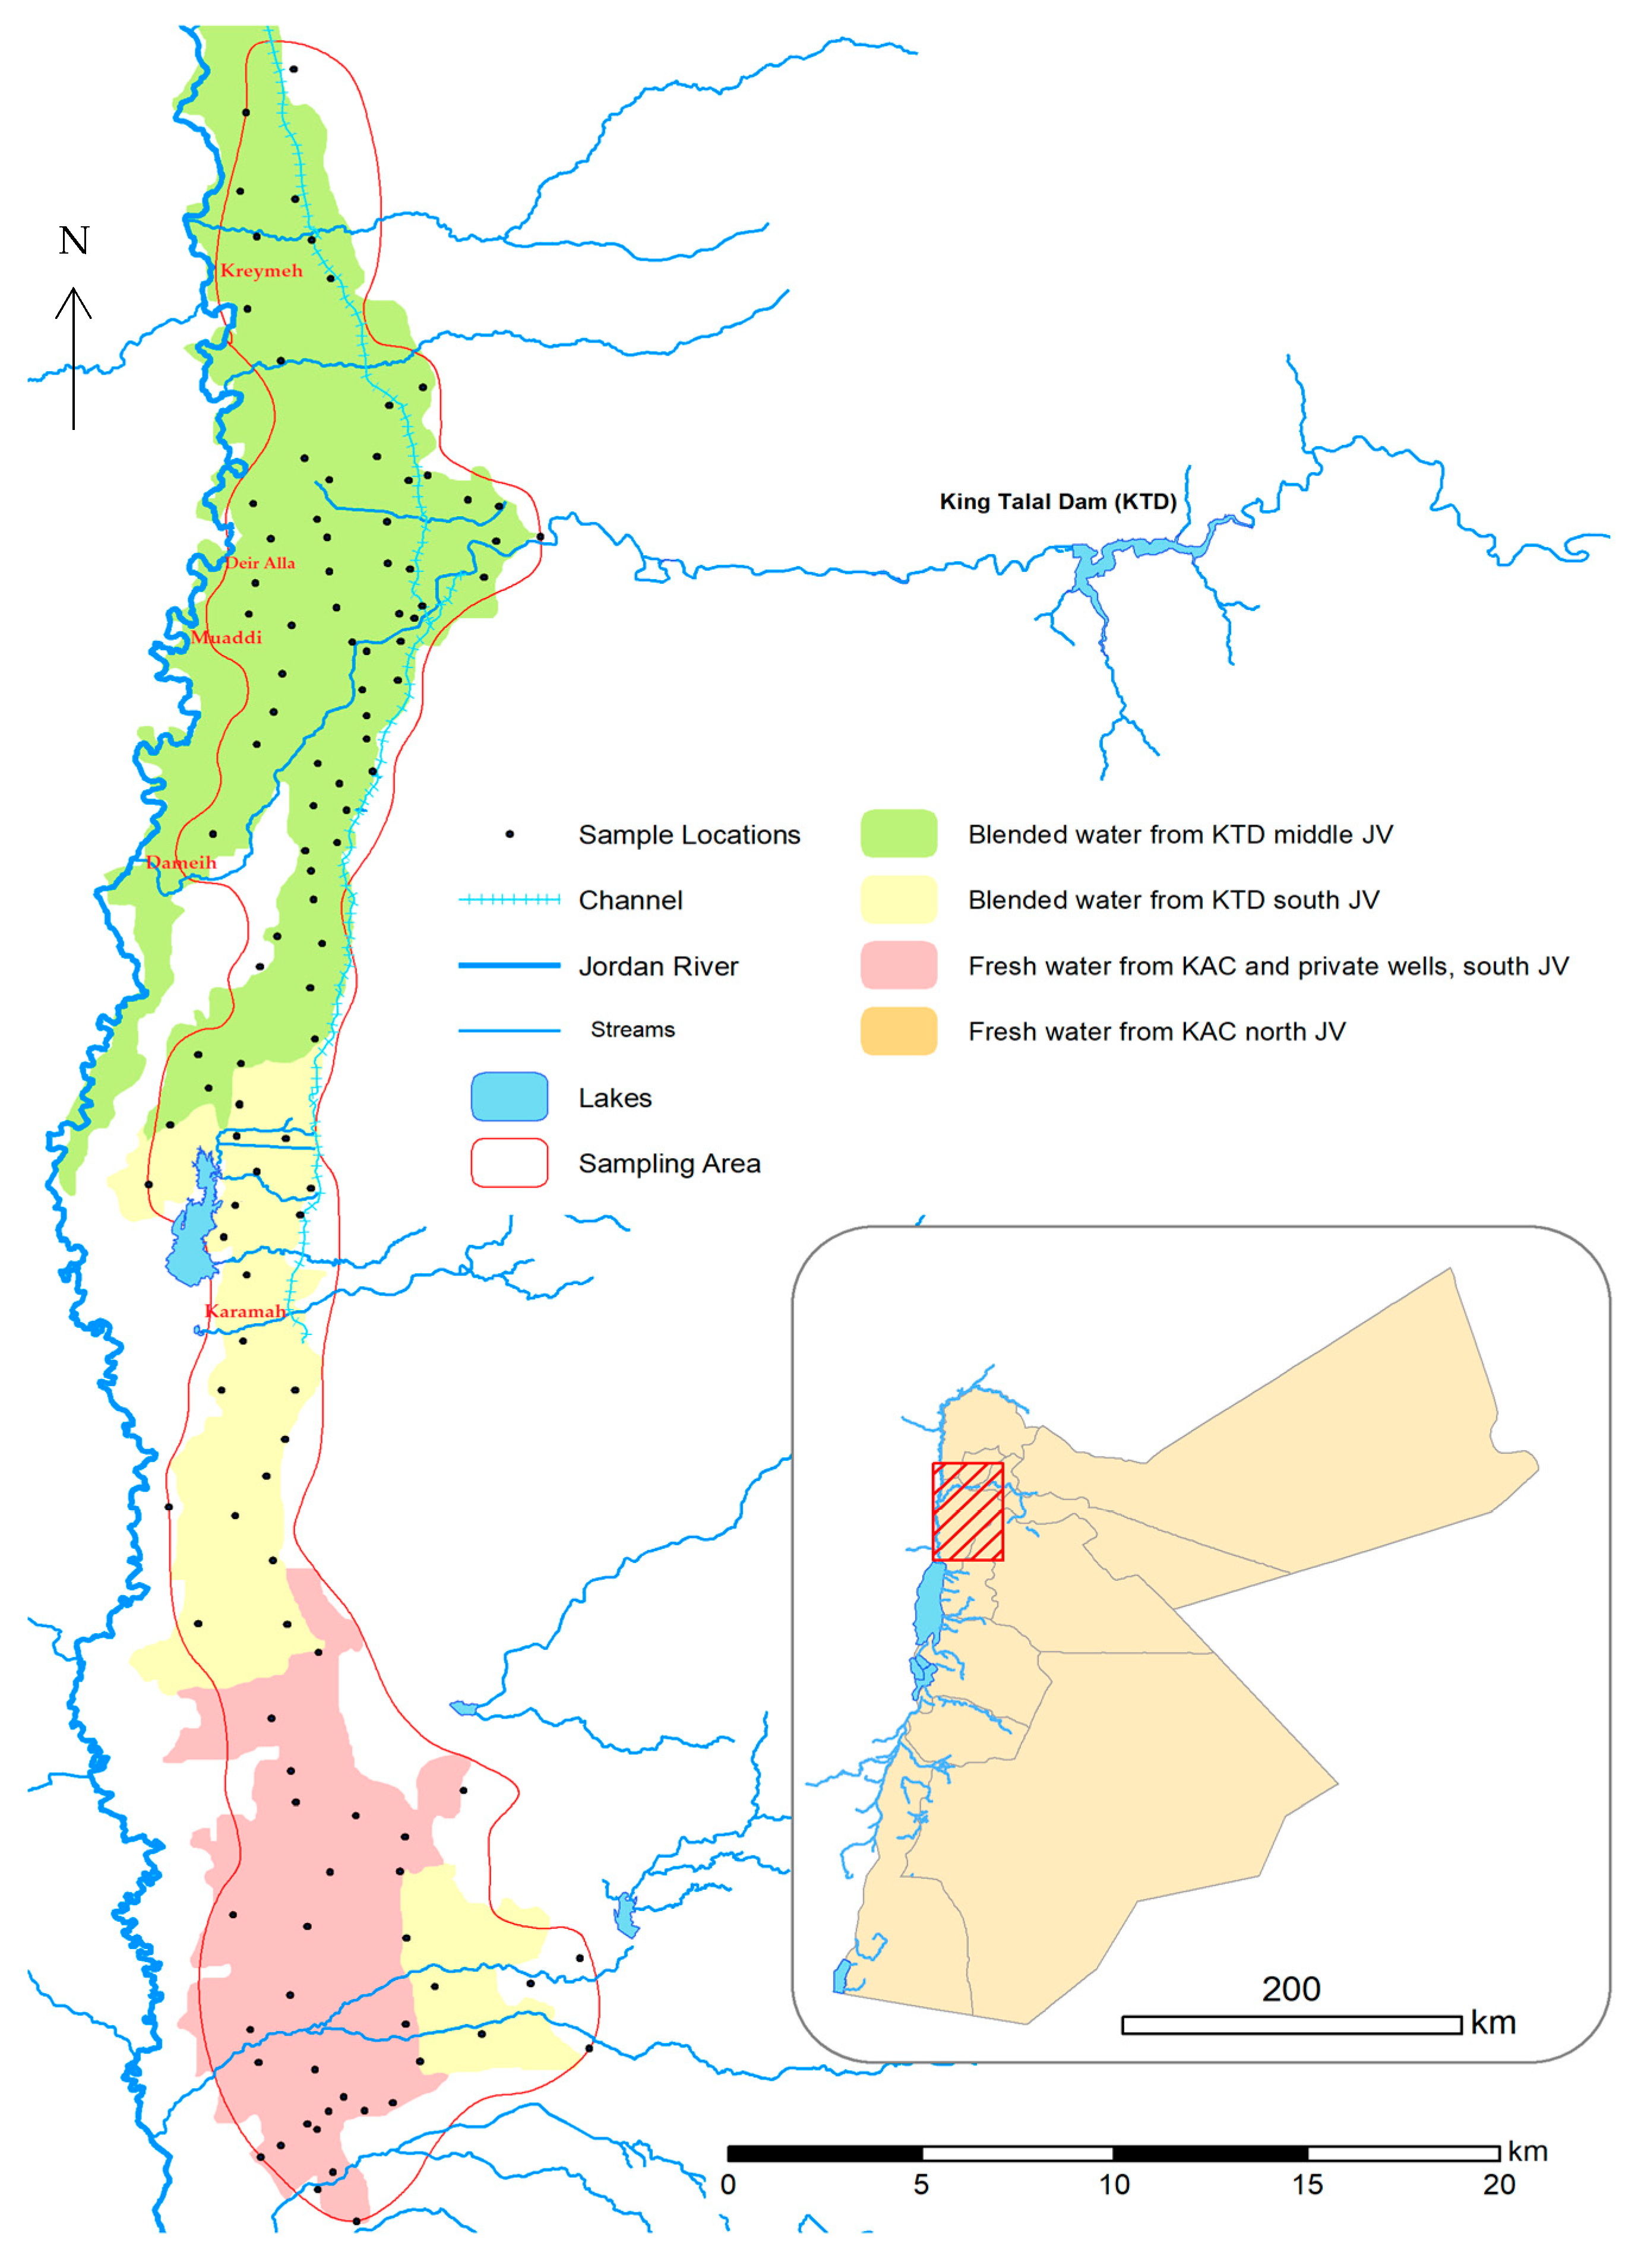
2.1. Description and Climate of Study Area

The study area covers about 305 km2 of intensive open-field and greenhouse agricultural farms extending from the northern to southern parts of the JV (32°19′ 32.45″ N, 35° 33′ 21.47″ E; 31°46′ 49.45″ N, 35° 32′ 47.76″ E) (Figure 1). Farms in the JV are organized in 0.3–0.4 ha units, with a total of 10,000 farm units extending from the northern borders to the Dead Sea. The total agricultural land in the JV produces more than half of the total food production and covers about 13 percent of the total agricultural land in Jordan.
The climate of the study area is arid, characterized by hot, dry summers and mild winters. Average annual evapotranspiration is about 2250 mm, with average annual precipitation ranging from 500 mm to less than 100 mm in the northern and middle to southern parts, respectively. Moreover, annual temperatures range from 21 to 27 °C during summer and from 10 to 12 °C during winter. Soils of the study area are Aridisols (Typic Camborthids, Typic Calciorthids) and Entisols (Typic Torriothents) [16].
Agricultural fields in the middle and south parts are irrigated with a blend of fresh and TWW, while the north parts are only irrigated with fresh water.
The total cultivated area in the JV is about 28,000 ha, about 42% is cultivated in the northern parts, 35% in the middle, and 23% in the south. Fruit (citrus trees) and vegetable crops are mainly grown in the northern and middle parts, whereas in the southern parts, banana and palm trees are mainly grown, in addition to vegetable crops. Farming areas between Kreymeh and Deir Alla are planted with greenhouse vegetables in small areas (0.4 ha). In Al-Muaddi, south of Deir Alla, large farms of palm and citrus trees are mainly found, in addition to small-scale greenhouse and open-field vegetable crops. In Dameih, south of Al-Muaddi stretching south to Karamah, open-field vegetables dominate [17].
In areas around the village of Karamah, special crops are planted (mint and parsley) in open fields and greenhouses. In the southern parts of the JV, banana farms and some vegetables are grown in open fields. These areas extend from the southern parts of Karamah to the north borders of the Dead Sea (South Shuna to Kafrein areas). Farms use water mainly from King Abdullah Canal (KAC) and Husban Wadi, in addition to private wells and some desalination plants. Water pumped from wells is salty; therefore, farmers mix this water with water from dams. Detailed information regarding sampling locations, soil classification, irrigation water sources, and grown crops are described in [5].

2.2. Collection of Soil Samples and Chemical Characterization

Soil samples were randomly collected from different farms. The sampling area covered an area of about 305 km2 (70 km long × 4.7 km average width). Sample coordinates were recorded with a global positioning system receiver. From each location, four surface (0–25 cm) soil samples were collected and mixed, and one composite sample was made for each location, air dried, sieved to ≤2 mm, labeled, and stored for chemical analysis. A total of 127 composite surface soil samples (0–25 cm) were collected: 102 from fields irrigated with TWW and 25 from FW-irrigated fields.
Approximately 50 g of soil was ground to <250 microns using a ball mill, and after grinding, the mill was cleaned using clean quartz sand to reduce any possible cross-contamination. About 250 mg of finely ground soil from each sample was weighed into digestion vessels, followed by the addition of 10 mL of concentrated HNO3. The samples were subjected to microwave-assisted digestion using the Mars Xpress system (CEM GmbH, Kamp-Lintfort, Germany) at a maximum temperature of 180 °C. The digestion protocol consisted of four sequential steps: (1) ramping the temperature from 25 °C to 90 °C over 4 min, (2) holding at 90 °C for 2 min, (3) increasing to 180 °C over 6 min, and (4) maintaining 180 °C for an additional 10 min. After digestion, samples were filtered using acid-washed Sartorius no. 640 filter paper and transferred into 50 mL polyethylene bottles for subsequent trace metal analysis [18].
The total concentrations of trace elements (Co, Mn, Mo, Ni, and Hg) in the digested soil samples were determined using Inductively Coupled Plasma Optical Emission Spectroscopy (ICP-OES) (Spectroblue, Ametek Materials Analysis Division, Kleve, Germany). The instrument was operated under the following conditions: RF power of 1300 W, plasma gas flow rate of 12 L/min, auxiliary gas flow rate of 1.0 L/min, nebulizer gas flow rate of 0.8 L/min, and sample uptake rate of 1.5 mL/min. The following analytical wavelengths were used: Co (228.616 nm), Mn (257.610 nm), Mo (202.030 nm), Ni (231.604 nm), and Hg (253.652 nm). Calibration curves were established using multi-element standard solutions at six concentrations: 0, 0.5, 1.0, 2.0, 5.0, and 10.0 mg/L, with correlation coefficients (R2) above 0.999 for all analytes. The limits of detection (LOD) and limits of quantification (LOQ) were calculated as 3σ and 10σ, respectively, where σ is the standard deviation of ten blank measurements. LOD values ranged from 0.01 to 0.05 mg/L, and LOQ values ranged from 0.03 to 0.15 mg/L, depending on the element. For quality assurance, two replicate samples from each site were analyzed in duplicate, yielding four readings per location. The accuracy and precision of the analysis were evaluated using the certified reference material SPS-SW2 (Spectrapure Standards AS). Although originally certified for water matrices, the CRM was used due to the lack of a suitable soil-based reference material, and it showed good agreement with certified values, confirming acceptable analytical performance.
Furthermore, soil pH [19] and electrical conductivity (EC) [20], organic carbon (Org C) [21], total nitrogen-TN [22], and total phosphorus-TP (ICP-MS) were also determined for each soil sample.

2.3. Statistical Methods

Summary statistics were used to describe trace element concentrations and other soil chemical properties. Data were subjected to normality testing using Kolmogorov–Smirnov and Shapiro–Wilk tests, correlations between elements and other soil properties were assessed using the Pearson method, and source identification was performed using PCA and cluster analysis in SPSS 25. Varimax rotation was performed to extract components with eigenvalues greater than 1. Prior to PCA, data were z-transformed to normalize distribution, and the Kaiser–Meyer–Olkin (KMO) measure of adequacy and Bartlett’s test of sphericity were conducted to test for homogeneity of variances and to check if data were well suited for factor analysis (KMO > 0.5). Furthermore, cluster analysis (dendrogram) was used to reduce studied variables into homogeneous groups of similar origin [23].

2.4. Semivariogram Analysis

Semivariogram analysis was used to study the spatial patterns of regionalized variables. Spatially related data were analyzed by plotting variance versus distance to create an experimental variogram to predict values of un-sampled locations (unmeasured data points) by kriging [24,25]. The semivariance is computed as half the average of the squared difference between points separated by distance h [26]:
γ h = 1 2 N ( h ) i = 1 N ( h ) Z x i Z ( x i + h 2
where N(h) is the number of sets of all data pairs separated by h, and Z(xi) and Z(xi + h) are the measured values at spatial locations xi and xi + h.
For the EBK, a semivariogram using a log-empirical transformation and K-Bessel de-trended type with 100 subsets and 1000 trials were performed in this study. Cross-validation was employed to evaluate the goodness of fit and to assess the reliability of the interpolation model (OK vs. EBK) for each element, using several performance indicators: the coefficient of determination (R2), mean error (ME), root mean square error (RMSE), mean standardized error (MSE), root mean squared standardized error (RMSSE), and average standard error (avg. SE).

3. Results and Discussion

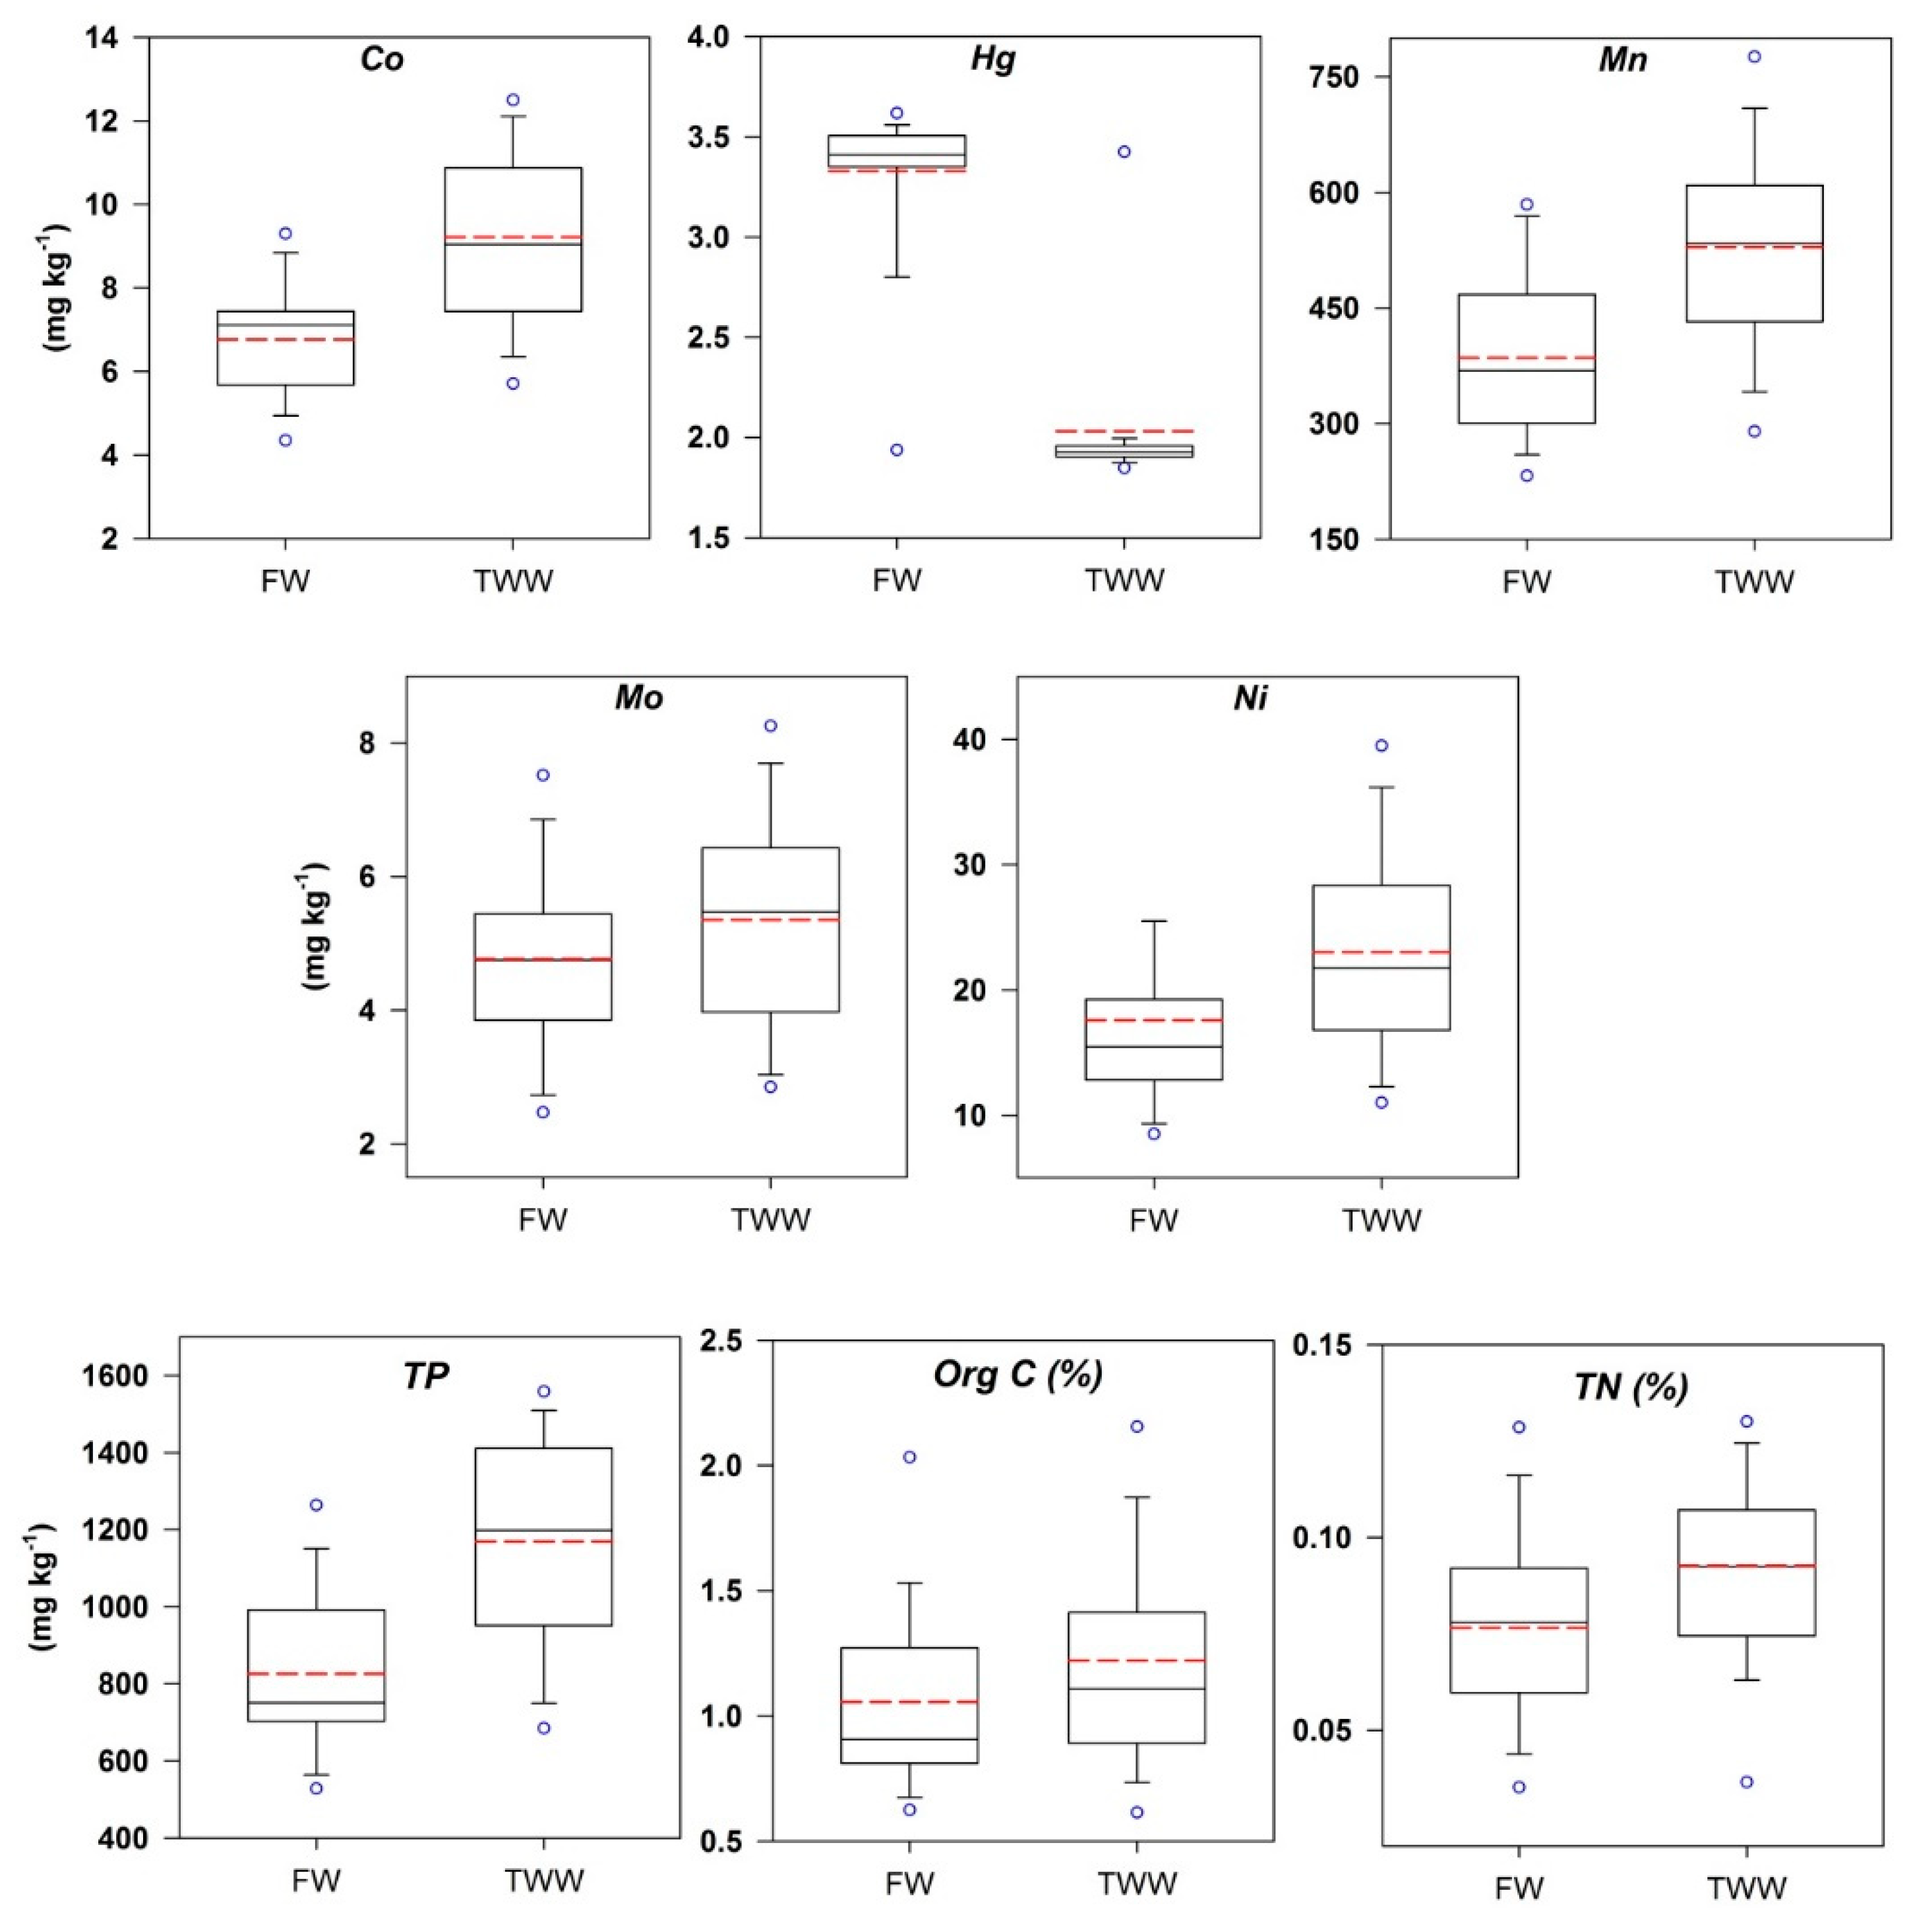
3.1. Trace Elements Contents in Soils

Summary statistics of trace elements concentrations, EC, Org C, TP, and TN in studied soils are shown in Table S1. Soils of the JV are slightly alkaline (pH 7.6) with a wide range of EC values (1.5–234 dS m−1). Soils vary considerably in texture, with clay and clay loam textures dominating in the northern and middle parts, while loam, silt loam, and sandy loam dominate the southern parts of the study area. Levels of trace elements were compared with the maximum allowable concentration (MAC) reported by [27].
Average metal levels (mg kg−1) in soils were as follows: Co (8.7), Hg (2.29), Mn (500.8), Mo (5.24), and Ni (21.9). The average contents of all analyzed elements were below the maximum permissible concentration (MPC) suggested by [28]. Soils irrigated with TWW contained elevated levels of trace elements compared to FW-irrigated soils (Figure 2). Summary statistics of trace elements in FW- and TWW-irrigated soils are provided in Tables S2 and S3.
Numerous studies have documented significant variability in trace element concentrations in agricultural soils across different regions. For instance, in Indonesia, average Ni levels were reported at 11.96 mg kg−1, with a maximum of 19.5 mg kg−1, while Mn concentrations averaged 1700 mg kg−1, with a maximum of 2300 mg kg−1 [29]. In contrast, much higher Ni levels were found in Colombia’s Sinú River Basin, where concentrations averaged 661 mg kg−1, and Hg levels reached 0.159 mg kg−1. These elevated values were attributed to both agricultural activities and ferronickel mining [30]. In another study, Hg concentrations ranged from 0.004 to 1.1 mg kg−1, and Ni averaged 24.7 mg kg−1, with a maximum of 55 mg kg−1. The presence of Hg was linked to emissions from coal-fired power plants and the historical use of Hg-containing agrochemicals [31]. In Northeast China’s Dehui region, the average Ni concentration in agricultural soils was reported at 20.8 mg kg−1 [32]. Meanwhile, in Shunde, Southeast China, average concentrations of Co, Hg, and Ni were measured at 16.76, 0.38, and 33.45 mg kg−1, respectively [33]. Further data indicated Ni levels at 28.5 mg kg−1 and Mn at 550 mg kg−1, emphasizing spatial disparities and potential risk patterns in heavy metal distribution [34]. For molybdenum (Mo), concentrations in Chinese topsoil ranged from 0.10 to 5.97 mg kg−1, with an average of 0.66 mg kg−1 [35]. These figures are consistent with previously reported Mo levels of 0–44.1 mg kg−1 in the United States [36] and 0.026–14 mg kg−1 in European agricultural soils [37]. Overall, these data underscore the regional variability of trace elements and highlight the influence of both natural and anthropogenic sources critical for interpreting the metal concentrations observed in the current study.
The Mann–Whitney Rank Sum Test between medians was used if the normality test failed. Soils irrigated with TWW showed significantly (p < 0.001) higher Co, Mn, and Ni and lower Hg levels than FW-irrigated soils. Moreover, TWW-irrigated soils contained higher, but not significant, Mo levels as compared to FW-irrigated soils (Figure 2, Table S4).
For both FW and TWW, Co and Mo had the lowest skewness with a Guassian distribution using Shapiro–Wilk test, indicating non-point source (i.e., TWW and added fertilizers) loading for both elements. In addition, irrigation with TWW caused slight positive skewness and low to moderate relative standard deviation (CV) for Cr, indicating the presence of other sources of loading that might be coming from organic and inorganic fertilizer use. Crops in the JV are under intensive agricultural use, where more NPK fertilizers and organic manure have been used for improving yield quantity and quality. Furthermore, Hg had the lowest CV in both FW and TWW, while Ni had the highest CV value [38]. Low CV values indicate a natural source, while high values reflect anthropogenic sources [38].

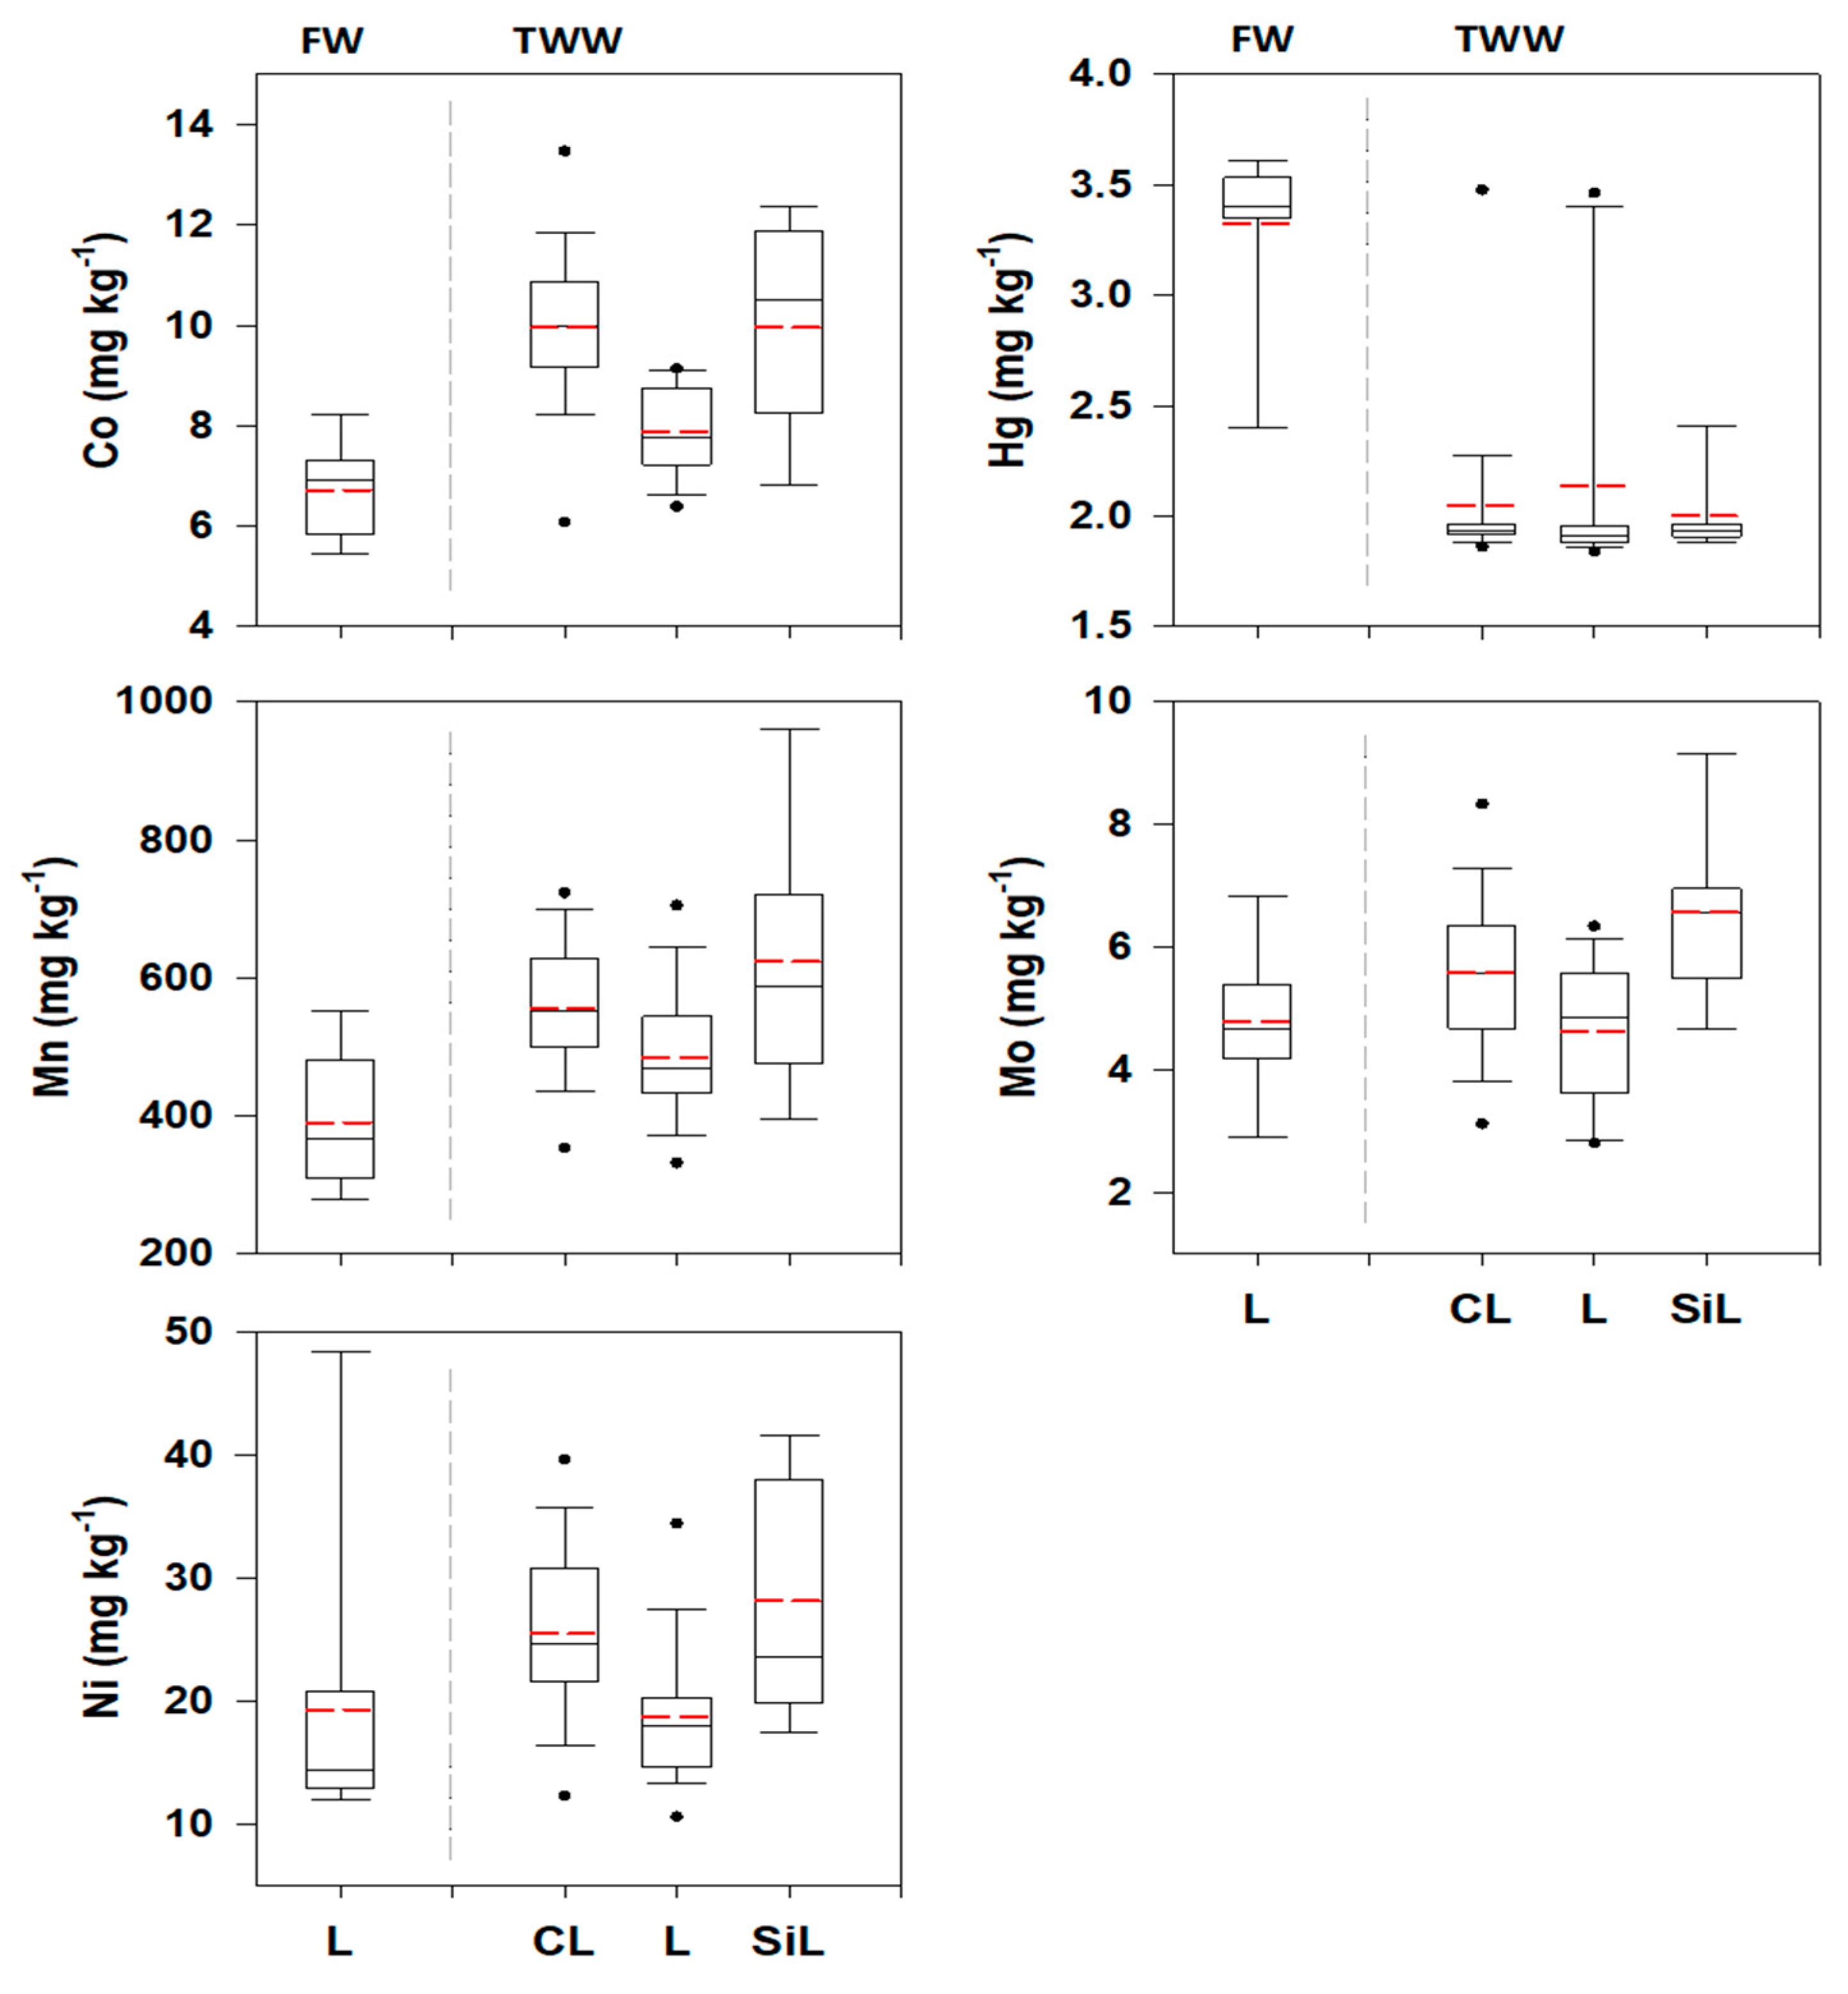
3.2. Trace Elements in Main Soil Textural Classes

Concentrations of trace elements in the main textural classes under FW and TWW irrigation were investigated (Figure 3). Soils irrigated with FW had mainly loam (L), while textures of TWW-irrigated ones were mainly clay (C), clay loam (CL), and silt loam (SiL).
ANOVA and Kruskal–Wallis tests were performed to determine whether the means of trace element concentrations significantly differ with soil texture in FW- and TWW-irrigated soils (Table S5). Generally, trace element concentrations in CL soils were significantly (p < 0.05) higher (except for Hg) than those in loam ones. Soil Co and Mn contents in loam TWW-irrigated sites were significantly higher (p < 0.05) than those in FW-irrigated sites. Except for Mo, no significant differences in element levels were observed between CL and SiL in TWW-irrigated soils, while SiL soils showed significantly higher (p < 0.05) levels of all elements than loam soils (except for Hg). In CL soils, element contents were significantly lower (p < 0.05) than those in loam soils (except for Hg).
The lower contents in TWW loam soils, mainly present in the southern parts of the JV, compared to other textures could be attributed to the use of blended waters from Shueib and Kafrein dams, private wells, and desalination units, which may contribute to greater dilution of used TWW. Concentrations of trace elements in soils under cropping land use (vegetable- vs. tree-planted soils) were also investigated (Figure S1). TWW vegetable irrigated soils showed significantly (p < 0.05) higher trace element contents than FW tree-cultivated soils (Table S6).

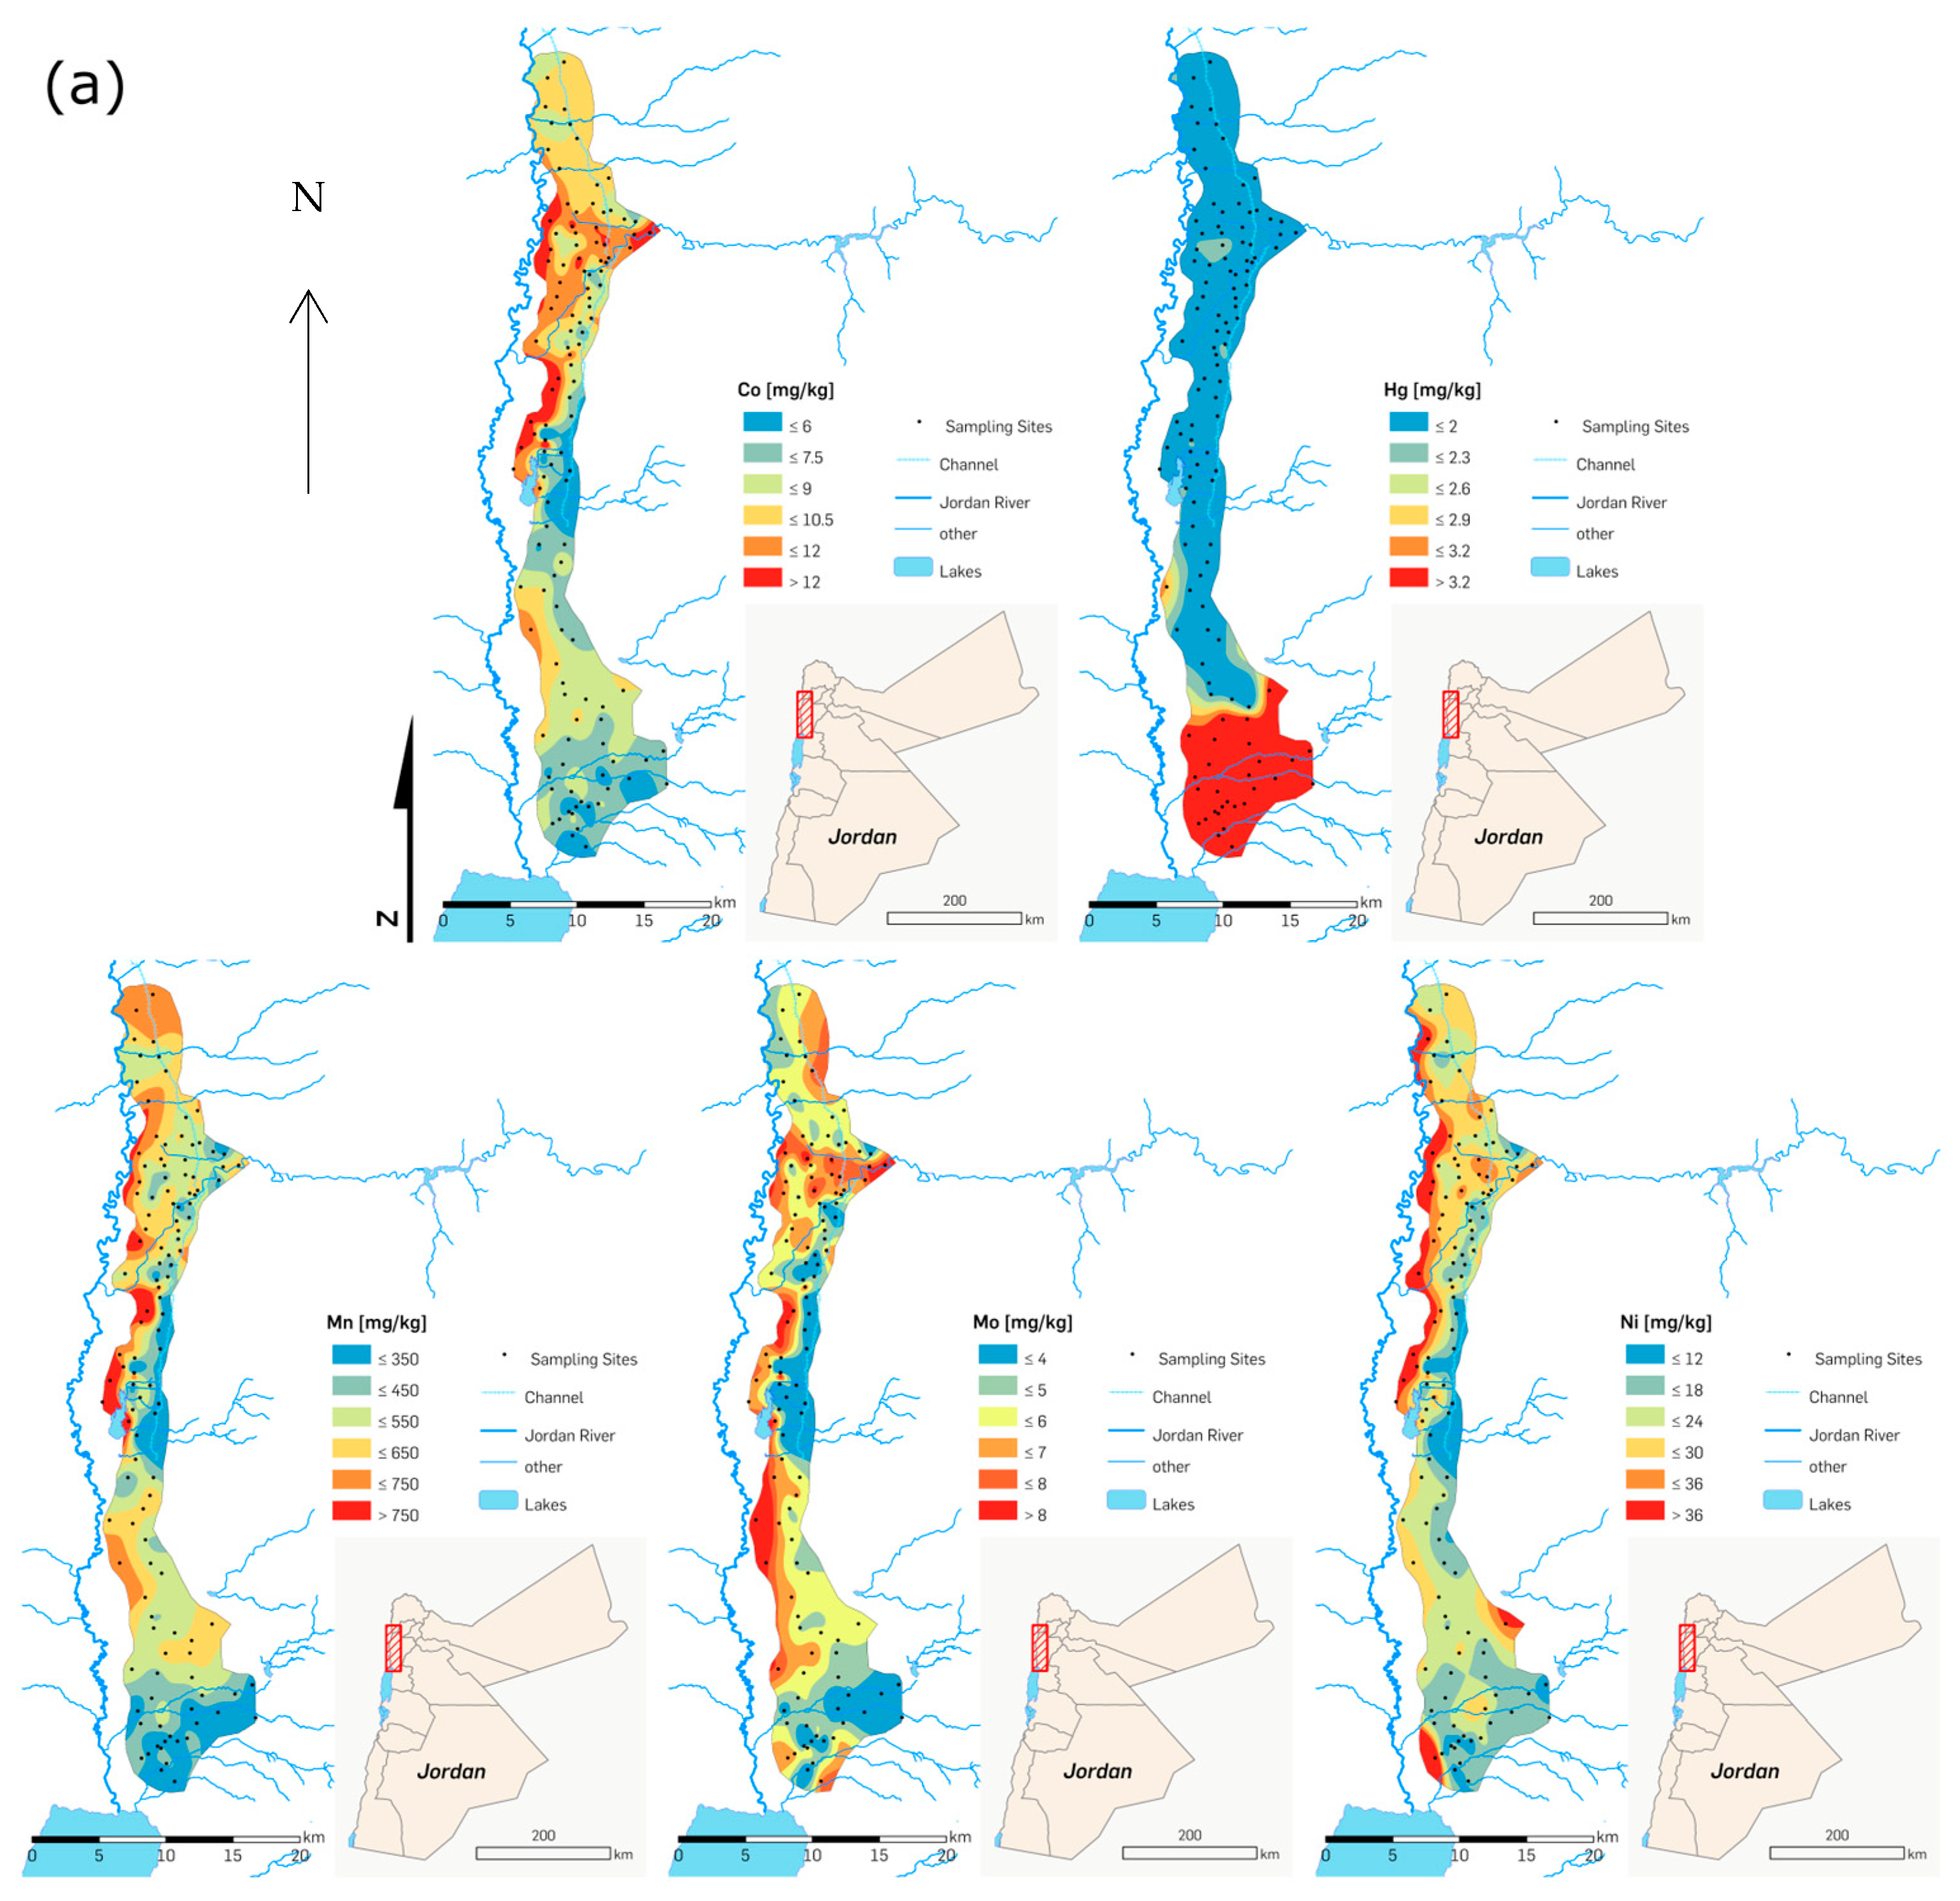
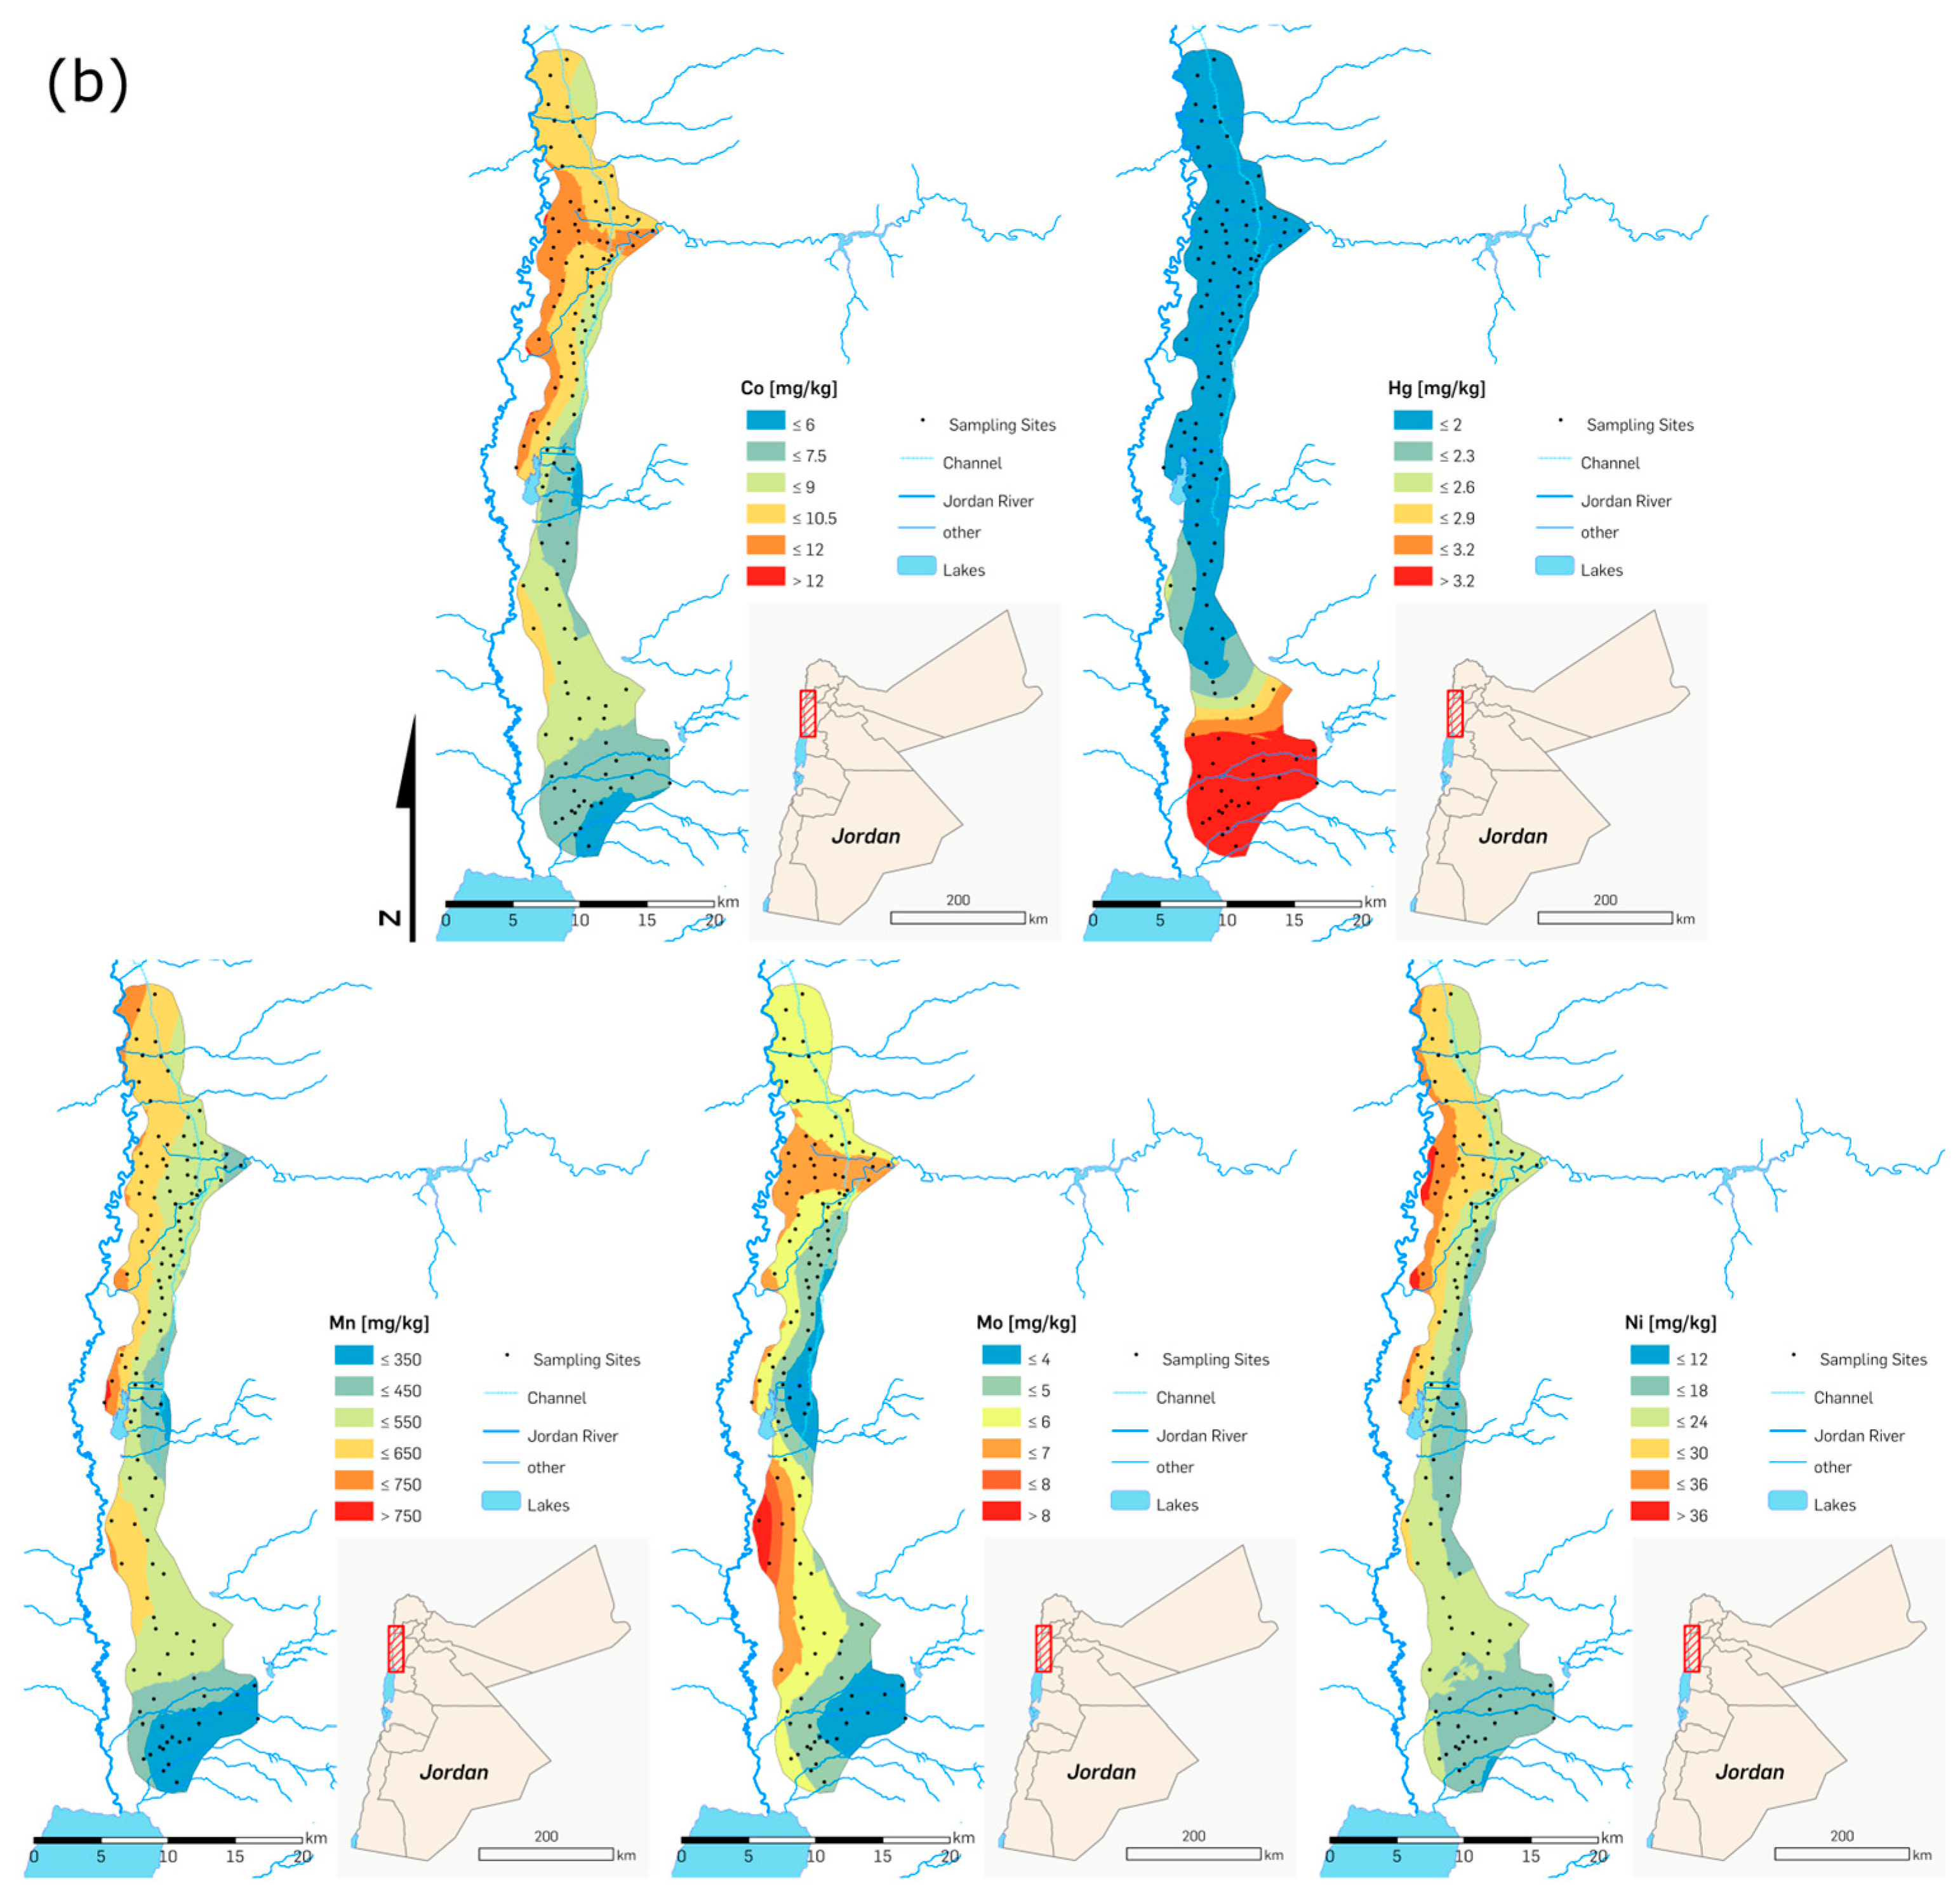
3.3. Spatial Mapping of Trace Elements

Spatial maps using OK (Figure 4a) and EBK (Figure 4b) show distinctively higher levels of Cr, Mo, Mn, and Ni in the west of Zarqa River (TWW-irrigated soils). These soils have fine texture (clay and clay loam) and are characterized by higher Org C, Tp, and TN levels than FW-irrigated sites (southern parts). Furthermore, maps clearly show that the southern parts contained significantly (p < 0.001) higher Hg contents than the middle and northern parts of JV. This may indicate that Hg comes from a different source (parent material) than other elements.
Spatial maps of Mo, Ni, and Mn using OK show patchy areas (variable elemental concentrations) in the northern and, to a lesser degree, in the southern parts of the JV (except for Hg), indicating that agricultural activities may primarily cause this variation. The relatively uniform spatial distribution of Hg across most sites, with distinct variability observed only in the southernmost areas, suggests a different origin compared to the other trace elements. This pattern is indicative of a lithogenic source, likely related to underlying parent material rather than anthropogenic inputs. Moreover, Co maps have a blocky distribution (Figure 4a) all over the studied area. The patchy distribution at shorter distances (especially Mo and Ni) indicates relatively higher inputs of these elements from anthropogenic activities (fertilizer and TWW use).
Using the EBK, the resulting maps (Figure 4b) display more continuous, block-like zones with fewer scattered hotspots compared to the OK maps. This smoother spatial pattern may be due to the reduced uncertainty inherent in the EBK approach relative to the OK method. Such uncertainties may result predominantly from spatial interpolation or spatial heterogeneity. In addition, the uncertainties of the spatial prediction of soil elements across the JV may be inherently linked to the complexity of interactions between natural processes (parent material) and associated agricultural activities (chemical and organic fertilizer use, in addition to irrigation with TWW). Therefore, the obtained results indicate that EBK is a better interpolator than the OK method for the estimation of trace element concentrations at unsampled locations. Several studies reported that metals had spatially weak dependence due to anthropogenic factors, while natural factors were attributed to spatially strong dependence in studied soils [13,39,40,41,42,43].
Examining the spatial maps reveals areas with high Co and Mo concentrations in the northern parts right across the Deir Allah area (western parts of Zarqa River). The high levels (red colored) may be attributed to the inputs from TWW. For Mn and Ni, maps show no distinct areas with high concentration (as observed in Co and Mo maps), indicating that both elements (Mn and Ni) may be influenced by a parent material origin.

3.4. Correlation Coefficient Analysis

Correlation is used to determine the association between two variables, and it forms the basis of other more sophisticated multivariate statistics such as factor analysis [44]. Pearson correlation coefficients were determined between Co, Hg, Mn, Mo, and Ni and other basic soil properties (org C, TP, TN, EC, pH, clay, sand, and CEC). In general, for all soils, coefficients revealed significant moderate to strong correlation between Co, Hg, Mn, Mo, and Ni, significant weak to moderate correlations between these elements and Org C, TN, and TP, significant strong correlations between pH and studied elements (except for Hg), and weak correlations between EC, CEC, and the rest of the soil tested properties (Table S7). Correlation coefficients between trace elements and tested soil properties in both FW and TWW and in main soil textural classes (CL, SiL, and L) are also provided in Tables S8–S13. Weak negative correlations coupled with low CV for Hg and other tested soil properties may indicate a different source (parent material). Strong positive correlations between tested elements may indicate similar possible sources. In addition, weak to moderate correlations between these elements and Org C, TP, and TN in all soils may also indicate possible multiple sources (chemical, organic fertilizers, and TWW) affecting trace element levels in soils.

3.5. Spatial Structure of Trace Elements

The spatial dependence of soil properties in the semivariogram is determined by the nugget-to-sill ratio. Three classifications are used for model explanation: A ratio of <25, 25–50, and <75% indicates strong, moderate, and weak spatial dependence, respectively [39]. For comparison purposes, both the isotropic and anisotropic spatial behavior of the attributes were explored. Results showed no differences in the spatial dependency of trace elements. The variability in measured soil properties can be caused by natural (inherent) and random factors. Anthropogenic activities such as the use of fertilizers and applying different farming and cropping systems result in a higher nugget-to-sill ratio, whereas a lower ratio may be related to the effect of climatic and soil-forming factors [45,46]. All trace elements were best described by the spherical model (Figure 5).
Semivariogram analysis showed that the nugget-to-sill ratios were larger than 0.25 and lower than 0.75 for all elements (excluding Hg), suggesting moderate spatial dependence (Table 1). A smaller nugget effect indicates enough collected samples to describe spatial variation of trace elements. Semivariogram analysis showed that the nugget-to-sill ratios were larger than 0.25 and lower than 0.75 for all elements (excluding Hg), suggesting moderate spatial dependence (Table 1). The result suggests that both natural and anthropogenic factors might be affecting Co, Mn, Mo, and Ni distribution. Variograms in Figure 5 also show similar shapes and slopes for Mn, Mo, and Ni, with higher nugget values for Ni, followed by Mo and Mn, indicating patchy distribution at shorter distances and relatively higher inputs of Ni from anthropogenic activities (fertilizer and TWW use) [47]. Furthermore, semivariogram results strongly indicate that Hg was of pedogenic origins.
All trace elements showed relatively small nugget and sill values; however, the range values were quite different. For example, Mn and Mo had the lowest range, while Co had the highest range. Higher range values for Co and Ni indicate the presence of spatial dependency at longer distances than Mn and Mo [48,49]. For Co, a lower nugget value and a gradual increase in semivariogram slope at longer distances indicate lower steady inputs from fertilizers and TWW [50]. Best-fitted variogram models for isotropic directions are shown in (Table 1).
Cross-validation results (Table 2) demonstrate that EBK consistently outperformed OK in predicting trace element concentrations. EBK yielded lower RMSE and MSE values for most elements (Co, Mn, Mo, and Hg) and showed RMSSE values closer to 1, indicating improved model calibration. Lower average standard errors suggest reduced prediction uncertainty. These findings highlight EBK as the more reliable method for spatial interpolation of trace element distributions in the study area. For both RMSE and MSE, lower values or values close to zero indicate better fit, while for RMSSE, values close to one indicate a good estimation for the variability of prediction, and an MSE value nearest to the RMSE [24,51,52]. RMSE is a useful measure of accuracy to compare prediction errors of different models. A lower RMSE value is an indicator of higher precision of the interpolation method [53], while others considered a lower RMSSE value as indicating a stable model [54,55]. For Hg, both models were comparable; however, EBK showed less data dispersion when using EBK compared with the OK method [45,56,57]. Therefore, both natural and anthropogenic factors could be affecting Co, Mn, Mo, and Ni distribution.

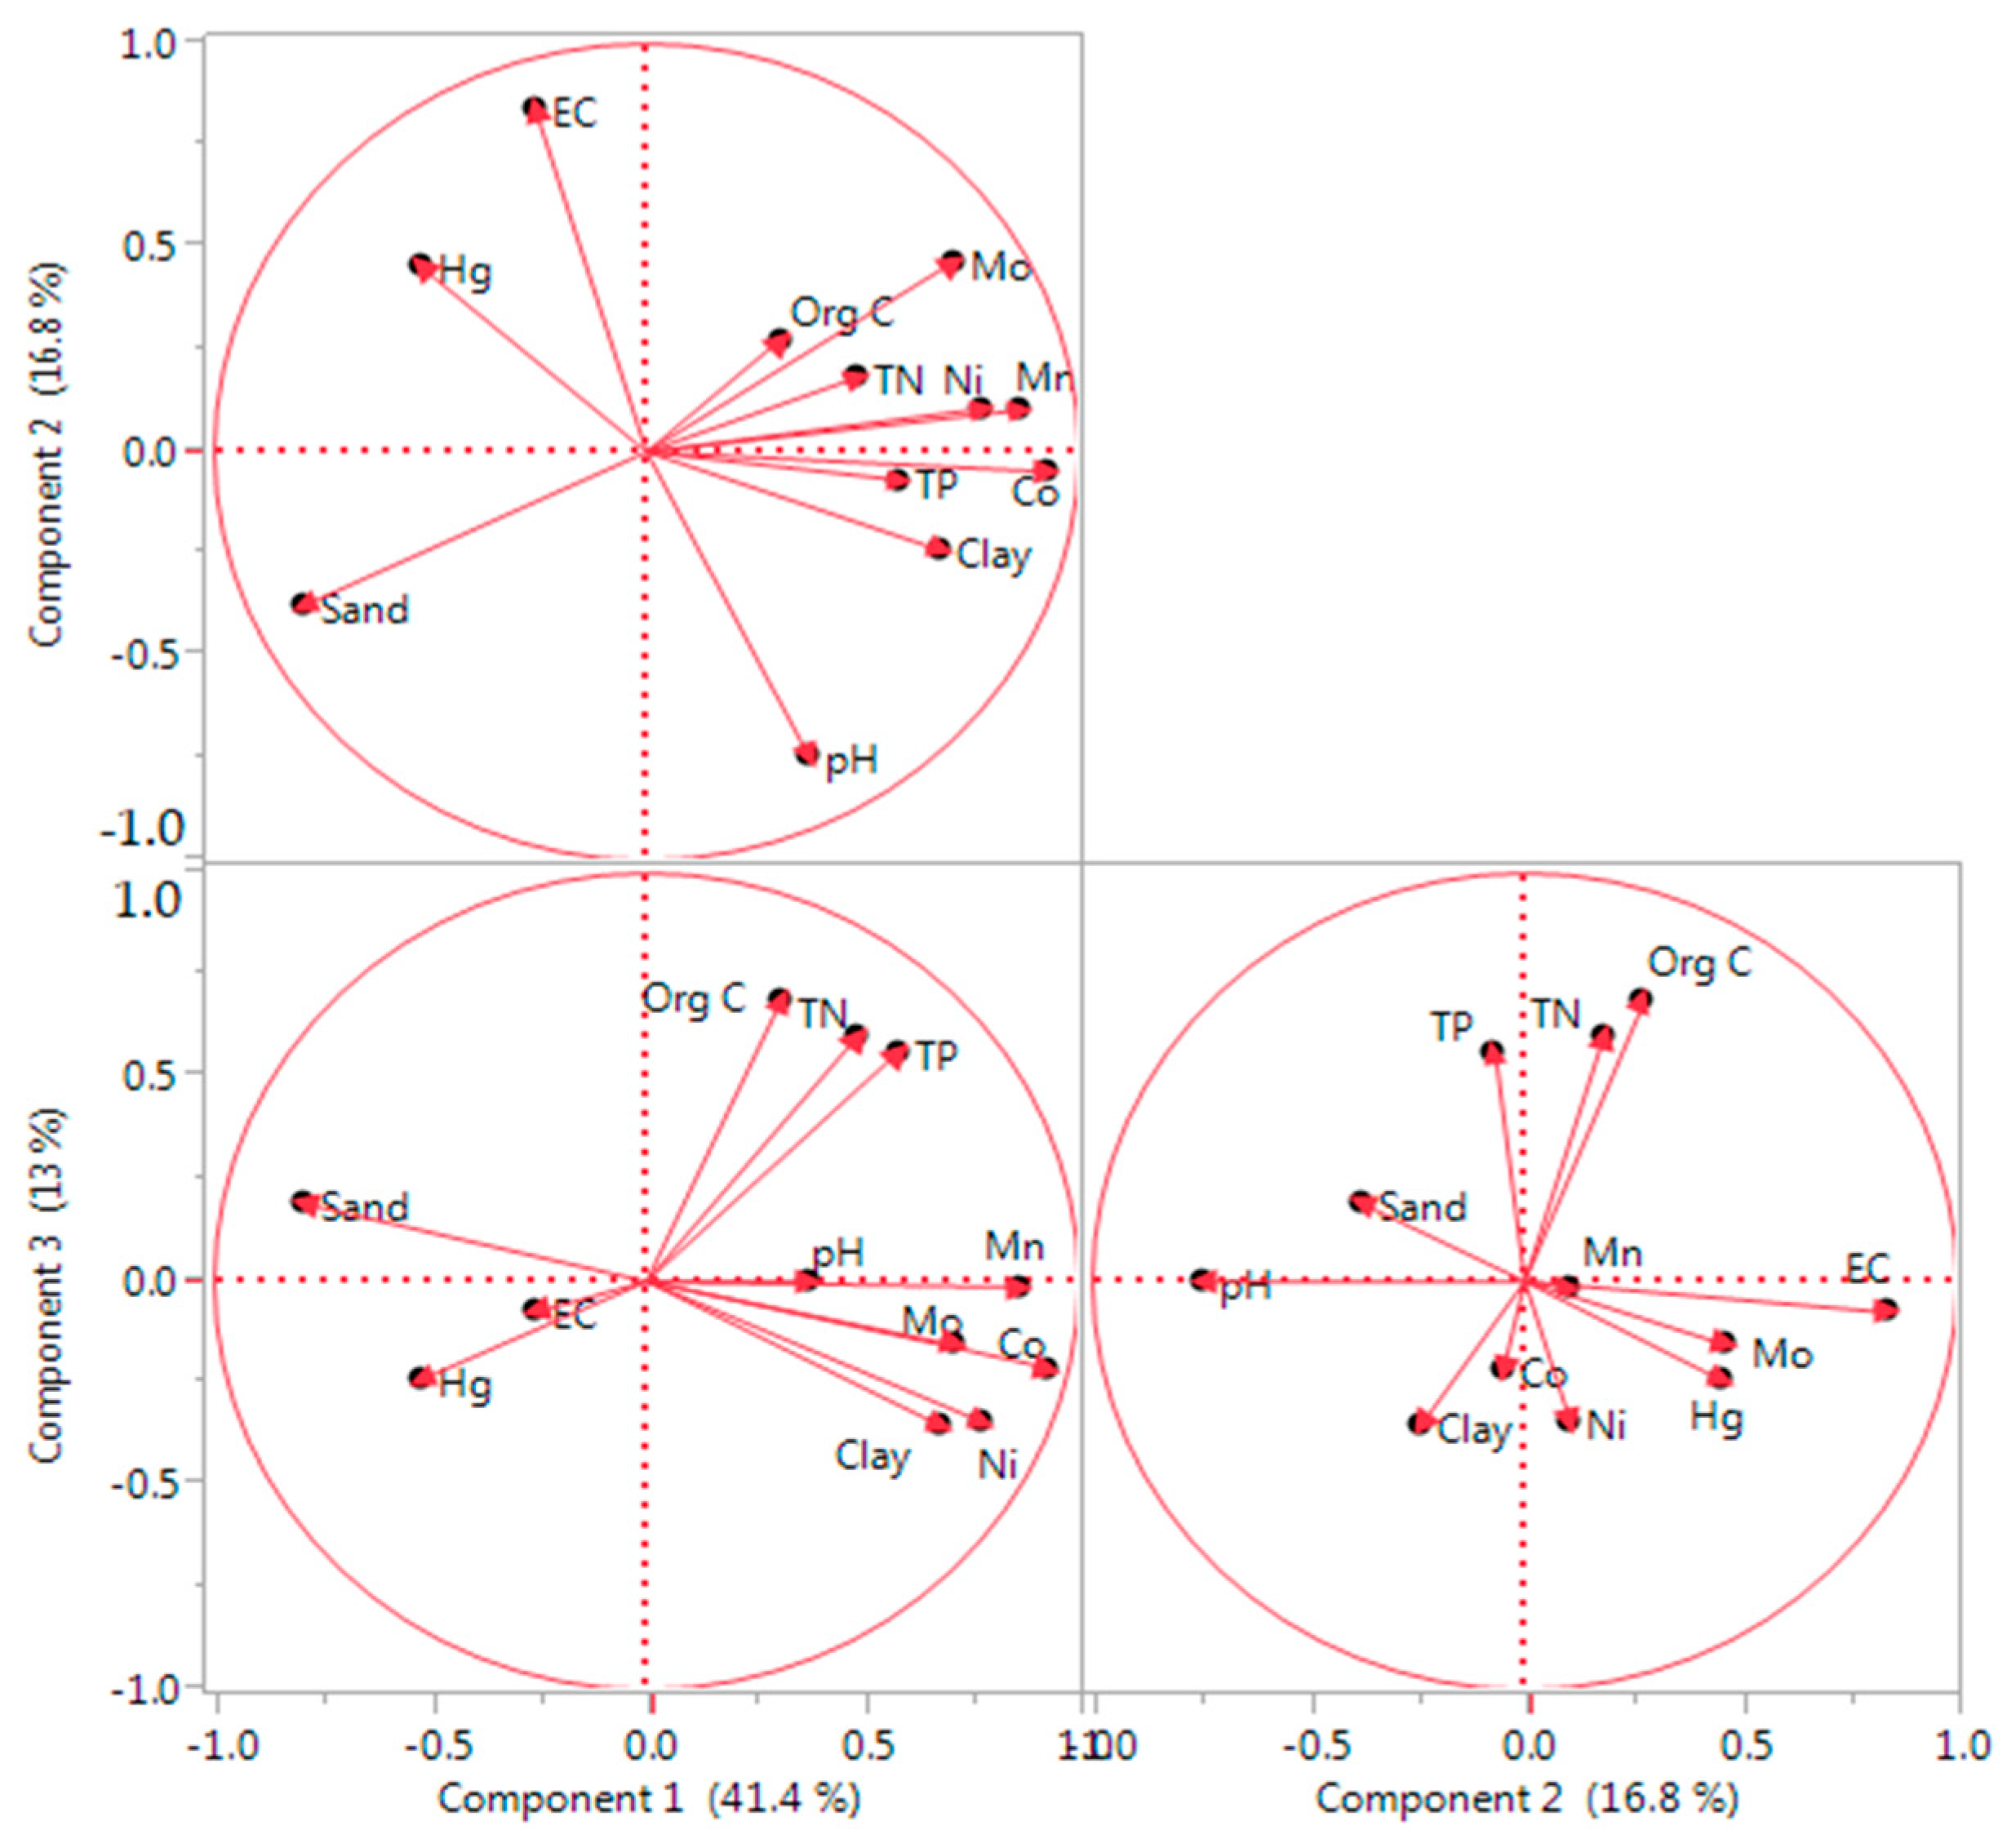
3.6. Principal Component Analysis

PCA was performed to further delineate the sources of elements and relative contribution of irrigation (TWW vs. FW), agricultural practices (chemical fertilizers and organic manuring), and inherited soil characteristics in soils of the JV. The rotated component matrix of PCA for trace elements extracted components and loadings are shown for all, FW, and TWW-irrigated samples (Table 3). CEC was removed for not reaching the KMO criteria.
For all, TWW, and FW samples, PCA results explained 72.7, 80.2, and 70.0% of total variance, respectively. For all and TWW-irrigated soils, the first component (PC1) had strong positive loadings for Co, Mn, Mo, and Ni, moderate loadings for clay, and strong negative loadings for sand. PC2 showed strong loadings for Org C, TN, and TP; PC3 showed strong loadings for EC (all samples); and PC4 showed strong loadings for Hg (TWW).
For FW soils, PC1 showed strong loadings for Mn, Org C, TN, and TP; PC2 showed strong loadings for Mo and moderate to strong loadings for Ni and Co; and PC3 showed strong negative loadings for clay. Furthermore, Hg showed moderate loadings in PC3 and weak loadings in PC1 and PC2.
PC2 (with strong loadings in TWW soils for Org C, TN, and TP) indicates a clear signal of agricultural enrichment (TWW and fertilizer use, and composted organic material). In FW-irrigated soils, Org C, TN, and TP showed strong loadings in PC1, suggesting that elevated metal levels in these soils are linked to inputs from chemical fertilizers and composted organic materials. PC3 reflects saline inputs from TWW and the basic geochemical background, particularly from lacustrine sediments of the Pleistocene Lake Lisan [17]. Furthermore, in TWW-irrigated soils, Hg exhibited strong loadings in PC4, while only showing low to moderate loadings in PC3 for FW soils.
These patterns may strongly suggest an anthropogenic origin, primarily linked to the long-term use of TWW, which is known to introduce trace elements into soils. The association with clay may indicate that fine-textured soils act as sinks for these metals, enhancing their retention through sorption. Furthermore, TWW-irrigated soils exhibited consistently higher concentrations of trace metals compared to those irrigated with freshwater (FW), supporting the interpretation that these elements may be primarily derived from anthropogenic sources along with agricultural practices such as the use of organic manure and chemical fertilizers.
Furthermore, PCA results suggest that Hg accumulation is not significantly driven by fertilizers or organic amendments, but more likely reflects a lithogenic origin related to the geological characteristics of the region. The high association between Hg and EC suggests that Hg originates from basic rocks (residual parent material) found in that area [16]. Higher salinity in the southern parts of the JV was attributed to earlier huge floods occurring in the rift valley plain, which were considered a precursor for creating the Pleistocene Lake Lisan–Dead Sea [17]. As a result, layers of lacustrine sediments were left behind and the thickness of these sediments decreased, and therefore, soil salinity increased southward. Moreover, Hg shows a weak negative loading in PC1 and PC3; this may also confirm that chemical and organic fertilizers are weakly associated with Hg levels in the tested soils.
To further extrapolate the origins of trace elements; PCA was run excluding factors in PC2. Results showed that trace elements have moderate loading for clay (transported, alluvial parent material), moderate loading for TP, weak loadings for TN, and no loadings for Org C. Moderate loadings for trace elements and TP suggest the influence of chemical fertilizers and a greater possibility that p is complexed with these elements. Weak loadings for TN may indicate the influence of TWW and organic manure. Furthermore, PCA was run excluding factors in PC3. Results showed that EC and pH had very weak loading for all tested elements (except for Hg). Therefore, it could be postulated that Co, Mn, Mo, and Ni originate from multiple sources (pedogenic, chemical, and organic fertilizers).
PCA results were further clarified by the biplots using a different program (JMP software, JMP Version 11), where the angles formed between variable vectors and the horizontal (X) axis illustrate the strength and direction of their correlations (Figure 6). Acute angles (<90°) indicate a strong positive correlation, right angles (90°) suggest no correlation, and obtuse angles (>90°) denote a negative correlation [58]. These biplots indicate that these elements could have been derived primarily from weathering and genesis of soil parent rocks, whereas the upper graph indicates another secondary elemental source, which might be affected by agricultural practices (anthropogenic factors) such as chemical and organic fertilizers, as well as the use of TWW. Oblique angles (>0°–<90°) between vectors of soil trace elements strongly dominated by the same PC revealed strong correlations among these elements, suggesting that they were derived from similar sources [59].
Results of this study agree with [60,61], which reported that Co, Ni, and Mn had positive loadings and belonged to one group (factor). In addition, Na and Si (sand) were negatively correlated with the other elements in this group.
In soils along Zarqa River, ref. [62] reported that Mn was mainly bound to iron-manganese oxides and calcite fractions, whereas Ni was found in the residual, iron-manganese oxides, and calcite fractions. Ref. [63] showed that Hg concentrations in Quanzhou Bay sediments were attributed to the variable geological distribution of their parent minerals.
Multivariate and geostatistical analyses in agricultural soils in Dehui, Northeast China, suggested that average Ni concentrations as high as 20.8 mg kg−1 had lithogenic origins [32]. Higher enrichment of Hg in the studied soils could be mainly attributed to the background value, which was determined only in the <2-micron fraction of 20 soil samples [64]. Moreover, higher explained variance in PC1 (34%) could be considered a strong indicator of geological or soil forming factors controlling Co, Mn, Mo, and Ni distribution in soil [65].

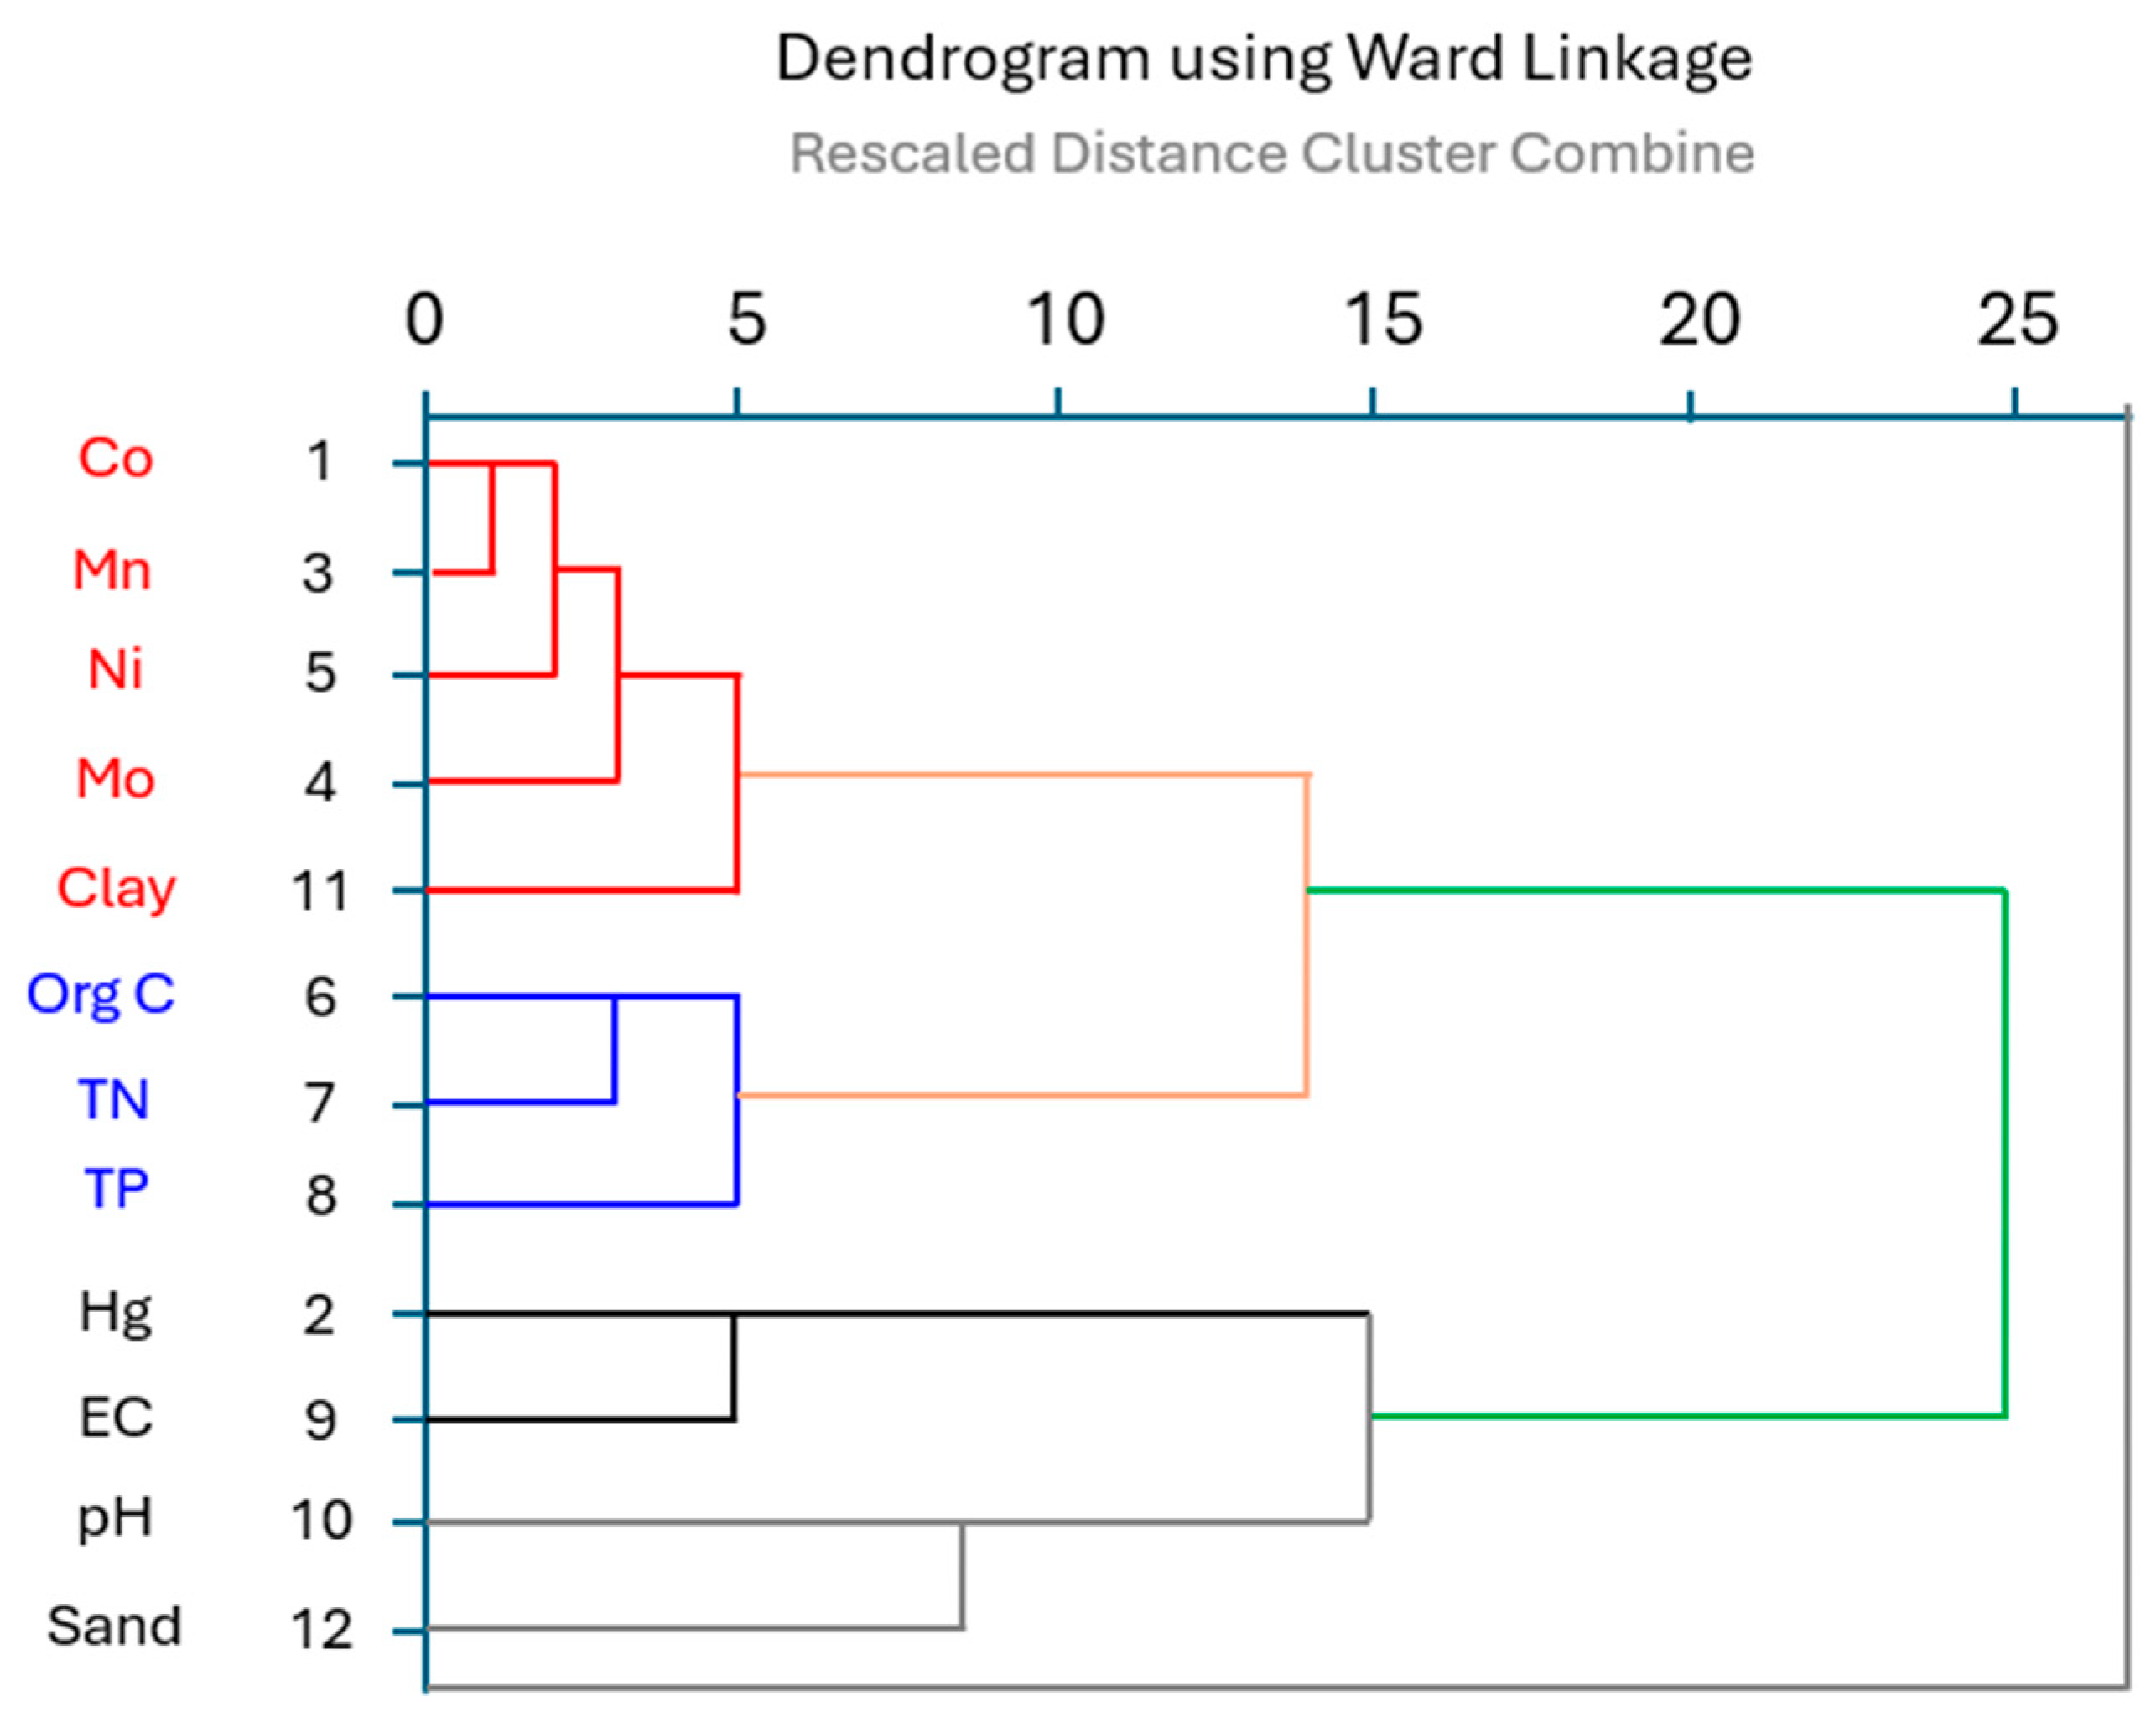
3.7. Cluster Analysis

Hierarchical cluster analysis using Ward’s linkage (Figure 7) was used to group the tested parameters into main clusters. Results of the cluster analysis show three main groups (1) Co, Mn, Ni, Mo, and clay (red color); (2) Org C, TN, and TP (blue); and (3) Hg, EC, pH, and sand (black). Co and Mn were grouped tightly, Ni and Mo showed close association, and clay was linked with all four. The cluster analysis supports PCA outcomes by grouping Co, Mn, Mo, Ni, and clay together, Org C with TN and TP, and Hg with EC and pH. These findings may suggest that Co, Mn, Mo, and Ni could originate from mixed anthropogenic sources (TWW and fertilizers), while Hg could be largely attributed to geogenic factors [66].
Within these clusters, Co and Mn were grouped tightly, Ni and Mo were clustered, and clay was associated with all four, indicating that soil texture modulates trace element retention but does not negate their anthropogenic source. Org C was more closely linked to TN, likely from wastewater and organic amendments, while TP diverged slightly, indicating a stronger association with chemical fertilizers. Hg’s pairing with EC and pH, along with its weak correlation with other metals, supports its distinct geological origin.
Therefore, the combined evidence from PCA, hierarchical clustering, spatial mapping, correlation analysis, and comparisons of trace element levels in TWW versus FW suggests that the continued use of TWW for irrigation, along with fertilizer and manure application, is likely a contributor to the observed accumulation of Co, Mn, Ni, and Mo in soils. However, definitive source attribution would require further validation through isotopic fingerprinting or controlled experiments.

3.8. Implications for Land Management Under Water Scarcity

Studying the spatial variability and sources of trace elements in the JV offers critical insights for sustainable land management in arid and semi-arid agricultural systems. Although concentrations of Co, Mn, Mo, and Ni in TWW-irrigated areas remain below regulatory limits, their elevated presence underscores the need for proactive, site-specific strategies [67]. The kriging-based maps generated in this study serve as a decision support tool for identifying trace element hotspots, enabling more efficient freshwater allocation and guiding agroecological zoning through spatially informed crop planning to enhance crop safety and long-term sustainability. Farmers and extension services can use these spatial insights to implement selective irrigation—alternating TWW and freshwater based on localized trace element levels—and to develop long-term soil monitoring protocols that leverage model uncertainty ranges to detect early signs of accumulation in high-risk zones [68].
To further mitigate the accumulation of trace elements, land managers are advised to periodically dilute TWW with freshwater, particularly during dry periods, and to define region-specific threshold values that inform both irrigation scheduling and fertilizer management. Reducing the use of high-metal-content fertilizers and promoting slow-release or organic alternatives can also minimize trace element inputs [69]. Ultimately, integrating these targeted irrigation, monitoring, and input strategies within a broader agronomic planning framework will support resilient and adaptive land use in the face of growing climate and resource pressures.

4. Summary and Conclusions

This study investigated the spatial distribution and source attribution of five trace elements (Co, Hg, Mo, Mn, and Ni) in intensively cultivated soils of the JV, where irrigation with treated wastewater has been practiced for decades. Using both ordinary kriging (OK) and empirical Bayesian kriging (EBK), spatial variability and prediction uncertainty were quantified. EBK demonstrated superior predictive performance, providing more reliable spatial assessments essential for land monitoring programs. Multivariate analyses indicated that Hg likely originated from geogenic sources, while Co, Mn, Mo, and Ni are largely associated with anthropogenic activities—particularly the prolonged use of TWW, chemical fertilizers, and organic amendments.
Although none of the trace element concentrations exceeded international safety thresholds, the accumulation patterns emphasize the need for sustainable management practices to prevent future degradation. These include routine soil monitoring, the dilution of TWW with freshwater during sensitive growth periods, and more judicious fertilizer application. Site-specific maps produced from this study can support decision-makers and farmers in identifying at-risk zones and implementing precision agriculture techniques. Overall, this research provides a geostatistical framework for improving land resilience and ensuring soil sustainability under continued pressure from climate change and water scarcity in arid regions such as the JV.

Supplementary Materials

The following supporting information can be downloaded at: https://www.mdpi.com/article/10.3390/land14071325/s1. Figure S1. Box-and-whisker plots for trace element contents and related soil properties in FW- and TWW-irrigated soils under tree and vegetable cultivation in the Jordan valley; Table S1: Statistics of trace element concentrations and major soil properties of all samples; Table S2: Summary statistics of trace element contents and major soil properties for FW samples; Table S3: Summary statistics of trace element contents and major soil properties for TWW samples; Table S4: Pairwise multiple comparisons of trace element contents under FW and TWW irrigation; Table S5: Pairwise multiple comparisons of trace element contents in main soil textural classes under FW and TWW irrigation; Table S6: Pairwise multiple comparisons of trace element contents in FW and TWW soils under vegetable and tree cultivation; Table S7: Pearson correlation coefficients for all soils; Table S8: Pearson correlation coefficients for FW-irrigated soils; Table S9: Pearson correlation coefficients for TWW-irrigated soils; Table S10: Pearson correlation coefficients for FW loam soils; Table S11: Pearson correlation coefficients for TWW clay loam soils; Table S12: Pearson correlation coefficients for TWW loam soils; Table S13: Pearson correlation coefficients for TWW silt loam soils.

Author Contributions

Conceptualization, M.A.G. and B.M.; methodology, M.A.G. and B.M.; software, M.A.G. and N.M. (Nicolai Moos); validation, M.A.G., B.M., and N.M. (Nicolai Moos); formal analysis, M.A.G. and B.M.; investigation, M.A.G. and B.M.; resources, M.A.G.; data curation, M.A.G., B.M., and N.M. (Nicolai Moos); writing—original draft preparation, M.A.G., B.M., N.M. (Nicolai Moos), and N.M. (Nikolaos Monokrousos); writing—review and editing, M.A.G., B.M., N.M. (Nicolai Moos), and N.M. (Nikolaos Monokrousos); visualization, M.A.G., B.M., and N.M. (Nicolai Moos); supervision, M.A.G. and B.M.; project administration, M.A.G.; funding acquisition, M.A.G. All authors have read and agreed to the published version of the manuscript.

Funding

This research was partially funded by the deanship of research at the Jordan University of Science and Technology (grant number 2018/180).

Institutional Review Board Statement

Not applicable.

Informed Consent Statement

Not applicable.

Data Availability Statement

Data are contained within the article or Supplementary Materials.

Acknowledgments

The authors gratefully acknowledge the external funding of the scientific research visit by the German Research Foundation (DFG), the deanship of research at the Jordan University of Science and Technology, and the access to laboratory facilities by the Department of Soil Science/Soil Ecology, Institute of Geography, Ruhr University Bochum, Germany.

Conflicts of Interest

The authors declare no conflicts of interest.

Abbreviations

The following abbreviations are used in this manuscript:
ECelectrical conductivity
EBKempirical Bayesian kriging
FAOFood and Agriculture Organization
ICP-AESinductively coupled plasma atomic emission spectrometry
JVJordan Valley
KMOKaiser–Meyer–Olkin
OKordinary kriging
Org Corganic carbon
PCAprincipal component analysis
SPSSStatistical Package for Social Sciences
TNtotal nitrogen
TPtotal phosphorus
TWWtreated wastewater
WHOWorld Health Organization

References

  1. Antoniadis, V.; Levizou, E.; Shaheen, S.M.; Ok, Y.S.; Sebastian, A.; Baum, C.; Prasad, M.N.V.; Wenzel, W.W.; Rinklebe, J. Trace Elements in the Soil-Plant Interface: Phytoavailability, Translocation, and Phytoremediation—A Review. Earth Sci. Rev. 2017, 171, 621–645. [Google Scholar] [CrossRef]
  2. Chittora, D. Harmful Impact of Synthetic Fertilizers on Growing Agriculture and Environment. Glob. J. Pharm. Pharm. Sci. 2023, 11, 555804. [Google Scholar] [CrossRef]
  3. Alloway, B.J. Heavy Metals and Metalloids as Micronutrients for Plants and Animals. In Heavy Metals in Soils; Springer: Berlin/Heidelberg, Germany, 2013; pp. 195–209. [Google Scholar]
  4. Mendieta-Mendoza, A.; Renteria-Villalobos, M.; Randall, H.; Ruíz-Gómez, S.; Ríos-López, M. Chemical Degradation of Agricultural Soil under Arid Conditions by the Accumulation of Potentially Toxic Elements and Salts. Geoderma Reg. 2023, 35, e00736. [Google Scholar] [CrossRef]
  5. Gharaibeh, M.A.; Marschner, B.; Heinze, S.; Moos, N. Spatial Distribution of Metals in Soils under Agriculture in the Jordan Valley. Geoderma Reg. 2020, 20, e00245. [Google Scholar] [CrossRef]
  6. FAO. The State of the World’s Land and Water Resources for Food and Agriculture—Systems at Breaking Point (SOLAW 2021); FAO: Rome, Italy, 2021. [Google Scholar]
  7. Liu, H.; Zhang, Y.; Yang, J.; Wang, H.; Li, Y.; Shi, Y.; Li, D.; Holm, P.E.; Ou, Q.; Hu, W. Quantitative Source Apportionment, Risk Assessment and Distribution of Heavy Metals in Agricultural Soils from Southern Shandong Peninsula of China. Sci. Total Environ. 2021, 767, 144879. [Google Scholar] [CrossRef]
  8. Ersoy, A.; Yünsel, T.Y. The Assessment of Soil Contamination by Heavy Metals Using Geostatistical Sequential Gaussian Simulation Method. Hum. Ecol. Risk Assess. 2018, 24, 2142–2161. [Google Scholar] [CrossRef]
  9. Bednářová, Z.; Kalina, J.; Hájek, O.; Sáňka, M.; Komprdová, K. Spatial Distribution and Risk Assessment of Metals in Agricultural Soils. Geoderma 2016, 284, 113–121. [Google Scholar] [CrossRef]
  10. Yuanan, H.; He, K.; Sun, Z.; Chen, G.; Cheng, H. Quantitative Source Apportionment of Heavy Metal(Loid)s in the Agricultural Soils of an Industrializing Region and Associated Model Uncertainty. J. Hazard. Mater. 2020, 391, 122244. [Google Scholar] [CrossRef]
  11. Horta, A.; Azevedo, L.; Neves, J.; Soares, A.; Pozza, L. Integrating Portable X-Ray Fluorescence (PXRF) Measurement Uncertainty for Accurate Soil Contamination Mapping. Geoderma 2021, 382, 114712. [Google Scholar] [CrossRef]
  12. Cicchella, D.; Giaccio, L.; Dinelli, E.; Albanese, S.; Lima, A.; Zuzolo, D.; Valera, P.; De Vivo, B. GEMAS: Spatial Distribution of Chemical Elements in Agricultural and Grazing Land Soil of Italy. J. Geochem. Explor. 2015, 154, 129–142. [Google Scholar] [CrossRef]
  13. Rodríguez Martín, J.A.; Ramos-Miras, J.J.; Boluda, R.; Gil, C. Spatial Relations of Heavy Metals in Arable and Greenhouse Soils of a Mediterranean Environment Region (Spain). Geoderma 2013, 200–201, 180–188. [Google Scholar] [CrossRef]
  14. Darwish, M.A.G.; Pöllmann, H. Trace Elements Assessment in Agricultural and Desert Soils of Aswan Area, South Egypt: Geochemical Characteristics and Environmental Impacts. J. Afr. Earth Sci. 2015, 112, 358–373. [Google Scholar] [CrossRef]
  15. Savignan, L.; Lee, A.; Coynel, A.; Jalabert, S.; Faucher, S.; Lespes, G.; Chéry, P. Spatial Distribution of Trace Elements in the Soils of South-Western France and Identification of Natural and Anthropogenic Sources. Catena 2021, 205, 105446. [Google Scholar] [CrossRef]
  16. Lucke, B.; Ziadat, F.; Taimeh, A. The Soils of Jordan. In Atlas of Jordan; Presses de l’Ifpo: Amman, Jordan, 2013; pp. 72–76. [Google Scholar]
  17. Gharaibeh, M.A.; Albalasmeh, A.A.; El Hanandeh, A. Estimation of Saturated Paste Electrical Conductivity Using Three Modelling Approaches: Traditional Dilution Extracts; Saturation Percentage and Artificial Neural Networks. Catena 2021, 200, 105141. [Google Scholar] [CrossRef]
  18. Chander, K.; Hartmann, G.; Joergensen, R.G.; Khan, K.S.; Lamersdorf, N. Comparison of Methods for Measuring Heavy Metals and Total Phosphorus in Soils Contaminated by Different Sources. Arch. Agron. Soil. Sci. 2008, 54, 413–422. [Google Scholar] [CrossRef]
  19. Mclean, E.O. Soil PH and Lime Requirement. In Methods of Soil Analysis; Agronomy Monographs; Wiley: Hoboken, NJ, USA, 1982; pp. 199–224. ISBN 9780891189770. [Google Scholar]
  20. Rhoades, J.D. Soluble Salts. In Methods of Soil Analysis. Part 2. Chemical and Microbiological Properties; Agronomy Monograph SV-9.2; American Society of Agronomy, Soil Science Society of America: Madison, WI, USA, 2015; pp. 167–179. ISBN 978-0-89118-204-7. [Google Scholar]
  21. Nelson, D.W.; Sommers, L.E. Total Carbon, Organic Carbon, and Organic Matter. BT—Methods of Soil Analysis. Part 3. Chemical Methods. In Methods of Soil Analysis. Part 3. Chemical Methods; Wiley: Hoboken, NJ, USA, 1996; pp. 961–1010. ISBN 0-89118-825-8. [Google Scholar]
  22. Bremner, J.; Mulvaney, C. Nitrogen-Total. In Methods of Soil Analysis. Part 2; Page, A.L., Ed.; Agronomy Monographs; American Society of Agronomy, Soil Science Society of America: Madison, WI, USA, 2015; pp. 595–624. [Google Scholar]
  23. Morgan, G.A.; Barrett, K.C.; Leech, N.L.; Gloeckner, G.W. IBM SPSS for Introductory Statistics: Use and Interpretation; Routledge: New York, NY, USA, 2019. [Google Scholar]
  24. Oliver, A.M.; Webster, R. Basic Steps in Geostatistics: The Variogram and Kriging; 2211-808X; Springer: Cham, Switzerland, 2015; Volume 1, ISBN 9783319158648. [Google Scholar]
  25. Grekousis, G. Spatial Analysis Methods and Practice, 1st ed.; Cambridge University Press: New York, NY, USA, 2020; ISBN 9781108614528. [Google Scholar]
  26. Goovaerts, P. Geostatistics in Soil Science: State-of-the-Art and Perspectives. Geoderma 1999, 89, 1–45. [Google Scholar] [CrossRef]
  27. Kabata-Pendias, A. Trace Elements in Soils and Plants; CRC Press: Boca Raton, FL, USA, 2010; ISBN 9781420093681. [Google Scholar]
  28. Kabata-Pendias, A.; Mukherjee, A.B. Trace Elements from Soil to Human; Springer: Berlin/Heidelberg, Germany, 2007; ISBN 3540327134. [Google Scholar]
  29. Kristamtini; Widyayanti, S.; Widodo, S.; Pustika, A.B.; Purwaningsih, H.; Hanifa, A.P.; Muazam, A.; Sutardi; Badia Ginting, R.C.; Mulia, S.; et al. Potentially Toxic Elements’ (PTEs) Spatial Distribution in Agricultural Soils and Their Impact on Ecological and Health Risks. Case Stud. Chem. Environ. Eng. 2024, 10, 100936. [Google Scholar] [CrossRef]
  30. Marrugo-Negrete, J.; Pinedo-Hernández, J.; Díez, S. Assessment of Heavy Metal Pollution, Spatial Distribution and Origin in Agricultural Soils along the Sinú River Basin, Colombia. Environ. Res. 2017, 154, 380–388. [Google Scholar] [CrossRef]
  31. Fan, M.; Margenot, A.J.; Zhang, H.; Lal, R.; Wu, J.; Wu, P.; Chen, F.; Gao, C. Distribution and Source Identification of Potentially Toxic Elements in Agricultural Soils through High-Resolution Sampling. Environ. Pollut. 2020, 263, 114527. [Google Scholar] [CrossRef]
  32. Sun, C.; Liu, J.; Wang, Y.; Sun, L.; Yu, H. Multivariate and Geostatistical Analyses of the Spatial Distribution and Sources of Heavy Metals in Agricultural Soil in Dehui, Northeast China. Chemosphere 2013, 92, 517–523. [Google Scholar] [CrossRef]
  33. Cai, L.; Xu, Z.; Bao, P.; He, M.; Dou, L.; Chen, L.; Zhou, Y.; Zhu, Y.G. Multivariate and Geostatistical Analyses of the Spatial Distribution and Source of Arsenic and Heavy Metals in the Agricultural Soils in Shunde, Southeast China. J. Geochem. Explor. 2015, 148, 189–195. [Google Scholar] [CrossRef]
  34. Xu, X.; Xu, Z.; Liang, L.; Han, J.; Wu, G.; Lu, Q.; Liu, L.; Li, P.; Han, Q.; Wang, L.; et al. Risk Hotspots and Influencing Factors Identification of Heavy Metal(Loid)s in Agricultural Soils Using Spatial Bivariate Analysis and Random Forest. Sci. Total Environ. 2024, 954, 176359. [Google Scholar] [CrossRef]
  35. Wu, Z.; Hou, Q.; Yang, Z.; Yu, T.; Li, D.; Lin, K.; Ma, X. Identification of Factors Driving the Spatial Distribution of Molybdenum (Mo) in Topsoil in the Longitudinal Range-Gorge Region of Southwestern China Using the Geodetector Model. Ecotoxicol. Environ. Saf. 2024, 271, 115846. [Google Scholar] [CrossRef]
  36. Smith, D.B.; Solano, F.; Woodruff, L.G.; Cannon, W.F.; Ellefsen, K.J. Geochemical and Mineralogical Maps, with Interpretation, for Soils of the Conterminous United States. USGS Sci. Investig. Rep. 2019, 2017–5118. [Google Scholar] [CrossRef]
  37. Reimann, C.; Fabian, K.; Birke, M.; Filzmoser, P.; Demetriades, A.; Négrel, P.; Oorts, K.; Matschullat, J.; de Caritat, P.; Albanese, S.; et al. GEMAS: Establishing Geochemical Background and Threshold for 53 Chemical Elements in European Agricultural Soil. Appl. Geochem. 2018, 88, 302–318. [Google Scholar] [CrossRef]
  38. Baran, A.; Wieczorek, J.; Mazurek, R.; Urbański, K.; Klimkowicz-Pawlas, A. Potential Ecological Risk Assessment and Predicting Zinc Accumulation in Soils. Environ. Geochem. Health 2018, 40, 435–450. [Google Scholar] [CrossRef]
  39. Cambardella, C.A.; Moorman, T.B.; Novak, J.M.; Parkin, T.B.; Karlen, D.L.; Turco, R.F.; Konopka, A.E. Field-Scale Variability of Soil Properties in Central Iowa Soils. Soil Sci. Soc. Am. J. 1994, 58, 1501–1511. [Google Scholar] [CrossRef]
  40. Rodríguez Martín, J.A.; Arias, M.L.; Grau Corbí, J.M. Heavy Metals Contents in Agricultural Topsoils in the Ebro Basin (Spain). Application of the Multivariate Geoestatistical Methods to Study Spatial Variations. Environ. Pollut. 2006, 144, 1001–1012. [Google Scholar] [CrossRef]
  41. Algül, F.; Beyhan, M. Concentrations and Sources of Heavy Metals in Shallow Sediments in Lake Bafa, Turkey. Sci. Rep. 2020, 10, 11782. [Google Scholar] [CrossRef]
  42. Zhang, X.; Wei, S.; Sun, Q.; Wadood, S.A.; Guo, B. Source Identification and Spatial Distribution of Arsenic and Heavy Metals in Agricultural Soil around Hunan Industrial Estate by Positive Matrix Factorization Model, Principle Components Analysis and Geo Statistical Analysis. Ecotoxicol. Environ. Saf. 2018, 159, 354–362. [Google Scholar] [CrossRef]
  43. Zhang, J.; Zhou, F.; Chen, C.; Sun, X.; Shi, Y.; Zhao, H.; Chen, F. Spatial Distribution and Correlation Characteristics of Heavy Metals in the Seawater, Suspended Particulate Matter and Sediments in Zhanjiang Bay, China. PLoS ONE 2018, 13, e0201414. [Google Scholar] [CrossRef] [PubMed]
  44. Douaik, A.; van Meirvenne, M.; Toth, T. Statistical Methods for the Analysis of Soil Spatial and Temporal Variability. In Principles, Application and Assessment in Soil Science; IntechOpen: Rijeka, Croatia, 2011. [Google Scholar]
  45. Verma, R.R.; Srivastava, T.K.; Singh, P.; Manjunath, B.L.; Kumar, A. Spatial Mapping of Soil Properties in Konkan Region of India Experiencing Anthropogenic Onslaught. PLoS ONE 2021, 16, e0247177. [Google Scholar] [CrossRef]
  46. Bhunia, G.S.; Shit, P.K.; Chattopadhyay, R. Assessment of Spatial Variability of Soil Properties Using Geostatistical Approach of Lateritic Soil (West Bengal, India). Ann. Agrar. Sci. 2018, 16, 436–443. [Google Scholar] [CrossRef]
  47. Xu, L.; Zhao, Y.; Wang, M.; Jiang, Y. Spatial Variability of Eight Hazardous Heavy Metals in Agricultural Topsoils: A Case Study from Xuzhou Area, Jiangsu, China. Environ. Pollut. Bioavailab. 2021, 33, 326–333. [Google Scholar] [CrossRef]
  48. Huo, X.N.; Zhang, W.W.; Sun, D.F.; Li, H.; Zhou, L.D.; Li, B.G. Spatial Pattern Analysis of Heavy Metals in Beijing Agricultural Soils Based on Spatial Autocorrelation Statistics. Int. J. Environ. Res. Public Health 2011, 8, 2074–2089. [Google Scholar] [CrossRef]
  49. Behrens, T.; Viscarra Rossel, R.A.; Kerry, R.; MacMillan, R.; Schmidt, K.; Lee, J.; Scholten, T.; Zhu, A.X. The Relevant Range of Scales for Multi-Scale Contextual Spatial Modelling. Sci. Rep. 2019, 9, 14800. [Google Scholar] [CrossRef]
  50. Zhang, B.; Yang, Y. Spatiotemporal Modeling and Prediction of Soil Heavy Metals Based on Spatiotemporal Cokriging. Sci. Rep. 2017, 7, 16750. [Google Scholar] [CrossRef] [PubMed]
  51. Zakeri, F.; Mariethoz, G. A Review of Geostatistical Simulation Models Applied to Satellite Remote Sensing: Methods and Applications. Remote Sens. Environ. 2021, 259, 112381. [Google Scholar] [CrossRef]
  52. Özkan, B.; Dengiz, O.; Turan, İ.D. Site Suitability Analysis for Potential Agricultural Land with Spatial Fuzzy Multi-Criteria Decision Analysis in Regional Scale under Semi-Arid Terrestrial Ecosystem. Sci. Rep. 2020, 10, 22074. [Google Scholar] [CrossRef]
  53. Gumiere, S.J.; Lafond, J.A.; Hallema, D.W.; Périard, Y.; Caron, J.; Gallichand, J. Mapping Soil Hydraulic Conductivity and Matric Potential for Water Management of Cranberry: Characterisation and Spatial Interpolation Methods. Biosyst. Eng. 2014, 128, 29–40. [Google Scholar] [CrossRef]
  54. Shi, G. Kriging. In Data Mining and Knowledge Discovery for Geoscientists; Elsevier: Amsterdam, The Netherlands, 2014; pp. 238–274. [Google Scholar]
  55. Tziachris, P.; Metaxa, E.; Papadopoulos, F.; Papadopoulou, M. Spatial Modelling and Prediction Assessment of Soil Iron Using Kriging Interpolation with PH as Auxiliary Information. ISPRS Int. J. Geoinf. 2017, 6, 283. [Google Scholar] [CrossRef]
  56. Manjarrez-Domínguez, C.B.; Prieto-Amparán, J.A.; Valles-Aragón, M.C.; Delgado-Caballero, M.D.R.; Alarcón-Herrera, M.T.; Nevarez-Rodríguez, M.C.; Vázquez-Quintero, G.; Berzoza-Gaytan, C.A. Arsenic Distribution Assessment in a Residential Area Polluted with Mining Residues. Int. J. Environ. Res. Public Health 2019, 16, 375. [Google Scholar] [CrossRef]
  57. Gupta, A.; Kamble, T.; Machiwal, D. Comparison of Ordinary and Bayesian Kriging Techniques in Depicting Rainfall Variability in Arid and Semi-Arid Regions of North-West India. Environ. Earth Sci. 2017, 76, 512. [Google Scholar] [CrossRef]
  58. Hothorn, T.; Everitt, B.S. A Handbook of Statistical Analyses Using R; CRC Press: Boca Raton, FL, USA, 2014. [Google Scholar]
  59. Shangguan, Y.; Cheng, B.; Zhao, L.; Hou, H.; Ma, J.; Sun, Z.; Xu, Y.; Zhao, R.; Zhang, Y.; Hua, X.; et al. Distribution Assessment and Source Identification Using Multivariate Statistical Analyses and Artificial Neutral Networks for Trace Elements in Agricultural Soils in Xinzhou of Shanxi Province, China. Pedosphere 2018, 28, 542–554. [Google Scholar] [CrossRef]
  60. Han, Y.M.; Cao, J.J.; Wu, F.; Zhang, B.C.; Zhan, C.L.; Wei, C.; Zhao, Z.Z. Geochemistry and Environmental Assessment of Major and Trace Elements in the Surface Sediments of the Wei River, China. J. Environ. Monit. 2012, 14, 2762–2771. [Google Scholar] [CrossRef] [PubMed]
  61. Shukla, K.; Kumar, B.; Agrawal, R.; Priyanka, K.; Venkatesh, M. Anshumali Assessment of Cr, Ni and Pb Pollution in Rural Agricultural Soils of Tonalite–Trondjhemite Series in Central India. Bull. Environ. Contam. Toxicol. 2017, 98, 856–866. [Google Scholar] [CrossRef]
  62. Ghrefat, H.A.; Yusuf, N.; Jamarh, A.; Nazzal, J. Fractionation and Risk Assessment of Heavy Metals in Soil Samples Collected along Zerqa River, Jordan. Environ. Earth Sci. 2012, 66, 199–208. [Google Scholar] [CrossRef]
  63. Yu, R.; Yuan, X.; Zhao, Y.; Hu, G.; Tu, X. Heavy Metal Pollution in Intertidal Sediments from Quanzhou Bay, China. J. Environ. Sci. 2008, 20, 664–669. [Google Scholar] [CrossRef]
  64. Banat, K.M.; Howari, F.M.; To’mah, M.M. Chemical Fractionation and Heavy Metal Distribution in Agricultural Soils, North of Jordan Valley. Soil Sediment Contam. 2007, 16, 89–107. [Google Scholar] [CrossRef]
  65. Franco-Uría, A.; López-Mateo, C.; Roca, E.; Fernández-Marcos, M.L. Source Identification of Heavy Metals in Pastureland by Multivariate Analysis in NW Spain. J. Hazard. Mater. 2009, 165, 1008–1015. [Google Scholar] [CrossRef]
  66. Bux, R.K.; Batool, M.; Shah, S.M.; Solangi, A.R.; Shaikh, A.A.; Haider, S.I.; Shah, Z.-u.-H. Mapping the Spatial Distribution of Soil Heavy Metals Pollution by Principal Component Analysis and Cluster Analyses. Water Air Soil Pollut. 2023, 234, 330. [Google Scholar] [CrossRef]
  67. Al-Kharabsheh, N.M.; Al-Zboon, K.K. Wastewater Treatment and Reuse in Jordan, 10 Years of Development. Desalination Water Treat 2021, 238, 15–27. [Google Scholar] [CrossRef]
  68. Wu, Z.; Zhang, S.; Shan, B.; Zhang, F.; Chen, X. Optimizing Crop Spatial Structure to Improve Water Use Efficiency and Ecological Sustainability in Inland River Basin. Agronomy 2024, 14, 1645. [Google Scholar] [CrossRef]
  69. Mishra, S.; Kumar, R.; Kumar, M. Use of Treated Sewage or Wastewater as an Irrigation Water for Agricultural Purposes- Environmental, Health, and Economic Impacts. Total Environ. Res. Themes 2023, 6, 100051. [Google Scholar] [CrossRef]
Figure 1. Location of collected soil samples.
Land 14 01325 g001
Figure 2. Box-plots for Co, Hg, Mo, Mn, Ni, TP, Org C, and TN contents in fresh (FW) and treated wastewater (TWW) irrigated soils.
Land 14 01325 g002
Figure 3. Box-and-whisker plots of trace element contents for main soil textures in FW- and TWW-irrigated soils.
Land 14 01325 g003
Figure 4. (a) Distribution of trace elements (mg kg−1) using ordinary kriging (OK). (b) Distribution of trace elements (mg kg−1) using empirical Bayesian kriging (EBK).
Land 14 01325 g004aLand 14 01325 g004b
Figure 5. Fitted variogram models of Co, Hg, Mo, Mn, and Ni.
Land 14 01325 g005
Figure 6. Principal component (PC) analysis biplot for trace element contents.
Land 14 01325 g006
Figure 7. Hierarchical relationship (dendrogram) between trace elements and soil properties.
Land 14 01325 g007
Table 1. Nugget, sill, and range values of fitted variogram models for individual trace elements.
ElementNuggetPar SillSillNugget-to-Sill RatioR2RangeModel
Co0.0058410.0151880.0210290.2780.5259,727Spherical
Mn0.0091330.0111930.0203260.4490.6719,526Spherical
Mo0.0114960.0160390.0275350.4180.6619,486Spherical
Ni0.0214680.0094030.0308710.6950.7523,633Spherical
Hg0.0003220.0006720.0009940.3240.061305.4Spherical
Table 2. Cross-validation values of trace elements for evaluating the performance of ordinary kriging (OK) and empirical Bayesian kriging (EBK) models.
CoMnMoNiHg
OKEBKOKEBKOKEBKOKEBKOKEBK
ME−0.00090−0.00027−0.00115−0.00064−0.00180−0.00142−0.00253−0.00208−0.00108−0.00174
RMSE0.079550.074630.107060.101570.120190.113210.154240.142050.038840.04178
MSE0.007640.00192−0.005530.00169−0.01037−0.00435−0.01468−0.00090−0.02944−0.01517
RMSSE0.952000.972540.998660.970810.990730.980580.986421.05821.162460.98664
Avg. SE0.083910.077720.107200.104430.121370.114820.155940.133990.033110.03931
Table 3. Extracted components and loadings for trace elements (bold values indicate significant component loadings).
All TWW FW
ParameterPC1PC2PC3PC1PC2PC3PC4PC1PC2PC3
Co0.8830.156−0.3260.9270.044−0.148−0.1630.690.618−0.121
Mn0.7680.335−0.2450.7960.2330.004−0.230.8320.368−0.154
Mo0.8030.2760.2750.780.1440.445−0.0830.3940.7780.208
Ni0.850.02−0.1260.8930.005−0.037−0.0870.010.686−0.072
Clay0.677−0.122−0.4230.7320.009−0.5190.131−0.1190.078−0.883
Org C0.0360.8150.1310.0210.7740.2020.0080.8070.0420.443
TN0.1940.767−0.0970.1910.846−0.0960.1640.7520.101−0.052
TP0.2210.681−0.420.1580.661−0.073−0.4630.7960.15−0.344
EC_SPE0.0260.0680.8860.0180.0430.9370.115−0.3050.4680.55
Hg−0.226−0.2870.638−0.0990.0430.0620.915−0.369−0.0930.464
Sand−0.86−0.235−0.083−0.879−0.209−0.096−0.126−0.469−0.6870.162
Explained variance (%)37.0318.9716.7138.917.113.111.133.121.215.7
Cumulative37.035672.7138.95669.180.233.154.370
Eigen value4.12.11.84.31.91.41.23.62.31.7
Disclaimer/Publisher’s Note: The statements, opinions and data contained in all publications are solely those of the individual author(s) and contributor(s) and not of MDPI and/or the editor(s). MDPI and/or the editor(s) disclaim responsibility for any injury to people or property resulting from any ideas, methods, instructions or products referred to in the content.

