Abstract
Hurricanes are major drivers of forest structure in the Caribbean. In 2017, Hurricane Maria caused substantial damage to Puerto Rico’s forests. We studied forest structure variation across 75 sites at Las Casas de la Selva, a sustainable forest plantation in Patillas, Puerto Rico, seven years after Hurricane Maria hit the property. At each site we analyzed 360° photos in a 3D VR headset to quantify the vertical structure and transformed them into hemispherical images to quantify canopy closure and ground cover. We also computed the Vertical Habitat Diversity Index (VHDI) from the amount of foliage in four strata: herbaceous, shrub, understory, and canopy. Using the Local Bivariate Relationship tool in ArcGIS Pro, we analyzed the relationship between forest recovery (vertical structure, canopy closure, and ground cover) and damage. Likewise, we analyzed the effects of elevation, slope, and aspect, on damage, canopy closure, and vertical forest structure. We found that canopy closure decreases with increasing elevation and increases with the amount of damage. Higher elevations show a greater amount of damage even seven years post hurricane. We conclude that trees in the mixed tabonuco/plantation forest are more susceptible to hurricanes at higher elevations. The results have implications for plantation forest management under climate-change-driven higher intensity hurricane regimes.
1. Introduction
Hurricanes are severe weather events that are common throughout the Caribbean. As these storms make landfall, they result in extremely dangerous winds, torrential rain, strong storm surges, and coastal flooding. The island of Puerto Rico is frequently in the path of these powerful storms which are expected to increase in intensity due to warming ocean surface temperatures [1,2,3], rapidly intensify more frequently [4,5], and produce more extreme rainfall [6,7,8] because of climate change. The most recent and most powerful hurricane to impact the island since 1928 was Hurricane Maria in 2017. Hurricane Maria made landfall in Puerto Rico on 20 September 2017 as a strong upper-category 4 storm with winds up to 241 kph, causing up to $90 billion in damage [9]. As Maria made landfall, it decimated the island’s power grid [10], cut off access to clean water supplies [11], and caused substantial damage to the forest [12,13,14,15].
Extensive research on how hurricane disturbances affect tropical forests really kicked off following the aftermath of Hurricane Hugo in 1989, with much of the research being conducted within the Luquillo Experimental Forest in Puerto Rico [16,17,18,19,20,21,22,23,24,25,26]. Following a hurricane, trees are damaged from the loss of leaves (defoliation), damage to small branches, breaking of larger branches, and the snapping and uprooting of tree stems [26]. There are numerous factors involved that can contribute to the severity of forest damage which include the topography of the land [14,25,26], land use history [27,28], forest fragmentation [29], tree size [18], tree species [20,30,31], distance from the storm [13,14], and the intensity of the storm [15,32]. A recent study conducted by Uriarte et al. 2019 [15] compared hurricane-induced forest damage caused by Hurricanes Hugo (1989, category 3), Georges (1998, category 3), and Maria (2017, category 4) in the Luquillo Experimental Forest in Puerto Rico. They found that Hurricane Maria had killed twice as many trees and had broken up to 2- to 12-fold more stems compared with the other storms [15]. Taller trees with larger diameters at breast height (DBH) have also been shown to be more vulnerable to snapping or uprooting when compared with shorter trees [18].
While the damage to a forest following a hurricane gives the appearance of significant mortality, the actual mortality of trees in the forest is quite low (4–8% recorded by previous studies in the Caribbean [26,33]) and much of the forest will recover and quickly re-establish new leaves, with some species obtaining new leaves as early as two weeks post hurricane [14,18,26]. In general, studies have shown that the forests of eastern Puerto Rico and the Caribbean are quite resilient to a wide variety of disturbances whether natural or anthropogenic [23,24] and that hurricanes play important roles in forest community dynamics such as increasing spatial heterogeneity, resetting successional patterns and nutrient flows, altering species composition, and inducing longer-term evolutionary change [21,34,35].
While most of the previous work has focused on natural forests, plantation forestry has played an important role in many parts of the Caribbean [36,37,38,39,40,41]. There is much less published research on hurricane impacts in plantation forests, and findings suggest that patterns of damage and recovery vary depending on the tree species. For example, pine trees favored in plantations typically do not resprout or regrow if the main stem is broken or uprooted, unlike many species in natural tropical forests [18,20,26,41,42]. Monoculture plantations differ from natural forests in vertical structure especially in terms of understory vegetation, which may make them more vulnerable to stronger damage from wind [42,43,44,45,46]. Sustainable forestry practices can differ from monocultures in several ways: they are not based on clear cutting the existing forest to make space for planting the preferred species; more than one species of trees may be planted, interspersed with the existing vegetation; the understory may be retained thereby maintaining a more complex vertical structure to the forest than in monocultures. More research is needed to understand the impacts of hurricanes on such plantations to better inform the sustainable management of economically valuable forests.
In this study, we focused on measuring hurricane damage and assessing recovery seven years-post Maria in a sustainable multi-species forestry plantation site at a property called Las Casas de la Selva in southeastern Puerto Rico. Using a combination of 360° photography and virtual reality to analyze forest vertical structure, ground cover and canopy closure across 75 sites, we compared sites that vary in elevation, and the amount of visible damage to determine whether there were long-term effects on forest vertical structure, ground cover, and canopy closure. Our overall scientific goal was to learn more about the long-term impacts a major hurricane such as Maria can have on a subtropical wet plantation forest in Puerto Rico.
Our overarching questions are:
- How does forest vertical structure, ground cover, and canopy closure vary with the amount of damage visible seven years later?
- How does the underlying topography (elevation, slope, and aspect) in this mountainous region influence the damage to the forest (number of dead/recovering trees, canopy closure, vertical structure, and ground cover) on the property?
2. Study Area
Las Casas de la Selva is a property that was established in 1983 in Patillas, Puerto Rico, as an experimental sustainable forestry and rainforest enrichment project. The Institute of Ecotechnics, headquartered in Santa Fe, New Mexico started this project to develop science-driven methods to grow commercially valuable timber species while also helping the regeneration of naturally occurring species in a mixed plantation forest. The goal was to both obtain a better understanding of sustainable practices for managing such mixed plantations and to demonstrate the value of such an approach to private landowners. Prior to acquisition, the majority of the land had undergone extensive logging and was subsequently converted into a coffee plantation. Portions were also used for livestock grazing, which collectively contributed to pronounced soil degradation and severe erosion over time [36]. The property consists of 409 hectares of land which is located along very steep slopes at an average elevation of 600 m (range 508–607 m) and receives an average annual rainfall of ~3000 mm [36,47]. The forest on the property is a mature second-growth forest and classified as subtropical wet forest on the Holdridge Life Zone classification system [48]. The forest is known locally as tabonuco forest, with the candletree (Dacryodes excelsa) being the dominant tree of the forest [36,47]. In 1984, approximately 40,000 valuable hardwood trees were line planted on 87 hectares of land, with each tree spaced at 3 m intervals [47].
Tropical cyclones play a major part of the disturbance regime in Puerto Rico with many storms impacting the island since detailed records started being recorded back in the mid-1800s [23,27]. Some of the more recent storms to make a direct impact or come close to impacting the island can be seen in Figure 1a. When Hurricane Maria made landfall in Puerto Rico on 20 September 2017, it made a direct hit on the property, causing extensive damage. Hundreds of trees were lost, many branches were broken, and much of the forest was completely defoliated (Figure 1b). Even today, seven years after Hurricane Maria, the damage caused can still be seen throughout the property and it is hard to miss for those who have visited before (Figure 2).
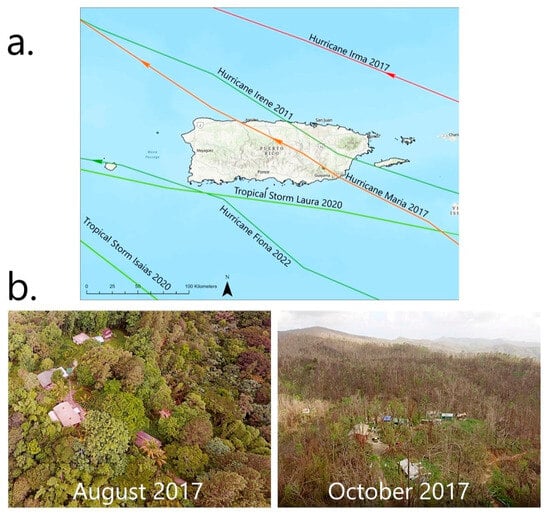
Figure 1.
(a) Tracks for some of the more recent storms to impact the island of Puerto Rico; and (b) aerial photos showing Las Casas de la Selva before and after the storm. Photo credits Thrity Vakil.
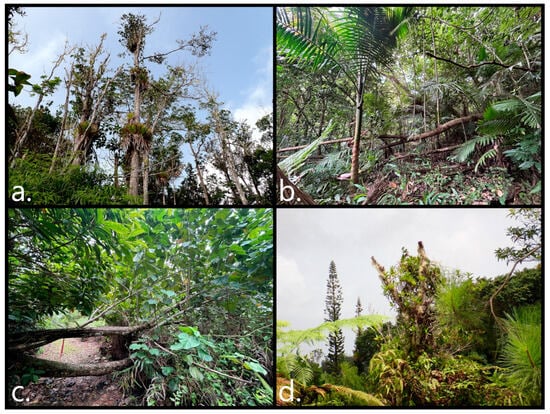
Figure 2.
Photos documenting the state of the property 7 years after Hurricane Maria. (a) This area of the forest was hit hard with many trees displaying a reduced canopy; (b,c) these two photos show uprooted trees still alive; (d) this photo shows a severely damaged tree with relatively recent growth. Photo credits Michael Caslin.
Our study site consists of four zones on the property, of which zones II and III were utilized for our research (Figure 3a). Zones I and IIa occupy harsher terrain and have become much more difficult to access following landslides and other damage from Hurricane Maria. Zone II is a mixed timber plantation consisting of mahogany (Swietenia macrophylla x S. mahagoni) and blue mahoe (Talipariti elatum) and zone III is classified as mixed use consisting of both forest, trails, and human-built structures.
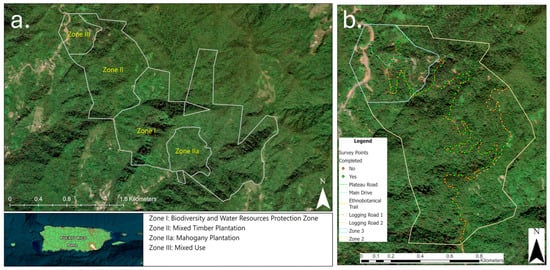
Figure 3.
(a) Property of Las Casas de la Selva broken down by zone. Inset is a map of Puerto Rico showing the location of the property (red box). (b) Map showing the location of complete and incomplete survey points established at 40 m intervals across the trails within zones II and III. The two survey points in orange within zone III were excluded due to possible overlap.
3. Materials and Methods
3.1. Establishing Survey Points
Prior to fieldwork, we established a total of 99 survey points randomly located across the study area on the map using ArcGIS Pro version 3.0.0. However, during a pilot test run at the property, we found reaching most of them to be unfeasible due to extreme terrain and the density of vegetation from secondary growth following Maria. Forced to change our sampling strategy, we, therefore, established 99 survey points along existing trails at 40 m intervals (Figure 3b). We chose the 40 m distance to minimize any overlap in the 360° photos between adjacent sites. While in the field, extra precautions were taken to prevent the possibility of trees and other vegetation overlapping between survey points. For the most part, the combination of dense vegetation along the trails and the 40 m distance was enough to prevent overlapping and any survey locations where overlap was likely were excluded (i.e., open areas).
3.2. 360° Photography and Damage Assessment
The fieldwork was conducted entirely by the first author, Michael Caslin. To reach each survey point in the field, Michael utilized a Garmin GPSMAP 65s unit (Figure 4a), developed by Garmin, an American company headquartered in Olathe, KS, USA. Once arriving at a survey point, he attached a Ricoh Theta V 360° camera (Figure 4b) to a 5-foot small rig tripod to reduce blur and to stabilize the camera and then took several photos. The Ricoh Theta V 360° camera, developed by Ricoh Company Ltd., headquartered in Ōta, Tokyo, Japan, can take still photos at a resolution of 5376 × 2688 and has a photo range from 10 cm to infinity. On the ground, however, the effective photo range at sites was 10–15 m meters due to dense vegetation and hilly topography. To estimate the amount of visible damage, he counted the total number of remaining dead and recovering trees (referred to as the variable “Damage” from here on).
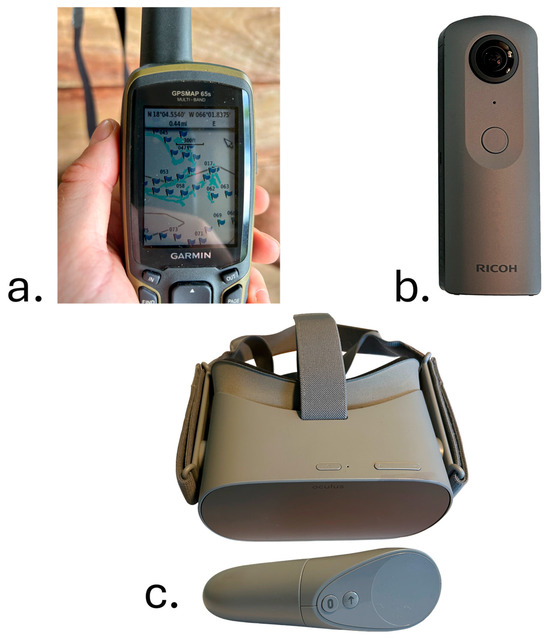
Figure 4.
(a) Garmin GPSMap 65s unit used in the field; (b) Ricoh Theta V 360° Camera; (c) Oculus Go Virtual Reality Headset.
3.3. Data Analysis of 360° and Hemispherical Photos
3.3.1. Estimating Forest Vertical Structure of 360° Photos Through Virtual Reality
Forest vertical structure is often referred to as the “vertical stratification or layering of forest communities in space…” which is an essential characteristic for plant communities [49] (p. 1). To estimate forest vertical structure, each 360° photo was analyzed within the Oculus Go Virtual Reality headset (Figure 4c). The Oculus Go is a standalone virtual reality headset that was developed by Meta Reality Labs (Menlo Park, CA, USA) in partnership with Qualcomm (Folsom, CA, USA) and Xiaomi (Beijing, China). The Oculus Go has a single 5.5-inch LCD display with a resolution of 1280 x 1400 pixels per eye and has a storage capacity of 32 GB or 64 GB. For each photo, Caslin determined the presence of four layers which include: (1) herbaceous layer, (2) shrub layer, (3) understory layer, (4) canopy layer. The different layers were primarily determined by the height of the vegetation. The herbaceous layer consisted of vegetation that had no woody stems which included grass, ferns, and vines. For the herbaceous layer, the height ranged from 0.15 to 1.3 m. The shrub layer consisted of plants with woody stems such as shrubs and small trees. This layer’s height ranged from 1.3 to 4.3 m. The understory layer consists of vegetation in a wooded area where shrubs and trees are growing between the forest canopy and forest floor. In this layer the height ranged from 4.3 m up to just below the canopy. Finally, the canopy layer consists of the top layer of a forest which makes up the crowns of all the trees that overlap to form the roof over the rest of the forest. To determine the presence of these layers within the VR headset, Caslin first selected a landmark location (e.g., a tree or landscape feature). Next, turning clockwise, he recorded the presence of foliage in each of the 4 layers within 30° slices of the 360° view to capture the entire image (Figure 5a). Throughout the analysis for each photo, the PI recorded himself and then listened to the recording later to enter the data within a spreadsheet. Following Bai’s [50] method, we calculated two measures of Vertical Habitat Diversity Index (VHDI) by applying the Shannon–Weiner index and the Simpson diversity index to these data, using layer for “species” and the frequency of each layer as “abundance”.
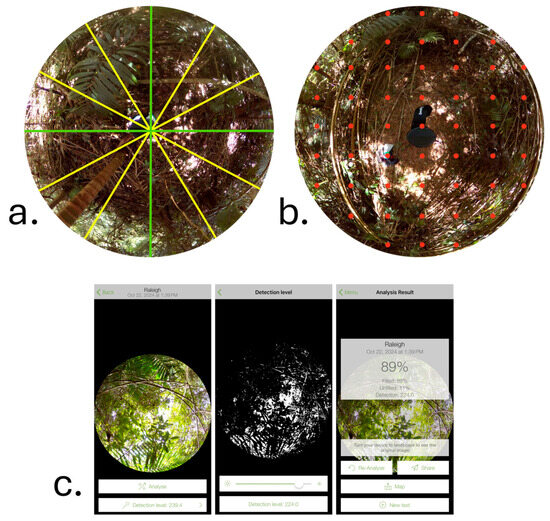
Figure 5.
(a) Photo example visualizing how the PI used the VR headset to analyze forest vertical structure; (b) hemispherical photo focusing on the ground with 51 systematic sampling points (points were enlarged to increase visibility); (c) analysis of canopy closure using the % Cover app version 1.2.0.
3.3.2. Analysis of Ground Cover Vegetation
Many of the sampling locations featured a dense growth of vegetation covering up much of the ground. The ground cover consisted of the ground itself ranging from bare ground (dirt/soil) to leaf litter, rocks, and gravel as well as the types of low-growing plants that are commonly found throughout the forest floor which can range from low-growing plants such as grass and ferns up to small trees. The higher growing trees were also accounted for when our sampling points were overlaid on top of them. We grouped the ground cover into eight categories: (1) trees, (2) small trees/saplings, (3) shrubs, (4) ferns, (5) bamboo, (6) vines, (7) herbaceous (specifically grass), (8) bare ground/leaves/rock/gravel.
To analyze the ground cover, we transformed each 360° photo into hemispherical photos focusing on the ground, using GIMP version 2.10.12. We batch processed images within GIMP using an additional plugin called BIMP (Batch Image Manipulation Plugin). Next, we created a systematic point sampling grid utilizing Krita version 5.2.6. A total of 51 sample points were overlaid on each hemispherical photo (Figure 5b). The ground cover type was then determined at each of the 51 systematic point locations in each photo.
3.3.3. Analysis of Forest Canopy Closure
Within the field of forestry, “canopy cover is the area of the ground covered by a vertical projection of the canopy, while canopy closure is the proportion of the sky hemisphere obscured by vegetation when viewed from a single point” [51] (p. 59). To measure canopy closure, we again transformed the 75 360° photos into hemispherical images pointing up rather than down, i.e., only focusing on the canopy and excluding the ground. Each photo was then separately analyzed utilizing the % Cover app (Figure 5c). The % Cover app is an environmental application that was designed to be used on iOS devices and provides a direct estimate of canopy closure.
3.4. Geospatial Data
To determine how the underlying topography influenced the damage seen on the property, we obtained a 1/3 arc-second Digital Elevation Model (10 m DEM, accessed on 10 August 2024) from the U.S. Geological Survey (https://apps.nationalmap.gov/downloader/). Within ArcGIS Pro, the DEM was utilized to create elevation, slope, and aspect maps. The data associated with each of these layers was then extracted to each of the 75 survey points to be used in our analysis.
3.5. Statistical Analysis
We assessed spatial clustering for vegetation variables using the Moran’s I statistic in ArcGIS Pro (v. 3.3). We found local clustering in canopy closure and damage (Table 1), but there was no clustering in VHDI or any of the ground cover variables. To account for the clustering seen, we ran Local Bivariate Relationships (LBR) analyses in ArcGIS Pro between (1) canopy closure (dependent) and elevation, damage, and ground cover variables (explanatory); (2) damage (dependent) and elevation (explanatory). To further explore potential spatially varying multivariate relationships between these and other environmental predictors (slope and aspect), we considered Multiscale Geographically Weighted Regression (MGWR), which allows for the local estimation of regression coefficients. However, given the study area’s limited spatial extent and consistent scale of topographic gradients, as well as our relatively small overall sample size (ArcGIS Pro recommends sample sizes in the hundreds for MGWR), we determined that such an analysis would not be appropriate with our dataset.

Table 1.
Variables with significant spatial autocorrelations.
4. Results
4.1. Canopy Closure Decreased with Increasing Elevation
We found that seven years after Hurricane Maria made landfall, there remains a significant pattern of decreasing canopy closure (%) with increasing elevation (Figure 6). The Local Bivariate Relationship analysis found spatial clustering in the pattern of this relationship, with two groupings showing a statistically significant relationship between canopy closure and elevation: (a) 39 sites (in green in the upper half of the map in Figure 6) showed a significant linear negative relationship with canopy closure (%) decreasing steadily with increasing elevation (adjusted R2 = 0.4596; AICc = −5.2835); (b) 17 sites (in orange in the middle of the map in Figure 6) had a significant concave relationship, with canopy closure (%) not changing much at lower elevations but decreasing steeply at higher elevations (adjusted R2 = 0.4256; AICc = −6.3739). The remaining 17 sites did not exhibit any significant relationship between elevation and canopy closure. We used the adjusted R2 and AICc results to evaluate our models. The small sample corrected Akaike Information Criterion (AICc) provides an extra penalty term for the number of parameters used in the model. This correction helps to mitigate the tendency of the standard AIC to overfit the data when the sample size is small relative to the number of parameters [52].
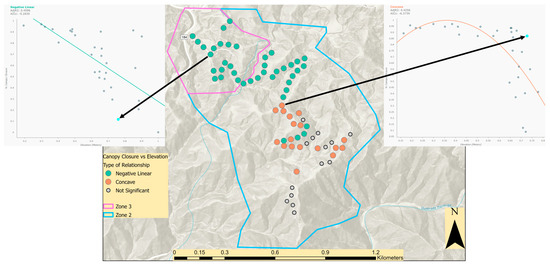
Figure 6.
Local Bivariate Relationship results with % canopy closure as the dependent variable and elevation as the explanatory variable. Two statistically significant groupings were found with 39 sites showing a significant negative linear relationship between canopy closure and elevation (pop-out graph on top left; adjusted R2 = 0.4596; AICc = −5.2835) and 17 sites showing a significant concave relationship between canopy closure and elevation (pop-out graph on top right; adjusted R2 = 0.4256; AICc= −6.3739). The blue dot in each of the pop-out graphs represents a survey point on the map.
4.2. Canopy Closure Decreased with Amount of Damage
We found that seven years after Maria, there remains a significant pattern of lower canopy closure (%) at sites that exhibit more damage (Figure 7). The LBR analysis found spatial clustering in the pattern of this relationship, with one group of 19 sites (in green in the upper portion of the map, mostly restricted to the third zone—Figure 8) showing a statistically significant negative linear relationship (adjusted R2 = 0.3235; AICc = 1.4588). While the remaining 54 sites were grouped as showing no significant relationship between canopy closure and damage, the scatterplot (top right of Figure 7) indicates a similar pattern of lower canopy closure with higher damage.
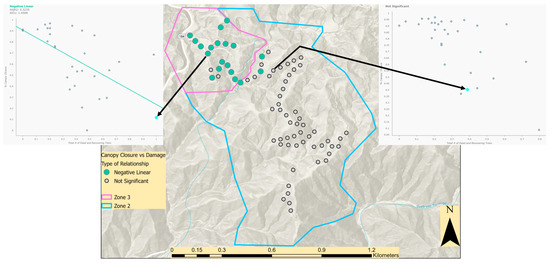
Figure 7.
Local Bivariate Relationship results with % canopy closure as the dependent variable and damage as the explanatory variable. One statistically significant cluster was found with 19 sites showing a significant negative linear relationship between canopy closure and damage (pop-out graph on top left; adjusted R2 = 0.3235; AICc = 1.4588). The remaining sites showed no significant relationship (pop-out graph on top right).
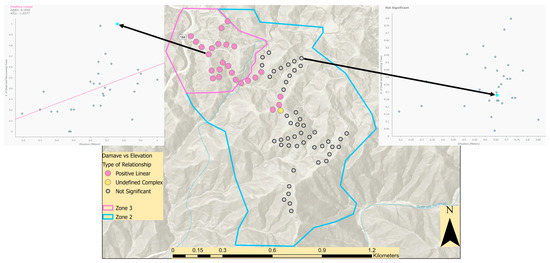
Figure 8.
Local Bivariate Relationship results with damage as the dependent variable and elevation as the explanatory variable. One significant cluster was found with 25 sites exhibiting a positive linear relationship between damage and elevation (pop-out graph on top left; adjusted R2 = 0.1910, AICc = −1.0277). The remaining sites showed no significant relationship between damage and elevation (pop-out graph on top right).
4.3. Amount of Damage Increased with Elevation
Seven years after Maria, we found that higher elevations were associated with more severe damage as seen in more dead and recovering trees remaining at a number of sites. The LBR analysis found spatial clustering in the pattern of this relationship, with one group of 25 sites (in pink in the upper portion of the map, mostly restricted to the third zone, Figure 8) showing a statistically significant positive relationship between damage and elevation (adjusted R2 = 0.1910; AICc = −1.0277). Of the remaining sites, 47 did not exhibit any significant relationship between damage and elevation, although the scatterplot (top right of Figure 7) indicates a similar pattern of higher damage at higher elevations. The LBR analysis further marked one site as an undefined complex. It should be noted, however, that these results are only applicable for the tabonuco forest found on the island of Puerto Rico and may not apply to other types of forest on the island.
4.4. Forest Vertical Structure (Vertical Habitat Diversity Index) and Ground Cover Variables Did Not Vary with Damage or Elevation
Applying LBR analyses, we did not detect any significant relationship between VHDI (both Shannon–Weiner and Simpson’s indices) and damage, nor between VHDI and elevation across all the sample sites.
Similarly, applying LBR analyses, we did not detect any significant relationship between any of the ground cover variables and damage, nor between the ground cover variables and elevation.
5. Discussion
In this study, we investigated Hurricane Maria’s long-term impact on the forest at Las Casas de la Selva at the landscape level. We were specifically interested in determining whether there were any noticeable effects on multiple components of the forest from the canopy down to the ground cover on the forest floor still measurable seven years after Maria hit the site.
There have been many scientific studies investigating the impacts of hurricanes on forests in the Caribbean which include the immediate damage from the storm [15,19,26,34,53] to short-term and long-term recovery [16,17,21] to forest resilience [23,24]. However, much of the information we have gained from previous studies has been on hurricanes of categories 3 and lower and, thus, does not account for a changing climate where hurricanes like Maria are expected to become more common [1,5]. Considering this, one important question is whether the resilience of the forest to hurricanes can be maintained as these storms become more severe, more common, and cause even more damage [15].
When Hurricane Maria made landfall in Puerto Rico, it struckLas Casas de la Selva directly. According to co-author Thrity Vakil, director of the Tropic Ventures Sustainable Forestry & Rainforest Enrichment Project, the property suffered extensive damage, with hundreds of trees lost. All forest damage was attributed to the wind. Vakil estimates that approximately 80% of the planted Caribbean pine and 20% of the planted blue mahoe were destroyed, substantially higher than the 4–8% mortality rates reported in previous studies of hurricane impacts in the Caribbean [26,33]. Vakil also observed significant delays in leaf regeneration among severely affected trees at higher elevations, aligning with unpublished findings by Brokaw and Walker (1991). In some cases—such as mahogany trees that initially appeared dead—it took up to three years for new foliage to emerge [19].
5.1. More Severe Damage at Higher Elevations
The relationship between elevation and greater hurricane damage to the forest has been well documented [13,14,25,26,31,54,55,56,57]. However, there is an inconsistency as to whether hurricane-induced forest damage is worse at higher elevations [13,25,54,56,57] or lower elevations [14,31,55]. This is because the interaction between the forest and hurricanes is complex with many factors needing to be considered such as differences in forest type and forest composition, storm intensity, storm proximity, elevation, slope, tree species, soil types, and previous land use history.
For our research, we found there to be a statistically significant pattern of decreasing forest canopy closure at higher elevations, seven years after the hurricane. However, we also found significant spatial variation in this relationship across the study site (Figure 6), suggesting that there may be underlying environmental gradients or effects of past land use management [36,47]. This spatial clustering further underscores the importance of considering spatial dependence in future modeling. Future research should also include additional variables such as local land use history prior to the establishment of the plantation, management history, soil properties such as stability or erosion potential, and other potentially relevant environmental variables that may offer a more nuanced understanding of hurricane impacts, and in turn offer more targeted management options. It is important to note that due to the study site’s limited spatial extent and relatively uniform topography, factors such as elevation, slope, and aspect are assumed to operate at a comparable scale. To better understand how topographic variation influences forest vulnerability to hurricane disturbance, future research should expand to a broader spatial scale—such as regional or island-wide analysis—where range of topographic conditions can be assessed.
Our results mean that the canopy of the mixed tabonuco/plantation forest is much more vulnerable at higher elevations at our study site. These results are consistent with the larger loss of trees and the delayed regrowth of leaves at higher elevations on the property. In addition, based on natural history notes and photographs taken by Caslin during several past (2012 and 2014) and recent (2022 and 2024) visits to the property, many areas of the property at higher elevations were completely transformed (Figure 9). There were sections of the property that were once densely forested to the point where little sun reached the forest floor but now appear completely opened up following Hurricane Maria’s impact.

Figure 9.
Time series showing forest change at the property of Las Casas de la Selva. (a) Photo taken along the driveway in June 2012. (b) Photo taken shortly after Hurricane Maria made landfall in September 2017. (c) Photo showing the current conditions at the site in July 2024. The three photos are located at the following coordinates (18.079658, −66.036322). Photo credits Michael Caslin (a,c), Thrity Vakil (b).
While elevation had a major influence on the damage found seven years post-Maria, elevation alone is not the sole predictor of damage. We believe additional factors in combination with elevation have contributed to the overall severity of damage found on the property. These additional factors include the proximity of Maria’s storm path (the eye passed very close to our study site), the category of the storm (upper category 4) [15,30], and previous agricultural land use [28,58] that resulted in major erosion throughout parts of the property. This result suggests that there can be major implications for plantations established at higher elevations from more intense storms and that careful consideration must be made before the establishment of new plantations. More research is needed to better understand what the implications to the plantation forest are due to proximity of the storm path, intensity, and previous land use.
5.2. Lower Canopy Closure at More Severely Damaged Sites
We also found that even seven years post-Maria, there remains a statistically significant pattern of lower canopy closure visible at the more severely impacted sites (Figure 8). As discussed above for elevation, we also found significant spatial variation in this relationship across the site, further emphasizing the importance of considering spatial dependence in future studies. It is not surprising to find that the canopy has recovered slower at more severely damaged sites considering how many trees were lost in these areas and how much longer it will take for more trees and new branches to regrow and fill in the gaps within the canopy [35].
5.3. Similar Recovery of Ground Cover and Vertical Forest Structure Across Sites
Finally, we found there to be no difference in ground cover or vertical forest structure (VHDI) across sites differing in severity of damage which indicates that the four foliage layers of the forest had largely recovered by the time fieldwork was conducted in July of 2024. This surprising result, contrasting with the results for canopy closure described above, suggests that forest recovery after the hurricane has been complex, with faster recovery of foliage at different heights resulting in a similar vertical structure even as the overhead canopy is taking longer to recover in more severely damaged sites.
Overall, when looking at how much influence different landscape factors had on forest recovery from hurricane damage seven years later, the strongest effects were on canopy closure. This is further indication that, at this point in time, it appears that most of the vertical structure of the forest as well as much of the ground cover vegetation has recovered while the canopy has not in more severely hit sites. This may be expected considering that the forest canopy is much more exposed to the strong wind gusts from a hurricane, and even more so at higher elevations.
6. Conclusions
Considering the widespread impacts hurricanes have on both natural and plantation forests throughout the Caribbean, it is crucial to continue with long-term research that aims to provide a clearer understanding of hurricane impacts on different components of the forest. We have shown that elevation has a large influence on which areas of the mixed plantation/tabonuco forest at Las Casas de la Selva will be the most susceptible to hurricane damage, with trees at higher elevations being the most vulnerable, as well as having relatively long-lasting impacts that persist for at least 7 years in the case of Hurricane Maria. Our finding of spatial clustering in the relationships between several key variables (canopy closure, elevation, and damage) indicates potential spatial variation in other underlying environmental or vegetation variables for future research and management planning to consider. Our results have major implications for plantation forestry, and can be used to inform forest or plantation land managers that are in the plantation establishment or re-establishment phase to plant at lower elevations in tabonuco forest in order to avoid the worst hurricane damage, and in the aftermath of hurricanes to focus on the regeneration of trees in the understory to restore the forest canopy faster, and potentially speed up overall forest recovery.
Author Contributions
M.W.C. conceptualized and established the project, established the survey points, conducted the fieldwork, data entry, statistical analysis, created the figures, and wrote the manuscript. M.K. provided important guidance and support to M.W.C. including conceptualizing the study and writing the manuscript. S.A.C.N. provided important guidance, helped M.W.C. in the establishment of survey points, and proofread the manuscript. T.V. played an important role by allowing M.W.C. to conduct his research on the property, provided much-needed information on the history of the property, and provided critical insight about the damage caused to the property/forests/plantations and recovery. All authors have read and agreed to the published version of the manuscript.
Funding
This research was funded by the US Department of Agriculture (McIntire Stennis Capacity Grant #427319-20233).
Data Availability Statement
The 360° photos used to support our findings have been submitted for data curation on DRYAD and currently under review. In the meantime, please contact us directly to gain access to our data. The URL for the Ricoh Theta PC App (accessed on 30 April 2025) for viewing 360° photos without a VRHeadset can be found: https://support.ricoh360.com/app-download. Software URLs: (all accessed on 30 April 2025) https://www.gimp.org/downloads/, https://alessandrofrancesconi.it/projects/bimp/. Product Specifications (all accessed on 30 April 2025): https://us.ricoh-imaging.com/product/theta-v/, https://vr-compare.com/headset/oculusgo.
Acknowledgments
We thank co-author Thrity Vakil, director of the Tropic Ventures Sustainable Forestry & Rainforest Enrichment Project, for providing site access, housing, and logistical support.
Conflicts of Interest
The authors declare no conflicts of interest.
References
- Walsh, K.J.E.; McBride, J.L.; Klotzbach, P.J.; Balachandran, S.; Camargo, S.J.; Holland, G.; Knutson, T.R.; Kossin, J.P.; Lee, T.C.; Sobel, A.; et al. Tropical Cyclones and Climate Change. WIREs Clim. Change 2016, 7, 65–89. [Google Scholar] [CrossRef]
- Knutson, T.R.; McBride, J.L.; Chan, J.; Emanuel, K.; Holland, G.; Landsea, C.; Held, I.; Kossin, J.P.; Srivastava, A.K.; Sugi, M. Tropical Cyclones and Climate Change. Nat. Geosci. 2010, 3, 157–163. [Google Scholar] [CrossRef]
- Knutson, T.; Camargo, S.J.; Chan, J.C.L.; Emanuel, K.; Ho, C.-H.; Kossin, J.; Mohapatra, M.; Satoh, M.; Sugi, M.; Walsh, K.; et al. Tropical Cyclones and Climate Change Assessment: Part II: Projected Response to Anthropogenic Warming. Bull. Am. Meteorol. Soc. 2020, 101, E303–E322. [Google Scholar] [CrossRef]
- Radfar, S.; Moftakhari, H.; Moradkhani, H. Rapid Intensification of Tropical Cyclones in the Gulf of Mexico Is More Likely during Marine Heatwaves. Commun. Earth Environ. 2024, 5, 421. [Google Scholar] [CrossRef]
- Balaguru, K.; Foltz, G.R.; Leung, L.R. Increasing Magnitude of Hurricane Rapid Intensification in the Central and Eastern Tropical Atlantic. Geophys. Res. Lett. 2018, 45, 4238–4247. [Google Scholar] [CrossRef]
- Li, X.; Fu, D.; Nielsen-Gammon, J.; Gangrade, S.; Kao, S.-C.; Chang, P.; Hernández, M.M.; Voisin, N.; Zhang, Z.; Gao, H. Impacts of Climate Change on Future Hurricane Induced Rainfall and Flooding in a Coastal Watershed: A Case Study on Hurricane Harvey. J. Hydrol. 2023, 616, 128774. [Google Scholar] [CrossRef]
- Reed, K.A.; Wehner, M.F.; Zarzycki, C.M. Attribution of 2020 Hurricane Season Extreme Rainfall to Human-Induced Climate Change. Nat. Commun. 2022, 13, 1905. [Google Scholar] [CrossRef]
- Trenberth, K.E. Changes in Precipitation with Climate Change. Clim. Res. 2011, 47, 123–138. [Google Scholar] [CrossRef]
- Pasch, R.; Penny, A.; Berg, R. Tropical Cyclone Report: Hurricane Maria (AL152017) 16-30 September 2017. National Hurricane Center. 2017. Available online: https://www.nhc.noaa.gov/data/tcr/AL152017_Maria.pdf (accessed on 30 April 2025).
- Lopez-Cardalda, G.; Lugo-Alvarez, M.; Mendez-Santacruz, S.; Rivera, E.O.; Bezares, E.A. Learnings of the Complete Power Grid Destruction in Puerto Rico by Hurricane Maria. In Proceedings of the 2018 IEEE International Symposium on Technologies for Homeland Security (HST), Woburn, MA USA, 23–24 October 2018; pp. 1–6. [Google Scholar]
- Lin, Y.; Sevillano-Rivera, M.; Jiang, T.; Li, G.; Cotto, I.; Vosloo, S.; Carpenter, C.M.G.; Larese-Casanova, P.; Giese, R.W.; Helbling, D.E.; et al. Impact of Hurricane Maria on Drinking Water Quality in Puerto Rico. Environ. Sci. Technol. 2020, 54, 9495–9509. [Google Scholar] [CrossRef]
- Feng, Y.; Negron-Juarez, R.I.; Patricola, C.M.; Collins, W.D.; Uriarte, M.; Hall, J.S.; Clinton, N.; Chambers, J.Q. Rapid Remote Sensing Assessment of Impacts from Hurricane Maria on Forests of Puerto Rico. PeerJ Preprints 2018, 6, e26597v1. [Google Scholar] [CrossRef]
- Feng, Y.; Negrón-Juárez, R.I.; Chambers, J.Q. Remote Sensing and Statistical Analysis of the Effects of Hurricane María on the Forests of Puerto Rico. Remote Sens. Environ. 2020, 247, 111940. [Google Scholar] [CrossRef]
- Hu, T.; Smith, R.B. The Impact of Hurricane Maria on the Vegetation of Dominica and Puerto Rico Using Multispectral Remote Sensing. Remote Sens. 2018, 10, 827. [Google Scholar] [CrossRef]
- Uriarte, M.; Thompson, J.; Zimmerman, J.K. Hurricane María Tripled Stem Breaks and Doubled Tree Mortality Relative to Other Major Storms. Nat. Commun. 2019, 10, 1362. [Google Scholar] [CrossRef]
- Tanner, E.V.J.; Kapos, V.; Healey, J.R. Hurricane Effects on Forest Ecosystems in the Caribbean. Biotropica 1991, 23, 513–521. [Google Scholar] [CrossRef]
- Tanner, E.V.J.; Rodriguez-Sanchez, F.; Healey, J.R.; Holdaway, R.J.; Bellingham, P.J. Long-Term Hurricane Damage Effects on Tropical Forest Tree Growth and Mortality. Ecology 2014, 95, 2974–2983. [Google Scholar] [CrossRef]
- Walker, L.R. Tree Damage and Recovery From Hurricane Hugo in Luquillo Experimental Forest, Puerto Rico. Biotropica 1991, 23, 379–385. [Google Scholar] [CrossRef]
- Walker, L.R.; Voltzow, J.; Ackerman, J.D.; Fernandez, D.S.; Fetcher, N. Immediate Impact of Hurricance Hugo on a Puerto Rican Rain Forest. Ecology 1992, 73, 691–694. [Google Scholar] [CrossRef]
- Zimmerman, J.K.; Everham, E.M., III; Waide, R.B.; Lodge, D.J.; Taylor, C.M.; Brokaw, N.V.L. Responses of Tree Species to Hurricane Winds in Subtropical Wet Forest in Puerto Rico: Implications for Tropical Tree Life Histories. J. Ecol. 1994, 82, 911–922. [Google Scholar] [CrossRef]
- Zimmerman, J.K.; Willig, M.R.; Walker, L.R.; Silver, W.L. Introduction: Disturbance and Caribbean Ecosystems. Biotropica 1996, 28, 414–423. [Google Scholar] [CrossRef]
- Zimmerman, J.K.; Hogan, J.A.; Shiels, A.B.; Bithorn, J.E.; Carmona, S.M.; Brokaw, N. Seven-Year Responses of Trees to Experimental Hurricane Effects in a Tropical Rainforest, Puerto Rico. For. Ecol. Manag. 2014, 332, 64–74. [Google Scholar] [CrossRef]
- Zimmerman, J.K.; Willig, M.R.; Hernández-Delgado, E.A. Resistance, Resilience, and Vulnerability of Social-Ecological Systems to Hurricanes in Puerto Rico. Ecosphere 2020, 11, e03159. [Google Scholar] [CrossRef]
- Zimmerman, J.K.; Wood, T.E.; González, G.; Ramirez, A.; Silver, W.L.; Uriarte, M.; Willig, M.R.; Waide, R.B.; Lugo, A.E. Disturbance and Resilience in the Luquillo Experimental Forest. Biol. Conserv. 2021, 253, 108891. [Google Scholar] [CrossRef]
- Brokaw, N.V.L.; Grear, J.S. Forest Structure Before and After Hurricane Hugo at Three Elevations in the Luquillo Mountains, Puerto Rico. Biotropica 1991, 23, 386–392. [Google Scholar] [CrossRef]
- Brokaw, N.V.L.; Walker, L.R. Summary of the Effects of Caribbean Hurricanes on Vegetation. Biotropica 1991, 23, 442–447. [Google Scholar] [CrossRef]
- Boose, E.R.; Serrano, M.I.; Foster, D.R. Landscape and Regional Impacts of Hurricanes in Puerto Rico. Ecol. Monogr. 2004, 74, 335–352. [Google Scholar] [CrossRef]
- Uriarte, M.; Rivera, L.W.; Zimmerman, J.K.; Aide, T.M.; Power, A.G.; Flecker, A.S. Effects of Land Use History on Hurricane Damage and Recovery in a Neotropical Forest. Plant Ecol. 2004, 174, 49–58. [Google Scholar] [CrossRef]
- Schwartz, N.B.; Uriarte, M.; DeFries, R.; Bedka, K.M.; Fernandes, K.; Gutiérrez-Vélez, V.; Pinedo-Vasquez, M.A. Fragmentation Increases Wind Disturbance Impacts on Forest Structure and Carbon Stocks in a Western Amazonian Landscape. Ecol. Appl. 2017, 27, 1901–1915. [Google Scholar] [CrossRef]
- Thompson, D.A. Effects of Hurricane Allen on Some Jamaican Forests. Commonw. For. Rev. 1983, 62, 107–115. [Google Scholar]
- Boose, E.R.; Foster, D.R.; Fluet, M. Hurricane Impacts to Tropical and Temperate Forest Landscapes. Ecol. Monogr. 1994, 64, 369–400. [Google Scholar] [CrossRef]
- Canham, C.D.; Thompson, J.; Zimmerman, J.K.; Uriarte, M. Variation in Susceptibility to Hurricane Damage as a Function of Storm Intensity in Puerto Rican Tree Species. Biotropica 2010, 42, 87–94. [Google Scholar] [CrossRef]
- Bellingham, P.J. Landforms Influence Patterns of Hurricane Damage: Evidence from Jamaican Montane Forests. Biotropica 1991, 23, 427–433. [Google Scholar] [CrossRef]
- Boucher, D.H. Growing Back after Hurricanes. BioScience 1990, 40, 163–166. [Google Scholar] [CrossRef]
- Lugo, A.E. Visible and Invisible Effects of Hurricanes on Forest Ecosystems: An International Review. Austral Ecol. 2008, 33, 368–398. [Google Scholar] [CrossRef]
- Nelson, M.; Silverstone, S.; Reiss, K.C.; Vakil, T.; Robertson, M. Enrichissement Des Forêts Secondaires Subtropicales Par Des Plantations Linéaires Permettant Une Production Forestière Durable à Puerto Rico. BOIS For. Trop. 2011, 309, 51–61. [Google Scholar] [CrossRef]
- Redondo-Brenes, A. Growth, Carbon Sequestration, and Management of Native Tree Plantations in Humid Regions of Costa Rica. New For. 2007, 34, 253–268. [Google Scholar] [CrossRef]
- Francis, J.K. Mahogany Planting and Research in Puerto Rico and the U.S. Virgin Islands. In Big-Leaf Mahogany: Genetics, Ecology, and Management; Lugo, A.E., Colón, J.C.F., Alayón, M., Eds.; Ecological Studies; Springer: New York, NY, USA, 2003; pp. 329–341. [Google Scholar] [CrossRef]
- Francis, J.K.; Weaver, P.L.; Weaver, F.L. Performance of Hibiscus Elatus in Puerto Rico. Commonw. For. Rev. 1988, 67, 327–338. [Google Scholar]
- Lugo, A.; Rodriguez, C.; Fermont, I.; Vicens, I. Response to Hurricanes of Pinus Caribaea Var Hondurensis Plantations in Puerto Rico. Caribb. Nat. 2018, 43, 1–16. [Google Scholar]
- Bunce, H.W.F.; Mclean, J.A. Hurricane Gilbert’s Impact on the Natural Forests and Pinus Caribaea Plantations of Jamaica. Commonw. For. Rev. 1990, 69, 147–155. [Google Scholar]
- Boucher, D.H.; Vandermeer, J.H.; Yih, K.; Zamora, N. Contrasting Hurricane Damage in Tropical Rain Forest and Pine Forest. Ecology 1990, 71, 2022–2024. [Google Scholar] [CrossRef]
- Everham, E.M.; Brokaw, N.V.L. Forest Damage and Recovery from Catastrophic Wind. Bot. Rev. 1996, 62, 113–185. [Google Scholar] [CrossRef]
- Lugo, A.E. The Apparent Paradox of Reestablishing Species Richness on Degraded Lands with Tree Monocultures. For. Ecol. Manag. 1997, 99, 9–19. [Google Scholar] [CrossRef]
- Longworth, J.B.; Williamson, G.B. Composition and Diversity of Woody Plants in Tree Plantations Versus Secondary Forests in Costa Rican Lowlands. Trop. Conserv. Sci. 2020, 11, 1–13. [Google Scholar] [CrossRef]
- Imbert, D.; Labbé, P.; Rousteau, A. Hurricane Damage and Forest Structure in Guadeloupe, French West Indies. J. Trop. Ecol. 1996, 12, 663–680. [Google Scholar] [CrossRef]
- Nelson, M.; Silverstone, S.; Reiss, K.C.; Burrowes, P.; Joglar, R.; Robertson, M.; Vakil, T. The Impact of Hardwood Line-Planting on Tree and Amphibian Diversity in a Secondary Subtropical Wet Forest of Southeast Puerto Rico. J. Sustain. For. 2010, 29, 503–516. [Google Scholar] [CrossRef]
- Ewel, J.J.; Whitmore, J.L. The Ecological Life Zones of Puerto Rico and the U.S. Virgin Islands; USDA Forest Service, Institute of Tropical Forestry: Río Piedras, PR, USA, 1973. [Google Scholar]
- Zhou, X.; Li, C. Mapping the Vertical Forest Structure in a Large Subtropical Region Using Airborne LiDAR Data. Ecol. Indic. 2023, 154, 110731. [Google Scholar] [CrossRef]
- Bai, J. From Redlining to COVID-19: How Humans Affect Bird Diversity and Distribution in Urban North Carolina. Ph.D. Thesis, North Carolina State University, Raleigh, NC, USA, 2024. Available online: https://www.lib.ncsu.edu/resolver/1840.20/42051 (accessed on 30 April 2025).
- Jennings, S.B.; Brown, N.D.; Sheil, D. Assessing Forest Canopies and Understorey Illumination: Canopy Closure, Canopy Cover and Other Measures. Forestry Int. J. For. Res. 1999, 72, 59–74. [Google Scholar] [CrossRef]
- Murtaugh, P.A. In defense of P values. Ecology 2014, 95, 611–617. [Google Scholar] [CrossRef]
- Pascarella, J.B.; Aide, T.M.; Zimmerman, J.K. Short-Term Response of Secondary Forests to Hurricane Disturbance in Puerto Rico, USA. For. Ecol. Manag. 2004, 199, 379–393. [Google Scholar] [CrossRef]
- Weaver, P.L. Hurricane Damage and Recovery in the Montane Forests of the Luquillo Mountains of Puerto Rico. Caribb. J. Sci. 1986, 22, 53–70. [Google Scholar]
- Zhang, X.; Wang, Y.; Jiang, H.; Wang, X. Remote-Sensing Assessment of Forest Damage by Typhoon Saomai and Its Related Factors at Landscape Scale. Int. J. Remote Sens. 2013, 34, 7874–7886. [Google Scholar] [CrossRef]
- Van Beusekom, A.E.; Álvarez-Berríos, N.L.; Gould, W.A.; Quiñones, M.; González, G. Hurricane Maria in the U.S. Caribbean: Disturbance Forces, Variation of Effects, and Implications for Future Storms. Remote Sens. 2018, 10, 1386. [Google Scholar] [CrossRef]
- Gao, Q.; Yu, M. Elevation Regimes Modulated the Responses of Canopy Structure of Coastal Mangrove Forests to Hurricane Damage. Remote Sens. 2022, 14, 1497. [Google Scholar] [CrossRef]
- Zimmerman, J.K.; Aide, T.M.; Rosario, M.; Serrano, M.; Herrera, L. Effects of land management and a recent hurricane on forest structure and composition in the Luquillo Experimental Forest, Puerto Rico. For. Ecol. Manag. 1995, 77, 65–76. [Google Scholar] [CrossRef]
Disclaimer/Publisher’s Note: The statements, opinions and data contained in all publications are solely those of the individual author(s) and contributor(s) and not of MDPI and/or the editor(s). MDPI and/or the editor(s) disclaim responsibility for any injury to people or property resulting from any ideas, methods, instructions or products referred to in the content. |
© 2025 by the authors. Licensee MDPI, Basel, Switzerland. This article is an open access article distributed under the terms and conditions of the Creative Commons Attribution (CC BY) license (https://creativecommons.org/licenses/by/4.0/).