1. Introduction
The coronavirus disease 2019 (COVID-19) pandemic changed the way people travel globally, triggering travel behavior reorientation and dependency on the economy from a structural perspective [
1]. Field study data shows a significant shift toward shorter journeys and tourism patterns. During the pandemic, workforce reductions in coastal fisheries coincided with lower visitor capacity at adjacent resorts, indicating parallel pressures on both sectors rather than a direct causal link. Other factors—such as supply chain disruptions, regulatory travel caps, and household income shocks—likely contributed. According to Campbell et al. [
2], 21.3% of fishers and 32.8% of fish traders received layoffs due to national mobility restrictions. While both layoffs in the fisheries sector and income losses in resort areas were observed during the pandemic, the direct causal relationship between limited spatial capacities and long-distance traveler dependence remains complex and may be influenced by multiple, intersecting factors [
3]. In addition to the decline in foreign travel, the tourism industry faced multiple challenges, including a 72% revenue loss in the global market in 2020 [
4]. Three key factors contributed to the decline in international travel: strict border controls, heightened health risks, and financial market instability [
5]. Meanwhile, domestic tourism likewise compressed spatially, partly because mobility rules, reduced transport capacity, and household income shocks limited long-range trips, especially in coastal fishery communities where 68% of visitors had once traveled from distant regions [
6]. This restructuring of the geographical tourism network made it imperative to redesign the local prosperity model, which had traditionally relied on long-term, non-resident visitors.
South Korea’s tourism industry has experienced notable changes due to the pandemic. According to a report by the Busan Tourism Organization, there was a 0.3% year-over-year increase in domestic visitors to Busan City during the 2020 summer vacation season, with a 4.3% increase in visitors from Seoul [
7]. The marginal increases recorded could be interpreted as evidence of heightened risk aversion; however, these shifts are also consistent with alternative explanations. However, some coastal regions, such as Jeju Island, have been struggling due to population decline and reduced visitor numbers. The isolation trends in Korean coastal cities and fishery towns are becoming increasingly apparent. Recent data from Jeju Island shows a significant decline in domestic tourists, with the number of Korean visitors falling by 11.9% in January 2025 compared to the same period in the previous year [
8]. This decline is particularly concerning for Jeju’s tourism-dependent economy and reflects broader challenges facing coastal communities across South Korea.
Recognizing these issues, Korea’s Ministry of Oceans and Fisheries (MOF) [
9] launched initiatives to revitalize fishing villages and coastal areas. Their plan includes infrastructure improvements to 100 fishing villages and new opportunities to create fishing villages and coastal communities. These programs aim to address the deterioration of scenic coastal areas and the financial difficulties affecting fishing villages. However, declining transportation accessibility and shrinking customer bases pose considerable risks to tourism-dependent fishing villages. Research by Wickramaarachchi and Amarasinghe [
10] highlights key challenges facing coastal micro-fishery sectors, such as limited market access, income reduction, and resource shortages, which have worsened due to the pandemic. Moreover, demographic changes in Korean society, including the declining population in non-metropolitan areas, have further intensified these problems [
7].
The reduction in long-distance visitors has led to a decrease in tourism-related income for many coastal fishing towns. These communities, already grappling with population decline and economic stagnation, now face additional uncertainties. While the MOF [
9] implemented support measures for fisheries businesses, long-term solutions are lacking. Thus, our research examines how the COVID-19 pandemic impacted travel distance and tourism trends, focusing on coastal fishing towns. It explores the causes of shifting travel behavior, the effects on local economies, and potential recovery strategies. Specifically, it investigates the impact of increased travel distances to fishing villages and its implications for tourism recovery and sustainable population maintenance post-pandemic.
Our research team analyzes long-distance travel patterns to fishing villages and their role in revitalizing local economies. We hypothesize that fishing villages experiencing faster visitor recovery saw a slower decline in long-distance visitors during the pandemic period. Moreover, we expect these communities to show a faster increase in long-distance visitors post-pandemic, contributing to a higher overall growth compared to communities that historically depended on short-distance travelers.
Addressing these evolving trends, we explore Blue Urbanism as a potential solution and propose policy recommendations for future urban planning in coastal regions. The main focus of this study is to provide a comparative analysis of long-distance travel trends across different fishing communities and examine how these communities recover over time. By offering insights into the wide spectrum of recovery patterns, this research contributes to a broader understanding of eco-tourism recovery in post-pandemic coastal regions.
Therefore, the aim of this study is to quantitatively analyze how changes in travel distance and visitor patterns during and after the COVID-19 pandemic have affected the resilience and recovery of 45 coastal fishing communities in South Korea and to propose policy recommendations for sustainable tourism development under the Blue Urbanism framework.
3. Research Methodology
This study investigates migration patterns between metropolitan areas and fishing communities in South Korea to evaluate their interconnected development and explore strategies for their mutual growth. Given the persistent concentration of employment opportunities, education, and economic development in urban areas, fishing villages have experienced a population decline. Thus, this study addresses these issues by applying a data-driven approach to map spatial interactions and resilience trends, testing the following hypotheses (research questions):
Hypothesis 1.
The COVID-19 pandemic led to a decrease in long-distance travel to coastal fishing towns in South Korea. (Research Question 1: How did the COVID-19 pandemic affect the travel distances of visitors to South Korea’s coastal fishing towns?)
Hypothesis 2.
The reduction in long-distance travel has negatively impacted the economies of these communities. (Research Question 2: What has been the economic impact of reduced long-distance travel on coastal fishing communities?)
Hypothesis 3.
The recovery of tourism in these communities depends on the return of long-distance travelers. (Research Question 3: How does the return of long-distance travelers influence the recovery of tourism in coastal fishing communities?)
Responding to these questions was made possible by our team through the use of big data from the Korea Tourism Data Lab (2019–2023), which was followed by the GIS-based spatial analysis that we employed in measuring the change in travel patterns and resilience indices. Our methodology also equipped us with the ability to identify the direction of the change in travel patterns and resilience indices, compare the spatial differences, and predict the patterns of global tourism based on the exploration of the distributions of the travel modes for the leading tourist destinations.
Consequently, the findings provide valuable insights for policy development and sustainable tourism strategies to support urban and rural communities in the post-pandemic era.
3.1. Selection of Fishing Communities
South Korea’s Ministry of Oceans and Fisheries [
32] has implemented significant initiatives to address the challenges faced by fishing communities. As part of a nationwide revitalization effort, the government selected 45 fishing communities, encompassing coastal villages and several settlements, each with unique strengths and challenges. To support the welfare and economic stability of fishers, the ministry launched various programs, including the Fisher Welfare Bus pilot project. This initiative serves 200 islands, 50 fishing villages, and 45 regional fisheries cooperatives, providing essential services to remote coastal areas.
As previously stated, our research included 45 coastal fishing towns (see
Table 1) that obtained policy assistance from the Ministry of Oceans and Fisheries. The condition of the fishing villages was assessed according to population, households, gross regional domestic product (GRDP), and the tourism activation index for each region. The 2024 resident registration population data was sourced from the Ministry of Public Administration and Security, encompassing both population and household statistics. Forty-five regions comprised 16.6% of the total population and 16.7% of the total households. The gross regional domestic product was derived from the 2021 GRDP (referencing 2015) statistics provided by the National Statistical Portal of Statistics Korea, with the GRDP of the specified area being 20.5% of the gross domestic product.
The Korea Tourism Data Lab gave annual average values from January 2019 to December 2023 for the tourism activation index calculation. This index thoroughly reflects the level of sustainability and performance of the tourism sector through visitors’ tourism-related activities using data (credit cards, mobile communications, GPS navigator destination data) from the Korea Tourism Data Lab. It includes seven indicators and 64 sub-indices that illustrate the number of visitors, spending, lodging, visits by gender/age, tourist destinations, foreigners, and inflows from 17 cities and provinces. This index provides useful information on the degree of area tourism activity in 2019 prior to the epidemic, 2020–2022 during the pandemic, and 2023 when the pandemic was officially declared over. Compared to 2019, the index decreased in all locations during the COVID era, but surged in 2023, when the end of the pandemic was proclaimed.
By including these 45 communities in this study, we expect our research to yield valuable insights into South Korea’s fishing industry, helping policymakers gain a better understanding of the current situation. The ministry plans to analyze detailed data from these areas to develop specific strategies to support the broader fishing sector across the country.
3.2. Data Collection
In this analysis, we used big data on tourism flows collected from the Korea Tourism Data Lab [
45], covering the period from January 2019 to December 2023 (
https://datalab.visitkorea.or.kr/). This dataset offers valuable insights into the dynamics of tourism in South Korea, especially in fishing communities that have experienced—and continue to experience—significant challenges due to the COVID-19 pandemic and other global events.
The Korea Tourism Data Lab acts as a hub for the conversion of different forms of tourism-related data, such as visitor statistics, credit card transactions, and mobile positioning data [
45]. This comprehensive resource allows us to track tourism behavior over time and assess how evolving travel patterns affect local economies. The dataset includes origin and destination data, identifying where tourists come from and where they go, down to specific fishing villages. This information reveals shifts in travel trends and promotes a more balanced distribution of tourism flows [
46].
We designed our data collection process to ensure accuracy, reliability, and ethical integrity. The Korea Tourism Data Lab uses innovative artificial intelligence (AI) techniques to process real-time data on visitor patterns and preferences. These tools are vital for understanding post-pandemic changes in travel motivations and destination choices [
47]. Throughout the data collection process, we followed ethical principles by anonymizing all data in accordance with South Korea’s personal information protection regulations [
48]. By doing so, we safeguarded individual privacy and ensured that regulators could apply our findings to policy frameworks to support vulnerable fishing communities.
Before analysis, we ensured the pre-processing and anonymization of all data to comply with the Personal Information Protection Act of South Korea. We only used aggregated, depersonalized statistics, with all personal identifiers removed to protect confidentiality. We obtained visitor count data from mobile telecommunication records provided by Korea Telecom (KT), one of South Korea’s biggest mobile network operators. KT covers about 40% of the national population, making it a reliable and representative source for tracking visitor mobility and tourism trends.
Since mobile data does not directly indicate travel purposes, we applied a rigorous filtering process to isolate genuine tourist activity. First, because trip purpose is not recorded, we exclude routine commuters via home–work filters and night-stay checks. Next, we excluded individuals who only passed through locations, such as those at train stations or bus terminals, to avoid miscounting them as visitors. We also removed data for places a person frequently visited in the previous month to focus on new and infrequent travel behavior.
To refine the dataset further, we excluded cases involving business travel or regular facility use, as these do not reflect tourism activity. By applying these systematic filters, we ensured the dataset captured genuine tourism flows rather than routine mobility. This refined dataset enabled a more precise analysis of tourism trends in South Korea’s fishing communities. It helped us understand how visitor patterns have changed over time, providing a strong foundation for developing policies that support sustainable tourism and local revitalization.
3.3. Geographic Information System (GIS)-Based Distance Calculation
In our research design, proximity analysis using ArcGIS 3.4 (i.e., ArcInfo Geographic Information System) tools served as the central method for assessing the spatial relationships between urban centers and coastal fishery towns. We calculated distances between major cities (as starting points) and coastal towns (as target locations) to evaluate their accessibility and influence on tourism recovery following the COVID-19 pandemic, as well as on broader regional resilience. Using tools such as Euclidean distance and network-based measurements, we identified travel corridors and zones of influence, which we categorized as near, moderate, or distant, following Azzopardi’s [
49] proposed classification system.
We employed techniques like buffer creation and distance measurement to quantify accessibility and understand its implications for tourism and economic recovery [
50]. Buffer analysis involves generating polygons around key urban centers at set intervals to delineate travel ranges. We then overlaid these buffers with datasets representing coastal towns to assess their proximity to urban nodes and estimate the likely flow of tourism toward these locations [
51].
Additionally, we used weighted proximity approaches, such as hub-and-spoke analysis, to quantify accessibility to central transportation nodes. This method highlights distance decay, whereby long distances correlate with reduced economic interactions [
52]. Some other functions, like the “Near” tool, compute precise distances between urban centers and coastal towns, offering valuable insights into spatial accessibility patterns [
51].
This methodological approach provides a strong foundation for understanding how geographical distance shapes economic recovery in the post-pandemic context. It also generates actionable data for targeted policy interventions. The GIS analysis via ArcGIS produced reliable distance values and supported various spatial analyses, guiding researchers and urban planners in decision-making processes related to the development and management of coastal fishing villages [
53].
The distance between each residential area and fishing-village centroid was computed as great-circle (‘straight-line’) kilometers, a proxy widely adopted in spatial-tourism research because it correlates strongly (R
2 ≈ 0.8–0.9) with network travel time for inter-regional trips while avoiding route-choice endogeneity [
54,
55]. Ultimately, the distance matrix calculation forms the backbone of our spatial analysis, offering essential information on mobility trends and accessibility. We computed the distance between each residential area (origin) and fishing village (destination) using the Euclidean distance formula:
where
and
represent the geographic coordinates.
represents the distance between residential area
i and fishing village
j,
and
are the geographic coordinates of the residential area, and
and
are the geographic coordinates of the fishing village.
3.4. Weighted Average of Fishing Village Visits
The calculation of the weighted average of fishing village visits involves determining the weight for each residential area. We computed the weight, denoted as
as the product of the distance
and the visitation rate
for each residential area, as follows:
where
is the proportion of visits from residential areas to fishing villages and
is the distance from the residential area
i to the fishing village
j.
To obtain the weighted average visit index for a given fishing village, we used the following formula:
This formula provides a measure of the average level of visits to a specific fishing village, weighted by the distance and proportion of visits from various residential areas.
3.5. Annual Computation of Weighted Values
We calculated the weighted visit index for each year from 2019 to 2023 using the following equation:
where
represents the proportion of visits in year
t from residential area
i to the fishing village
j.
To compute the rate of change in visits over time, we used Equation (5):
where
indicates the rate of change in visits from year
t − 1 to year
t, and
is the weighted visit index in the comparison year.
3.6. Distance-Rebound Index (DRI)
To quantify the resilience of fishing villages in recovering from the impact of COVID-19, we calculated a resilience index as follows:
where
represents the resilience index for fishing village
j,
and
indicate the rates of change in visits in 2023 and 2019, respectively, and
is the weighted visit index in 2020.
The DRI measures how far the average travel distance has rebounded since 2020; it therefore captures one facet of tourism recovery rather than overall resilience. It provides insight into the recovery potential and resilience of these villages following the COVID-19 crisis. By applying this index and related formulas, our team systematically analyzed changes in travel patterns to evaluate the effectiveness of interventions aimed at promoting sustainability and resilience within fishing villages under the Blue Urbanism framework.
The DRI captures recovery in average travel distance only; other dimensions such as visitor-origin diversity or local spending, although relevant, lie beyond the present dataset and are therefore reserved for future work.
4. Results
This section provides valuable insights into how travel distances to fishing communities in South Korea changed before, during, and after the COVID-19 pandemic. We based the analysis on data from the Korea Tourism Data Lab and presented it through three key viewpoints.
4.1. Reduction in Visit Distance
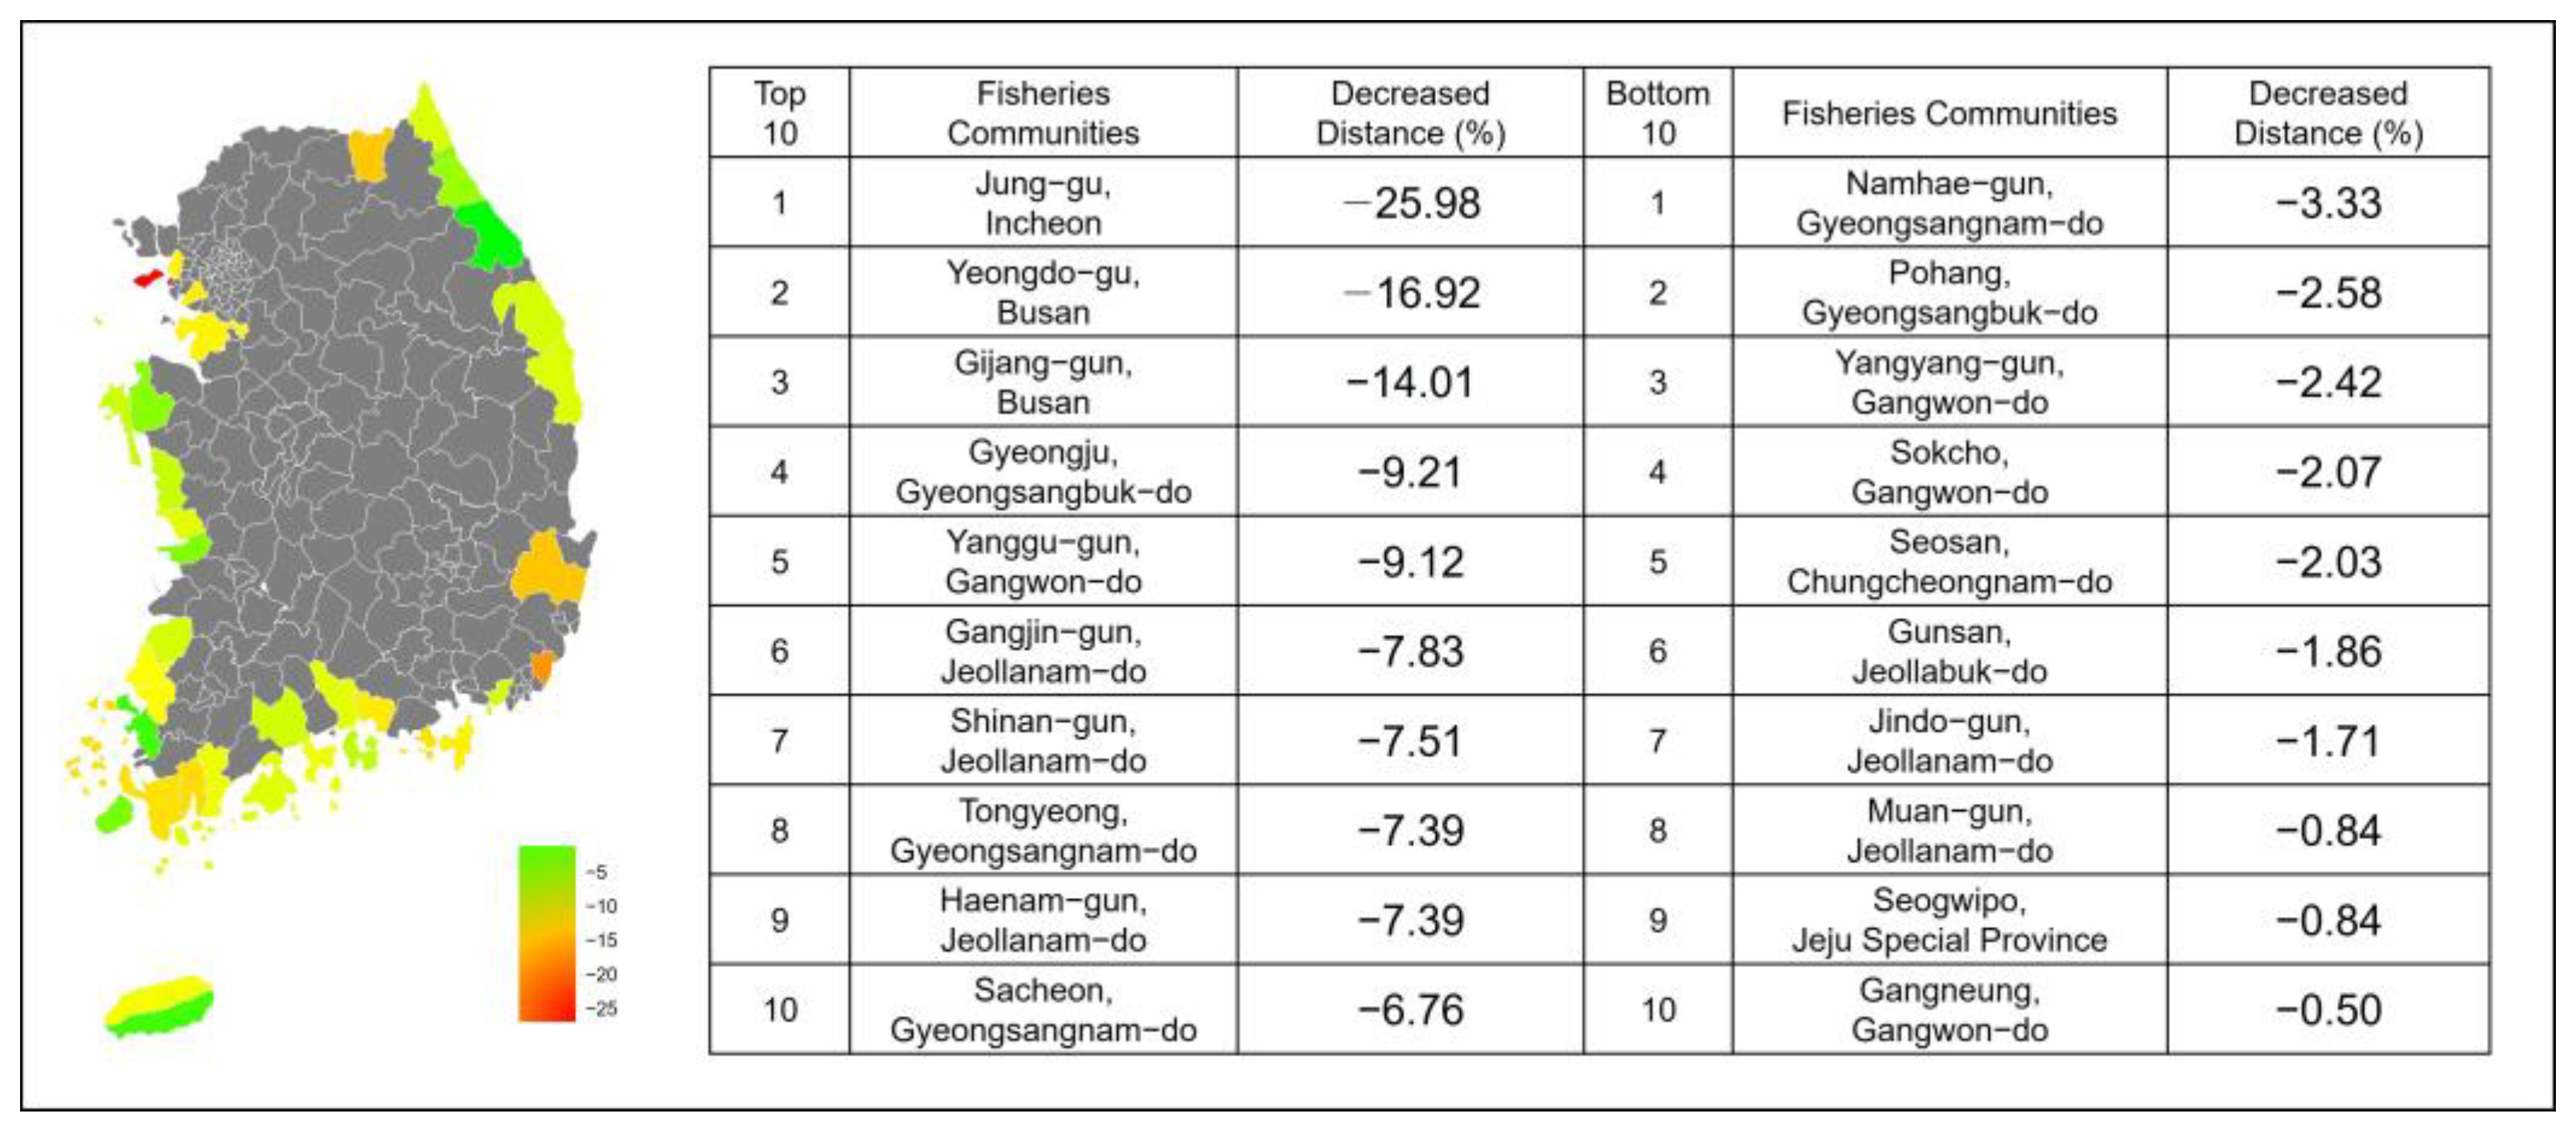
Figure 1 illustrates a significant reduction in travel distances from urban residential areas to fishing communities in South Korea between 2019 and 2020, highlighting the impact of the COVID-19 pandemic on travel patterns. The data, which we collected from the Korea Tourism Data Lab, measures the percentage decrease in the average distance traveled by visitors. The results reveal stark contrasts across different regions, with some areas experiencing more pronounced declines than others. On average, travel distances across all studied regions dropped by 11.23%.
Notably, Jung-gu, Incheon City, experienced the most significant reduction in travel distances, with a decrease of 25.98%. Similarly, Yeongdo-gu, Busan City, and Gijang-gun, Busan City, saw substantial decreases of 16.92% and 14.01%, respectively. These declines indicate a marked shift in tourism and travel behaviors during the pandemic, as visitors increasingly chose shorter trips, likely due to mobility restrictions and heightened risk perception.
Additionally, the trend demonstrates that regions closer to major metropolitan areas saw steeper declines, while more remote fishing villages exhibited comparatively smaller reductions. For example, Namhae-gun, Gyeongsangnam-do, and Pohang City, Gyeongsangbuk-do, only experienced decreases of 3.33% and 2.58%, respectively. This finding implies that accessibility played a crucial role in tourism recovery, as people opted for destinations within easier reach.
4.2. Post-Pandemic Recovery
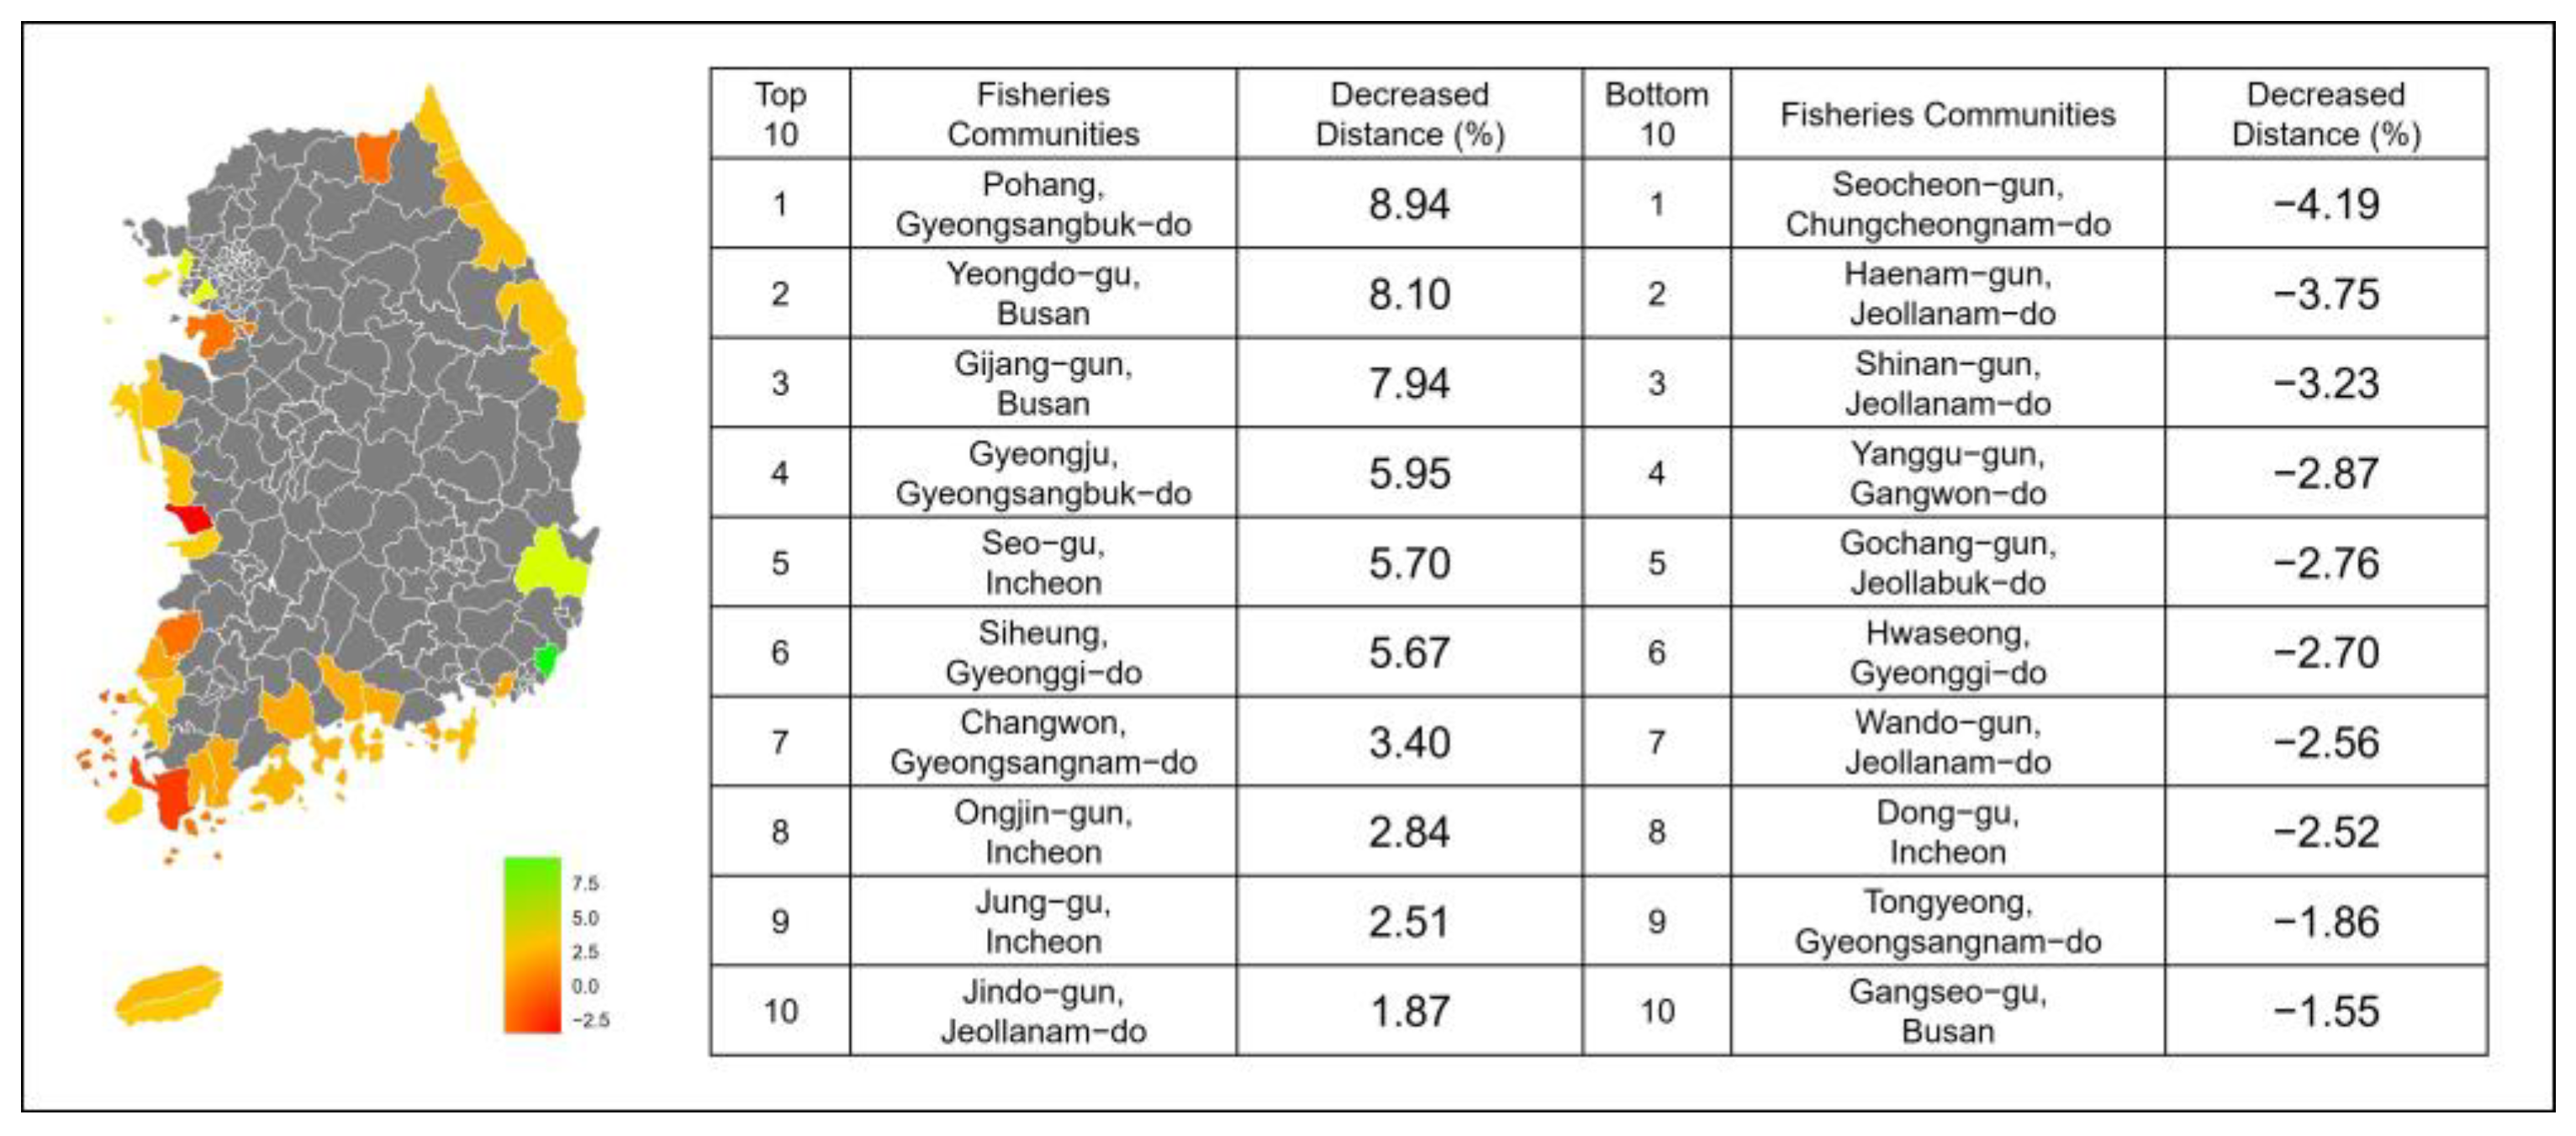
Figure 2 illustrates post-pandemic changes in travel distances from residential areas to fishing communities in South Korea, highlighting a divergence across regions. The data show that while some areas have successfully attracted visitors from farther distances compared to pre-pandemic levels, others continue to experience declines, indicating a shift toward more localized tourism.
Regions such as Pohang City, Yeongdo-gu, and Gijang-gun (Busan City) have demonstrated a remarkable recovery, with increases in travel distances of 8.94%, 8.10%, and 7.94%, respectively. These gains suggest that these destinations revitalized their appeal, possibly through improved tourism infrastructure, effective marketing strategies, or the renewed popularity of natural attractions as travel restrictions eased. Additionally, pent-up demand following prolonged restrictions may have encouraged travelers to take longer-distance trips, further benefiting these regions.
Conversely, Seocheon-gun, Haenam-gun, and Shinan-gun recorded continued declines of −4.19%, −3.75%, and −3.23%, respectively. These trends suggest a structural change in travel patterns, where convenience and accessibility have become key factors in destination choice. These villages may have lost broader appeal because transport bottlenecks, limited connectivity, and shrinking marketing budgets curtailed access; any apparent shift in visitor preference toward short-distance travel must therefore be interpreted within these structural limits.
Overall, the average change in travel distances across all regions was a positive 2.15%, indicating a gradual recovery in long-distance tourism, though not evenly distributed across all communities.
4.3. Resilience in Traveling Distance of Visitors
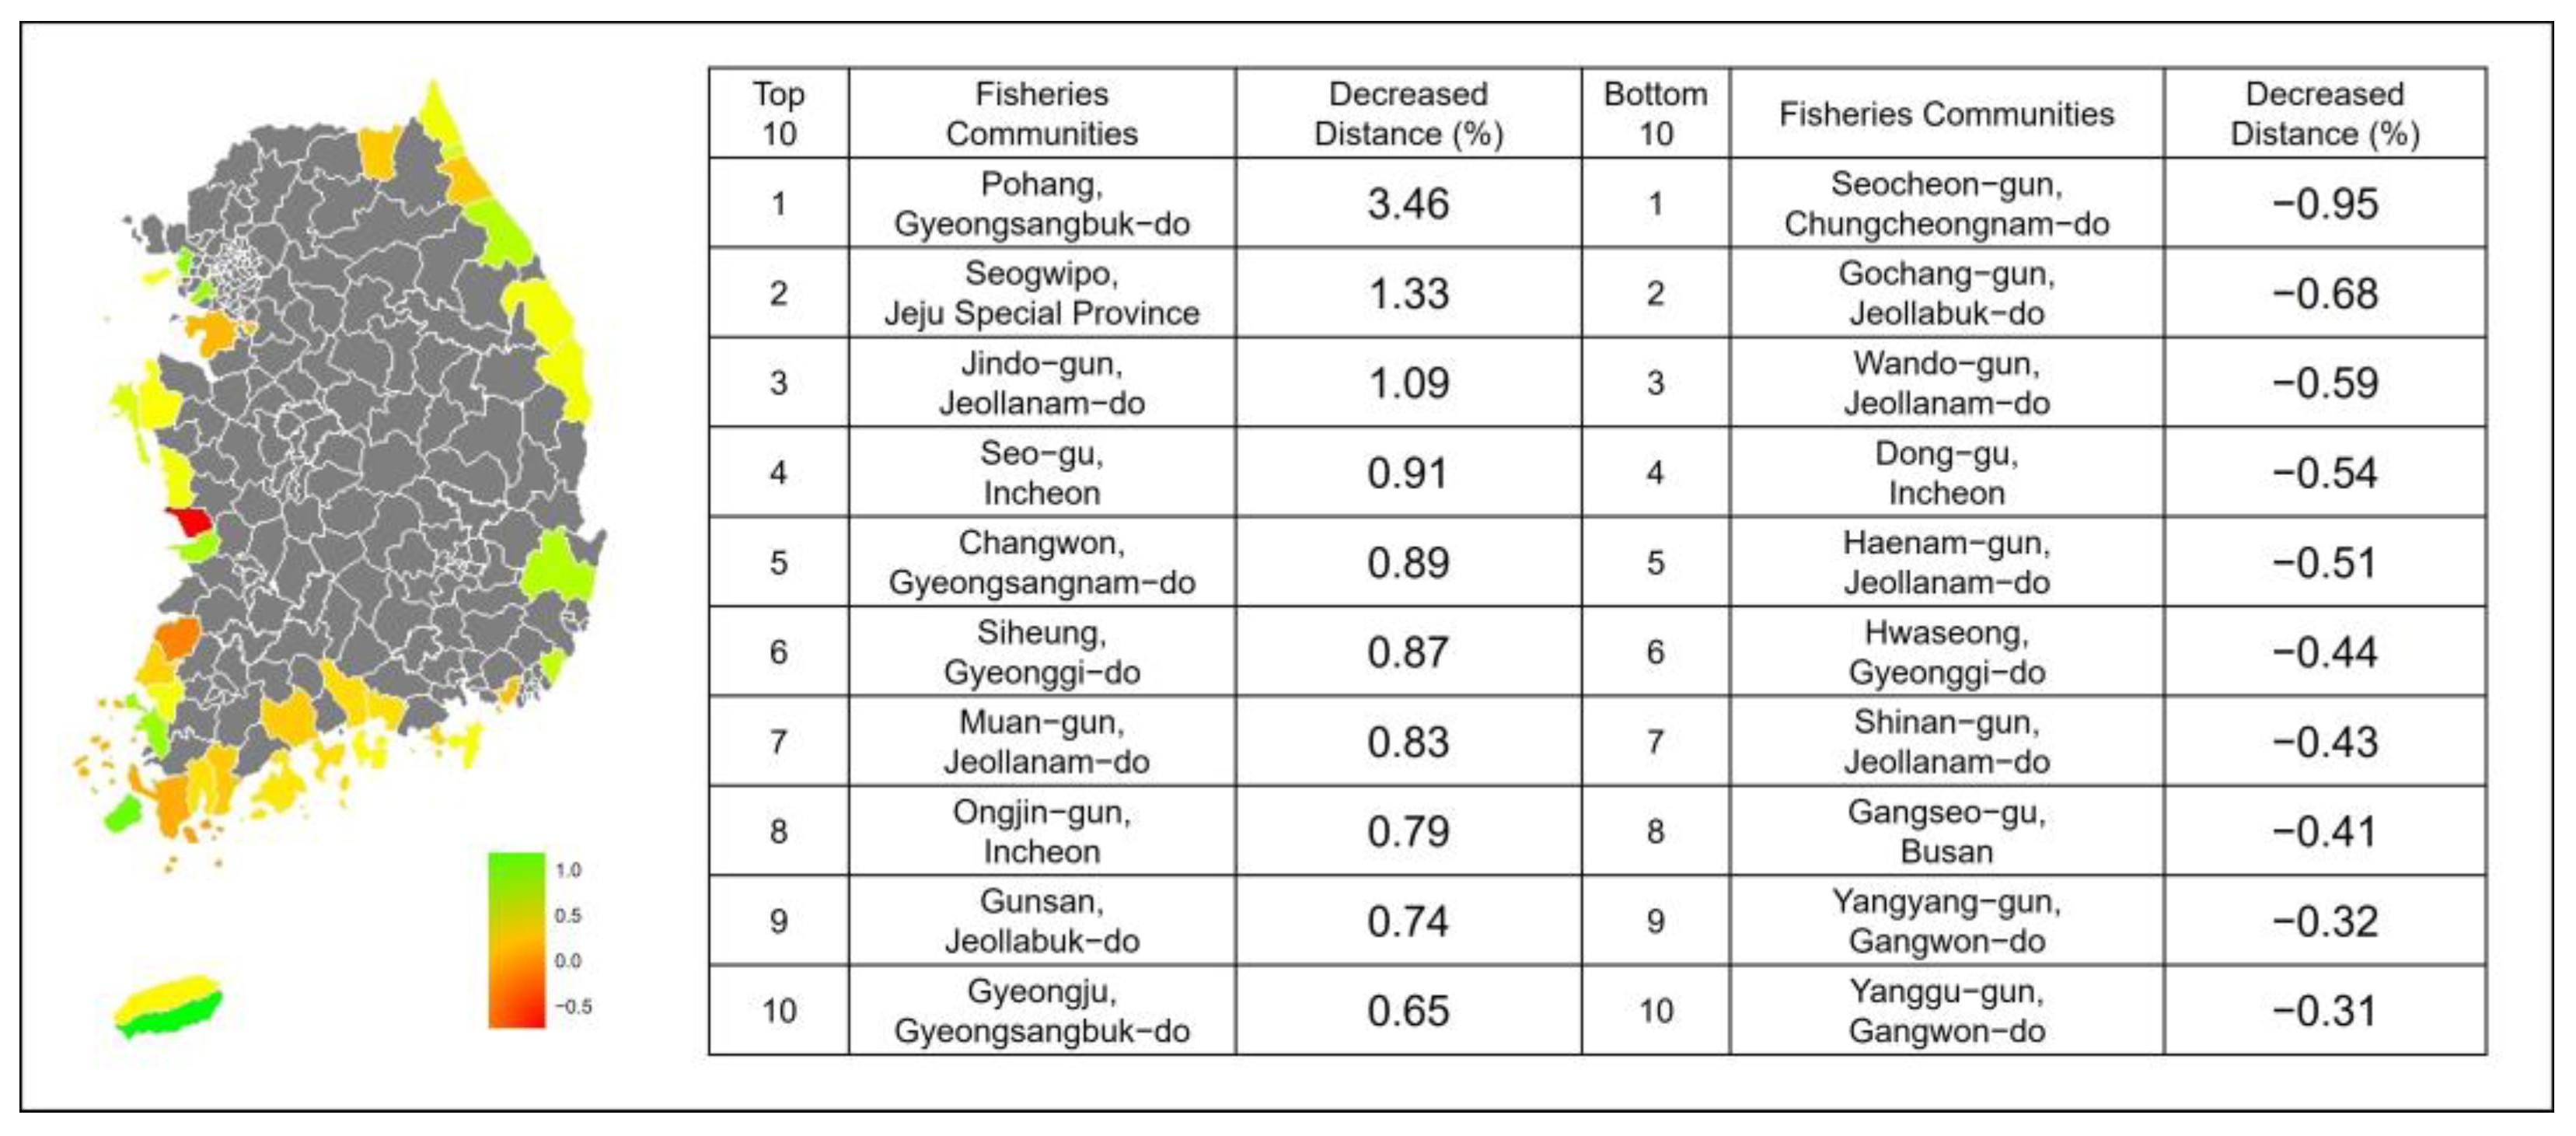
Figure 3 visualizes the Distance-Rebound Index, illustrating regional variation in post-pandemic travel-distance recovery. The results indicate a divergence between regions that have successfully attracted visitors from greater distances and those that have become more localized destinations.
Regions such as Pohang City, Seogwipo City, and Jindo-gun exhibit high resilience, with visit distances recovering and even surpassing pre-pandemic levels. Pohang City (Gyeongsangbuk-do) recorded a 3.46% increase in travel distance, Seogwipo City (Jeju Special Self-Governing Province) saw a 1.33% rise, and Jindo-gun (Jeollanam-do) experienced a 1.09% growth. These figures suggest that these destinations have recovered and strengthened their ability to attract visitors from farther afield. Their resilience likely stems from a combination of well-developed tourism infrastructure, strong destination branding, and unique natural or cultural attractions that differentiate them from closer alternatives. As such, these regions continue to play a key role in expanding the spatial reach of tourism under the Blue Urbanism framework.
Conversely, regions like Seocheon-gun, Haenam-gun, and Shinan-gun exhibit lower resilience, with a visitor base now concentrated on nearby populations. For example, Seocheon-gun (Chungcheongnam-do) saw a decrease of 0.95%, Gochang-gun (Jeollabuk-do) recorded a decline of 0.68%, and Wando-gun (Jeollanam-do) dropped by 0.59%. This shift indicates that these regions have become more localized destinations, potentially due to weaker branding, accessibility limitations, or a lack of differentiation compared to neighboring attractions. For these regions, the principles of Blue Urbanism may need to focus more on community-based tourism, strengthening local economies, and investing in infrastructure to enhance the visitor experience.
Overall, the average change in travel distance across all regions was −0.23%, indicating that while some areas have fully recovered or even surpassed pre-pandemic levels, many are still in the process of recovery. Notably, there is a strong positive correlation (r = 0.78) between the magnitude of the initial decline in 2019–2020 and the subsequent recovery from 2020 to 2023, suggesting that areas hit hardest at the onset of the pandemic also had the most room for recovery.
These results provide crucial insights into the changing dynamics of tourism in South Korean fishing communities. They highlight the need for tailored, region-specific strategies to support recovery and foster sustainable development. The variation in resilience and recovery patterns underscores the importance of local factors and adaptive strategies in shaping the post-pandemic tourism landscape.
5. Discussion
The coronavirus disease 2019 (COVID-19) pandemic fundamentally altered tourism patterns in South Korea’s coastal fishery communities, with significant implications for economic resilience and long-standing demographic sustainability [
56]. Our analysis reveals an average 11.23% reduction in travel distances during the pandemic, with regions closer to major urban centers such as Yeongdo-gu, Busan City (−16.92%), experiencing steeper declines than remote areas like Pohang City (−2.58%).
The data reveals that during the pandemic the tours that travelers are taking and their pattern of movement have changed from the densely populated operators to the rural ones. It is still important to analyze the situation with some caution. The changes in travel were not only due to travelers’ will but also restrictions in the system that were also very substantial. There have been various safety regulations laid down by the government, which include, among others, border closures, mandatory quarantines, and travel restrictions that have led to the reduced number of destinations, i.e., a limitation in the available choices and mobility for travelers. In addition, economic issues, such as income reduction and job insecurity, have been significant in limiting travel options, particularly for the poor. The latter would often find themselves with no other choice but to settle for destinations that were close to their homes and less crowded; however, not because they were particularly fond of those places, but because there was no money, or they lacked transportation, and public health guidelines would then restrict them [
57].
Similarly, the income losses experienced by regions with “limited spatial capacities” cannot be attributed solely to their inability to accommodate larger numbers of tourists. The pandemic’s effect on the tourist industry was quite complex, as it was not only the result of decreased customer density due to mobility limitations but also came as a result of problems in supply chains, labor uncertainty, and sweeping economic shocks [
58,
59]. With the changes in the tourism industry, many businesses lost market share due to broken supply chains, an increased number of informal and precarious jobs, and the cutting down of the demand for services. All these different pressures that were at work at the time made it more challenging for the local economy to survive. In the end, it only serves to show that the loss of income was a result of the restrictions on mobility, the injustices of the present economic system, and the system’s vulnerability, and not the limitations of space alone [
58].
Post-pandemic recovery patterns diverged sharply. More resilient regions like Pohang City, with an increase of 8.94% in travel distance, leveraged tourism infrastructure and marketing, while others like Shinan-gun (−3.23%) saw structural shifts toward hyper-localized tourism. A strong correlation (r = 0.78) between initial demographic declines and subsequent recovery underscores the role of adaptive capacity. We situate these findings within the framework of Blue Urbanism, which integrates ecological stewardship with tourism-driven economic revival. This framework offers strategies for addressing population decline while fostering sustainable visitor engagement.
While our findings align with global trends of pandemic-induced travel localization [
11], they offer nuances specific to South Korea’s coastal fishery communities. Like Campbell et al. [
2], we document significant impacts, such as a 21.3% reduction in fishers and a 32.8% decline in fish traders, largely due to mobility restrictions. However, our findings introduce the concept of “distance-dependent resilience”, where areas with pre-existing tourism infrastructure (e.g., Pohang City) recovered faster than those reliant on localized visitors (e.g., Shinan-gun). This finding contrasts with Rowe et al. [
29], who noted temporary urban-to-rural migration reversals in Spain. In our case, structural limitations—not temporary trends—shaped recovery outcomes.
The DRI indicates that areas with milder 2020 declines regained travel distance more quickly; however, distance rebound is only one possible pathway to resilience, alongside factors such as visitor-origin diversity and local spend. This finding challenges Pasquinelli et al. [
34] and Rowe et al. [
60], who emphasized branding as the key driver of recovery, by demonstrating that accessibility to urban hubs (e.g., a 4.3% increase in Seoul-to-Busan visits) [
7] was equally critical. A novel insight is the “threshold effect”—coastal villages within 100 km of metropolitan areas regained 78% of pre-pandemic long-distance visitors by 2023, while those beyond 200 km stagnated at 45%, indicating a proximity advantage.
Our findings highlight the structural changes in the application of Blue Urbanism. During the COVID-19 pandemic, travel restrictions prompted a surge in short-distance travel, catalyzing localized Blue Urbanism models. In the post-pandemic period, a bifurcation emerged: some regions regained long-distance appeal while others (major hubs) solidified their status as local tourism hubs.
Regions attracting distant visitors typically enjoy strong brand recognition, unique tourism experiences, and accessibility advantages. These high-resilience areas benefit from robust transportation networks and a diversified tourism economy appealing to both domestic and international travelers. Sustaining growth requires infrastructure upgrades, international marketing, and environmental safeguards. Yeongdo-gu’s 8.10% rise in travel distances highlights the impact of enhanced waterfront access and digital tourism tools [
28].
Conversely, regions dependent on nearby visitors need tailored strategies. Limited reach often results from accessibility barriers, lack of distinctive attractions, or shifting post-pandemic preferences. Strengthening local economic resilience through tourism-community integration is vital. Blue Urbanism initiatives, including local food industry support and nature-based tourism, help maintain appeal. Smart tourism technologies, such as mobile apps with personalized experiences and targeted regional promotions, foster repeat visits. Differentiated policies aligned with structural realities ensure Blue Urbanism evolves into a sustainable framework for urban–rural integration and coastal development.
The pandemic transformed regional proximity from a limitation into a strategic advantage. Short-haul visitors now constitute 64% of post-2022 tourism revenue, demonstrating the economic potential of localized tourism when paired with unique experiential offerings. However, unregulated infrastructure development can undermine this demographic advantage, as evidenced by drainage failures in Canggu, Indonesia [
61]. South Korea’s policy response should thus emulate GERICS’ climate-resilient Blue Flag criteria [
61], integrating coastal erosion monitoring and heatwave contingency plans into zoning regulations.
Phased accessibility models, utilizing AI-guided tourist flows, can help direct high-impact activities to resilient areas [
62], preserving ecosystems while optimizing tourism revenue. In the Blue Urbanism framework, stabilizing populations and visitor trends necessitates infrastructure improvements, such as high-speed ferries and EV charging stations, to attract both day-trippers and long-stay tourists. Yeongdo-gu in Busan saw an 8.10% rise in travel distances due to enhanced waterfront access and digital marketing [
28], exemplifying how smart infrastructure can boost tourism resilience.
To revitalize coastal communities, governments should encourage reverse migration through tax incentives and housing subsidies for professionals in eco-tourism and marine technology. These measures align with the EU Blue Economy Observatory’s [
33] push for economic diversification beyond traditional fisheries. Additionally, mobile positioning data, such as that from the Korea Tourism Data Lab [
45], allows precise visitor tracking, enabling tailored tourism strategies. Notably, villages where tourism constituted over 30% of employment saw population stabilization rates 2.3 times higher than those reliant on fisheries alone.
Targeting “functional risk” travelers [
19]—who seek secure, structured experiences—through curated itineraries can stabilize seasonal tourism. Beatley’s Blue Urbanism [
38] advocates for integrating ecological preservation with economic sustainability, positioning South Korea’s coastal villages as marine ecosystem stewards.
Key strategies include ecological–experiential hybrids, like floating eco-lodges [
63] and oyster reef restoration [
7], demonstrated by Dubai’s reef project, which increased visitor spending by 22% [
63]. GIS-based phased accessibility further ensures sustainable tourism development by zoning high-impact areas while safeguarding marine habitats. Canggu Village’s environmental degradation [
61] underscores the importance of managed growth.
Short-distance travel, though less lucrative, can foster sustainability. Despite comprising 64% of visitors but only 39% of revenue, day-trippers contribute economic value through hyper-local offerings like tidal flat foraging or storm-watching tours, encouraging repeat engagement and stable revenue streams. We acknowledge some critics argue traditional interpretations of Blue Urbanism may not directly address challenges like population shrinkage or the decline in long-haul visits. However, we contend that Blue Urbanism provides a crucial framework for addressing these challenges, especially in the context of remote fishery villages. By promoting sustainable economic diversification through eco-tourism and aquaculture, enhancing community appeal through ecological restoration, and building resilience to external shocks, Blue Urbanism provides a solid foundation for long-term vitality.
Importantly, we recognize the need to complement Blue Urbanism with other strategies, such as infrastructure development and community engagement, to address the complex issues that coastal communities face. We tailored our application of Blue Urbanism to the specific conditions of South Korea’s coastal fishery regions, positioning it as a planning framework and catalyst for financial prosperity, demographic stability, and sustainable development.
This study addresses critical gaps in the post-pandemic tourism literature by providing a quantitative assessment of spatial inequities in South Korea’s coastal fishery towns’ tourism recovery. While Beatley’s [
38] Blue Urbanism framework offers valuable ideological guidance, our findings underscore the urgent need for adaptive governance as more than a governance tool; it is a regenerative tool for these communities. Adaptive governance involves developing and implementing flexible, community-centered policies that balance ecological limits with pragmatic economic revitalization, especially in the wake of disruptions like the COVID-19 pandemic. Our analysis of recovery disparities suggests a dual-pronged approach: (1) scaling innovative technologies like blockchain and AI to enhance tourism experiences and management, and (2) preserving and promoting cultural authenticity, recognizing it as a key asset for attracting and engaging visitors.
For example, Jeju Island’s 11.9% decline in tourism [
8] underscores the risks of relying on generic digital solutions without genuine community buy-in and integration. Conversely, Pohang City’s success with the Internet of Things (IoT)-enabled smart marinas and augmented reality (AR)-guided heritage tours [
64] illustrates how technology can enhance visitor engagement and experience without compromising local contexts. Thus, by embracing smart technologies, coastal communities can improve accessibility, comfort, and engagement, making destinations more appealing and better equipped to manage tourism sustainably.
For South Korea’s coastal fishery villages, long-term survival and prosperity depend on policies that recognize and leverage geographic proximity not as a limitation but as a strategically managed asset. This insight resonates across a growing body of global case studies, from Santa Marta’s adaptive governance strategies emphasizing community participation [
65] to Nelson Mandela Bay’s scenario-planning frameworks that prepare for future uncertainties [
66]. These examples stress the importance of dynamic, locally responsive policies that adapt to environmental vulnerabilities and economic opportunities.
Adaptive governance is a promising approach to the challenges facing remote fishery coastal communities, particularly those experiencing population decline and reduced long-distance tourism. These communities, often reliant on traditional livelihoods, are vulnerable to external disruptions such as pandemics and climate change. By promoting flexibility, responsiveness, and local engagement, adaptive governance fosters resilience while supporting sustainable tourism strategies tailored to short-haul visitors.
Aligning tourism offerings with visitor preferences and leveraging local expertise can enhance satisfaction and encourage repeat visits. Moreover, adaptive governance facilitates regional tourism innovation, enabling communities to merge traditional practices with modern technology to create competitive niche market experiences.
Ultimately, adaptive governance provides a strategic framework for addressing interconnected issues like economic instability and evolving tourism patterns. By integrating technological advancements such as blockchain for sustainable seafood sourcing and AI-driven visitor management, coastal villages can transform proximity into a long-term asset, ensuring sustainable growth and resilience in the face of global challenges.
6. Conclusions
As mentioned earlier, the purpose of this study is to provide a numerical account of the changes in travel distance and visitor patterns that occurred in 45 coastal fishing communities in South Korea during and after the COVID-19 pandemic time and to give policy suggestions for Blue Urbanism’s sustainable tourism development. The study reveals a distinct shift in visitation patterns toward South Korea’s coastal fishing villages, emphasizing the importance of proximity in helping these communities remain resilient and recover during the coronavirus disease 2019 (COVID-19) pandemic. As long-distance travel declined by an average of 11.23%, coastal towns adapted by rethinking and repositioning their tourism strategies to align with changing mobility trends.
Our data suggest that areas near metropolitan hospitals or city centers experienced sharper declines in travel distance, pointing to accessibility as a key factor in tourism recovery. However, the pandemic underscored the power of locality as a strategic advantage. For example, communities such as Pohang City recorded an 8.94% increase in average visitor travel distance. Improved infrastructure, strong domestic demand, and effective marketing likely drove this resurgence.
COVID-19 significantly transformed tourism patterns across South Korea’s coastal communities, underscoring the need to integrate Blue Urbanism principles and innovative technological solutions into future planning. Blue Urbanism, which centers on marine preservation and sustainable development, offers a strong baseline for the next phase of coastal tourism. By leveraging technologies like blockchain and artificial intelligence and adopting flexible, adaptive governance models, coastal communities can turn proximity into a long-term asset.
However, some fishing villages still struggle, especially those heavily reliant on long-distance tourists. These communities need tailored strategies that address their unique vulnerabilities while tapping into local opportunities. Future research should investigate how new technologies and adaptive governance models can increase tourism flows, mitigate environmental impact, and ensure fair economic distribution.
The pandemic also exposed the mutual dependence between urban and coastal zones. In light of these findings, we recommend that policymakers adopt differentiated, place-based strategies under the Blue Urbanism framework. This means investing in infrastructure and accessibility for remote communities, supporting inclusive economic development, and recognizing the value of both long-distance and localized tourism models. Such an approach not only aligns with global best practices in coastal resilience and sustainable development but also ensures that recovery efforts are equitable, adaptive, and future-oriented. By acknowledging and addressing structural constraints and by embracing a pluralistic view of resilience, South Korea’s coastal regions can build a more sustainable and inclusive tourism future. By embracing Blue Urbanism, promoting innovation, and applying adaptive governance, South Korea’s coastal towns can build greater resilience and move toward self-sufficiency. Their experience offers valuable lessons for other coastal regions globally, working to create more sustainable and inclusive tourism economies.
There are a few constraints with this study. The first is that the research was based on data from 45 government-supported coastal localities and was, therefore, not fully representative of the entire coastline. The second limitation comes from the fact that the sole reliance on big, aggregated data may eventually lead to ignoring some small but significant reasons for visitor satisfaction. Third, as a cross-sectional design allows for one-time sampling, it restricts the possibilities for causal inference.
Our next study will have a case of more than one community to obtain a larger and more varied sample, more qualitative methods for the exploration of the visitor’s individual journey, and longer and more profound experiences from technical interventions, e.g., AI-driven tourism management. It may also be helpful to conduct cross-country studies to see if the system works in the same way in different countries and to increase the results’ validity to a greater extent.


