
Exploring the Relationship Between the Built Environment and Bike-Sharing Usage as a Feeder Mode Across Different Metro Station Types in Shenzhen


Abstract
1. Introduction
2. Literature Review
2.1. Built Environment Determinants of Bike-Sharing–Metro Integrated Use
2.1.1. Built Environment Correlates of Cycling Behavior
2.1.2. Metro Station Types and Travel Behavior
2.2. Evaluation for Impact of Built Environment
3. Methods
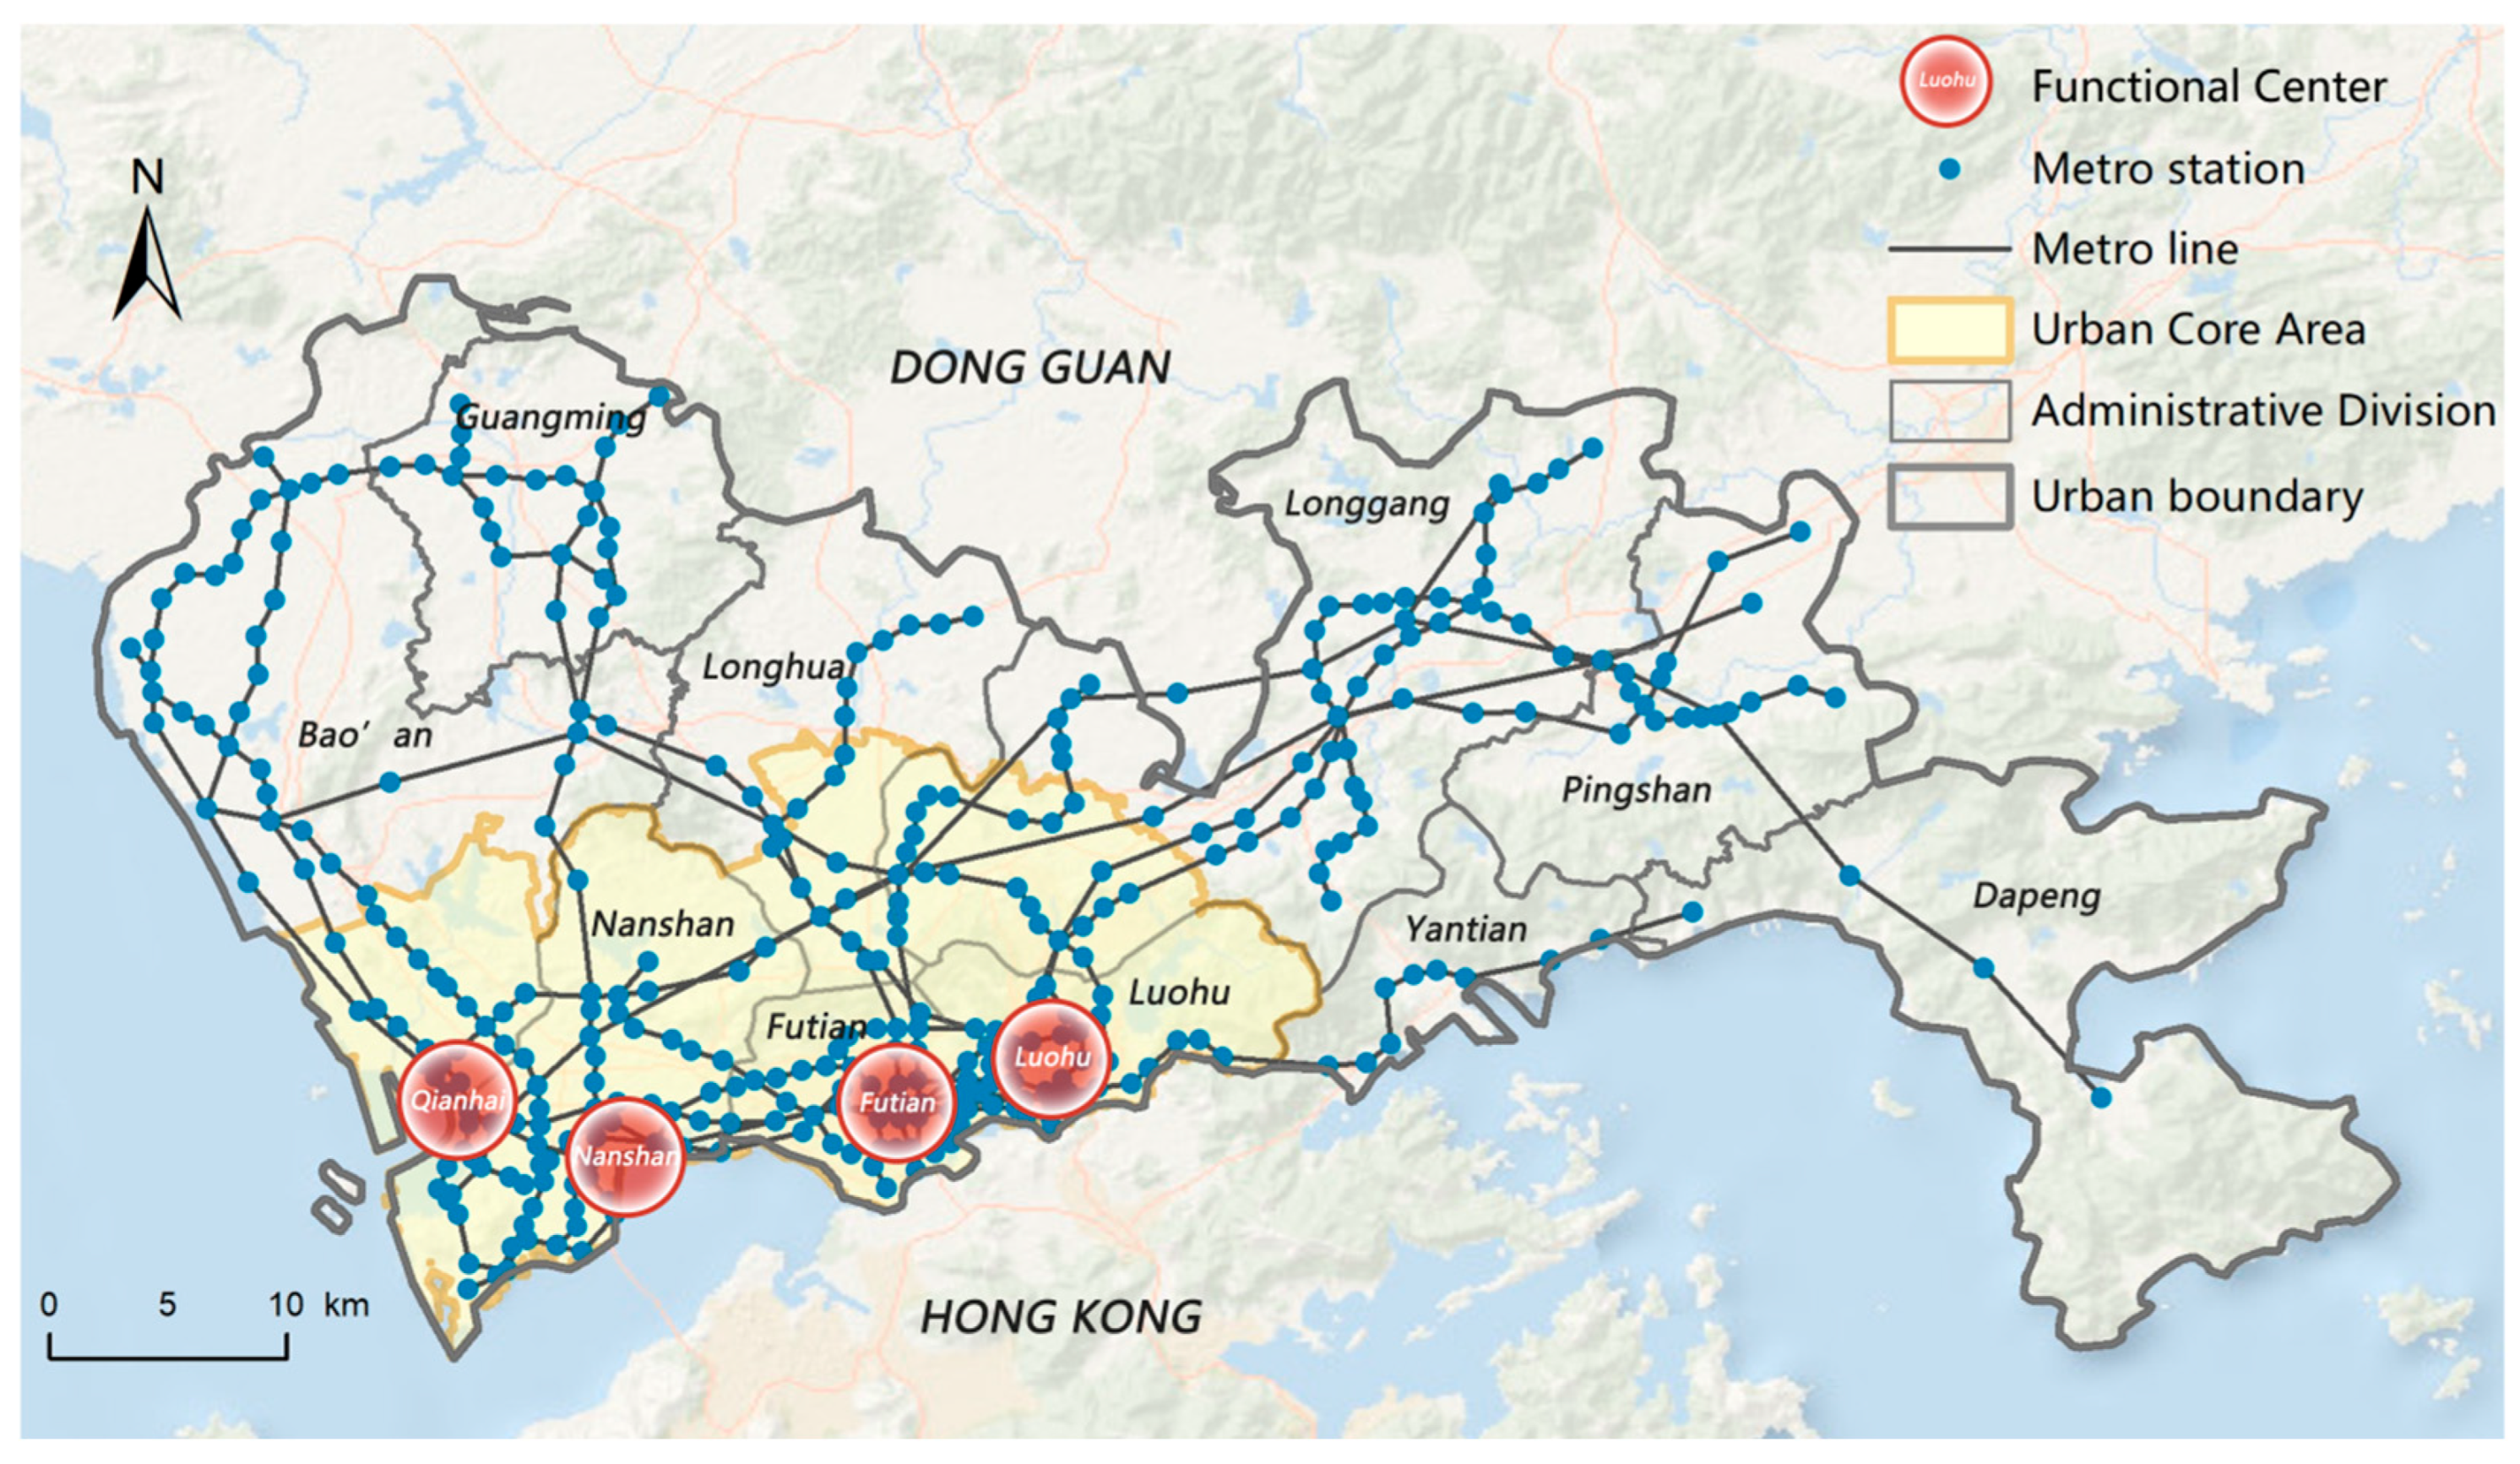
3.1. Study Area
3.2. Data
3.3. Variables
3.3.1. Measure of the Dependent Variable: Bike-Sharing–Metro Integrated Use
3.3.2. Measure of the Independent Variable: The Built Environment
- (1)
- Convenience
- (2)
- Comfort
- (3)
- Caution
3.4. Models
3.4.1. K-Means Clustering Algorithm
3.4.2. OLS Regression Model
3.4.3. MGWR Model
4. Results
4.1. Statistics and Spatial Characteristics of Built Environment Variables
4.1.1. Metro Station Clustering Results
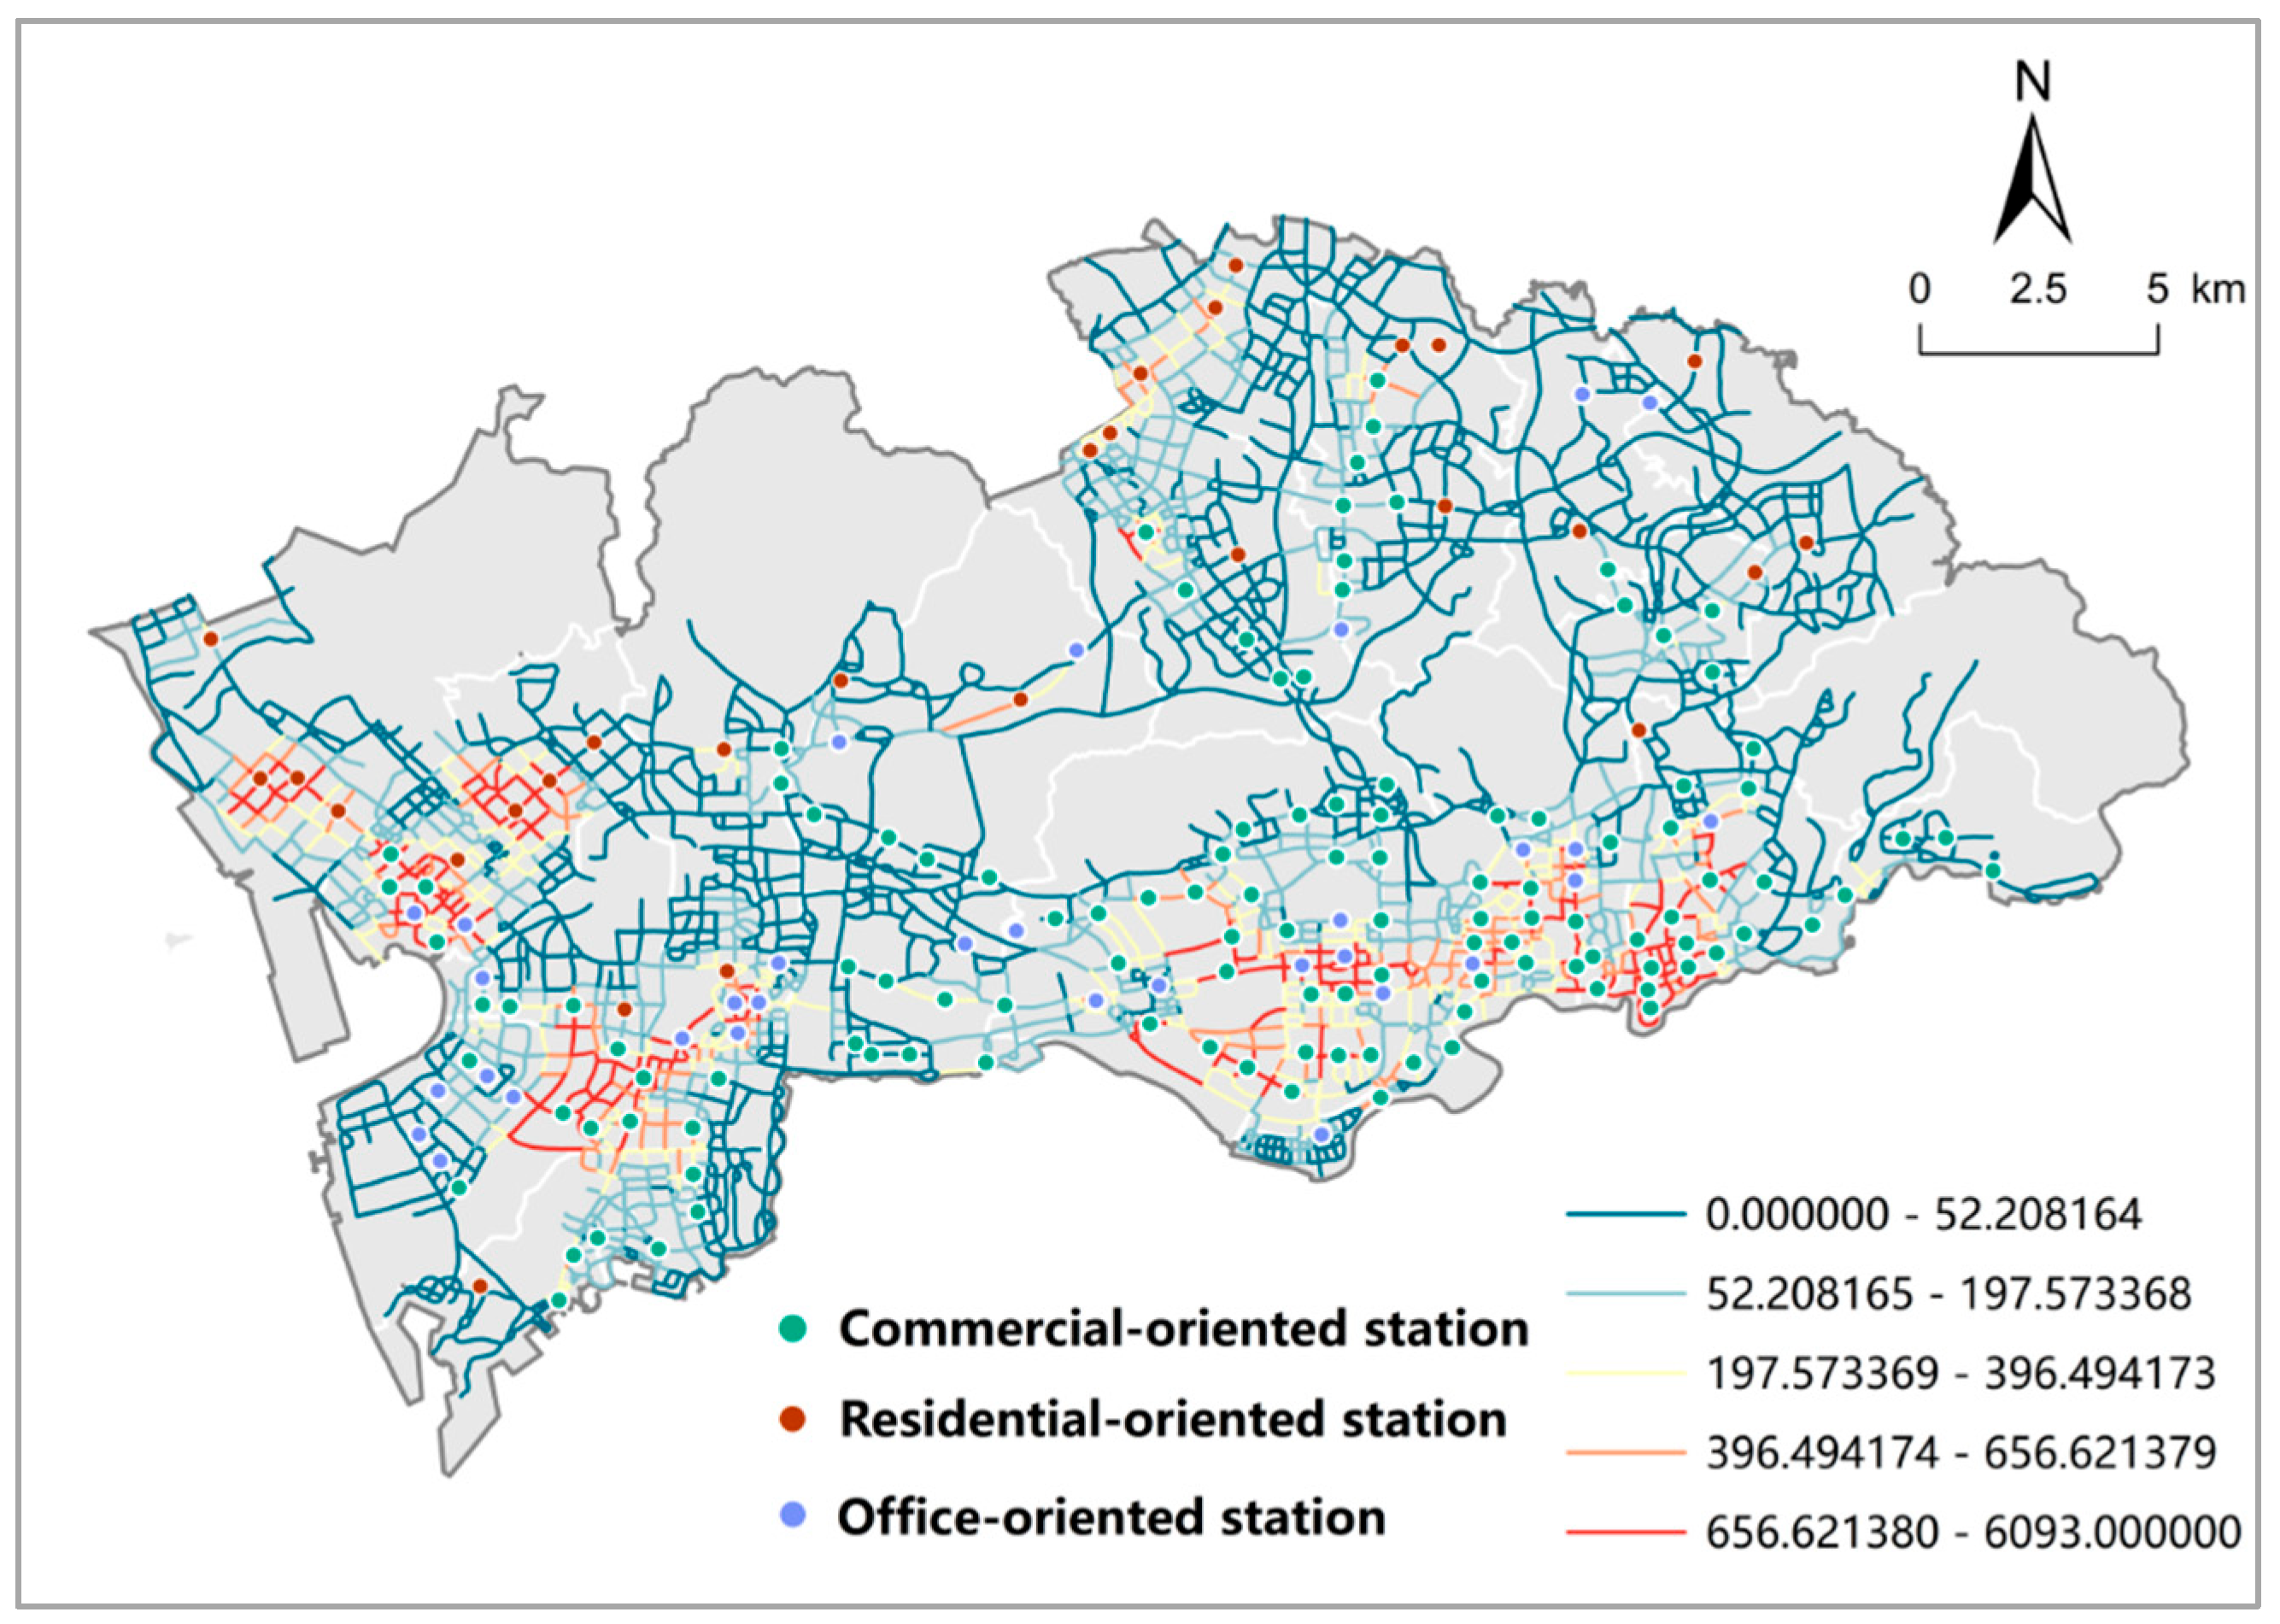
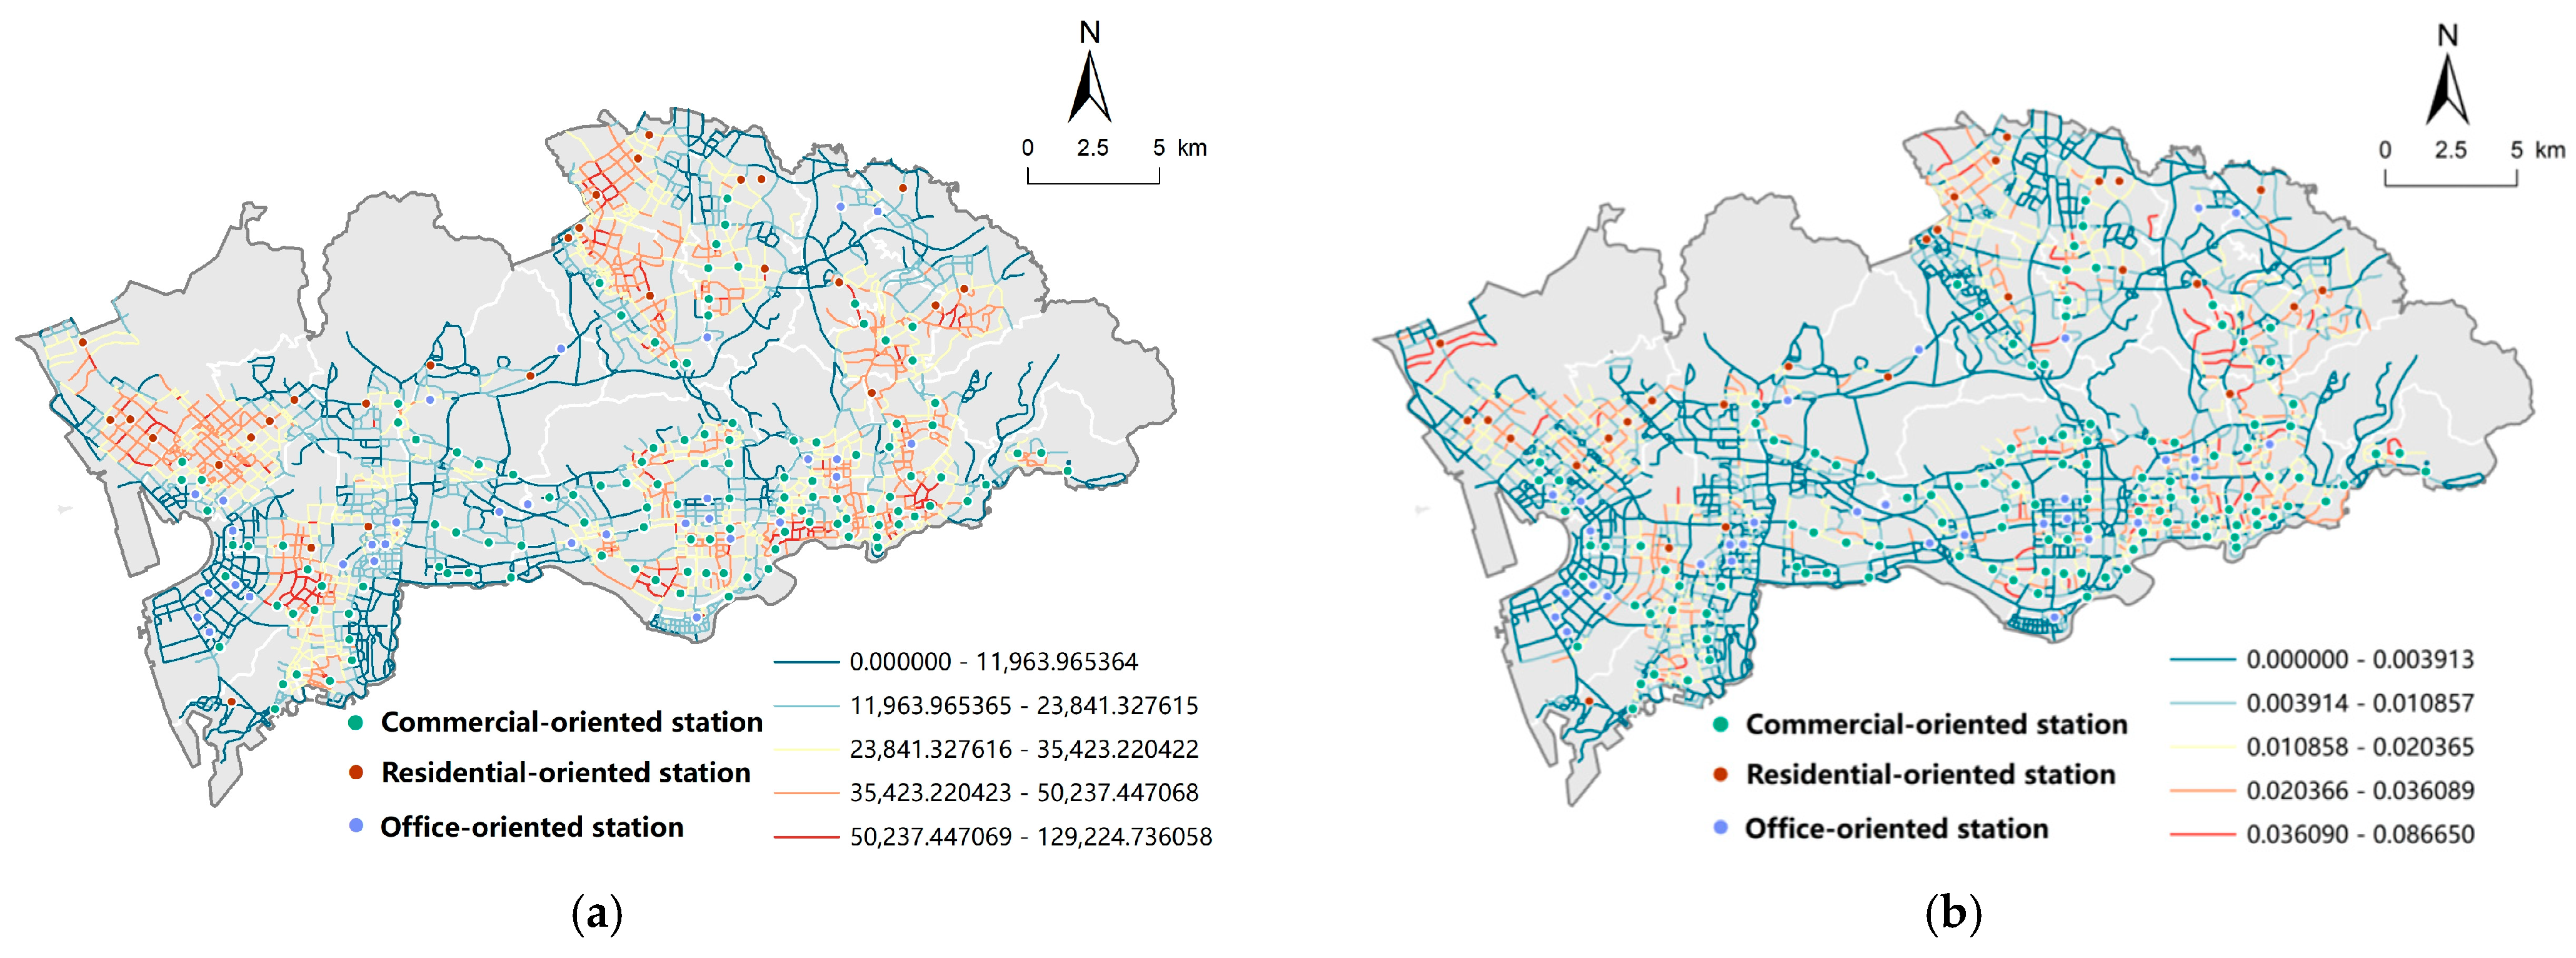
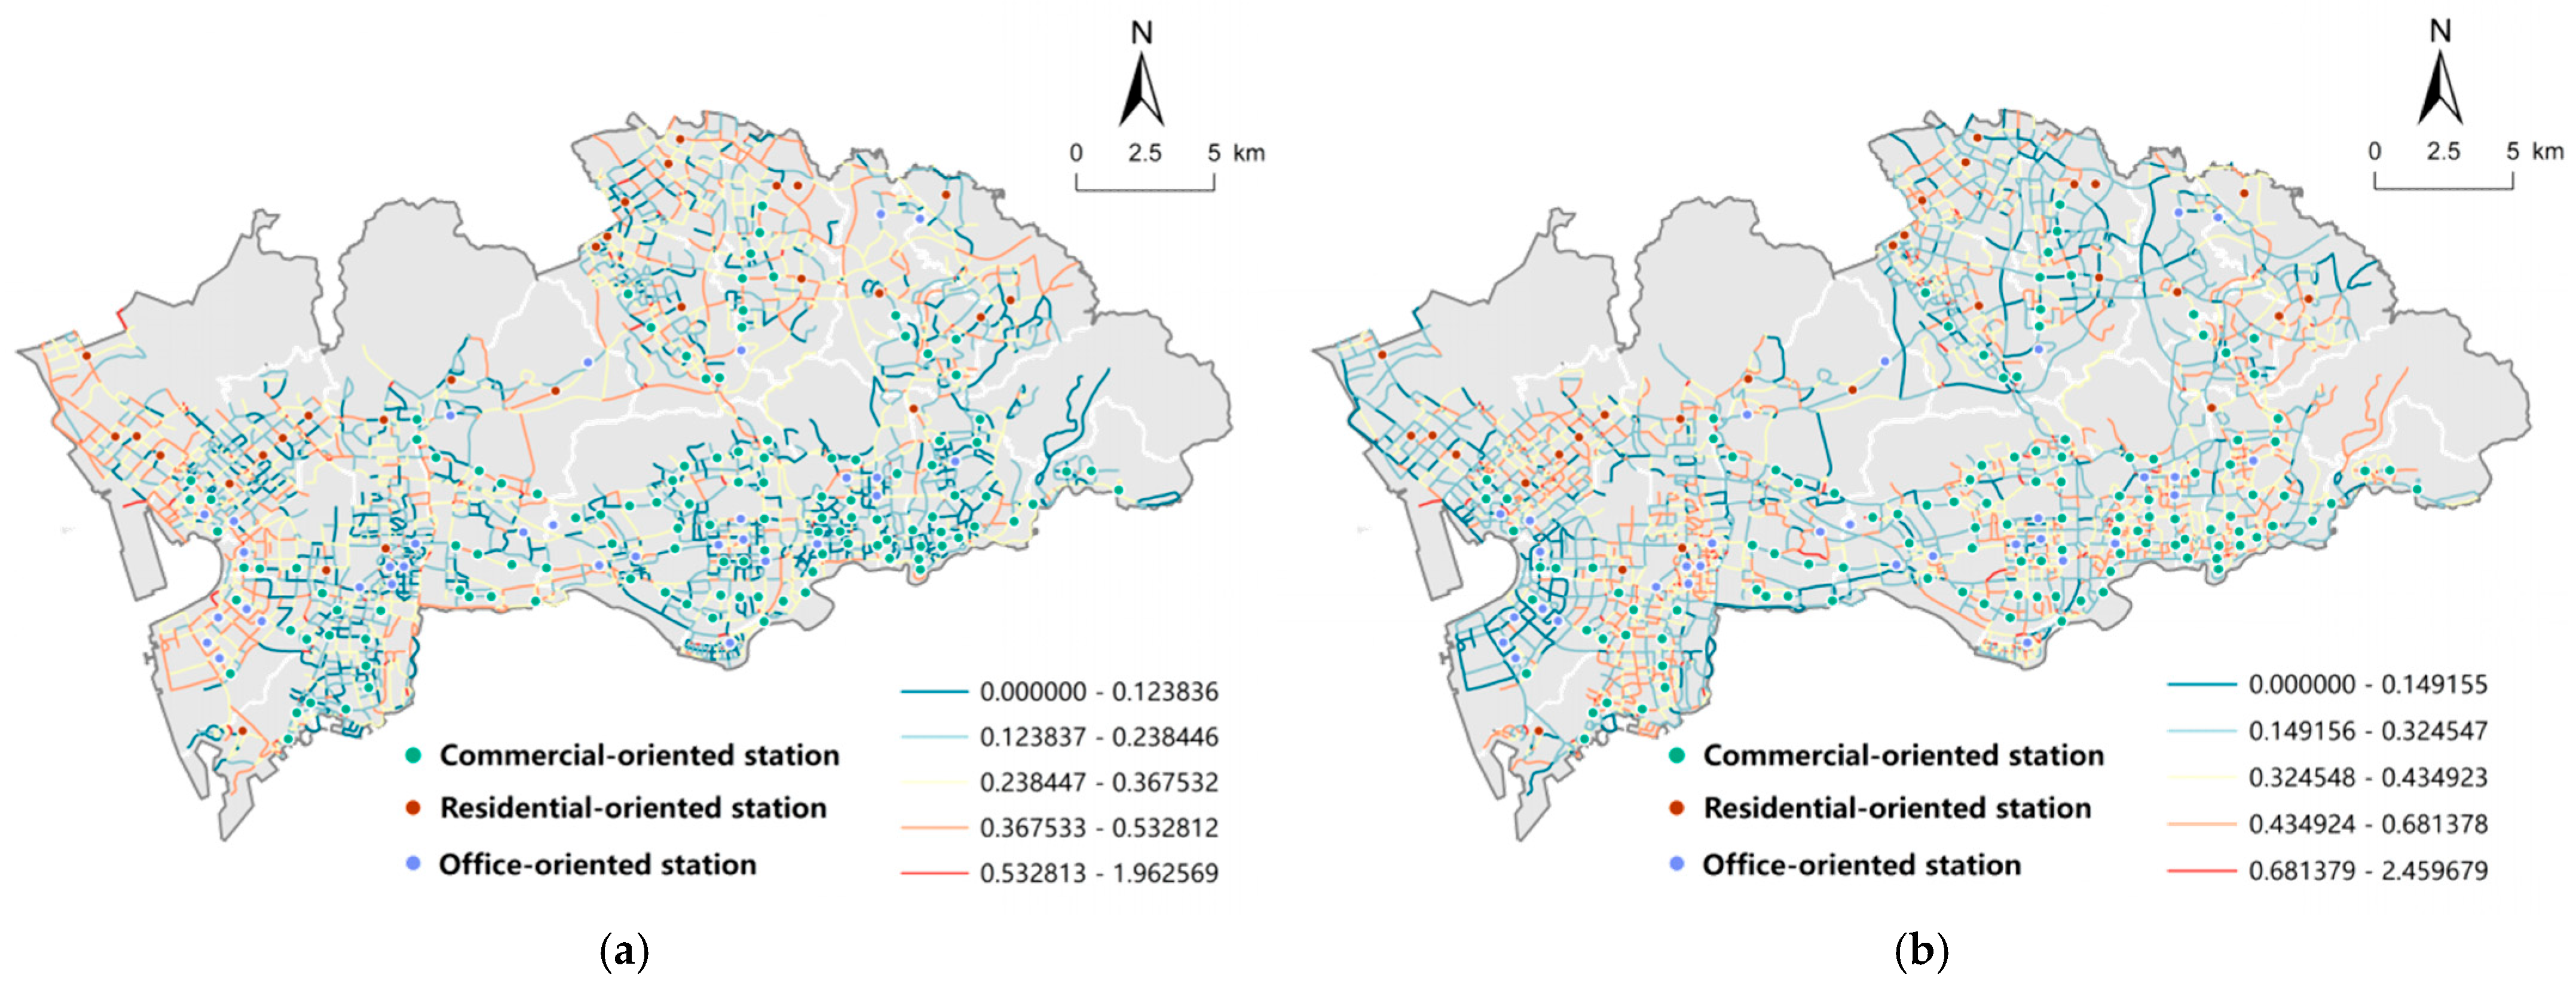
4.1.2. Spatial Characteristics of Bike-Sharing Volume and Built Environment Factors
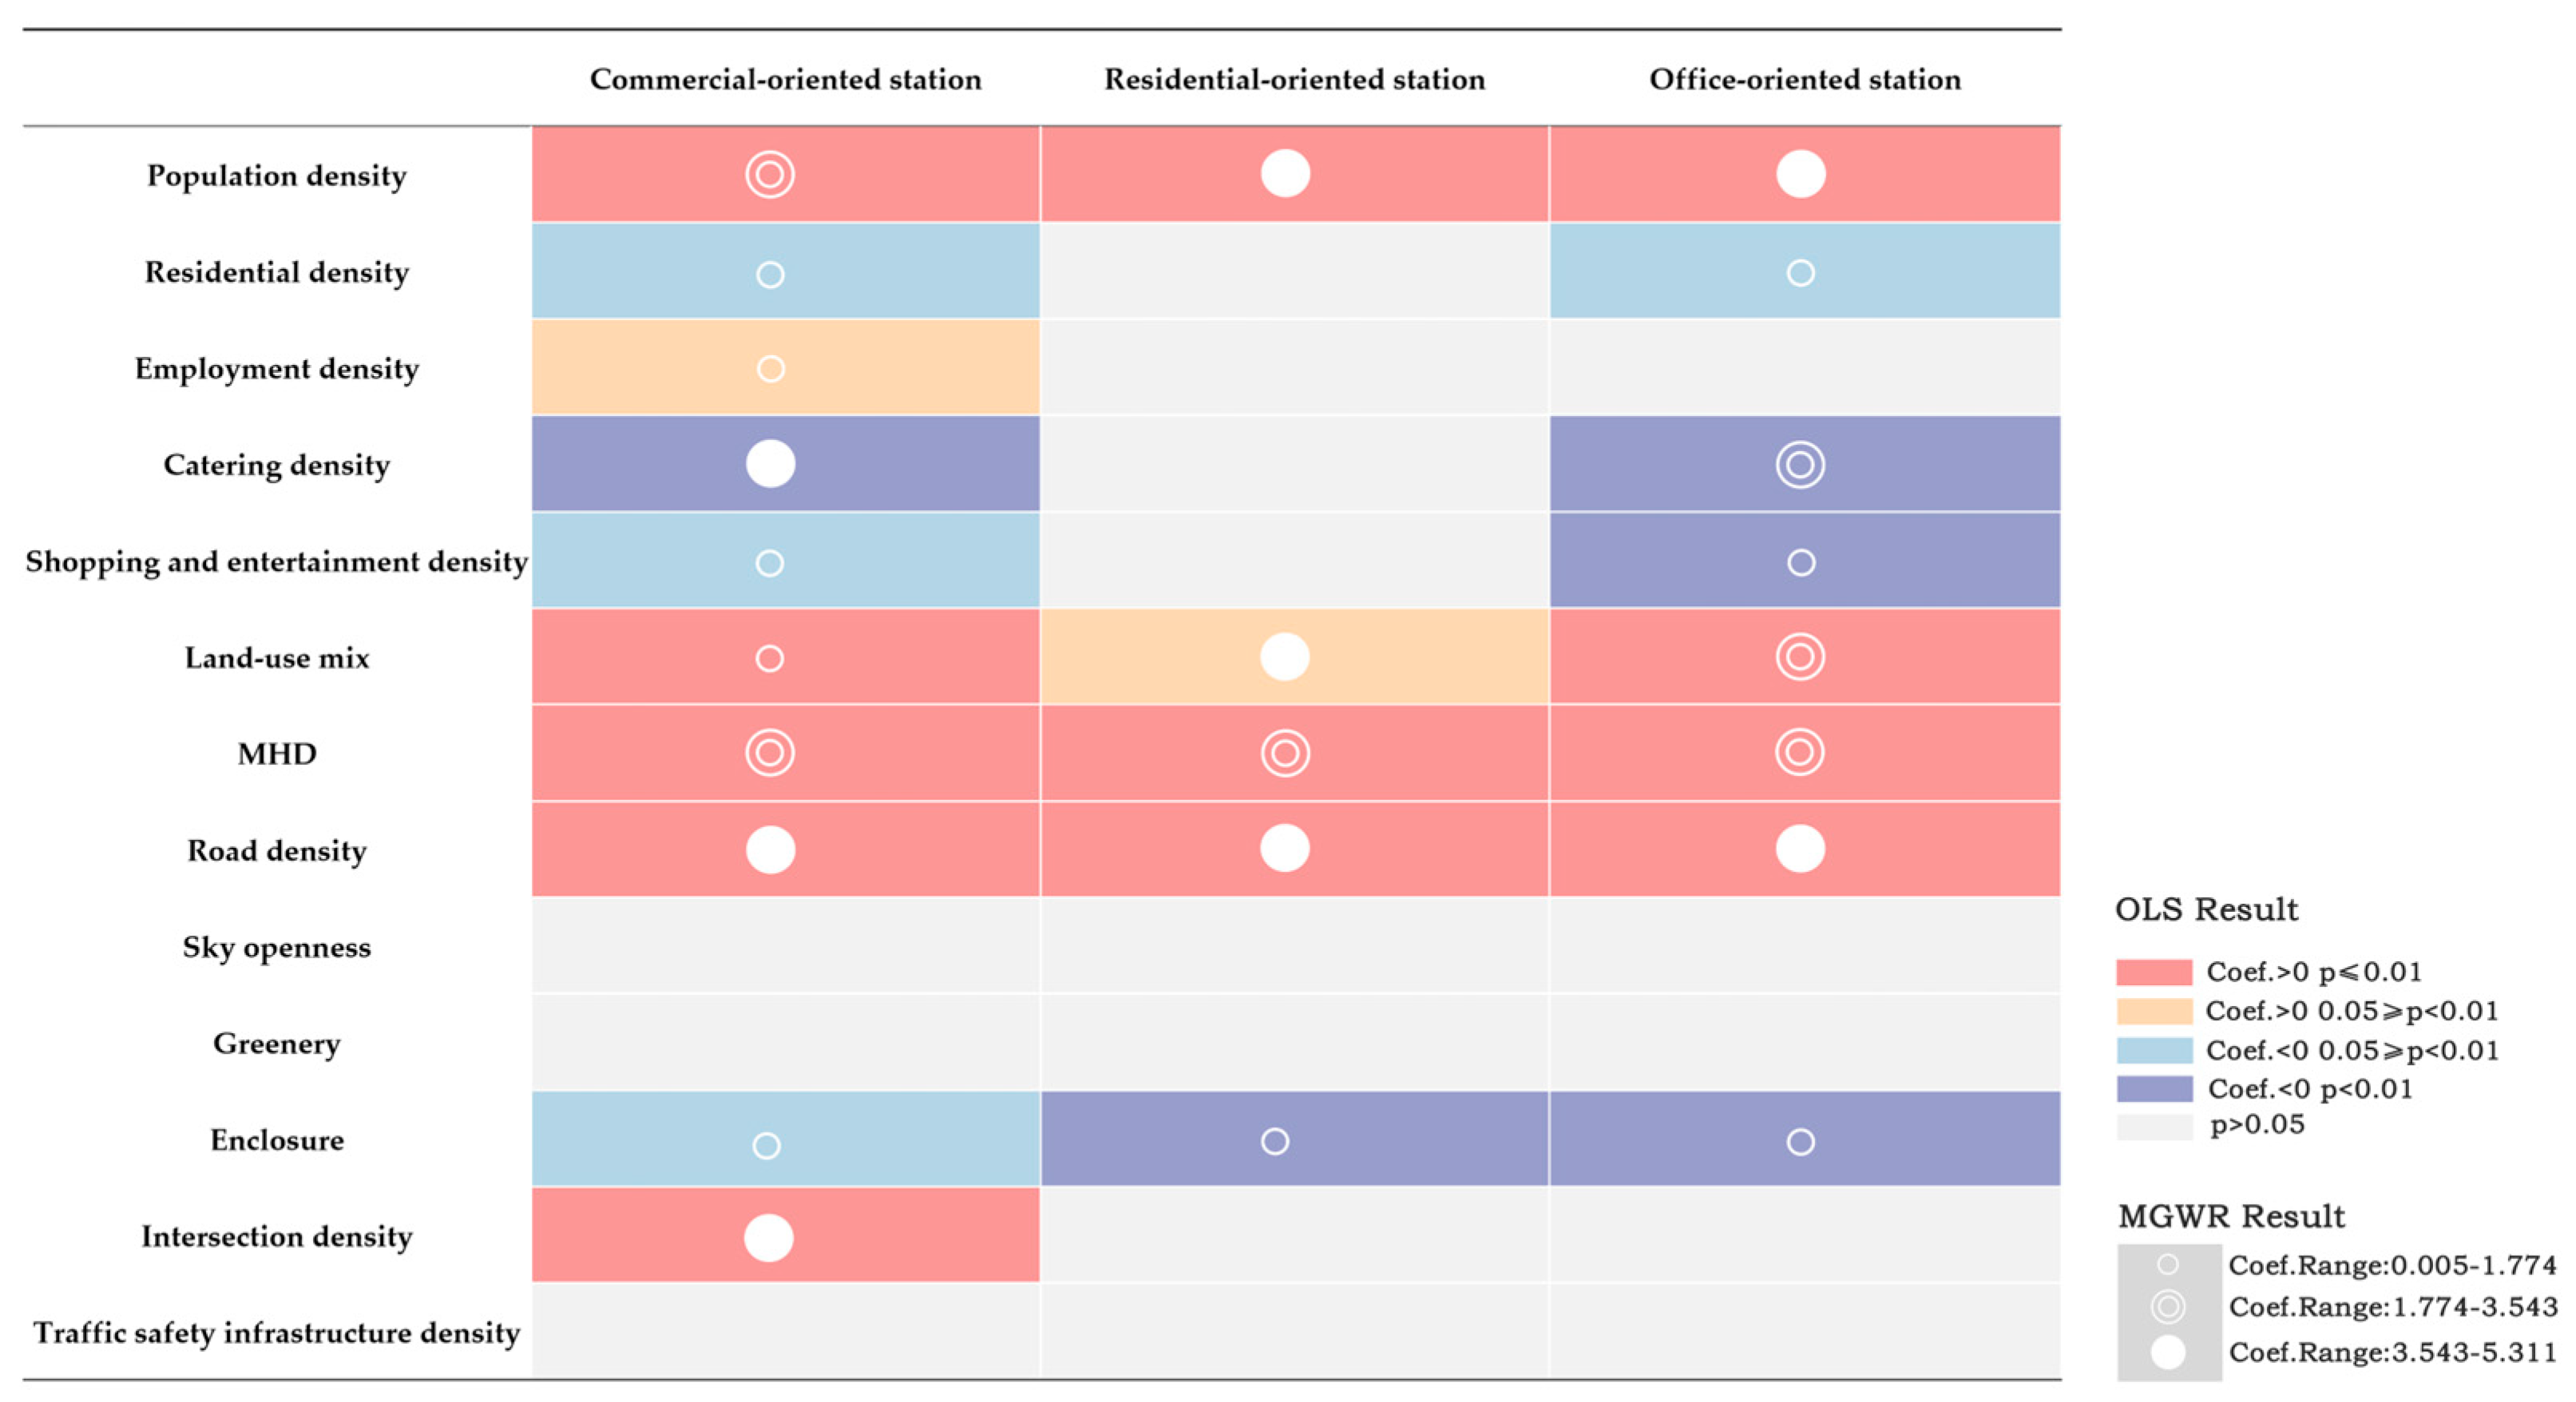
4.2. Results of the OLS Model
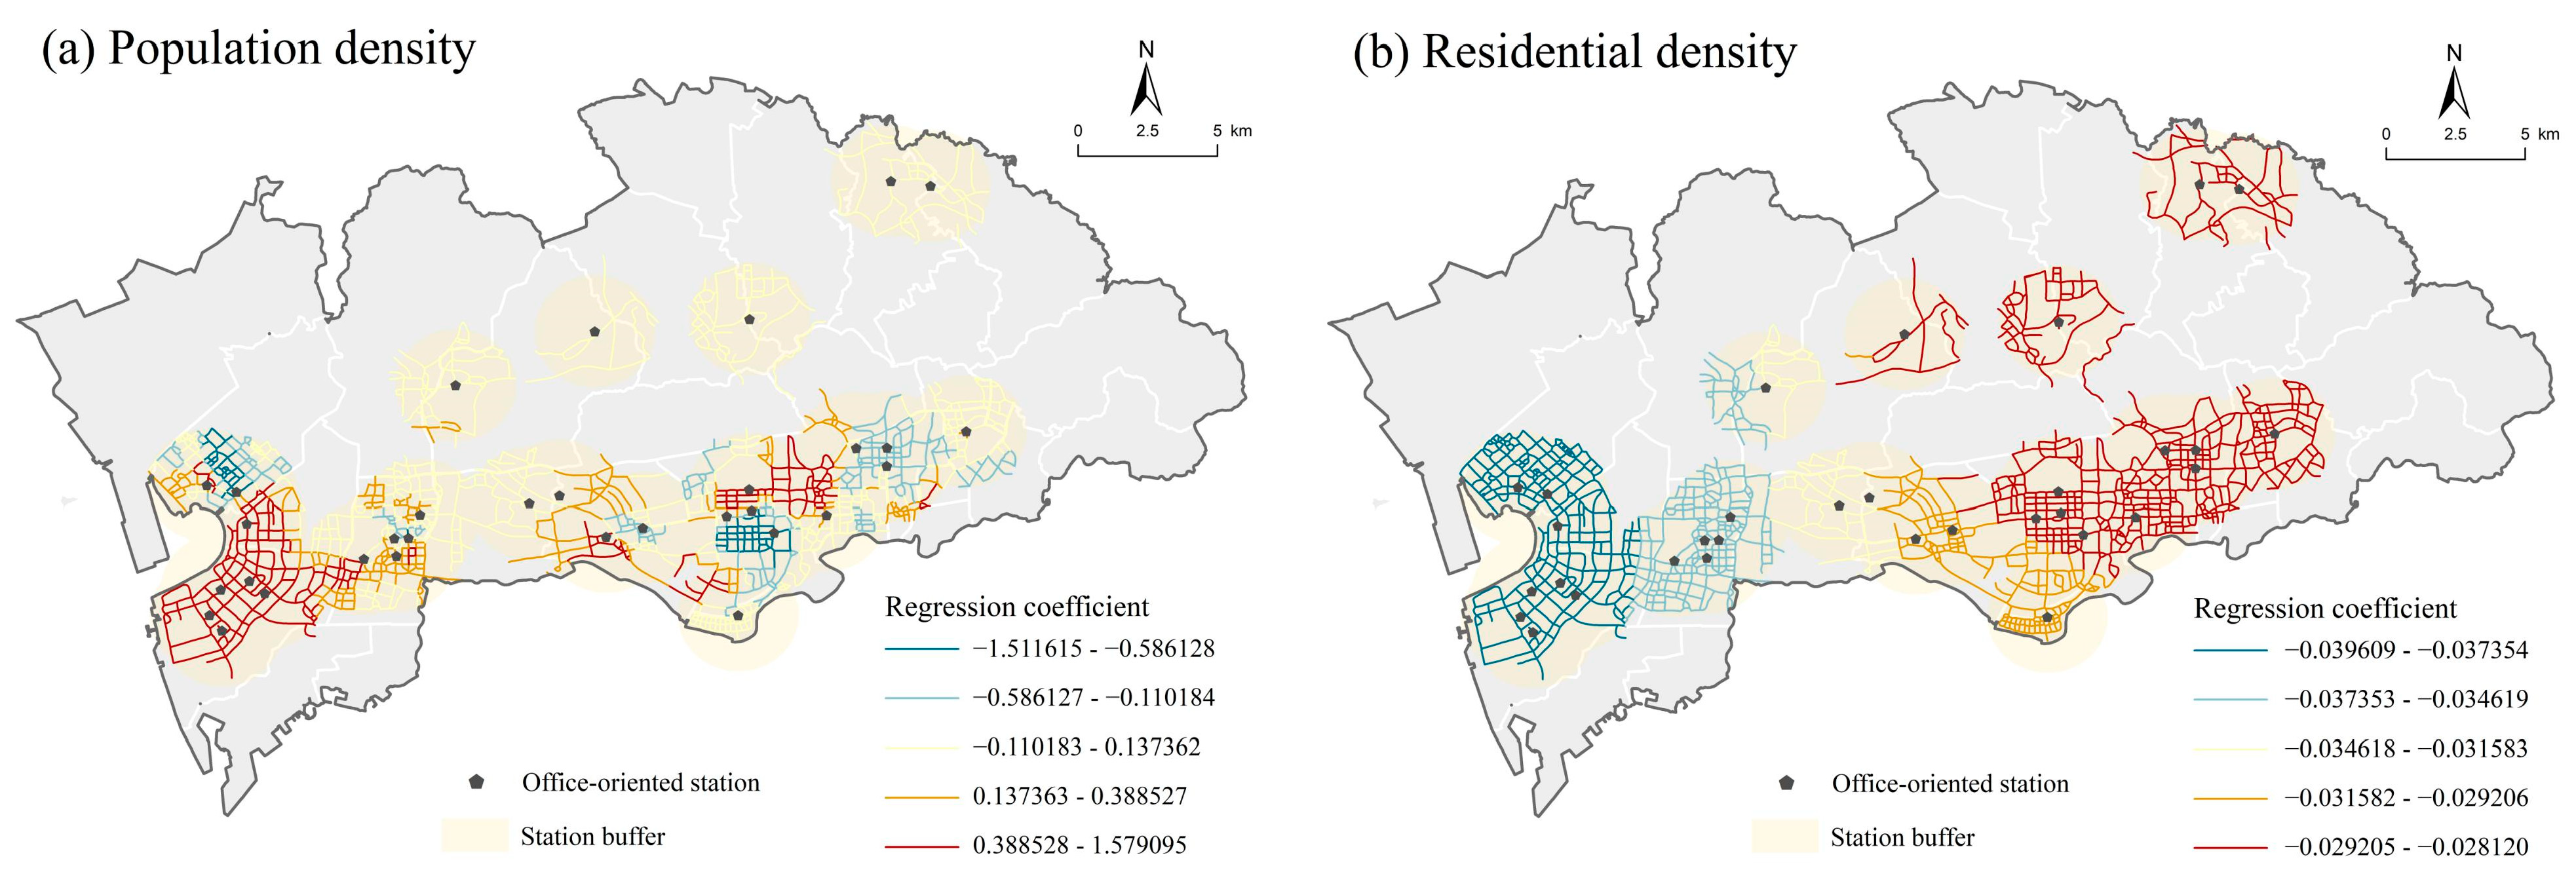
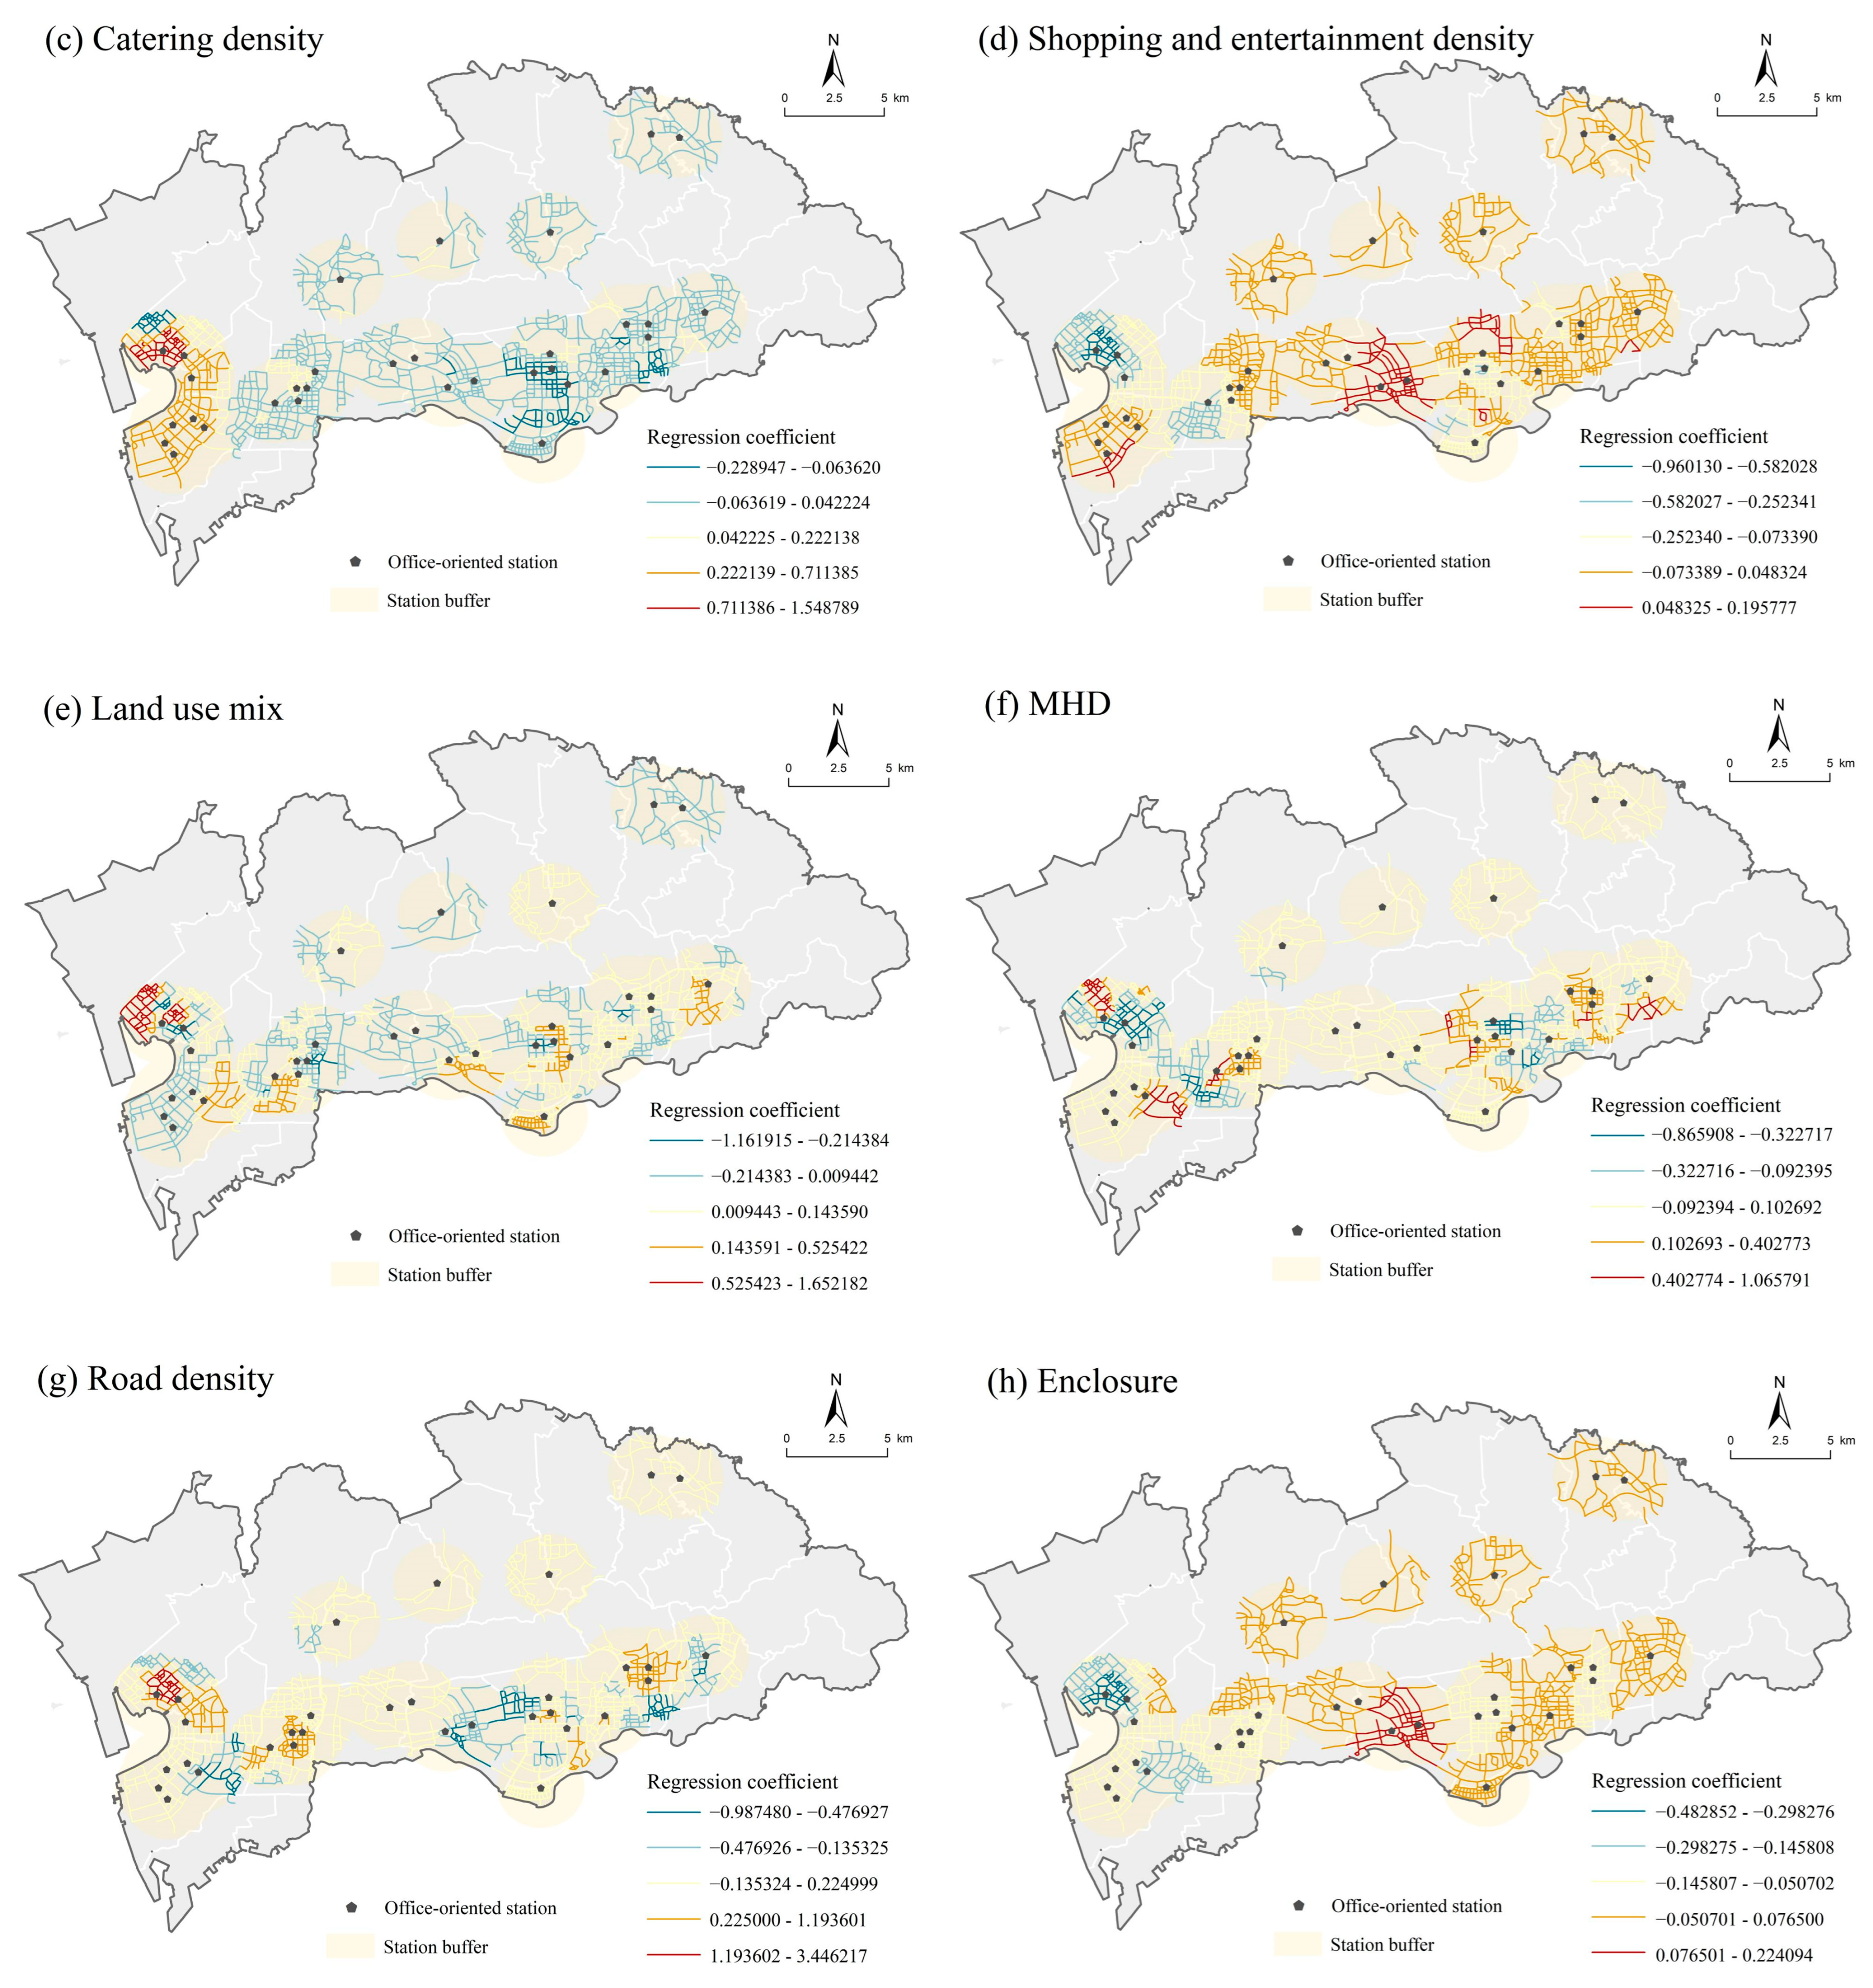
4.3. Results of the MGWR Model
5. Discussion
5.1. Impact of the Built Environment on the Integrated Use
5.2. Spatial Heterogeneity of the Impact of Built Environment on the Integrated Use
6. Conclusions
Supplementary Materials
Author Contributions
Funding
Data Availability Statement
Conflicts of Interest
References
- Guo, Y.; Yang, L.; Chen, Y. Bike Share Usage and the Built Environment: A Review. Front. Public Health 2022, 10, 848169. [Google Scholar] [CrossRef] [PubMed]
- Zuo, T.; Wei, H.; Chen, N.; Zhang, C. First-and-last mile solution via bicycling to improving transit accessibility and advancing transportation equity. Cities 2020, 99, 102614. [Google Scholar] [CrossRef]
- Shenzhen Municipal Transportation Bureau. Shenzhen Bicycle Traffic Development Plan (2021–2035); Shenzhen Municipal Transportation Bureau: Shenzhen, China, 2022. [Google Scholar]
- Cheng, L.; Jin, T.; Wang, K.; Lee, Y.; Witlox, F. Promoting the integrated use of bikeshare and metro: A focus on the nonlinearity of built environment effects. Multimodal Transp. 2022, 1, 100004. [Google Scholar] [CrossRef]
- Zhan, Z.; Guo, Y.; Noland, R.B.; He, S.Y.; Wang, Y. Analysis of links between dockless bikeshare and metro trips in Beijing. Transp. Res. Part A Policy Pract. 2023, 175, 103784. [Google Scholar] [CrossRef]
- Cheng, L.; Huang, J.; Jin, T.; Chen, W.; Li, A.; Witlox, F. Comparison of station-based and free-floating bikeshare systems as feeder modes to the metro. J. Transp. Geogr. 2023, 107, 103545. [Google Scholar] [CrossRef]
- Sun, Y.; Wang, Y.; Wu, H. How does the urban built environment affect dockless bikesharing-metro integration cycling? Analysis from a nonlinear comprehensive perspective. J. Clean. Prod. 2024, 449, 141770. [Google Scholar] [CrossRef]
- Guo, Y.; He, S.Y. The role of objective and perceived built environments in affecting dockless bike-sharing as a feeder mode choice of metro commuting. Transp. Res. Part A Policy Pract. 2021, 149, 377–396. [Google Scholar] [CrossRef]
- Guo, Y.; He, S.Y. Built environment effects on the integration of dockless bike-sharing and the metro. Transp. Res. Part D Transp. Environ. 2020, 83, 102335. [Google Scholar] [CrossRef]
- Guo, Y.; He, S.Y. Perceived built environment and dockless bikeshare as a feeder mode of metro. Transp. Res. Part D Transp. Environ. 2021, 92, 102693. [Google Scholar] [CrossRef]
- Yin, Z.; Guo, Y.; Zhou, M.; Wang, Y.; Tang, F. Integration between Dockless Bike-Sharing and Buses: The Effect of Urban Road Network Characteristics. Land 2024, 13, 1209. [Google Scholar] [CrossRef]
- Song, Q.; Huang, Y.; Li, W.; Chen, F.; Qiu, W. Unraveling the effects of micro-level street environment on dockless bikeshare in Ithaca. Transp. Res. Part D Transp. Environ. 2024, 132, 104256. [Google Scholar] [CrossRef]
- Caigang, Z.; Shaoying, L.; Zhangzhi, T.; Feng, G.; Zhifeng, W. Nonlinear and threshold effects of traffic condition and built environment on dockless bike sharing at street level. J. Transp. Geogr. 2022, 102, 103375. [Google Scholar] [CrossRef]
- Ethier, B.G.; Wilson, J.S.; Camhi, S.M.; Shi, L.; Troped, P.J. An analysis of built environment characteristics in daily activity spaces and associations with bike share use. Travel Behav. Soc. 2024, 37, 100850. [Google Scholar] [CrossRef]
- Dong, S.; Wang, Y.; Dou, M.; Wang, C.; Gong, J. Uncovering the similarity and heterogeneity of metro stations: From passenger mobility, land use, and streetscapes semantics. Appl. Geogr. 2025, 174, 103450. [Google Scholar] [CrossRef]
- Chen, L.; Chen, Y.; Wang, Y.; Li, Y. Research on the Classification of Rail Transit Stations and Passenger Flow Patterns—A Case from Xi’an, China. Buildings 2024, 14, 1068. [Google Scholar] [CrossRef]
- Shi, Y.; Zeng, L. How do built environment characteristics influence metro-bus transfer patterns across metro station types in Shanghai? J. Transp. Geogr. 2025, 123, 104137. [Google Scholar] [CrossRef]
- Wu, T.; Li, M.; Gao, L.; Zhou, Y. Integrating spatial vitality and node-place model to evaluate and classify metro station areas in Wuhan. Front. Archit. Res. 2024, 13, 1363–1376. [Google Scholar] [CrossRef]
- Guan, H.; JI, X.; LI, W.; Chen, F.; Deng, R. Influence of Built Environment on Integrated Use of Bike Sharing and Metro. J. Transp. Syst. Eng. Inf. Technol. 2024, 24, 200–211. [Google Scholar] [CrossRef]
- Zhao, P.; Li, S. Bicycle-metro integration in a growing city: The determinants of cycling as a transfer mode in metro station areas in Beijing. Transp. Res. Part A Policy Pract. 2017, 99, 46–60. [Google Scholar] [CrossRef]
- Cervero, R.; Kockelman, K. Travel demand and the 3Ds: Density, diversity, and design. Transp. Res. Part D Transp. Environ. 1997, 2, 199–219. [Google Scholar] [CrossRef]
- Cervero, R.; Sarmiento, O.L.; Jacoby, E.; Gomez, L.F.; Neiman, A. Influences of Built Environments on Walking and Cycling: Lessons from Bogotá. Int. J. Sustain. Transp. 2009, 3, 203–226. [Google Scholar] [CrossRef]
- Munshi, T. Built environment and mode choice relationship for commute travel in the city of Rajkot, India. Transp. Res. Part D Transp. Environ. 2016, 44, 239–253. [Google Scholar] [CrossRef]
- Reid, E.; Robert, C. Travel and the Built Environment: A Meta-Analysis. J. Am. Plan. Assoc. 2010, 76, 265–294. [Google Scholar] [CrossRef]
- Ni, Y.; Chen, J. Exploring the Effects of the Built Environment on Two Transfer Modes for Metros: Dockless Bike Sharing and Taxis. Sustainability 2020, 12, 2034. [Google Scholar] [CrossRef]
- Bi, H.; Li, A.; Hua, M.; Zhu, H.; Ye, Z. Examining the varying influences of built environment on bike-sharing commuting: Empirical evidence from Shanghai. Transp. Policy 2022, 129, 51–65. [Google Scholar] [CrossRef]
- Zhang, Y.; Thomas, T.; Brussel, M.; van Maarseveen, M. Exploring the impact of built environment factors on the use of public bikes at bike stations: Case study in Zhongshan, China. J. Transp. Geogr. 2017, 58, 59–70. [Google Scholar] [CrossRef]
- Jeon, J.; Woo, A. The effects of built environments on bicycle accidents around bike-sharing program stations using street view images and deep learning techniques: The moderating role of streetscape features. J. Transp. Geogr. 2024, 121, 103992. [Google Scholar] [CrossRef]
- Sarkar, P.P.; Mallikarjuna, C. Effect of perception and attitudinal variables on mode choice behavior: A case study of Indian city, Agartala. Travel Behav. Soc. 2018, 12, 108–114. [Google Scholar] [CrossRef]
- He, S.Y.; Thøgersen, J. The impact of attitudes and perceptions on travel mode choice and car ownership in a Chinese megacity: The case of Guangzhou. Res. Transp. Econ. 2017, 62, 57–67. [Google Scholar] [CrossRef]
- Chan, E.T.H.; Schwanen, T.; Banister, D. The role of perceived environment, neighbourhood characteristics, and attitudes in walking behaviour: Evidence from a rapidly developing city in China. Transportation 2019, 48, 431–454. [Google Scholar] [CrossRef]
- Wang, R.; Lu, Y.; Zhang, J.; Liu, P.; Yao, Y.; Liu, Y. The relationship between visual enclosure for neighbourhood street walkability and elders’ mental health in China: Using street view images. J. Transp. Health 2019, 13, 90–102. [Google Scholar] [CrossRef]
- Bai, Y.; Bai, Y.; Wang, R.; Yang, T.; Song, X.; Bai, B. Exploring Associations between the Built Environment and Cycling Behaviour around Urban Greenways from a Human-Scale Perspective. Land 2023, 12, 619. [Google Scholar] [CrossRef]
- Dai, L.; Zheng, C.; Dong, Z.; Yao, Y.; Wang, R.; Zhang, X.; Ren, S.; Zhang, J.; Song, X.; Guan, Q. Analyzing the correlation between visual space and residents’ psychology in Wuhan, China using street-view images and deep-learning technique. City Environ. Interact. 2021, 11, 100069. [Google Scholar] [CrossRef]
- Dong, R.; Zhang, Y.; Zhao, J. How Green Are the Streets Within the Sixth Ring Road of Beijing? An Analysis Based on Tencent Street View Pictures and the Green View Index. Int. J. Environ. Res. Public Health 2018, 15, 1367. [Google Scholar] [CrossRef]
- Lambert, G.W.; Reid, C.; Kaye, D.M.; Jennings, G.L.; Esler, M.D. Effect of sunlight and season on serotonin turnover in the brain. Lancet 2002, 360, 1840–1842. [Google Scholar] [CrossRef] [PubMed]
- Bai, Y.; Cao, M.; Wang, R.; Liu, Y.; Wang, S. How street greenery facilitates active travel for university students. J. Transp. Health 2022, 26, 101393. [Google Scholar] [CrossRef]
- Ito, K.; Biljecki, F. Assessing bikeability with street view imagery and computer vision. Transp. Res. Part C Emerg. Technol. 2021, 132, 103371. [Google Scholar] [CrossRef]
- Feng, H.; Chen, Y.; Wu, J.; Zhao, Z.; Wang, Y.; Wang, Z. Urban Rail Transit Station Type Identification Based on “Passenger Flow—Land Use—Job-Housing”. Sustainability 2023, 15, 15103. [Google Scholar] [CrossRef]
- Wang, Y.; Li, J.; Yang, X.; Guo, Y.; Ren, J.; Zhan, Z. Examining the impact of station location on dockless bikesharing-metro integration: Evidence from Beijing. Travel Behav. Soc. 2024, 37, 100835. [Google Scholar] [CrossRef]
- Li, X.; Yan, Q.; Ma, Y.; Luo, C. Spatially Varying Impacts of Built Environment on Transfer Ridership of Metro and Bus Systems. Sustainability 2023, 15, 7891. [Google Scholar] [CrossRef]
- Wang, H.; Ma, H. Classification Method of Urban Rail Transit Stations Based on POI. Traffic Transp. 2020, 36, 33–37. [Google Scholar] [CrossRef]
- Pan, H.; Shen, Q.; Xue, S. Intermodal Transfer Between Bicycles and Rail Transit in Shanghai, China. Transp. Res. Rec. J. Transp. Res. Board 2010, 2144, 181–188. [Google Scholar] [CrossRef]
- Guo, Y.; Yang, L.; Lu, Y.; Zhao, R. Dockless bike-sharing as a feeder mode of metro commute? The role of the feeder-related built environment: Analytical framework and empirical evidence. Sustain. Cities Soc. 2021, 65, 102594. [Google Scholar] [CrossRef]
- Yang, S.; Peng, C.; Hu, S.; Zhang, P. Geospatial modelling of housing rents from TOD using MGWR and implications on integrated transportation-land use planning. Appl. Geogr. 2024, 170, 103356. [Google Scholar] [CrossRef]
- Xia, X.; Gai, J. Classification of urban rail transit stations and points and analysis of passenger flow characteristics based on K-Means clustering algorithm. Mod. Urban Transit. 2021, 4, 112–118. [Google Scholar] [CrossRef]
- Wang, R.; Lu, Y.; Wu, X.; Liu, Y.; Yao, Y. Relationship between eye-level greenness and cycling frequency around metro stations in Shenzhen, China: A big data approach. Sustain. Cities Soc. 2020, 59, 102201. [Google Scholar] [CrossRef]
- Zheng, Z.; Zhang, J.; Zhang, L.; Li, M.; Rong, P.; Qin, Y. Understanding the impact of the built environment on ride-hailing from a spatio-temporal perspective: A fine-scale empirical study from China. Cities 2022, 126, 103706. [Google Scholar] [CrossRef]
- Li, A.; Zhao, P.; Huang, Y.; Gao, K.; Axhausen, K.W. An empirical analysis of dockless bike-sharing utilization and its explanatory factors: Case study from Shanghai, China. J. Transp. Geogr. 2020, 88, 102828. [Google Scholar] [CrossRef]
- Brunsdon, C.; Fotheringham, A.S.; Charlton, M.E. Geographically Weighted Regression: A Method for Exploring Spatial Nonstationarity. Geogr. Anal. 1996, 28, 281–298. [Google Scholar] [CrossRef]
- Fatima, M.; Ünsal, Ö. Geospatial analysis of diarrhoea determinants among children under five in Pakistan using Multiscale Geographically Weighted Regression (MGWR). Appl. Geogr. 2024, 172, 103434. [Google Scholar] [CrossRef]
- Ma, X.; Ji, Y.; Yuan, Y.; Van Oort, N.; Jin, Y.; Hoogendoorn, S. A comparison in travel patterns and determinants of user demand between docked and dockless bike-sharing systems using multi-sourced data. Transp. Res. Part A Policy Pract. 2020, 139, 148–173. [Google Scholar] [CrossRef]
- Liang, M.; Wang, G. A Study of Parking Space of Shared Bikes Near Rail Transit Stations, Chengdu. Planners 2019, 35, 54–61. [Google Scholar] [CrossRef]
- Xiang, Z.; Li, Q.; Hong, L.; Sheng, J.; Ban, P. Effects of Built Environment on the Spatio-Temporal Trajectories of Shared Bicycles: A Case Study of Shenzhen. Trop. Geogr. 2024, 44, 236–247. [Google Scholar] [CrossRef]
- Shen, H.; Weng, J.; Lin, P. Exploring the nuanced correlation between built environment and the integrated travel of dockless bike-sharing and metro at origin-route-destination level. Sustain. Cities Soc. 2025, 119, 106090. [Google Scholar] [CrossRef]
- Zhang, Y.; Chen, X.-J.; Gao, S.; Gong, Y.; Liu, Y. Integrating smart card records and dockless bike-sharing data to understand the effect of the built environment on cycling as a feeder mode for metro trips. J. Transp. Geogr. 2024, 121, 103995. [Google Scholar] [CrossRef]
- Mitra, R.; Schofield, J. Biking the First Mile: Exploring a Cyclist Typology and Potential for Cycling to Transit Stations by Suburban Commuters. Transp. Res. Rec. J. Transp. Res. Board 2019, 2673, 951–962. [Google Scholar] [CrossRef]
- Mateo-Babiano, I.; Bean, R.; Corcoran, J.; Pojani, D. How does our natural and built environment affect the use of bicycle sharing? Transp. Res. Part A Policy Pract. 2016, 94, 295–307. [Google Scholar] [CrossRef]
- Jiao, J.; Rollo, J.; Fu, B.; Liu, C. Exploring Effective Built Environment Factors for Evaluating Pedestrian Volume in High-Density Areas: A New Finding for the Central Business District in Melbourne, Australia. Land 2021, 10, 655. [Google Scholar] [CrossRef]
- Chen, E.; Ye, Z. Identifying the nonlinear relationship between free-floating bike sharing usage and built environment. J. Clean. Prod. 2021, 280, 124281. [Google Scholar] [CrossRef]
- Ewing, R.; Handy, S. Measuring the Unmeasurable: Urban Design Qualities Related to Walkability. J. Urban Des. 2009, 14, 65–84. [Google Scholar] [CrossRef]
- Jia, J.; Wang, Z.; Li, L. Research on the Correlation between Road Visual Features and Cycling Traffic Based on Multi-source Big Data and Deep Learning. Chin. Landsc. Archit. 2023, 39, 84–90. [Google Scholar] [CrossRef]
- Helbich, M.; Yao, Y.; Liu, Y.; Zhang, J.; Liu, P.; Wang, R. Using deep learning to examine street view green and blue spaces and their associations with geriatric depression in Beijing, China. Environ. Int. 2019, 126, 107–117. [Google Scholar] [CrossRef] [PubMed]
- Abdullahi, M.R.; Lu, Q.-C.; Hussain, A.; Tripura, S.; Xu, P.-C.; Wang, S. Location optimization of EV charging stations: A custom K-means cluster algorithm approach. Energy Rep. 2024, 12, 5367–5382. [Google Scholar] [CrossRef]
- Zhao, J.; Guo, F.; Zhang, H.; Dong, J. Mechanisms of non-stationary influence of urban form on the diurnal thermal environment based on machine learning and MGWR analysis. Sustain. Cities Soc. 2024, 101, 105194. [Google Scholar] [CrossRef]
- Liu, H.; Huang, B.; Gao, S.; Wang, J.; Yang, C.; Li, R. Impacts of the evolving urban development on intra-urban surface thermal environment: Evidence from 323 Chinese cities. Sci. Total Environ. 2021, 771, 144810. [Google Scholar] [CrossRef]
- Shabrina, Z.; Buyuklieva, B.; Ng, M.K.M. Short-Term Rental Platform in the Urban Tourism Context: A Geographically Weighted Regression (GWR) and a Multiscale GWR (MGWR) Approaches. Geogr. Anal. 2020, 53, 686–707. [Google Scholar] [CrossRef]
- Lin, J.-J.; Zhao, P.; Takada, K.; Li, S.; Yai, T.; Chen, C.-H. Built environment and public bike usage for metro access: A comparison of neighborhoods in Beijing, Taipei, and Tokyo. Transp. Res. Part D Transp. Environ. 2018, 63, 209–221. [Google Scholar] [CrossRef]
- Liu, Y.; Zhang, Y.; Jin, S.T.; Liu, Y. Spatial pattern of leisure activities among residents in Beijing, China: Exploring the impacts of urban environment. Sustain. Cities Soc. 2020, 52, 101806. [Google Scholar] [CrossRef]
- Shen, Y.; Zhang, X.; Zhao, J. Understanding the usage of dockless bike sharing in Singapore. Int. J. Sustain. Transp. 2018, 12, 686–700. [Google Scholar] [CrossRef]


| Category | Variable | Definition |
|---|---|---|
| Convenience | Population density | Population density within a 500 m circular buffer around the road centroid (persons/km2) |
| Residential density | Number of residential facilities within a 50 m linear buffer per kilometer of road length (facilities/km) | |
| Employment density | Number of employment facilities within a 50 m linear buffer per kilometer of road length (facilities/km) | |
| Catering density | Number of catering facilities within a 50 m linear buffer per kilometer of road length (facilities/km) | |
| Shopping and entertainment density | Number of shopping and entertainment facilities within a 50 m linear buffer per kilometer of road length (facilities/km) | |
| Land-use mix | POI diversity within a 50 m linear buffer | |
| MHD | Road network centrality and accessibility calculated by the sDNA model | |
| Road density | Total road length within a 500 m circular buffer around the road centroid divided by the buffer area (km/km2) | |
| Comfort | Sky openness | % of pixels classified as the sky |
| Greenery | % of pixels classified as trees | |
| Enclosure | % of pixels classified as buildings, columns, walls, and trees | |
| Caution | Intersection density | Number of intersections within a 500 m circular buffer around the road centroid (intersections/km2) |
| Traffic safety infrastructure density | % of pixels classified as pillars, guardrails, and street lights |
| Clustering Factor | Cluster 1 (Commercial-Oriented Station) | Cluster 2 (Residential-Oriented Station) | Cluster 3 (Office-Oriented Station) |
|---|---|---|---|
| Interchange level | 0.03 | −0.43 | 0.28 |
| Road length | 0.01 | −0.55 | 0.44 |
| Location | 0.25 | −0.85 | −0.19 |
| Bus stop density | −0.28 | 1.72 | −0.44 |
| Population density | −0.031 | 1.67 | −0.29 |
| Employment density | −0.49 | 0.39 | 1.50 |
| Shopping density | 0.39 | −0.16 | −1.33 |
| Residential density | 0.43 | −0.47 | −1.20 |
| Commercial-Oriented Station | Residential-Oriented Station | Office-Oriented Station | ||||
|---|---|---|---|---|---|---|
| Coef. | p | Coef. | p | Coef. | p | |
| Population density | 0.156 *** | 0.000 | 0.104 *** | 0.000 | 0.216 *** | 0.000 |
| Residential density | −0.052 *** | 0.010 | −0.041 | 0.097 | −0.063 ** | 0.012 |
| Employment density | 0.047 ** | 0.014 | −0.033 | 0.177 | −0.014 | 0.573 |
| Catering density | −0.065 *** | 0.003 | −0.003 | 0.905 | −0.088 *** | 0.001 |
| Shopping and entertainment density | −0.046 ** | 0.022 | −0.016 | 0.565 | −0.071 *** | 0.004 |
| Land-use mix | 0.081 *** | 0.004 | 0.088 ** | 0.011 | 0.125 *** | 0.000 |
| MHD | 0.151 *** | 0.000 | 0.103 *** | 0.000 | 0.165 *** | 0.000 |
| Road density | 0.133 *** | 0.000 | 0.226 *** | 0.000 | 0.145 *** | 0.000 |
| Sky openness | −0.027 | 0.155 | 0.013 | 0.573 | −0.006 | 0.804 |
| Greenery | −0.024 | 0.173 | −0.039 | 0.081 | −0.042 | 0.056 |
| Enclosure | −0.036 ** | 0.050 | −0.069 *** | 0.004 | −0.061 *** | 0.008 |
| Intersection density | 0.084 *** | 0.000 | −0.012 | 0.597 | 0.045 | 0.063 |
| Traffic safety infrastructure density | 0.012 | 0.477 | 0.017 | 0.402 | 0.01 | 0.618 |
Disclaimer/Publisher’s Note: The statements, opinions and data contained in all publications are solely those of the individual author(s) and contributor(s) and not of MDPI and/or the editor(s). MDPI and/or the editor(s) disclaim responsibility for any injury to people or property resulting from any ideas, methods, instructions or products referred to in the content. |
© 2025 by the authors. Licensee MDPI, Basel, Switzerland. This article is an open access article distributed under the terms and conditions of the Creative Commons Attribution (CC BY) license (https://creativecommons.org/licenses/by/4.0/).
Share and Cite
Li, Y.; Li, J.; Yu, Z.; Li, S.; Li, A. Exploring the Relationship Between the Built Environment and Bike-Sharing Usage as a Feeder Mode Across Different Metro Station Types in Shenzhen. Land 2025, 14, 1291. https://doi.org/10.3390/land14061291
Li Y, Li J, Yu Z, Li S, Li A. Exploring the Relationship Between the Built Environment and Bike-Sharing Usage as a Feeder Mode Across Different Metro Station Types in Shenzhen. Land. 2025; 14(6):1291. https://doi.org/10.3390/land14061291
Chicago/Turabian StyleLi, Yiting, Jingwei Li, Ziyue Yu, Siying Li, and Aoyong Li. 2025. "Exploring the Relationship Between the Built Environment and Bike-Sharing Usage as a Feeder Mode Across Different Metro Station Types in Shenzhen" Land 14, no. 6: 1291. https://doi.org/10.3390/land14061291
APA StyleLi, Y., Li, J., Yu, Z., Li, S., & Li, A. (2025). Exploring the Relationship Between the Built Environment and Bike-Sharing Usage as a Feeder Mode Across Different Metro Station Types in Shenzhen. Land, 14(6), 1291. https://doi.org/10.3390/land14061291