Abstract
The Pinglu Canal, China’s first strategic river–sea transport canal, connects the inland waterway trunk line with the Beibu Gulf International Hub Port, while a diversion channel extension is needed for port development. This study proposed a comparative study of extension routes to Fangchenggang through qualitative analysis and quantitative modeling. Eventually, Route 4 is selected considering the engineering feasibility, ecological impact, and hydrodynamic modeling. It yields the lowest engineering cost, effectively bypasses the ecological protection red lines and cultural heritage areas, and only intersects the controllable ecological restoration zones in a limited manner. Hydrodynamic results show moderate tidal velocities, with maximum rising and falling speeds of 0.72–0.80 m/s and 0.72–0.86 m/s, respectively. The sediment deposition intensity (0.06 m/a) and total volume (58,600 m3/a) are generally lower than the other alternatives. The comparative study shares useful insights into canal route selection and would support the sustainable development of the logistics transportation system in Southwest China.
1. Introduction
Canals, known as artificial waterways connecting different water systems, have played a critical role in promoting the shipping industry, regional economic development, and cultural exchange. From the perspective of shipping, on the one hand, canals are used to build efficient intermodal transportation networks by connecting inland natural waterways with other modes of transportation so as to regulate the longship transportation distances, insufficient connectivity, and high overall logistics costs, such as China’s Grand Canal [1,2]; on the other hand, through the effective establishment of sea-crossing and ocean-crossing international channels, canals have effectively opened up the global trade network, greatly enhanced the efficiency of international logistics, and reorganized the new pattern of the world’s maritime transportation, exemplified by the Suez Canal in Egypt [3] and the Panama Canal [4]. The canal project confronts a complex, multi-dimensional, comprehensive decision-making system of coordination and unity of transportation benefits, ecological protection, and regional development [5]. Common indicators of canal design include the geometric parameters (e.g., depth, width, slope, etc.), hydraulic characteristics (flow velocity, head loss, flow stability), investments (construction and operational costs), and the natural and social constraints of the region, such as terrain, geology, land-use restrictions, and ecological red lines [6].
Recently, great progress has been made in the canal route selection and engineering design [7,8]. Qualitative research commonly adopts methods such as fuzzy comprehensive evaluation and multi-objective decision-making methods (e.g., Technique for Order Preference by Similarity to an Ideal Solution), where expert scoring and hierarchical analysis are employed to assess the risks and feasibility of canal plans [9,10,11]. The identification of indicators and levels is generally achieved based on expert experience, and the evaluation results have advantages in determining the ranking of influencing factors [12]. Pham et al. [13] introduced the TOPSIS method to evaluate the benefits of route selection for the expansion of the Panama Canal and identified transportation cost as the most important factor, followed by transportation time, reliability, and route characteristics. Quantitative research mainly focuses on hydraulic modeling, optimization algorithms, and cost function construction to evaluate engineering parameters and their economic and ecological costs [14]. In terms of hydrodynamic modeling, scholars have developed coupled numerical models to simulate water flow and sediment dynamics. For example, Gad et al. [15] simulated the spatial variation of the seabed in navigation channels by developing a 2D depth-averaged finite element hydro-morphodynamical model. Coraci et al. [16] applied a two-dimensional finite element model to the Venice canals to analyze the intensity of sediment accumulation in the waterways. Meanwhile, hydrodynamic modeling has been extensively adopted in canal capacity evaluation and design optimization. Kamran et al. [17] and Mishra et al. [18] constructed hydrodynamic models based on HEC-RAS and MIKE11 software, respectively, to explore water flow behavior and assess conveyance capacity in canal systems. These models effectively capture transient flow dynamics and interactions with channel geometry, enabling precise evaluation of operational performance and flood risk analysis [19]. Tabari et al. [20] employed the SEEP/W software to establish saturated–unsaturated soil hydrodynamic models, aiming to support the optimized hydraulic design of canals for minimal water conveyance losses. Swamee et al. [21] proposed an explicit design equation as a representative and explored the quantitative relationship between excavation depth and project cost under different cross-sectional morphologies (triangular, rectangular, etc.) by introducing a shape coefficient. Ghazaw [22] optimized the seepage function and evapotranspiration model through the Lagrange multiplier method and systematically computed the economic cost of water loss in the channel cross-section. A comprehensive assessment combining qualitative and quantitative methods could enhance the credibility of engineering schemes in practical scenarios. Fan et al. [23] integrated fuzzy logic, Bayesian network, and utility–value theory to construct a multi-dimensional resilience assessment framework, which was successfully applied in the strait and canal projects.
As global economic development accelerates, canals are constructed to accommodate greater cargo transport demand and more frequent trade exchanges [24]. Specific measures include new canal construction, expansion, and operational optimization [25,26,27]. The expansion of the Panama Canal, which was completed in 2016, allowed for larger vessels with capacity increased by 26.3% (2018), and toll revenue is projected to rise by 56% (2025) [28]. The Pinglu Canal, which started construction in 2022, is the first canal project that connects rivers and estuaries since the founding of the People’s Republic of China. Upon completion, 5000-ton river–maritime direct ships can navigate between China’s coastal ports and major ports in Southeast Asia from the Xijiang ports, opening up a water trade channel between China and the Association of Southeast Asian Nations (ASEAN) and promoting the comprehensive development of economic and trade cooperation between China and ASEAN countries [29]. Liu et al. [30] compared the comprehensive benefits of the existing route and the Pinglu Canal and highlighted that the Pinglu Canal would yield better cargo volume, higher profits, and lower total carbon emissions. However, threats to aquatic habitats still exist, such as the increased risk of proliferation of harmful algal blooms during construction [31] and the reduction in habitat area for wildlife after canal construction [32]. In addition, the Pinglu Canal takes the Beibu Gulf seaport as an important international hub seaport, but the marine container transportation network may be significantly affected when the port encounters congestion, strikes, or natural disasters [33]. To promote the multimodal transport network and enhance shipping safety at the Beibu Gulf Port, it is necessary to extend the Pinglu Canal to Fangcheng Port to form a comprehensive and resilient transport system. The Fangchenggang Port Waterway extension is constructed on the basis of the ancient Huangchengao Canal, linking the Pinglu Canal with inland areas of southwest China via the Xijiang Golden Waterway. This project holds strategic value in expanding the Pinglu Canal’s hinterland reach, restoring regional navigability, and optimizing land use in Fangchenggang and Qinzhou Bay. Moreover, the significant role of Beibu Gulf as an international hub port could be further strengthened.
Based on the construction scheme of the Pinglu Canal, preliminary routes of the extension line toward Fangchenggang East Bay are proposed first. A comparative analysis of alternative routes is then conducted from the perspectives of land resources, transportation planning, ecological protection, water conservancy, and flood control. In order to determine the route direction of the Fangchenggang waterway dredging corridor, a coupled two-dimensional hydrodynamic-sediment model is established to analyze the tidal wave phase relationship at the entrance and exit of the canal, as well as the sediment siltation intensity and the amount of siltation. The results share valuable insights into the selection of the optimal route.
2. Materials and Methods
2.1. Study Area
The new water evacuation canal of Fangchenggang (Ancient Huangchengao Canal) starts from the Tanyou Waterway in Dongwan of Fangchenggang in the south and connects to the Shajing channel of Pinglu Canal in Qinzhou Bay in the north, with a total length of about 16 km. The potential routes of the extension line are proposed based on the historical Huangchengao Canal, which is part of the ancient canal. The total length of the ancient canal is approximately 12 km, with natural sea trenches at its eastern and western ends. The central part of the Huangchengao Canal (about 5 km) shows clear features of artificial excavation. The canal is not navigable due to partial blockage and siltation, as shown in Figure 1. A new shipping canal is therefore planned to expand the hinterland of Pinglu Canal and Beibu Gulf Port. The canal is designed as an extension of a shipping line of Class I standard, enabling 5000-ton ships to navigate in both directions. The designed dimensions of land and marine excavation sections are 6.3 m × 80 m × 360 m (depth × bottom width × minimum bending radius, same as below) and 6.5 m × 130 m × 540 m, respectively. The minimum and maximum navigable water levels are −1.31 m and 3.76 m; the navigable clearance is 18 m. The net navigable width of the channel is 140 m and 240 m for the land and marine sections, respectively.
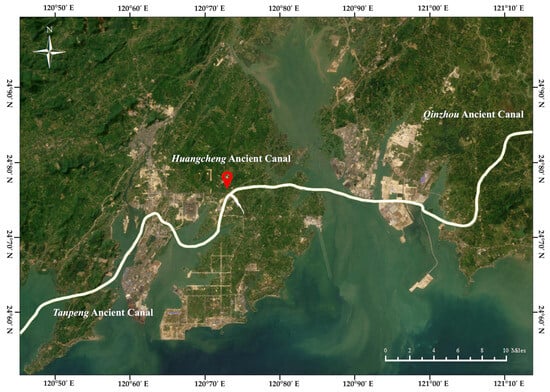
Figure 1.
Route map of the ancient Huangchengao canal.
2.2. Route Planning
The canal construction aims to improve navigation conditions, increase channel capacity, and ensure ship navigation safety while also achieving comprehensive utilization of water resources (e.g., flood control, water usage, and environmental protection). Thus, the fundamental principles of route selection are proposed as follows:
- Optimizing overall benefits by focusing on the shipping development and the improvement of the integrated transport system of Beibu Gulf. Meanwhile, urban planning, land space, ecological protection, and comprehensive transportation also need to be considered to maximize the river–sea coordinated transport and social benefits.
- Following the national principle of land use strategy, priority is given to the use of existing ditches, ponds, and depressions, and arable land is protected as far as possible. Moreover, land acquisition and relocation should be minimized to reduce the amount of earth excavation work.
- The impact of canal construction on existing infrastructures (e.g., transportation, water conservancy, and utilities along the route) should be minimized. Coordination with existing road, rail, port, and water conservancy planning is essential to avoid mutual interference and redundant construction.
- Nature reserves, ecologically sensitive areas, and cultural heritage reserves should be avoided as much as possible to reduce the impact on the ecological environment and cultural heritage protection along the route.
- For canal route selection, a comprehensive evaluation and detailed comparison need to be conducted, including but not limited to natural conditions, terrain, geology, and engineering costs.
In the present study, four routes have been proposed based on the ship navigation requirements, natural conditions, and regional traffic conditions. The layout of four planned routes and their intersections with regional highways and railways are illustrated in Figure 2. It is observed that the main areas of intersection are Shajing Waterway, Maoling Waterway, and Tanyou Waterway, as well as major roads such as Qimao Road, Shaqi Road, and Rongmujiang Road. The specific routes of the extension line are presented in Figure 2:
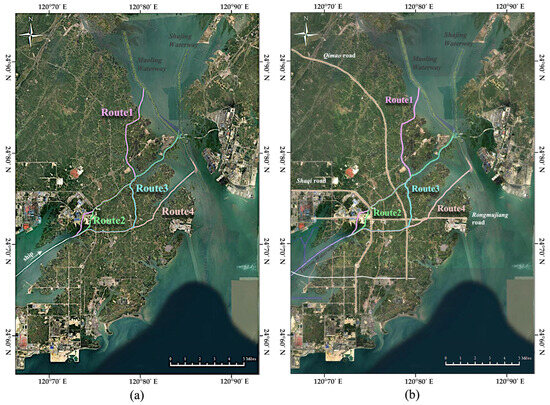
Figure 2.
Geographical map of planned routes (a) and regional traffic conditions (b).
Route 1: Starting from Maoling Channel on the east side of Zhongdun Island, sailing south through the coastal waterway, entering the inland waterway, and then turning southwest, crossing the highway, and then entering the section of the ancient canal, and then passing through the port area and crossing a number of traffic arteries before finally arriving at the final destination. The total length of Route 1 is 16.99 km, including a 4.20 km land excavation section and 12.79 km sea excavation section.
Route 2: Starting from the Shajing channel on the east side of Yagongshan, it sails southwestward to the inland waterway and then overlaps with Route 1, crosses the high-speed road and the ancient canal, and then turns southward through the harbor area, and finally arrives at the endpoint. The total length is approximately 14.90 km, including 4.80 km land excavation section and 10.10 km sea excavation section.
Route 3: Starting from the Shajing channel on the east side of Yagongshan, it sails southwestward into the inner area, then goes southward to the inland river, crosses the highway, passes through several villages, crosses the harbor area and the main traffic route, and finally arrives at the endpoint. The total length of Route 3 is about 17.34 km, including 4.20 km land excavation section and 13.14 km sea excavation section.
Route 4: Starting from the Qinzhou Bay channel in the southern sea area, it enters the inland waterway to the southwest, then crosses the highway to the south, then turns to the west, and crosses the harbor area and the main traffic line after passing through several villages, and finally arrives at the endpoint. The total length is 15.41 km, including 6.20 km land excavation section and 9.21 km sea excavation section.
2.3. Methods
2.3.1. Hydrodynamic and Sediment Modeling
This study develops a coupled two-dimensional hydrodynamic and sediment transport model based on MIKE21 to investigate the characteristics of tidal moments and waves on sedimentation for different routes. The coupled numerical model includes hydrodynamic module (HD), spectral wave module (SW), and sediment transport module (ST). The model was implemented using MIKE ZERO version 2011, and simulations were performed on a Windows 10 operating system running on a Lenovo desktop computer. The flowchart of the numerical model is illustrated in Figure 3, in which the hydrodynamic module provides water level and other elements for the wave module. The coupled hydrodynamic module and spectral wave module provide hydrodynamic fields for the sediment transport module.
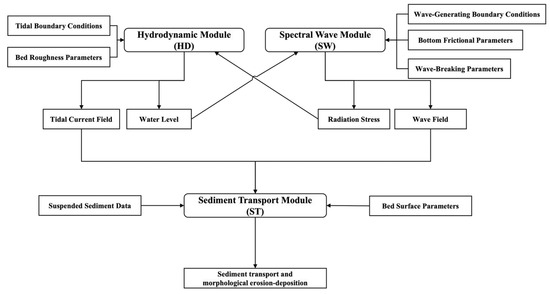
Figure 3.
Flowchart of coupled hydrodynamic and sediment transport model based on MIKE21.
- (1)
- Tidal Flow
A two-dimensional tidal flow model was built by using HD module of MIKE21 software package to compute and analyze the flow field. The governing equations are provided as follows.
Continuity equation:
Momentum equation in X direction:
Momentum equation in Y direction:
where t is time and x and y are spatial coordinates in Cartesian coordinate system; η denotes the water surface elevation, d is the water depth, and ℎ represents the total water depth ℎ = η + d; u and v are the components of flow velocity in the direction of x and y; f is the Coriolis force, and g is the gravitational acceleration; ρ represents the water density. ρ0 is the reference density; pa is the atmospheric pressure; sxx, sxy, syx, syy are the radiational stress components; Txx, Txy, Tyx, Tyy are the horizontal viscous stresses; (τsx, τsy) and (τbx, τby) are the tangential stresses at the water surface and the bottom bed in the direction of X and Y; S is the flow rate of the source–sink term; us and vs are the velocity components corresponding to the source–sink term.
- (2)
- Waves
The SW module of MIKE21 software package has been adopted for sediment transport and siltation calculations. The triangular mesh is beneficial in dealing with complex boundaries in practical scenarios. Within the Cartesian coordinate system, the control equations of SW module are expressed as follows:
where N is the kinetic spectral density; t is time; is the Cartesian coordinate system; is the velocity of the wave group; S is the source term in the energy balance equation; ∇ is the differential operator; s is the propagation direction of the wave; θ and m are the directions perpendicular to s; is the two-dimensional differential operator on space.
In the analysis of shoreline siltation characteristics, it is necessary to comprehensively consider the lifting and transporting effects of waves on the bottom bed sediment. Therefore, representative wave field needs to be selected to simulate the dynamic processes of sediment siltation. Following the Technical Specification for Simulation Tests of Water Transportation Engineering [34], the finite wave height data that play a weaker role in sediment movement have been omitted. The wave energy flow method is introduced to obtain the synthetic wave direction and synthetic wave height by weighted average. The synthetic wave direction is determined as follows:
where Pj, Hj, Tj, αj are the effective wave height, period, frequency of occurrence, and wave direction corresponding to the wave of the j-th magnitude. The synthesized wave height is calculated as below.
- (3)
- Sedimentation
On the basis of the tidal current calculations, the ST module in the MIKE21 software package is utilized to investigate the sediment transport, topographic scouring, and siltation of four routes, as demonstrated in Section 2.2. The fundamental equation of suspended sediment transport is expressed as follows:
where denotes the mean suspended sediment concentration on the vertical line; Dx and Dy are the turbulent diffusion coefficients of suspended sediment along the x and y directions, and Si is the siltation term. The main parameters determined in the ST module include bed shear stress, particle deposition velocity, suspended sand diffusion coefficient, and parameters related to the siltation term. The bed shear stress is calculated as below:
where Ub is the horizontal orbital velocity of the wave water quality point at the bottom of the bed; Uδ is the flow velocity at the top of the wave boundary layer; β is the angle between the flow and wave directions; fw is the wave bottom friction coefficient. Sediment settling velocity is the main parameter for calculating sediment siltation. For grain sizes less than 0.03 mm, sediment particles, which show flocculation state in seawater, have a settling velocity of 0.0004~0.0005 m/s. Sedimentation refers to the conversion process of the sediment from suspended sand to bottom-bed sediments. Siltation occurs when the bed shear stress τb is less than the critical siltation shear stress of sediment. The siltation rate is represented by a stochastic model of sediment–flow interaction.
where cb is the suspended sediment concentration in the near-bottom layer; pd is an expression for the probability of siltation, pd = 1 − τb/τcd; the near-bottom sediment concentration cb can be calculated by using the Pecklett number Pe and the plumbline mean suspended sand content [35].
where Pe is the Pecklett number defined as Pe = 6ws/κUf, Uf is the drag flow rate, and κ is the von Karmen constant (0.4). Scouring refers to the process of transferring sediment from the bottom bed to the water column, and it occurs when the bed shear stress τb is greater than the critical scour shear stress τce. The erosion rate can be expressed as the following formula [36].
where E is the degree of erosion; τce is the critical scour shear stress.
2.3.2. Model Computational Domain and Grid Division
The computational domain of the tidal current is shown in Figure 4, with a length of 372 km in the east–west direction and a width of 192 km in the north–south direction.
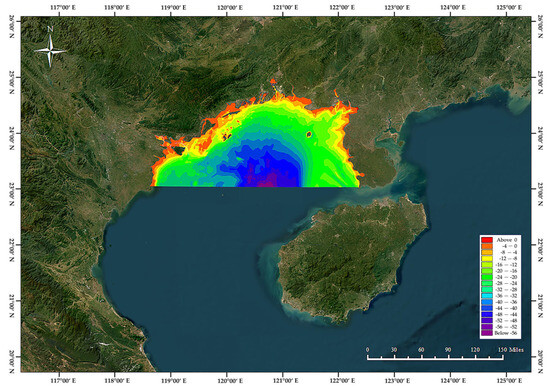
Figure 4.
Schematic diagram of numerical simulation domain.
Part of Beibu Gulf north of the line connecting Dengloujiao of the Leizhou Peninsula (110°1′53.92″, 20°17′3.60″) and the mouth of the Honghe River (106°34′19.07″, 20°17′3.60″) is adopted as the computational area. The large-scale water depth is determined by the charts of Naval Hydrographic Bureau and the maritime authority. The bathymetry in the vicinity of the extension line of Pinglu Canal is further corrected according to the bathymetric charts of December 2019, and the shorelines are extracted following the satellite images of Google Earth.
In order to improve the computational efficiency and accuracy, a locally encrypted unstructured triangular grid is used in the present study. Larger grid sizes have been utilized in the sea area, e.g., roughly 2000 m at the open sea boundary, while finer grid sizes (about 5 m~10 m) are adopted in the route areas. Since Route 1 and Route 2 show a greater impact on the regional traffic system and the resulting railway expansion project is challenging, this paper evaluates the navigation conditions and siltation in the waterways for Route 3 and Route 4. The total number of computational nodes generated in the computational domain of Route 3 is 325,883, with a total of 640,035 grids. The total number of computational nodes generated for Route 4 is 318,856, with a total of 626,696 grids. The detailed grid division for Route 3 and Route 4 is illustrated in Figure 5.
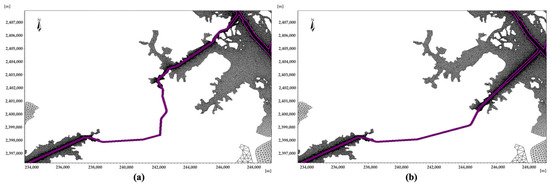
Figure 5.
Grid division of coupled hydrodynamic-sediment model for Route 3 (a) and Route 4 (b).
2.3.3. Model Database
The hydrodynamic and sediment transport model was developed based on a comprehensive integration of various datasets for model setup, calibration, and validation. A detailed summary of the input data and parameter definitions is provided in Table 1.

Table 1.
Data sources and applications.
2.3.4. Model Calibration and Validation
The tide and wave measurements in Qinzhou Bay of 2021 have been obtained for model calibration and validation. In the present study, the hydrodynamic model is calibrated through the eddy viscosity coefficient (Cs) and Manning’s coefficient (M), while the sediment transport module is calibrated through settling velocity and critical shear stress. Since detailed observation sequences of topographic siltation are absent, the historical nautical charts are derived from the maritime authorities to validate the topographic siltation features. The numerical model also takes into account the combined effect of tidal currents and waves (e.g., SES and SSSW) and is calibrated to conform with the macroscopic law of seabed evolution.
3. Results
3.1. Traffic Impacts Along the Route
As demonstrated in Section 2.2, four different routes have been proposed for the extension line between Pinglu Canal and Fangchenggang, of which Route 1 and Route 2 go down across the same highway and railway, and Route 3 and Route 4 go down across the same railway. Detailed information is provided in Figure 6.
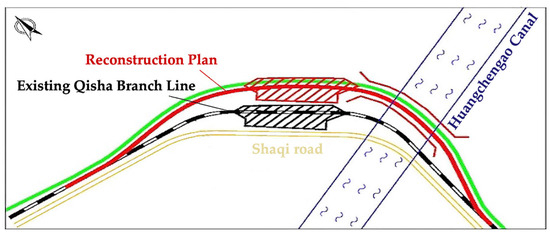
Figure 6.
Schematic diagram of the railway reconstruction plan for Route 1 and Route 2.
- (1)
- Route 1 and Route 2
Both routes bypass the highway and railway at the same location. The sufficient spatial availability along Shaqi Avenue and Qimao Road enables the potential construction of Route 1 and Route 2.
The planned canal waterway would pass under the railway about 400 m south of the Huangchengao Station. The rail elevation of Huangchengao Station is 22.26 m. To ensure the navigable clearance of the canal waterway, the rail elevation should not be lower than 25.26 m. Huangchengao Station and its freight yard need to be raised by 3.0 m. The total length of the reconstructed railway is approximately 6.8 km, as shown in Figure 6. In addition, Huangchengao Station is an intermediate railway station with six arrival and departure lines and a 6 million-ton comprehensive freight yard. From the perspective of engineering feasibility, the slope lifting height (i.e., 3.0 m) is too large, and the construction cannot transit smoothly. Moreover, the Huangchengao Station will be moved to the east by about 300 m, which has a great impact on the port area planning and is inconsistent with the current land planning scheme. To sum up, neither Route 1 nor Route 2 is recommended in the present study.
- (2)
- Route 3
The planned canal would go under Shaqi Avenue and Qimao Road, where the geological conditions are favorable for the reconstruction project. However, the intersection of Canal Channel and Rongmujiang Avenue is located within the range of the hub interchange. The planned canal route would show a significant impact on its operation, and its feasibility is generally poor.
Route 3 passes under the railway between Huangchengao Station and Yunyue Station. The location of the underpass is approximately 2.7 km away from Huangchengao Station and 5.0 km away from Yunyue Station. To ensure navigable clearance, the rail surface elevation should not be lower than 25.26 m. Therefore, the existing Qisha Branch Line needs to be renovated by raising the slope. Considering the longitudinal section of the existing railway, the slope lifting requirements can be met without involving the reconstruction of the station. The railway reconstruction plan is overall feasible.
- (3)
- Route 4
Consistent with the aforementioned routes, the geological conditions at the location of the underpass highway for Route 4 are relatively good, and its impact on highway reconstruction is overall limited. Route 4 and Route 3 underpass the railway at the same position. Based on the analysis results of Route 3, the railway reconstruction scheme is generally feasible for Route 4.
In summary, it is concluded that Route 4 can be recommended for the extension line.
3.2. Ecological Constraints and Cultural Relics Protection
According to the Fangchenggang City Territorial Spatial Master Plan (2020–2035), mangrove forests are distributed near the Fengliuling River, the Old Yangjiang River, and the Baisha River at both ends of the canal. As shown in Figure 7, the red area denotes “Prohibited development and construction area”, the yellow area is “Restricted development and construction area”, and the green area is “Ecological restoration planning area of mangrove”. The four canal routes proposed in this paper do not intrude on the mangrove forests in the ecological protection red line area. Routes 1, 2, and 3 partially pass through the “Restricted development and construction area”, while Routes 1, 3, and 4 partially pass through the “Ecological restoration planning area of mangrove”.
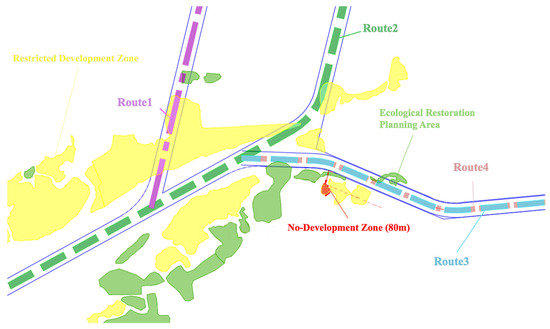
Figure 7.
Relationship diagram between routes plan and mangrove conservation area.
In addition, Route 1 and Route 2 utilize the ancient Huangchengao Canal to cross the Huangchengao Ancient Site. It is necessary to carry out special impact assessments and achieve coordination of cultural relics protection. Routes 3 and 4 will open up new canal waterways by utilizing the tidal gullies on their southern sides without involving issues of cultural relic protection.
3.3. Hydrodynamic Analysis
The high tide level data of 2021 is utilized to calculate tidal patterns and simulate the variations of the tide field of Qinzhou Bay. The land excavation section is reciprocating flow, which is jointly influenced by the tidal wave of Qinzhou Bay and Fangchenggang East Bay. Both Route 3 and Route 4 are characterized by the westward and eastward flows at high and low tides. The measured high tide initially flows westward at the beginning of high tide, and the flow rate gradually decreases, lasting about 7 h. Then it turns to eastward flow; the flow rate gradually increases and then decreases to turn to westward flow, lasting about 5 h. At the early stage, the falling tide is a westward flow and lasts about 5 h and then turns to the east direction. The maximum flow rate of the high tide occurs 2~4 h before the high tide, which is the eastward flow. The maximum flow rate at low tide occurred 3~5 h after high tide and is featured as westward flow. The high tide level occurred from 18:00 on 10 August to 12:00 on 11 August 2021. The maximum and average flow velocities of high tide and low tide at 56 characteristic points along Route 3 and 52 characteristic points along Route 4 are presented in Figure 8 and Figure 9, respectively. Both figures illustrate the spatial distribution of key flow velocity parameters at dense characteristic points along the two selected routes. Figure 8 (for Route 3) and Figure 9 (for Route 4) visualize the tidal hydrodynamic variations in east–west flow directions during both flood and ebb tides. The tidal hydrodynamic features are highlighted in the terrestrial excavation sections as the projects are implemented, revealing the complex tidal responses within the modified areas. Using color gradients and flow velocity contours within a spatial coordinate system, the flow velocity patterns are demonstrated within the project waters. The color transition from blue to red enables quick identification of low-velocity regions to high-velocity regions. In general, the high and low tide velocities of Route 3 and Route 4 are basically similar in the sea-excavated section in Dongwan waters, with the maximum flow velocity at high tide ranging from 0.43 m/s to 1.18 m/s and the maximum flow velocity at low tide ranging from 0.33 m/s to 1.08 m/s, and the maximum flow velocity occurs in the waters near Tanyou Waterway. In the land excavation section, the maximum flow velocities of Route 3 and Route 4 decreased from west to east along the waterway with more uniform patterns.
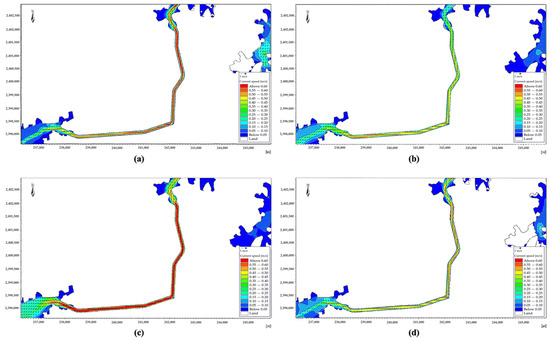
Figure 8.
Calculation results of tidal field in land-excavated section as Route 3 is implemented. (a) Flood—Westward; (b) Flood—Eastward; (c) Ebb—Westward; (d) Ebb—Eastward.
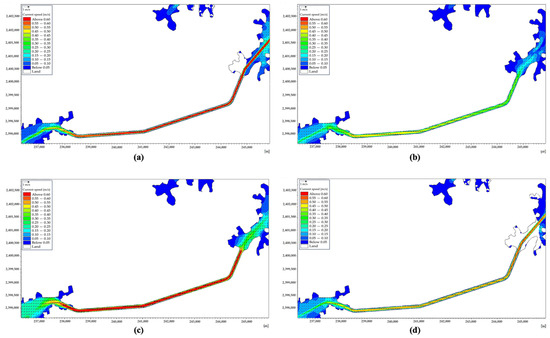
Figure 9.
Calculation results of tidal field in land-excavated section as Route 4 is implemented. (a) Flood—Westward; (b) Flood—Eastward; (c) Ebb—Westward; (d) Ebb—Eastward.
The flow velocity of Route 3 was slightly smaller (i.e., 0.59 m/s~0.75 m/s) in high tide (as shown in Figure 8a,b). The flow velocity of Route 4 was 0.72 m/s~0.80 m/s, as shown in Figure 9a,b. During the low tide period, the flow velocity distributions of Route 3 and Route 4 are generally consistent. Specifically, the flow velocity fell in a range of 0.72 m/s~0.91 m/s (Figure 8c,d) for Route 3 and 0.72 m/s~0.86 m/s (Figure 9c,d) for Route 4. In the sea excavation section of Qinzhou Bay, Route 3 and Route 4 are connected to the main navigation channel near Longmen Harbor and the Legou operation area, respectively, after the widening of the cross-flow section. The maximum flow velocity shows a gradual decreasing and then increasing pattern, attributed to the mainstream of tides in Qinzhou Bay. The connecting section of Route 3 is close to the neck of Qinzhou Bay; therefore, its high tide flow velocity is relatively larger. The maximum flow velocity of high tide falls in a range of 0.50 m/s~1.29 m/s and 0.28 m/s~0.96 m/s for Route 3 and Route 4, respectively. During the low tide period, the maximum flow velocity is noted as 0.38 m/s~1.07 m/s for Route 3 and 0.40 m/s~1.12 m/s for Route 4.
In summary, the land excavation sections of Route 3 and Route 4 are jointly influenced by the tidal waves of Qinzhou Bay and Fangchenggang East Bay. The results highlighted the changing characteristics of westward flow at high tide, eastward flow at high tide, westward flow at low tide, and eastward flow at low tide. The maximum transverse currents along two routes appear in the main channel connection area, of which Route 3 has a larger transverse current velocity due to the more zigzag patterns of the land excavation section, and the sea excavation section is affected by the flow of nearby shallow inlet channels. The flow patterns are relatively chaotic. The maximum transverse currents along the sea excavation section of Fangchenggang East Bay and the land excavation section are generally smaller. As the extension line of Pinglu Canal is implemented (e.g., Route 3 and Route 4), the tidal current field near the sea excavation section would be significantly altered, while the flow field does not present notable variations. In addition, the flow velocity distributions at the mouthwaters and the minimum water level for both routes meet the relevant requirements of coastal protection.
3.4. Wave Field
In the present study, the short-term wave measurement data from January to December 2008 in Fangchenggang and the statistical analysis of the European Center for Medium-Range Weather Forecasts (ECMWF) wave hour-by-hour hindcast data from 2016 to 2020 are adopted and analyzed. The waves of the project area are mainly in NNE and SE~SSW directions. Since Qinzhou Bay and Fangchenggang East Bay are surrounded by land in the east, north, and west directions, the wind area is limited, yielding small wave heights. As a result, the impact of wind waves mainly comes from the mouth of the bay to the south. The SE, SSE, S, and SSW waves are selected as representative waves for sediment transport simulation. Their wave energy accounts for about 45% of the total wave energy, and the annual action days are calculated as 133 days. Considering the shoreline direction of Qinzhou Bay (NNW~SSE) and Fangchenggang East Bay (NNE~SSW), the waves in the outer sea are synthesized according to the dominant wave directions of SE~S and S~SSW. The wave height data were pre-processed, and the small part of wave height less than 0.3 m was omitted to derive the representative wave field in SE~S and S~SSW directions, as shown in Figure 10. The spatial distribution of significant wave height is highlighted in both SE~S (Figure 10a) and S~SSW (Figure 10b) directions. Blue color denotes areas of lower significant wave height, while red color represents areas with elevated wave height. The results reveal substantial differences of wave energy intensity and spatial distributions.
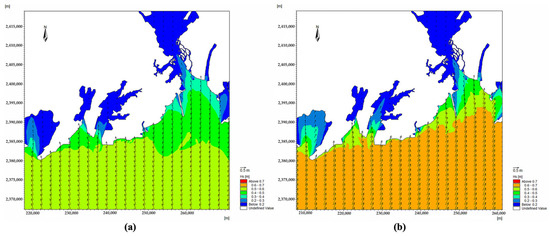
Figure 10.
Numerical simulation of wave field. (a) SE~S direction; (b) S~SSW direction.
3.5. Sedimentation Features
The coupled hydrodynamic-sediment model based on MIKE21 has been utilized to investigate siltation processes as the extension line of Pinglu Canal is implemented. As demonstrated in Section 3.4, two representative wave directions (i.e., SE~S and S~SSW) have been selected to formulate three groups of power conditions, namely, pure tidal current, tidal current + SE~S wave, and tidal current + S~SSW wave. The upstream boundary condition of the numerical model is defined as the average river runoff and sand content, and the annual average siltation under normal weather is calculated by combining the frequency share of three groups of dynamic conditions. The results show that in the sea-excavated section of Dongwan waters, the same alignment of Route 3 and Route 4 leads to the same siltation intensities, with an annual average siltation intensity of 0.07 m/a~0.28 m/a. The volume of siltation would reach 304,600 m3/a. In the excavated section, there is a minor difference in the annual average siltation intensities for Route 3’ (0.04 m/a~0.07 m/a) and Route 4 (0.04 m/a~0.09 m/a). The siltation volume is 59,300 m3/a and 58,600 m3/a for Route 3 and Route 4, respectively. In the excavation section of Qinzhou Bay, Route 3’s annual average siltation intensity is approximately 0.07 m/a~0.32 m/a with a siltation volume of 165,700 m3/a, while Route 4 has a smaller annual average siltation intensity (0.05 m/a~0.20 m/a) and siltation volume (134,100 m3/a).
Following the substrate sampling in the project area, the sediment in the shallow water of Qinzhou Bay is mostly clayey chalk with a very fine grain size, which can be suspended and transported under certain wave currents. Considering the possibility of large waves and their driving mechanism on bed sediment transportation, there is a certain risk of sudden siltation in the project area. In this study, the representative wave with a return period of 10 years is adopted to represent the extreme wave conditions and explore the sudden siltation, and the representative wave direction is chosen to be the SSE direction wave selected for 24 h, which shows more significant influence on the project waters. The results demonstrate that the siltation intensity is 0.05 m and 0.04 m in the excavated section of the Fangchenggang East Bay and land area. The siltation intensity of Route 3 and Route 4 falls in a range of 0.05 m~0.07 m in Qinzhou Bay. A detailed comparison of four different routes is presented in Table 2, which also includes the results of the total engineering costs anticipated for the proposed routes. The engineering mainly includes waterway works, aids to navigation, river-crossing structures, bank protection, road construction, and water diversion facilities. Routes 1 and 2 involve exceptionally high costs for river-crossing structures, primarily due to the need for bridge construction. Route 3 incurs the highest cost in waterway works, owing to the large underwater excavation area and the substantial volume of dredging and rock-blasting operations. Overall, Route 4 demonstrates the highest economic efficiency.

Table 2.
Route Comparison Results.
Based on the comparative study of the traffic impact, ecological constraints, and hydrodynamic analysis, Route 4 is finally selected for the extension line of the Pinglu Canal in terms of engineering feasibility, environmental friendliness, and long-term stability. Specifically, Route 4 avoids the 3 m elevation of Huangchengao Railway Station and the reconstruction of the railway (e.g., Routes 1 and 2 for nearly 6.8 km). The total investment of the project could be reduced by about 40%. In terms of ecological protection, Route 4 bypasses the ecological red line protection area of mangroves, effectively reducing the degree of ecological and environmental impact. Following the hydrodynamic simulations, the flow velocity variations resulting from Route 4 are limited, with the maximum high tide flow velocity ranging from 0.72 m/s to 0.80 m/s and the maximum low tide flow velocity ranging from 0.72 m/s to 0.86 m/s. In contrast, the significant variations in flow velocity distribution by Route 3 would exert a greater impact on port operations and ship navigation safety. Moreover, both the average annual sedimentation intensity and siltation volume of Route 4 are smaller than those of Route 3. Therefore, Route 4 is finally recommended for the extension line of Pinglu Canal.
4. Discussion
4.1. Hydrodynamic Characteristics of Fangchenggang Waters
This study combines expert experience with numerical modeling to comprehensively evaluate the benefits of four routes in the extension line between Pinglu Canal and Fangchenggang. It is concluded that Route 4 satisfies the navigational function and yields stable hydrodynamic conditions (i.e., low cross-flow intensity). The operation and maintenance are expected to be convenient in the later stages, considering small siltation volumes. The present study highlights the significance of hydrodynamics on canal stability, which is consistent with the results reported by Mishra et al. [17]. It is worth noting that canals need to fulfill several different functions (e.g., irrigation, water conveyance and distribution, etc.) [37].
The present study confirms that the influence of transverse flow fields on navigation exists, especially in strongly tidal coastal zones. Huijts et al. [38] found that tidal variations would trigger a double-circle flow regime through a transverse density gradient and that the resulting tidal-phase-dependent transverse momentum transport mechanism significantly affects sediment distribution. Their findings further emphasize that the effects of transverse and longitudinal flow fields on coastal zones arise from their coupled interactions. The flow asymmetry between high and low tides and the difference in cross-flow duration in the results indirectly reveal the tidal asymmetry in the area of the Pinglu Canal extension line. In addition, the average annual siltation intensity (i.e., 0.18 m/a) is higher than that of the land excavation section, indicating that there is a tendency of sediment siltation in the sea section due to the influence of high tidal fluctuation and dynamical processes, which are closely related to the asymmetric push of tidal currents. Van et al. [39] also found that channel deepening interferes with the estuarine tidal asymmetry in the 3D numerical simulation, and channel deepening amplifies the vertical salinity gradient and the phase difference between near-bottom and surface flow velocities, thereby exacerbating the net transport of sediments upstream and leading to significantly higher sediment retention rates in localized areas. The accumulation of estuarine siltation is a great threat to ship navigation safety, and the dredging costs would increase accordingly (PION, 2018; Gar-CIA, 2024). The implementation of the extension line of the Pinglu Canal could improve the capability of port complexes to cope with natural disasters and set up an emergency plan from the perspective of stability.
4.2. Canal Route Design Under Ecological Constraints
Canal projects are usually characterized by cross-basin connectivity and high development intensity. Specific measures include artificial canal excavation, hub construction, waterway improvement, cross-basin water transfer, etc., which fundamentally alter the natural landscape, hydrological conditions, and ecological habitat [40]. Cao et al. [32] pointed out that the construction of the Pinglu Canal would lead to the destruction of regional wildlife habitat connectivity and trigger negative outcomes such as the “ecological isolation effect” and the “edge effect”. The qualitative analysis by Cheng et al. [41] further revealed the underlying mechanisms: canal excavation increased the number of fragmented patches in the mangrove–tidal creek complex ecosystem (from 14 to 25), reduced the average patch size by 44.3%, and increased landscape fragmentation, confirming the costs of the “ecological island effect.” In order to minimize the ecological disturbance, our study shifted from “active restoration” to “active avoidance” by choosing suitable routes to radically reduce the risk of habitat fragmentation. Comparative analysis shows that Route 1 and Route 2 cross the Huangchengao ancient site and occupy more mangrove-restricted development areas, which result in high ecological and cultural risks. In contrast, Route 4 bypasses the nature reserves, ecologically sensitive areas, and cultural relics protection areas as much as possible. The awareness of “active avoidance” has been a concern for a long time. Wells et al. [42] proposed a computerized graphic and map overlay methodology under the U.S. National Environmental Policy Act (1970) for selecting environmentally optimal canal routes with metrics of soil stability, drainage, wildlife migration, and historic site preservation. In the present study, hydrological features, ecological reserves, and historic site protection are combined to evaluate the suitability of different routes from the perspective of ecological benefits.
4.3. Limitations and Future Research Directions
The coupled hydrodynamic-sediment model based on MIKE21 has some shortcomings in both temporal and spatial scales. Only the typical high-tide hydrological conditions in 2021 were used, which may underestimate the temporal evolution mechanism of the flow regimes and the uncertainty of flow disturbances and siltation under extreme conditions. The conclusions of the flow field induced by tides may not be applicable to all estuarine waters, considering the unique geographical form of Qinzhou Bay. In the future, the hydrodynamic and morphological features could be investigated with the aid of a refined numerical model. Moreover, the ecological response mechanism of the extension line of the Pinglu Canal might be further explored through habitat suitability index (HSI) models. Therefore, the ecosystem can be better protected, and the development goal of sustainable transportation can be achieved. To validate the numerical model and habitat suitability calculations, it is necessary to carry out field measurements and ecological surveys to support a comprehensive evaluation of different route schemes.
5. Conclusions
In the context of the Pinglu Canal, the present study provides a comparative study of the route selection of its extension line to Fangchenggang. Four different routes are proposed according to the construction demand, natural conditions, and hydro-morphological features. A coupled two-dimensional hydrodynamic and sediment transport model has been established and validated. The comprehensive analysis demonstrates that Route 4 is recommended for the extension line of the Pinglu Canal. Some preliminary conclusions are drawn as follows:
- (1)
- The elevation lifting (i.e., 3 m) of Huangchengao Railway Station and the reconstruction of the railway (approximately 6.8 km) are challenging. Route 1 and Route 2 are therefore excluded, considering the engineering feasibility. Route 3 imposes considerable adverse impacts on the hub interchange. Thus, Route 4 is eventually selected for the extension line of Pinglu Canal.
- (2)
- The total length of Route 4 is approximately 15.41 km, including a 6.20 km land excavation section and a 9.21 km sea excavation section. It bypasses the mangrove ecological redline protection area and effectively minimizes the ecological environmental impact, whereas Routes 1, 2, and 3 intersect with ecological protection zones. The numerical modeling demonstrates that the canal waterway designed for Route 4 ensures stable hydrodynamic conditions, and the estimated siltation volume is generally acceptable.
- (3)
- The implementation of the extension line of the Pinglu Canal would support the development of the logistics transportation system in Southwest China. It is worth noting that the coupled numerical model would be further improved to provide a refined simulation of hydro-morphological features in the future. Furthermore, the marine ecological response mechanism needs to be further investigated to achieve the sustainable development goal.
Author Contributions
Conceptualization, H.F. and X.C.; methodology, H.F.; software, Z.J.; validation, Z.J., W.W. and H.Y.; formal analysis, X.C.; investigation, H.F.; resources, H.Y.; data curation, W.W.; writing—original draft preparation, X.C.; writing—review and editing, H.F.; visualization, Z.J. All authors have read and agreed to the published version of the manuscript.
Funding
This research was funded by the Fangchenggang Supporting Special Project of the “Guangxi Beibu Gulf Port Master Plan” (No. 032207-001), and the National Natural Science Foundation of China (No. 52071250).
Data Availability Statement
The data that support the findings of this study are available from the corresponding author upon reasonable request.
Acknowledgments
The authors are grateful for the technical support provided by the Department of Transport of Guangxi Zhuang Autonomous Region.
Conflicts of Interest
The authors declare no conflicts of interest.
References
- Yan, H. The making of the Grand Canal in China: Beyond knowledge and power. Int. J. Herit. Stud. 2021, 27, 584–600. [Google Scholar] [CrossRef]
- Fang, L.; Cheng, X.; Yao, G. Research on the Strategy of Promoting the Coordinated Development of Grand Canal Water Transport and Other Transport Modes, Taking Jiangsu as an Example. Sustainability 2023, 15, 15314. [Google Scholar] [CrossRef]
- Rusinov, I.; Gavrilova, I.; Sergeev, M. Features of sea freight through the Suez Canal. Transp. Res. Procedia 2021, 54, 719–725. [Google Scholar] [CrossRef]
- Wang, M. The role of Panama Canal in global shipping. Marit. Bus. Rev. 2017, 2, 247–260. [Google Scholar] [CrossRef]
- Dong, W.; Zhang, C.; Han, W.; Wang, J. Localized Canal Development Model Based on Titled Landscapes on the Grand Canal, Hangzhou Section, China. Land 2024, 13, 1178. [Google Scholar] [CrossRef]
- Swamee, P.K.; Chahar, B.R. Design of Canals; Springer: New Delhi, India, 2015. [Google Scholar]
- Williams, J.G.; Armstrong, G.; Katopodis, C.; Larinier, M.; Travade, F. Thinking like a fish: A key ingredient for development of effective fish passage facilities at river obstructions. River Res. Appl. 2012, 28, 407–417. [Google Scholar] [CrossRef]
- Xiao, Z.; Zhang, X.; Fu, X.; Zhang, L.; Xu, H.; Liu, R.W.; Chong, C.S.; Qin, Z. Innovating Waterway Route Planning as a Service for Marine Traffic Applications. IEEE Trans. Intell. Veh. 2024, 1–10. [Google Scholar] [CrossRef]
- Jiang, M.; Wang, B.; Hao, Y.; Chen, S.; Lu, J. Vulnerability assessment of strait/canals in maritime transportation using fuzzy evidential reasoning approach. Risk Anal. 2023, 43, 1795–1810. [Google Scholar] [CrossRef] [PubMed]
- Zhang, X.; Shen, J.; Sun, F.; Wang, S.; Zhang, S.; Chen, J. Allocation of flood drainage rights in watershed using a hybrid FBWM-Grey-TOPSIS method: A case study of the Jiangsu section of the Sunan Canal, China. Int. J. Environ. Res. Public Health 2022, 19, 8180. [Google Scholar] [CrossRef]
- Li, Q.; Zhou, H.; Ma, Q.; Lu, L. Evaluation of Serviceability of Canal Lining Based on AHP–Simple Correlation Function Method–Cloud Model: A Case Study in Henan Province, China. Sustainability 2021, 13, 12314. [Google Scholar] [CrossRef]
- Nakamura, P.; Tsukiyama, H. Analysis by an expert system of initial irrigation canal renovation project planning. Water Resour. Manag. 1992, 6, 223–233. [Google Scholar] [CrossRef]
- Pham, T.Y.; Kim, K.Y.; Yeo, G.T. The Panama Canal expansion and its impact on east–west liner shipping route selection. Sustainability 2018, 10, 4353. [Google Scholar] [CrossRef]
- Niazkar, M. Assessment of artificial intelligence models for calculating optimum properties of lined channels. J. Hydroinform. 2020, 22, 1410–1423. [Google Scholar] [CrossRef]
- Gad, M.A.; Saad, A.; El-Fiky, A.; Khaled, M. Hydrodynamic modeling of sedimentation in the navigation channel of Damietta Harbor in Egypt. Coast. Eng. J. 2013, 55, 1350007-1–1350007-31. [Google Scholar] [CrossRef]
- Coraci, E.; Umgiesser, G.; Zonta, R. Hydrodynamic and sediment transport modelling in the canals of Venice (Italy). Estuar. Coast. Shelf Sci. 2007, 75, 250–260. [Google Scholar] [CrossRef]
- Kamran, M.; Yousaf, W.; Rajapakse, R.L.H.L.; Kareem Awan, W.; Riaz, M.; Asif, N.M.; Umar, M.; Shah, U.T. Innovative initiative for effective operation and monitoring using HEC-RAS modelling of Hakra Branch Canal System, Pakistan. Irrig. Drain. 2021, 70, 490–504. [Google Scholar] [CrossRef]
- Mishra, A.; Anand, A.; Singh, R.; Raghuwanshi, N.S. Hydraulic modeling of Kangsabati main canal for performance assessment. J. Irrig. Drain. Eng. 2001, 127, 27–34. [Google Scholar] [CrossRef]
- Zeng, F.; Jin, S.; Ye, L.; Gu, X.; Guo, J. Analysis of flood conveyance capacity of small-and medium-sized river and flood managements. Nat. Hazards 2023, 116, 447–467. [Google Scholar] [CrossRef]
- Mohammad Rezapour Tabari, M.; Mazak Mari, M. The integrated approach of simulation and optimization in determining the optimum dimensions of canal for seepage control. Water Resour. Manag. 2016, 30, 1271–1292. [Google Scholar] [CrossRef]
- Swamee, P.K.; Mishra, G.C.; Chahar, B.R. Minimum cost design of lined canal sections. Water Resour. Manag. 2000, 14, 1–12. [Google Scholar] [CrossRef]
- Ghazaw, Y.M. Design and analysis of a canal section for minimum water loss. Alex. Eng. J. 2011, 50, 337–344. [Google Scholar] [CrossRef]
- Fan, H.; Gong, X.; Lyu, J. Resilience assessment of strait/canal: A rule-based Bayesian network framework. Transp. Res. Part D Transp. Environ. 2023, 124, 103960. [Google Scholar] [CrossRef]
- Miller, K.; Hyodo, T. Impact of the Panama Canal expansion on Latin American and Caribbean ports: Difference in difference (DID) method. J. Shipp. Trade 2021, 6, 8. [Google Scholar] [CrossRef]
- Shahverdi, K.; Maestre, J.M. Holistic framework for canal modernization: Operation optimization, and economic and environmental analyses. Water Resour. Manag. 2023, 37, 6145–6164. [Google Scholar] [CrossRef]
- Toprak, Z.F. Flow discharge modeling in open canals using a new fuzzy modeling technique (SMRGT). CLEAN–Soil Air Water 2009, 37, 742–752. [Google Scholar] [CrossRef]
- Rezapour Tabari, M.M.; Tavakoli, S.; Mazak Mari, M. Optimal design of concrete canal section for minimizing costs of water loss, lining and earthworks. Water Resour. Manag. 2014, 28, 3019–3034. [Google Scholar] [CrossRef]
- Pagano, A.M.; Light, M.K.; Sánchez, O.V.; Ungo, R.; Tapiero, E. Impact of the Panama Canal expansion on the Panamanian economy. Marit. Policy Manag. 2012, 39, 705–722. [Google Scholar] [CrossRef]
- Yang, G.; Liao, L.; Chang, A. A preliminary study on the role of Pinglu canal in the new land-sea passage in the west. J. Sustain. Urban. Plan. Prog. 2024, 8, 28–34. [Google Scholar]
- Liu, X.; Liu, Y.; Wang, S.; Dong, G. New canal construction and marine emissions strategy: A case of Pinglu. Front. Mar. Sci. 2024, 10, 1303879. [Google Scholar] [CrossRef]
- Tan, K.; Huang, L.; Tan, K.; Kang, Z.; Kwan, K.Y. Metabarcoding analysis of potential HABs in the Maowei Sea, China: A baseline information for the “Pinglu Canal Waterway” mega-waterway project. Estuar. Coast. Shelf Sci. 2024, 301, 108752. [Google Scholar] [CrossRef]
- Cao, Y.; Su, K.; You, Y.; Jiang, X.; Li, C.; Chen, J. Pinglu Canal Construction and Its Impact on Wildlife Habitat Connectivity: A Multi-Species Network Analysis and Ecological Restoration Strategy. Land 2025, 14, 150. [Google Scholar] [CrossRef]
- Xia, M.; Chen, J.; Zhang, P.; Peng, P.; Claramunt, C. Spatial Structure and Vulnerability of Container Shipping Networks: A Case Study in the Beibu Gulf Sea Area. J. Mar. Sci. Eng. 2024, 12, 1307. [Google Scholar] [CrossRef]
- JTS/T 231—2021; Code for Modelling Test for Port and Waterway Engineering. China Communications Press, Ministry of Transport of the People’s Republic of China: Beijing, China, 2021. (In Chinese)
- Teeter, A.M. Vertical Transport in Fine-Grained Suspension and Newly-Deposited Sediment. Estuar. Cohesive Sediment Dyn. 1986, 14, 170–191. [Google Scholar]
- Parchure, T.M.; Mehta, A.J. Erosion of soft cohesive sediment deposits. J. Hydraul. Eng. 1985, 111, 1308–1326. [Google Scholar] [CrossRef]
- Seyed Hoshiyar, S.M.; Pirmoradian, N.; Ashrafzadeh, A.; Parvaresh Rizi, A. Performance assessment of a water delivery canal to improve agricultural water distribution. Water Resour. Manag. 2021, 35, 2487–2501. [Google Scholar] [CrossRef]
- Huijts, K.M.; de Swart, H.E.; Schramkowski, G.P.; Schuttelaars, H.M. Transverse structure of tidal and residual flow and sediment concentration in estuaries: Sensitivity to tidal forcing and water depth. Ocean Dyn. 2011, 61, 1067–1091. [Google Scholar] [CrossRef][Green Version]
- Van Maren, D.S.; van Kessel, T.; Cronin, K.; Sittoni, L. The impact of channel deepening and dredging on estuarine sediment concentration. Cont. Shelf Res. 2015, 95, 1–14. [Google Scholar] [CrossRef]
- Zhang, N.; Bao, Z.; Zhang, L.; Gao, Y.; Xiao, Y.; Cheng, J.; Han, Z. Study on the Influence and Countermeasures of the Canal Projects on Aquatic Ecological Environment of Rivers along the Line. E3S Web Conf. 2023, 393, 01038. [Google Scholar] [CrossRef]
- Cheng, Y.; Liu, J.; Xu, H.; Zhu, G. Impacts of Pinglu Canal Construction and Its Ecological Route Selection on Landscape Pattern and Suggestions on Environmental Protection. In Advances in Transdisciplinary Engineering, Proceedings of the 3rd International Conference on Green Energy, Environment and Sustainable Development (GEESD2022), Beijing, China, 29 June 2022; IOS Press: Amsterdam, The Netherlands, 2022; pp. 616–627. [Google Scholar]
- Wells, D.M.; Mertes, J.D.; Allen, B.L.; Click, A.N. Procedure for selecting a minimal environmental impact routing for a water conveyance canal. J. Am. Water Resour. Assoc. 1975, 11, 714–733. [Google Scholar] [CrossRef]
Disclaimer/Publisher’s Note: The statements, opinions and data contained in all publications are solely those of the individual author(s) and contributor(s) and not of MDPI and/or the editor(s). MDPI and/or the editor(s) disclaim responsibility for any injury to people or property resulting from any ideas, methods, instructions or products referred to in the content. |
© 2025 by the authors. Licensee MDPI, Basel, Switzerland. This article is an open access article distributed under the terms and conditions of the Creative Commons Attribution (CC BY) license (https://creativecommons.org/licenses/by/4.0/).