1. Introduction
River basins worldwide are intricate systems where population dynamics, resource use, economic development, and environmental resilience interact in complex and often unpredictable ways [
1]. Understanding these systems remains a persistent academic challenge, primarily due to the “black box” characterization. Within this framework, the causal relationships between key inputs, such as population growth and resource exploitation, and observable outputs, including economic benefits and environmental consequences, lack full transparency. The concept of resource–environment carrying capacity (RECC) offers a critical framework for revealing these dynamics. By assessing the limits of resource and environmental systems to sustain development without breaching ecological thresholds, RECC provides insights into balancing competing demands. Historical examples, such as the Mississippi River Basin in the United States and the Rhine River Basin in Europe, highlight the consequences of exceeding these thresholds, including pollution, resource depletion, and ecosystem degradation driven by industrialization and urbanization [
2,
3]. These cases underscore the importance of applying RECC to guide the sustainable development of river basins, particularly in regions undergoing rapid socioeconomic transformation.
In China, decades of rapid urbanization and economic growth have transformed the nation’s landscape, presenting both opportunities and challenges. Urban expansion has driven remarkable improvements in living standards and infrastructure but has also caused severe resource depletion and environmental degradation [
4]. Rising demands for water, energy, and land have stretched the country’s natural resources, while pollution and habitat destruction have escalated [
5]. These dynamics exemplify the importance of adopting an RECC framework to balance economic development and ecological sustainability. Among China’s major river basins, the Yellow River Basin (YRB) stands out as a vital socioeconomic region, representing a microcosm of the broader tensions between human development and environmental resilience [
6]. However, the YRB faces acute challenges, including water scarcity, environmental degradation, and uneven economic growth, which are emblematic of broader global issues [
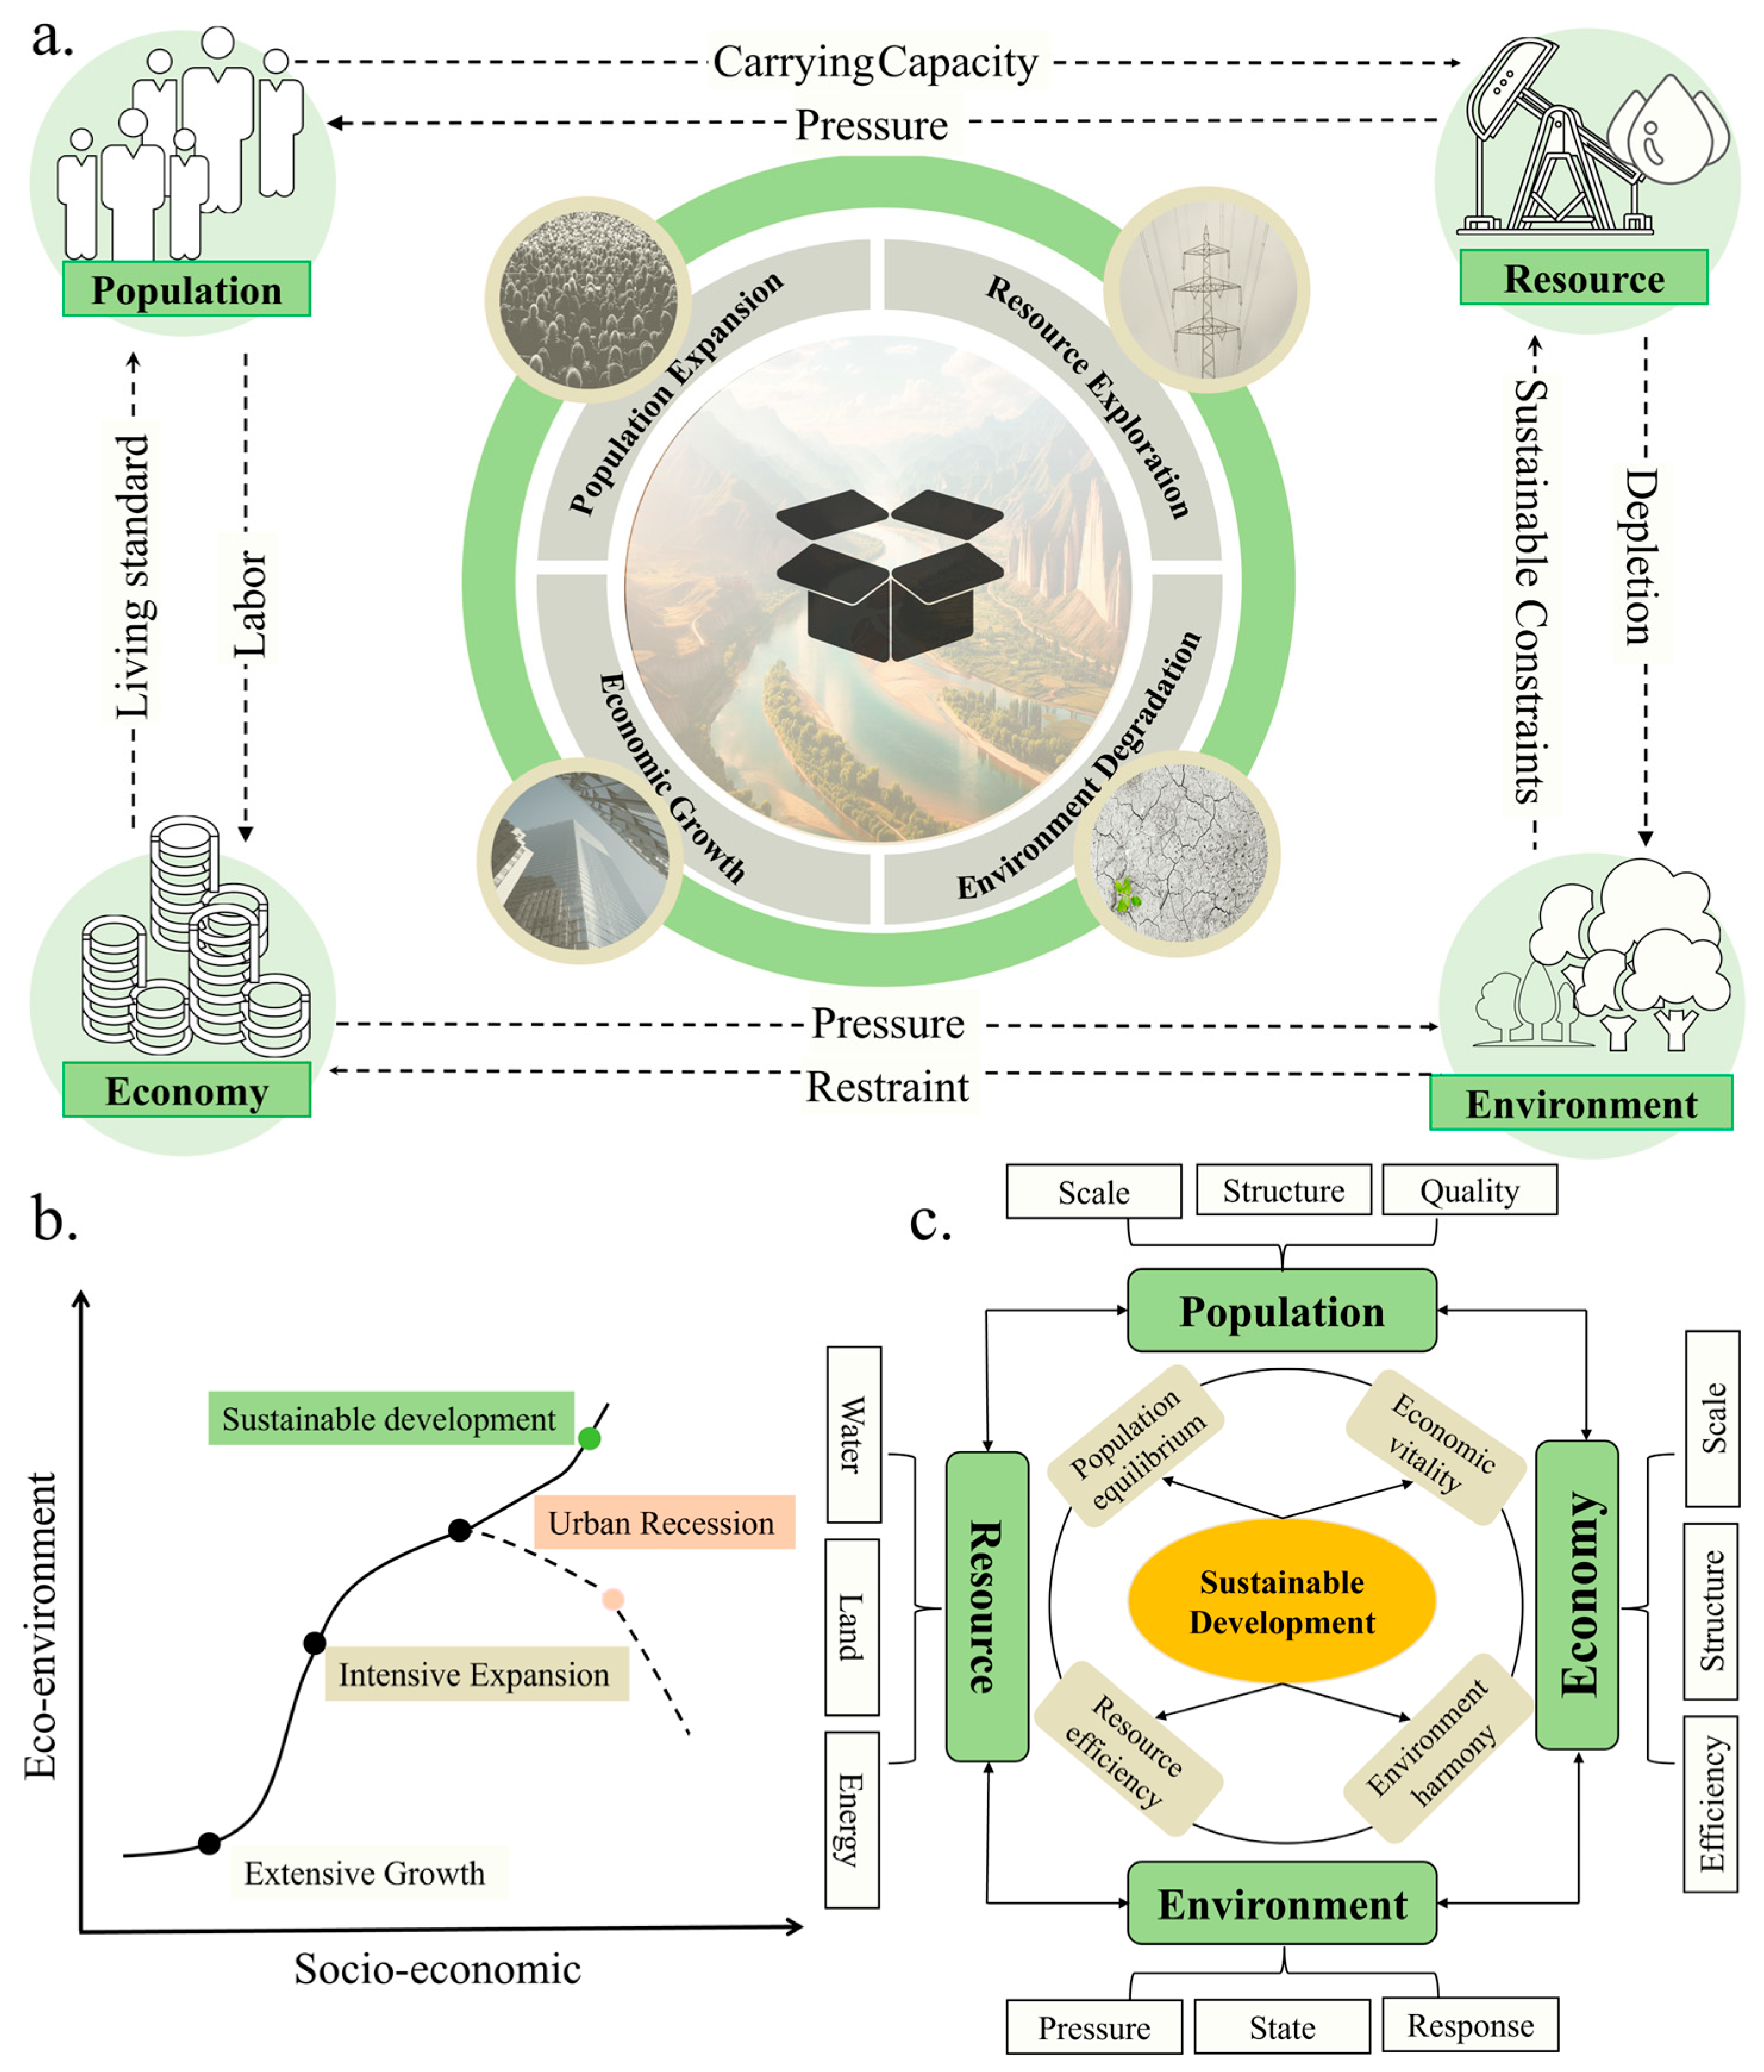
7]. As depicted in
Figure 1a, the YRB operates as a complex and often fragile system, making it an essential area for studying the application of RECC to promote sustainable development [
8].
Resource environment carrying capacity in river basins depends on transitioning from extensive growth to balanced development (
Figure 1b). The study of resource environmental carrying capacity focuses on sustainable development as the core. Achieving this goal requires a careful balance between population growth, resource use, environmental stability, and economic development. These aspects work together to create a framework for understanding urban challenges and finding ways to improve resilience and support long-term sustainability. Related RECC studies have emphasized the pressure from human activities and the responses of resources and the environment, which include various aspects, such as environment quality and resource efficiency [
9].
Recent studies on RECC have increasingly focused on specific resources, such as water, energy, and land [
10,
11,
12]. However, comprehensive evaluations remain crucial, as they integrate resource interactions and support sustainable development. The urban system consists of the population, resources, environment, and economy. Therefore, the theoretical framework of resource and environment carrying capacity is built based on the urban system definition. Population expansion can drive economic development by contributing to labor supply while also affecting environmental quality and placing additional pressure on resource extraction [
13,
14,
15]. Resource availability supports population growth by determining carrying capacity while also influencing environmental sustainability through resource depletion and driving economic productivity as a key input for production [
16,
17,
18]. Environmental conditions impact population health, while also imposing sustainability constraints on resource use and increasing pressure on economic activities [
19,
20]. Economic growth can elevate living standards for the population while simultaneously driving higher resource demand and imposing further constraints on environmental resilience [
21,
22]. While RECC evaluation methods are well established, the interacting mechanisms and influencing factors are still largely unexplored. Two critical research gaps remain. First, most studies analyze populations, resources, and economic subsystems in isolation, neglecting their bidirectional interactions, particularly how economic activities simultaneously alter and depend on environmental carrying capacity. Numerous factors influence RECC, and there is insufficient systematic categorization and analysis of their combined impacts.
This study focuses on the Yellow River Basin as a case study of the urban sustainable complex system. As illustrated in
Figure 1c, the region faces significant challenges that impose considerable strain on its RECC evaluation system. Demographic changes, resource utilization, and environmental health are intricately interwoven with economic activities, resulting in a complex network of interactions. To effectively manage these interactions, it is essential to explore the RECC in the YRB, which is critical for ensuring long-term sustainability. Through a detailed analysis of these coupling relationships, this study aimed to identify the critical factors that facilitate a more balanced, resilient, and sustainable development trajectory for the region.
This research has two possible contributions. First, it constructs an RECC index system, providing a systematic framework to evaluate sustainable development in the Yellow River Basin. Second, it comprehensively analyzes the internal and external mechanisms driving coupling coordination and offers insights into sustainability dynamics. It distinguishes this research from prior studies and supports informed policymaking for the region’s sustainable growth. To achieve these objectives, we applied a combination of advanced statistical models, including the Panel Vector Autoregression (PVAR) model to capture the internal interactions among population, resources, environment, and economy over time; the random forest regression model to identify the key drivers of coupling coordination; and the Geographically Temporally Weighted Regression (GTWR) model to explore spatiotemporal variations in the contributing elements. By integrating these methodologies, this study provides a comprehensive approach to understanding sustainability challenges in the YRB, equipping policymakers with data-driven insights to promote sustainable and coordinated development.
2. Study Area and Method
2.1. Study Area
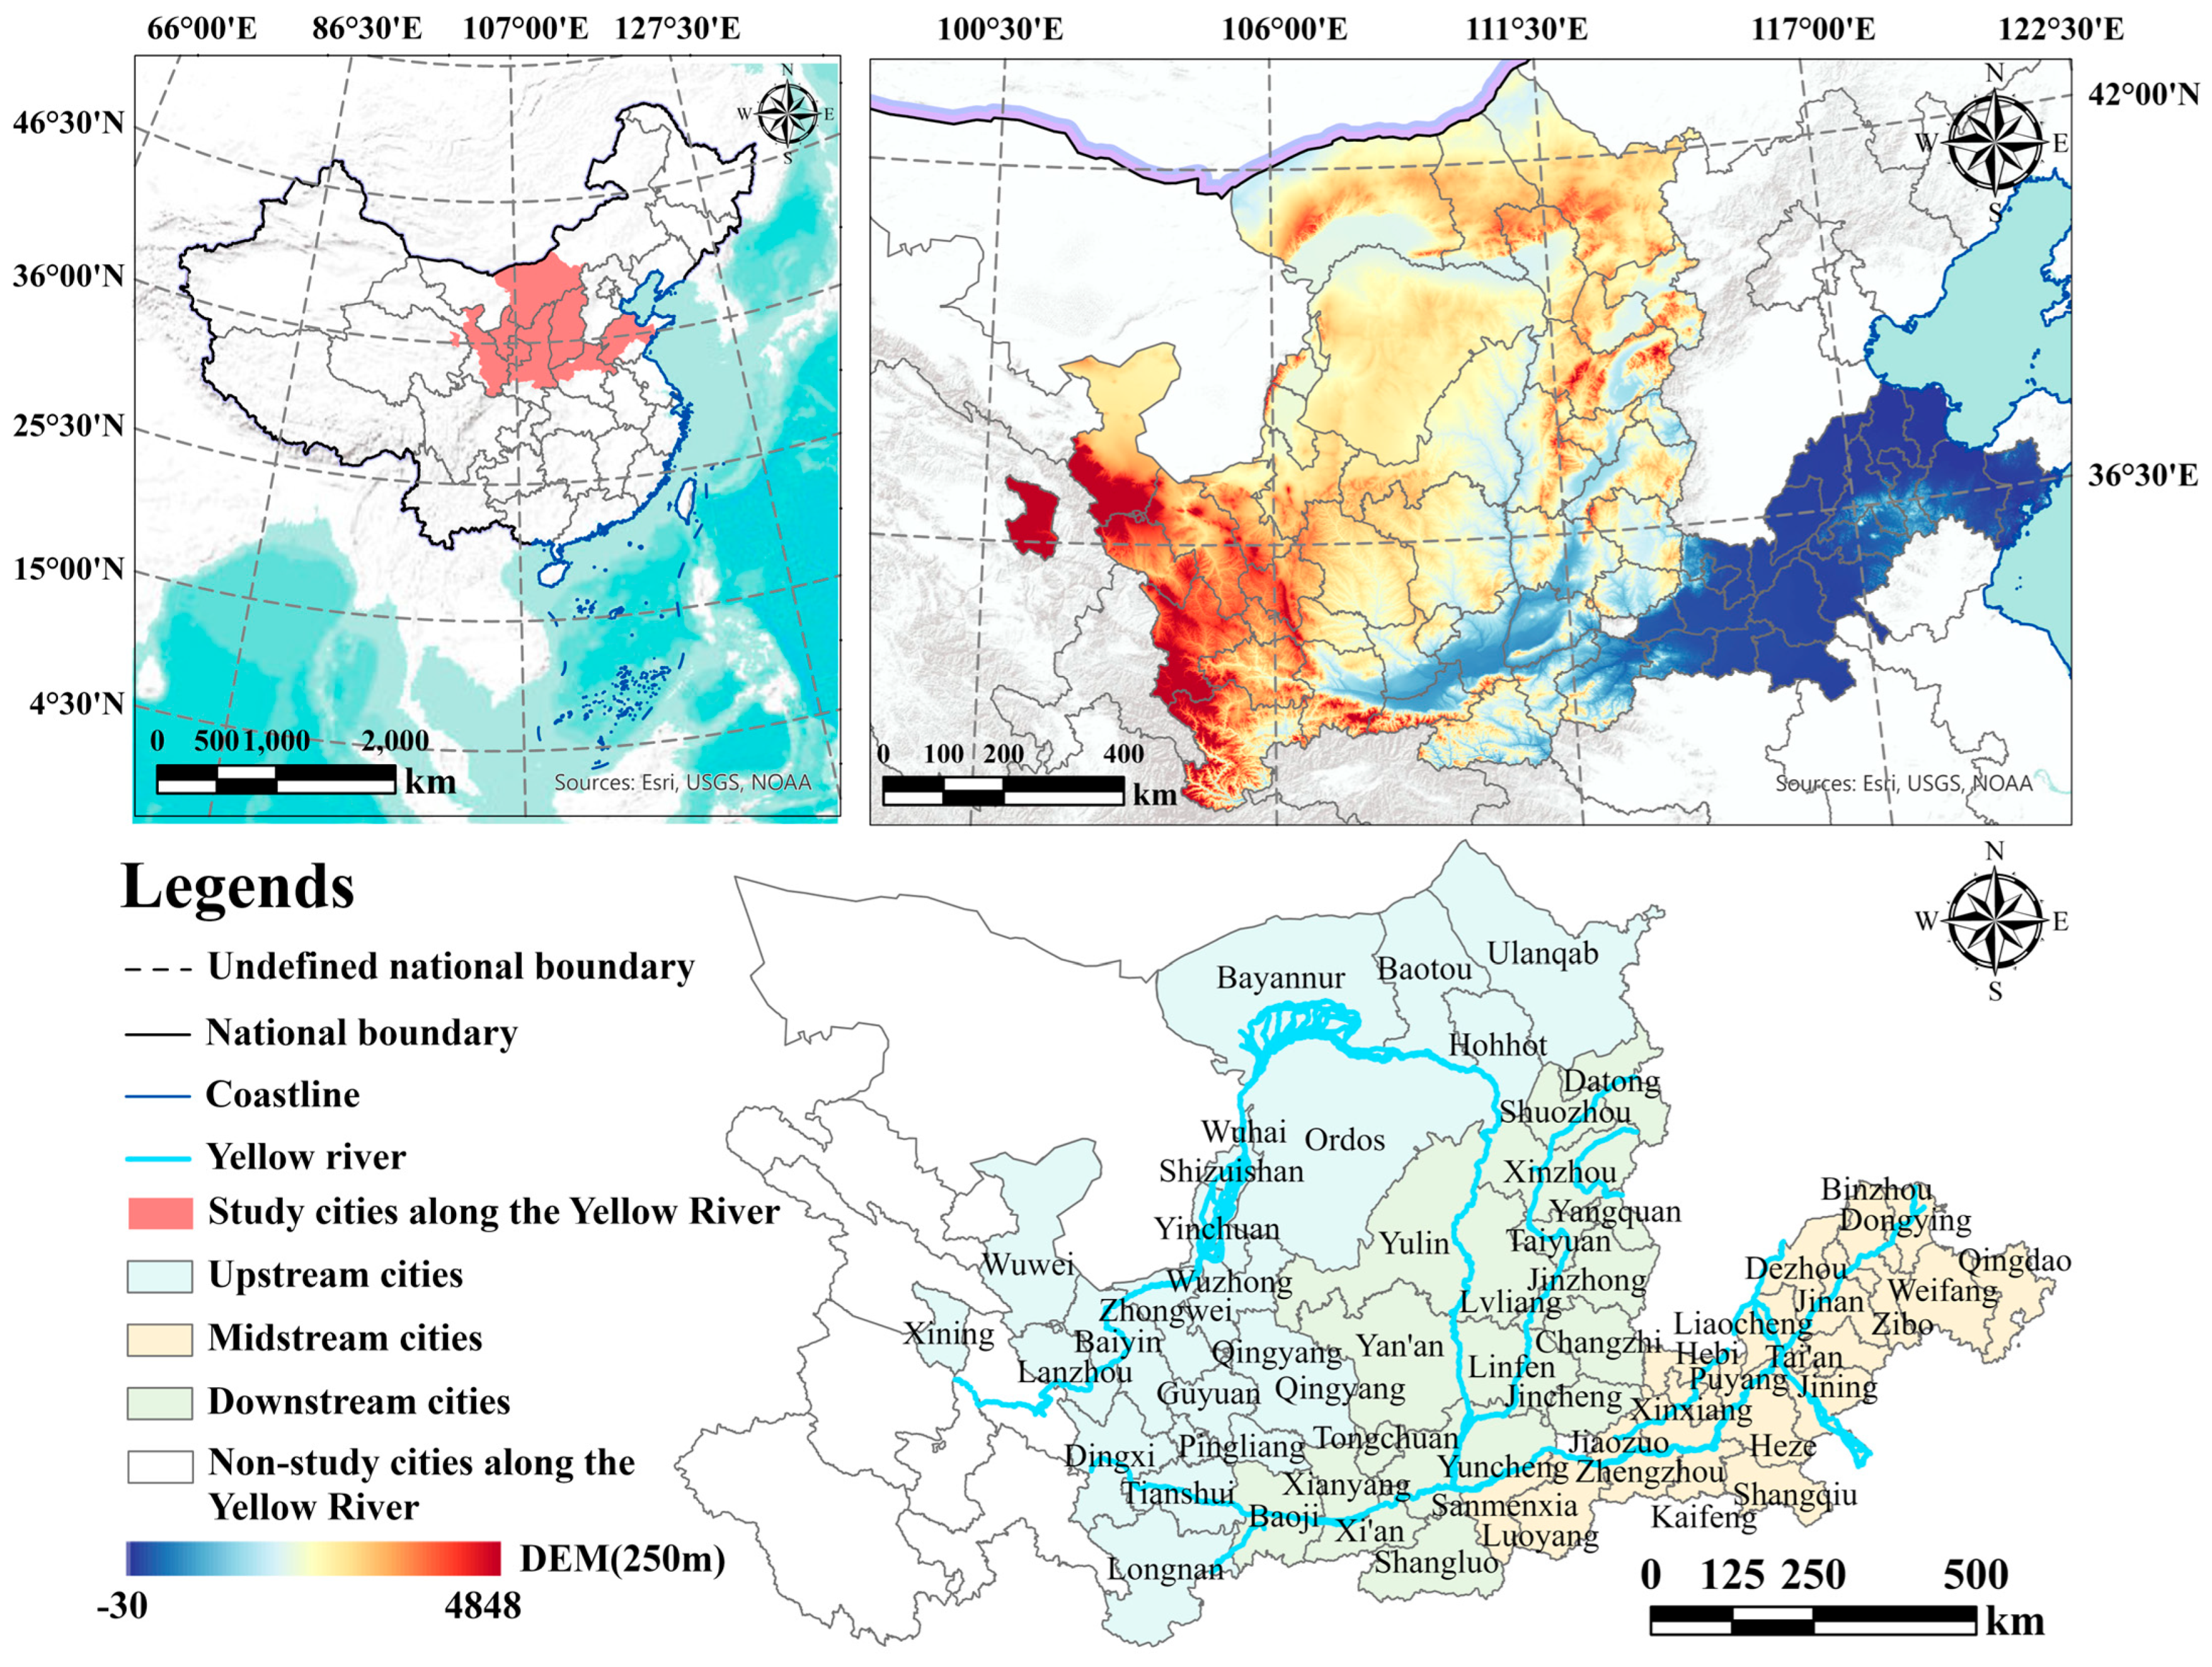
The Yellow River Basin (YRB), situated in northern China, covers an extensive area of around 795,000 square kilometers spanning nine provinces, including Qinghai, Sichuan, Gansu, Ningxia, Inner Mongolia, Shanxi, Shaanxi, Henan, and Shandong (
Figure 2). It is the second-longest river in China at 5464 km and is often referred to as the “Mother River” due to its historical and cultural significance. The basin’s topography is varied, consisting of mountains, plateaus, and floodplains, creating distinct environmental zones. Climate conditions in the YRB range from semi-arid to arid, and the middle and lower reaches, particularly the Loess Plateau, suffer from frequent soil erosion. The region is prone to both flooding and drought, exacerbated by climate change and intensive water usage.
The YRB supports a population of over 150 million people, making it a vital region for China’s socioeconomic development. Recent decades have seen rapid urbanization, particularly in provinces like Shandong and Shaanxi, increasing the demand for water, land, and energy. This urban growth, coupled with expanding industrial activities, has put considerable pressure on the basin’s resources. Key economic sectors in the region include agriculture, energy production, and manufacturing. The fertile lands of the lower basin support extensive agricultural activities, but water scarcity and land degradation increasingly threaten agricultural output. Meanwhile, the basin’s rich deposits of coal and minerals have fueled China’s energy and industrial needs, though these activities have significantly contributed to environmental pollution, including severe water and air quality issues.
In response to the basin’s ecological and economic challenges, the Chinese government has positioned the YRB as a critical area in its national development strategy. The Yellow River Basin Ecological Protection and High-Quality Development Plan, launched in 2019, emphasizes the need to address environmental degradation while promoting sustainable economic growth. The plan seeks to enhance water conservation, control pollution, and restore ecosystems, aligning with China’s broader goals of poverty alleviation and regional economic balance. By promoting renewable energy and green industries, the government aims to mitigate the environmental costs of development in the YRB.
2.2. Methods
2.2.1. Entropy–TOPSIS Model
The Entropy–TOPSIS method is a comprehensive evaluation approach that integrates the entropy weighting method with the TOPSIS technique, commonly applied in multi-dimensional decision analysis. It is frequently applied to evaluate the economic, social, and environmental development levels across multiple regions, providing policymakers with objective decision-making support [
23].
2.2.2. Coupling Coordination Degree
The coupling coordination degree model is widely applied to evaluate the coordination status of multidimensional systems, with extensive applications in fields such as regional development, resource management, and environmental protection.
where
C represents the coupling degree of the RECC system,
P represents the population subsystem,
R represents the resource subsystem,
E1 represents the environment subsystem, and
E2 represents the economy subsystem.
T represents the integrated index of RECC systems. Four subsystems are equally important in this research, so the coefficients of each subsystem are set as equal.
D is the coupling coordination degree of the RECC system [
24].
2.2.3. Standard Deviational Ellipse
The standard deviation ellipse could examine the spatial evolution tendency. This analysis typically involves examining the center of gravity, ellipse area, and standard deviations along the major and minor axes to identify the distribution’s center, primary directional trend, and spatial evolution patterns of the RECC [
25].
2.2.4. PVAR Model
The RECC system’s complicated dynamic relationships and interaction effects were investigated using the PVAR model. Unlike simple mixed estimation models, which may suffer from serial correlation and endogeneity, the PVAR model accommodates endogenous variables and incorporates lagged terms to analyze dynamic influences. Additionally, it accounts for both individual and time effects, offering a more accurate depiction of the dynamic interactions among the variables. It has been applied in research on internal coordination among subsystems to examine the interactions and temporal dynamics within complex systems [
26,
27].
where
is a column vector of order 1 × 4 containing RECC subsystems,
i represents the city and
t represents the year,
represents the intercept constant coefficient vector,
represents the parameter matrix with a lag of
j orders,
is a fixed effect of time,
is an individual fixed effect, and
is a random perturbation term.
2.2.5. Random Forest Regression Model
The random forest model is a machine learning method that includes multiple decision tree classifiers [
28]. The random forest algorithm can measure the importance of variables and quantitatively explain the variable effects of variables.
2.2.6. Geographically Temporally Weighted Regression
The GTWR model enhances by incorporating temporal elements, overcoming the GWR model’s limitation of lacking a time dimension. This enhancement allows the GTWR model to account for spatiotemporal variations simultaneously, making it particularly effective for analyzing spatial and temporal disparities across different factors.
is the observed value, represents the spatiotemporal coordinates of the i observation point (i = 1, 2,…, n), where , and are the latitude, longitude, and time series of the i observation point. represents the intercept term; is the regression coefficient of the k independent variable of the i observation point, demonstrating the weight at the spatiotemporal coordinates. represents the value of the k independent variable at point i, and represents the residuals.
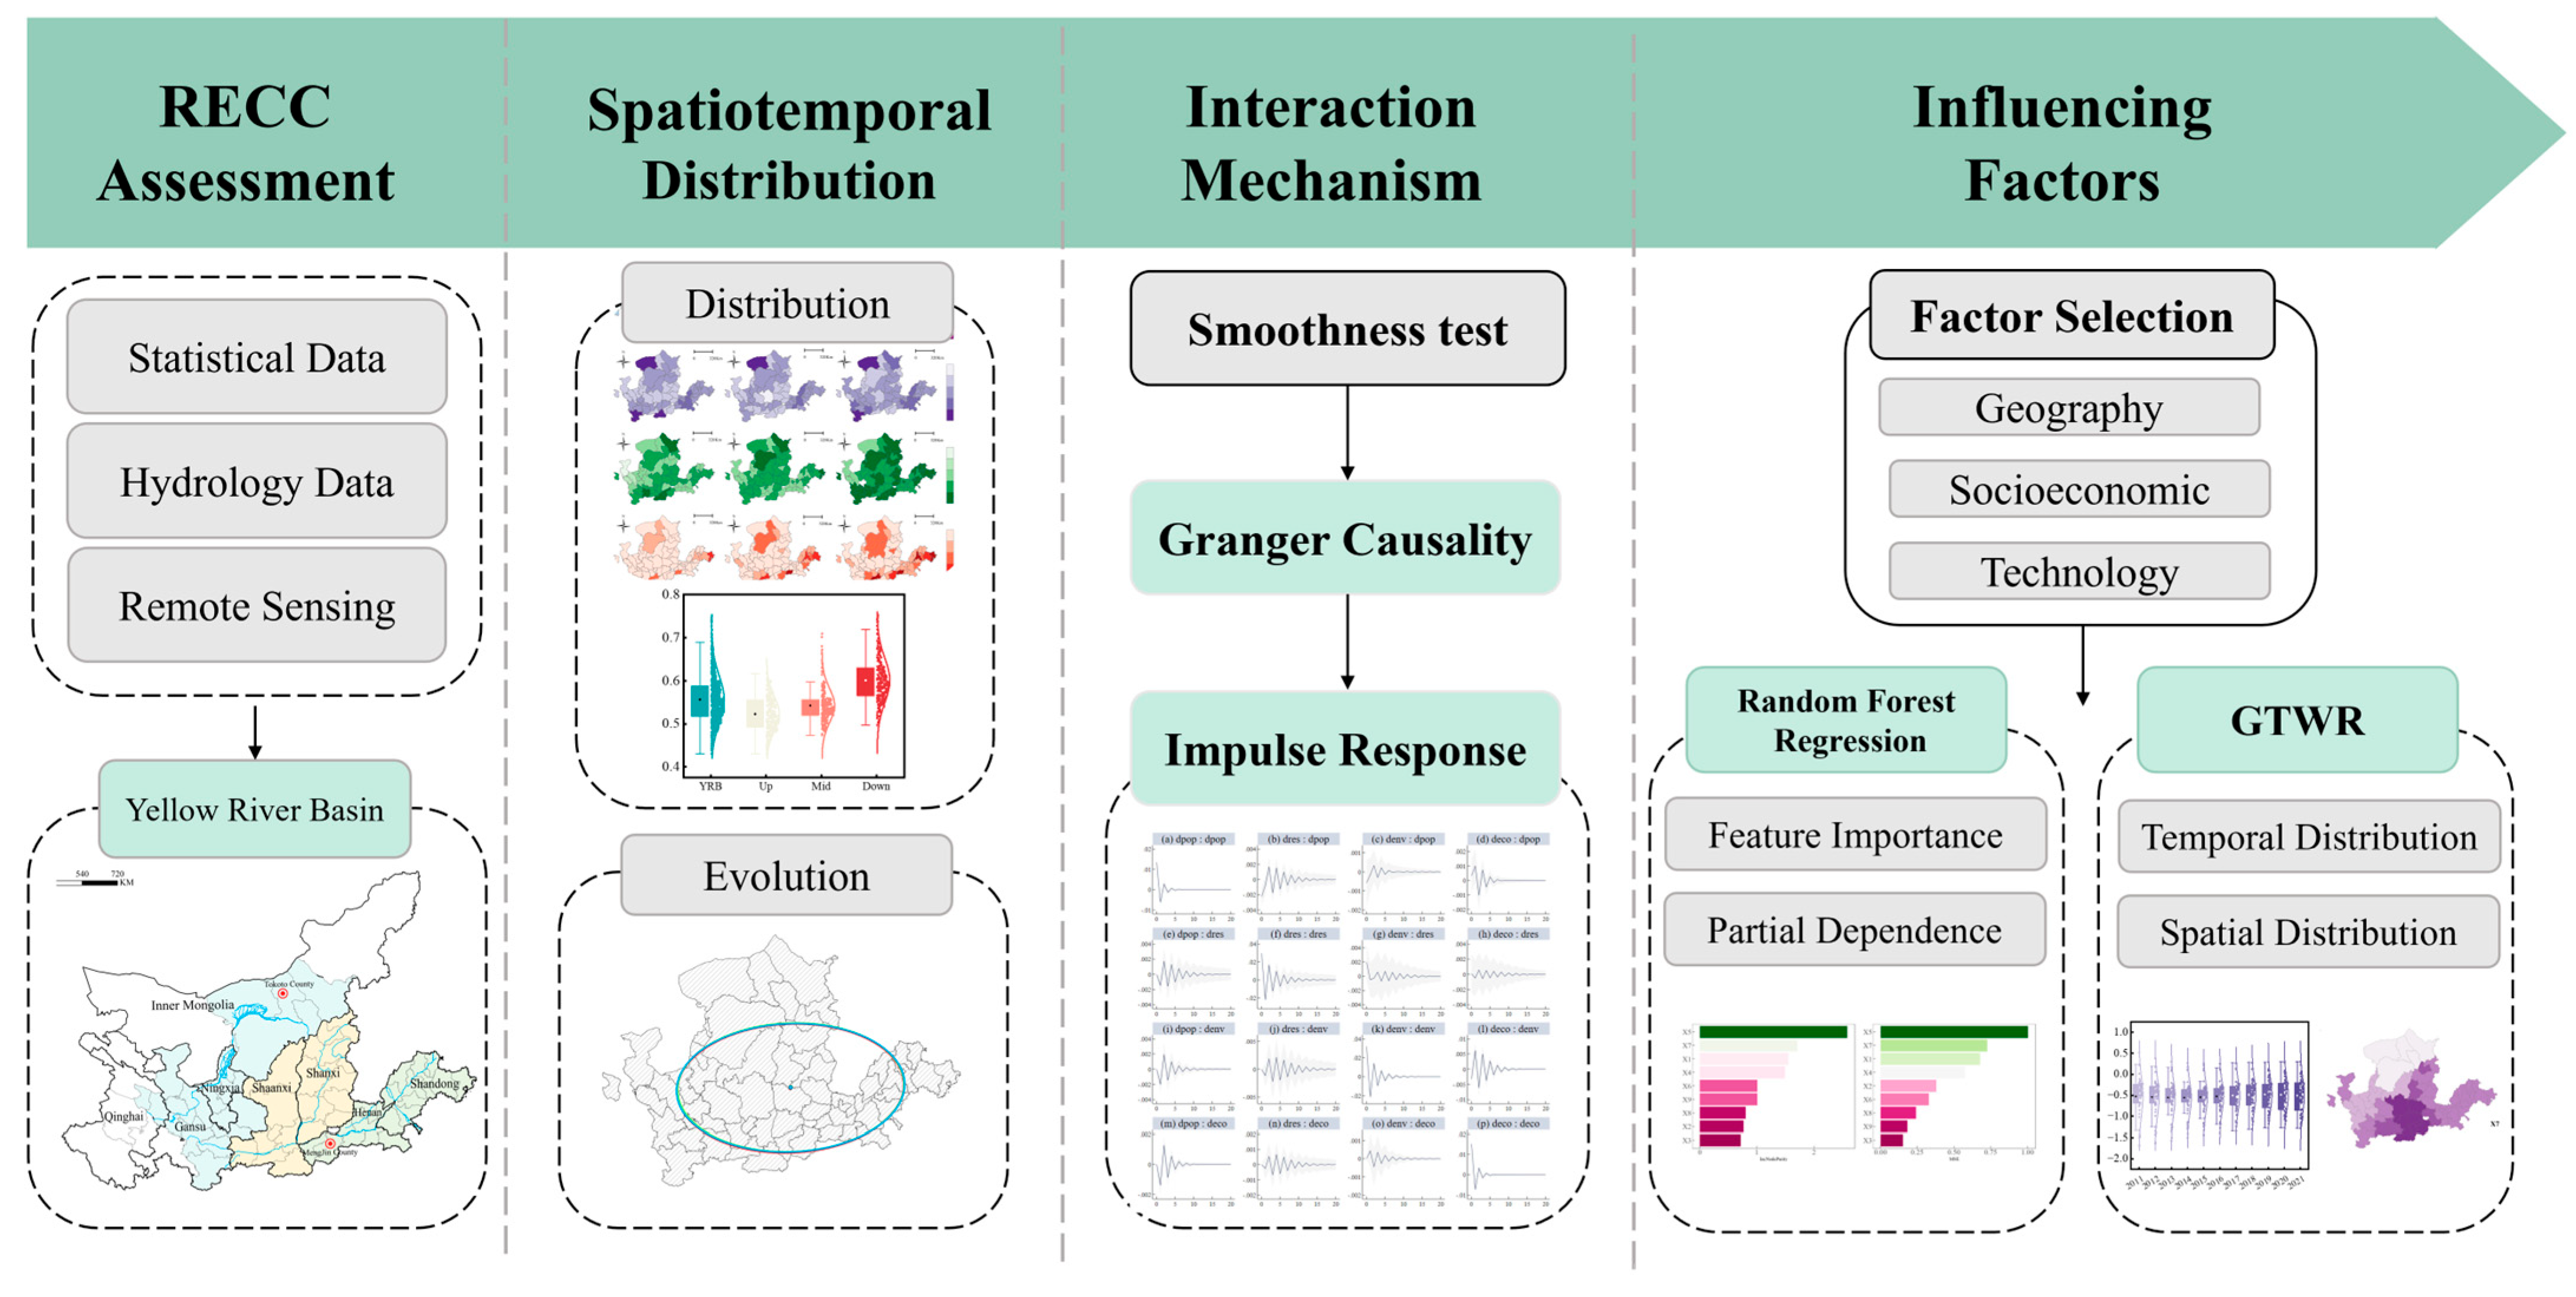
Figure 3 illustrates the research roadmap for this study. Initially, the RECC is assessed using statistical, hydrological, and remote sensing data. Next, the spatiotemporal distribution and evolution trends are analyzed to reveal development patterns. Following this, the interaction mechanisms among subsystems are examined. Finally, regression analysis begins with random forest regression to rank variable importance and identify partial dependencies based on geographical, socioeconomic, and technological factors. The GTWR model is then applied to analyze the spatiotemporal evolution of the coefficients for the selected influencing factors.
2.3. Index Construction
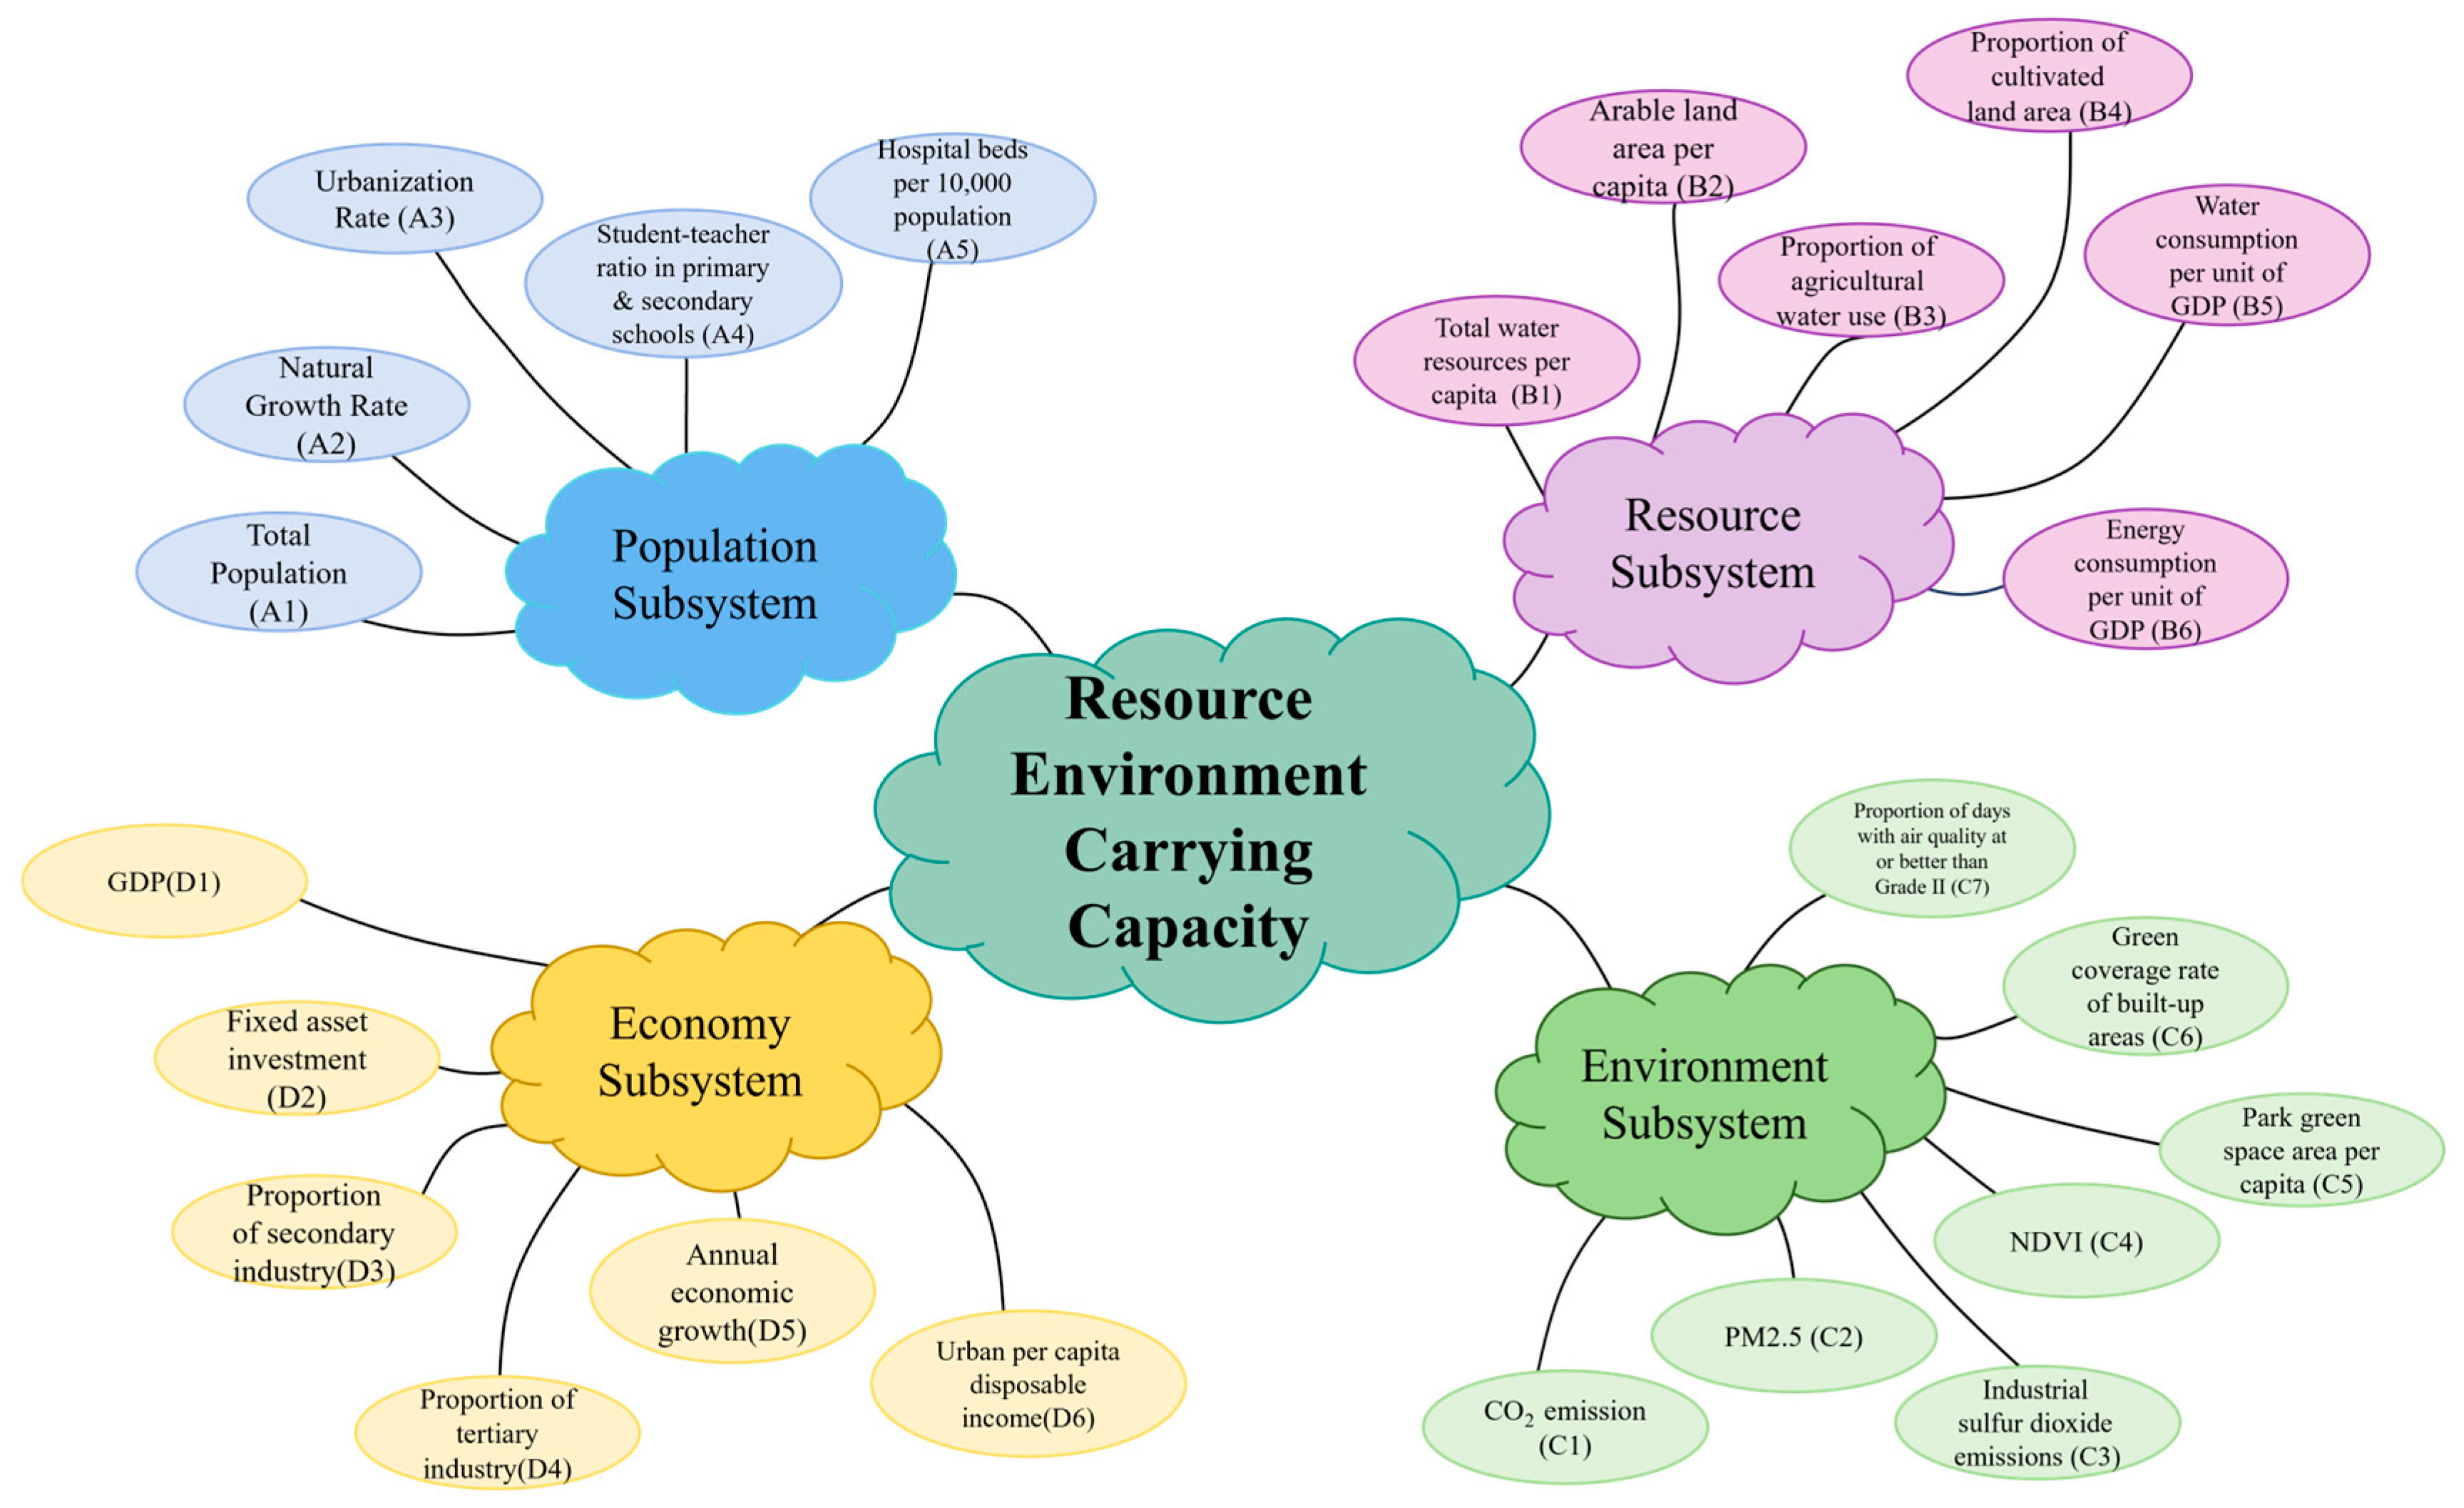
The assessment of RECC should evaluate the dynamic balance ability among population growth, resource usage, environmental quality, and economic development in the YRB. Therefore, it is essential to focus on the dimensions of resource supply limit, environmental capacity thresholds, dependence on resources for economic efficiency, and population pressure on the system. Combined with the related literature, a comprehensive index system is developed to assess the RECC (
Figure 4) [
29,
30].
The population system assesses the demand pressure on resources stemming from population scale, demographic structure, and public service provisions, quantifying the direct burden imposed by human activities on the resource–environment carrying capacity. Indicators of population size, growth, and urbanization directly measure the region’s demand for resources, while indicators of public services and education quality suggest potential efficiency gains in future resource allocation [
24].
The resource system evaluates the supply capacity and utilization efficiency of critical natural assets (e.g., water and land resources), reflecting their capacity to sustain population growth and economic development within ecological boundaries. Measures of per capita water and land availability, along with consumption efficiency figures, describe the natural resource base and its ability to support ongoing economic and social activity [
31].
The environment system quantifies pollution levels, ecological integrity, and assimilate capacity, determining the maximum permissible thresholds of pollutant discharge that the ecosystem can absorb without degradation. Data on pollutant emissions and ecological health—such as NDVI and urban green space—serve as indicators of the ecosystem’s strength and its ability to absorb environmental stress [
32].
The economic system examines the resource dependency of economic growth, the rationality of industrial structure, and the sustainability of production-consumption patterns in balancing development with environmental constraints. Indicators including GDP, fixed asset investment, industrial composition, and per capita income together reflect how economic activity influences resource use and environmental impact [
33].
In terms of influencing factors, selection, geography, socioeconomic, and technological innovation categories were considered [
34]. Slope (X1), elevation (X2), and precipitation (X3) were selected as geographical factors due to their potential influence on economic growth, population distribution, and ecological conditions [
35,
36]. Population density (X4), economic developmeny level (X5), trade level (X6), and consumption level (X7) were selected as socioeconomic factors because they significantly impact regional development dynamics. These variables affect resource allocation, economic activity, and demographic patterns, all of which play a vital role in the development of RECC [
37,
38,
39]. Industrial upgrading (X8) and green innovation level (X9) were included as indicators of technological innovation to assess how advancements in technology influence the RECC [
40].
2.4. Data Sources
This study spans the years 2011 to 2021 and focuses on 60 cities in the YRB. Due to limited data availability. Statistical information was primarily drawn from the China City Statistical Yearbook and China Urban–Rural Construction Statistical Yearbook, while water-related data came from the annual Water Resource Bulletins of each province. NDVI data were sourced from NASA’s MOD13A3 datasets, and PM2.5 data were obtained from the Atmospheric Composition Analysis Group at Washington University in St. Louis. Missing data points were supplemented using interpolation techniques or filled with information from provincial statistical yearbooks.
3. Results
3.1. Spatiotemporal Distribution of RECC
Figure 5 and
Figure 6 present the spatiotemporal patterns of the resource and environmental carrying capacity (RECC) and its subsystems across the Yellow River Basin (YRB) from 2011 to 2021.
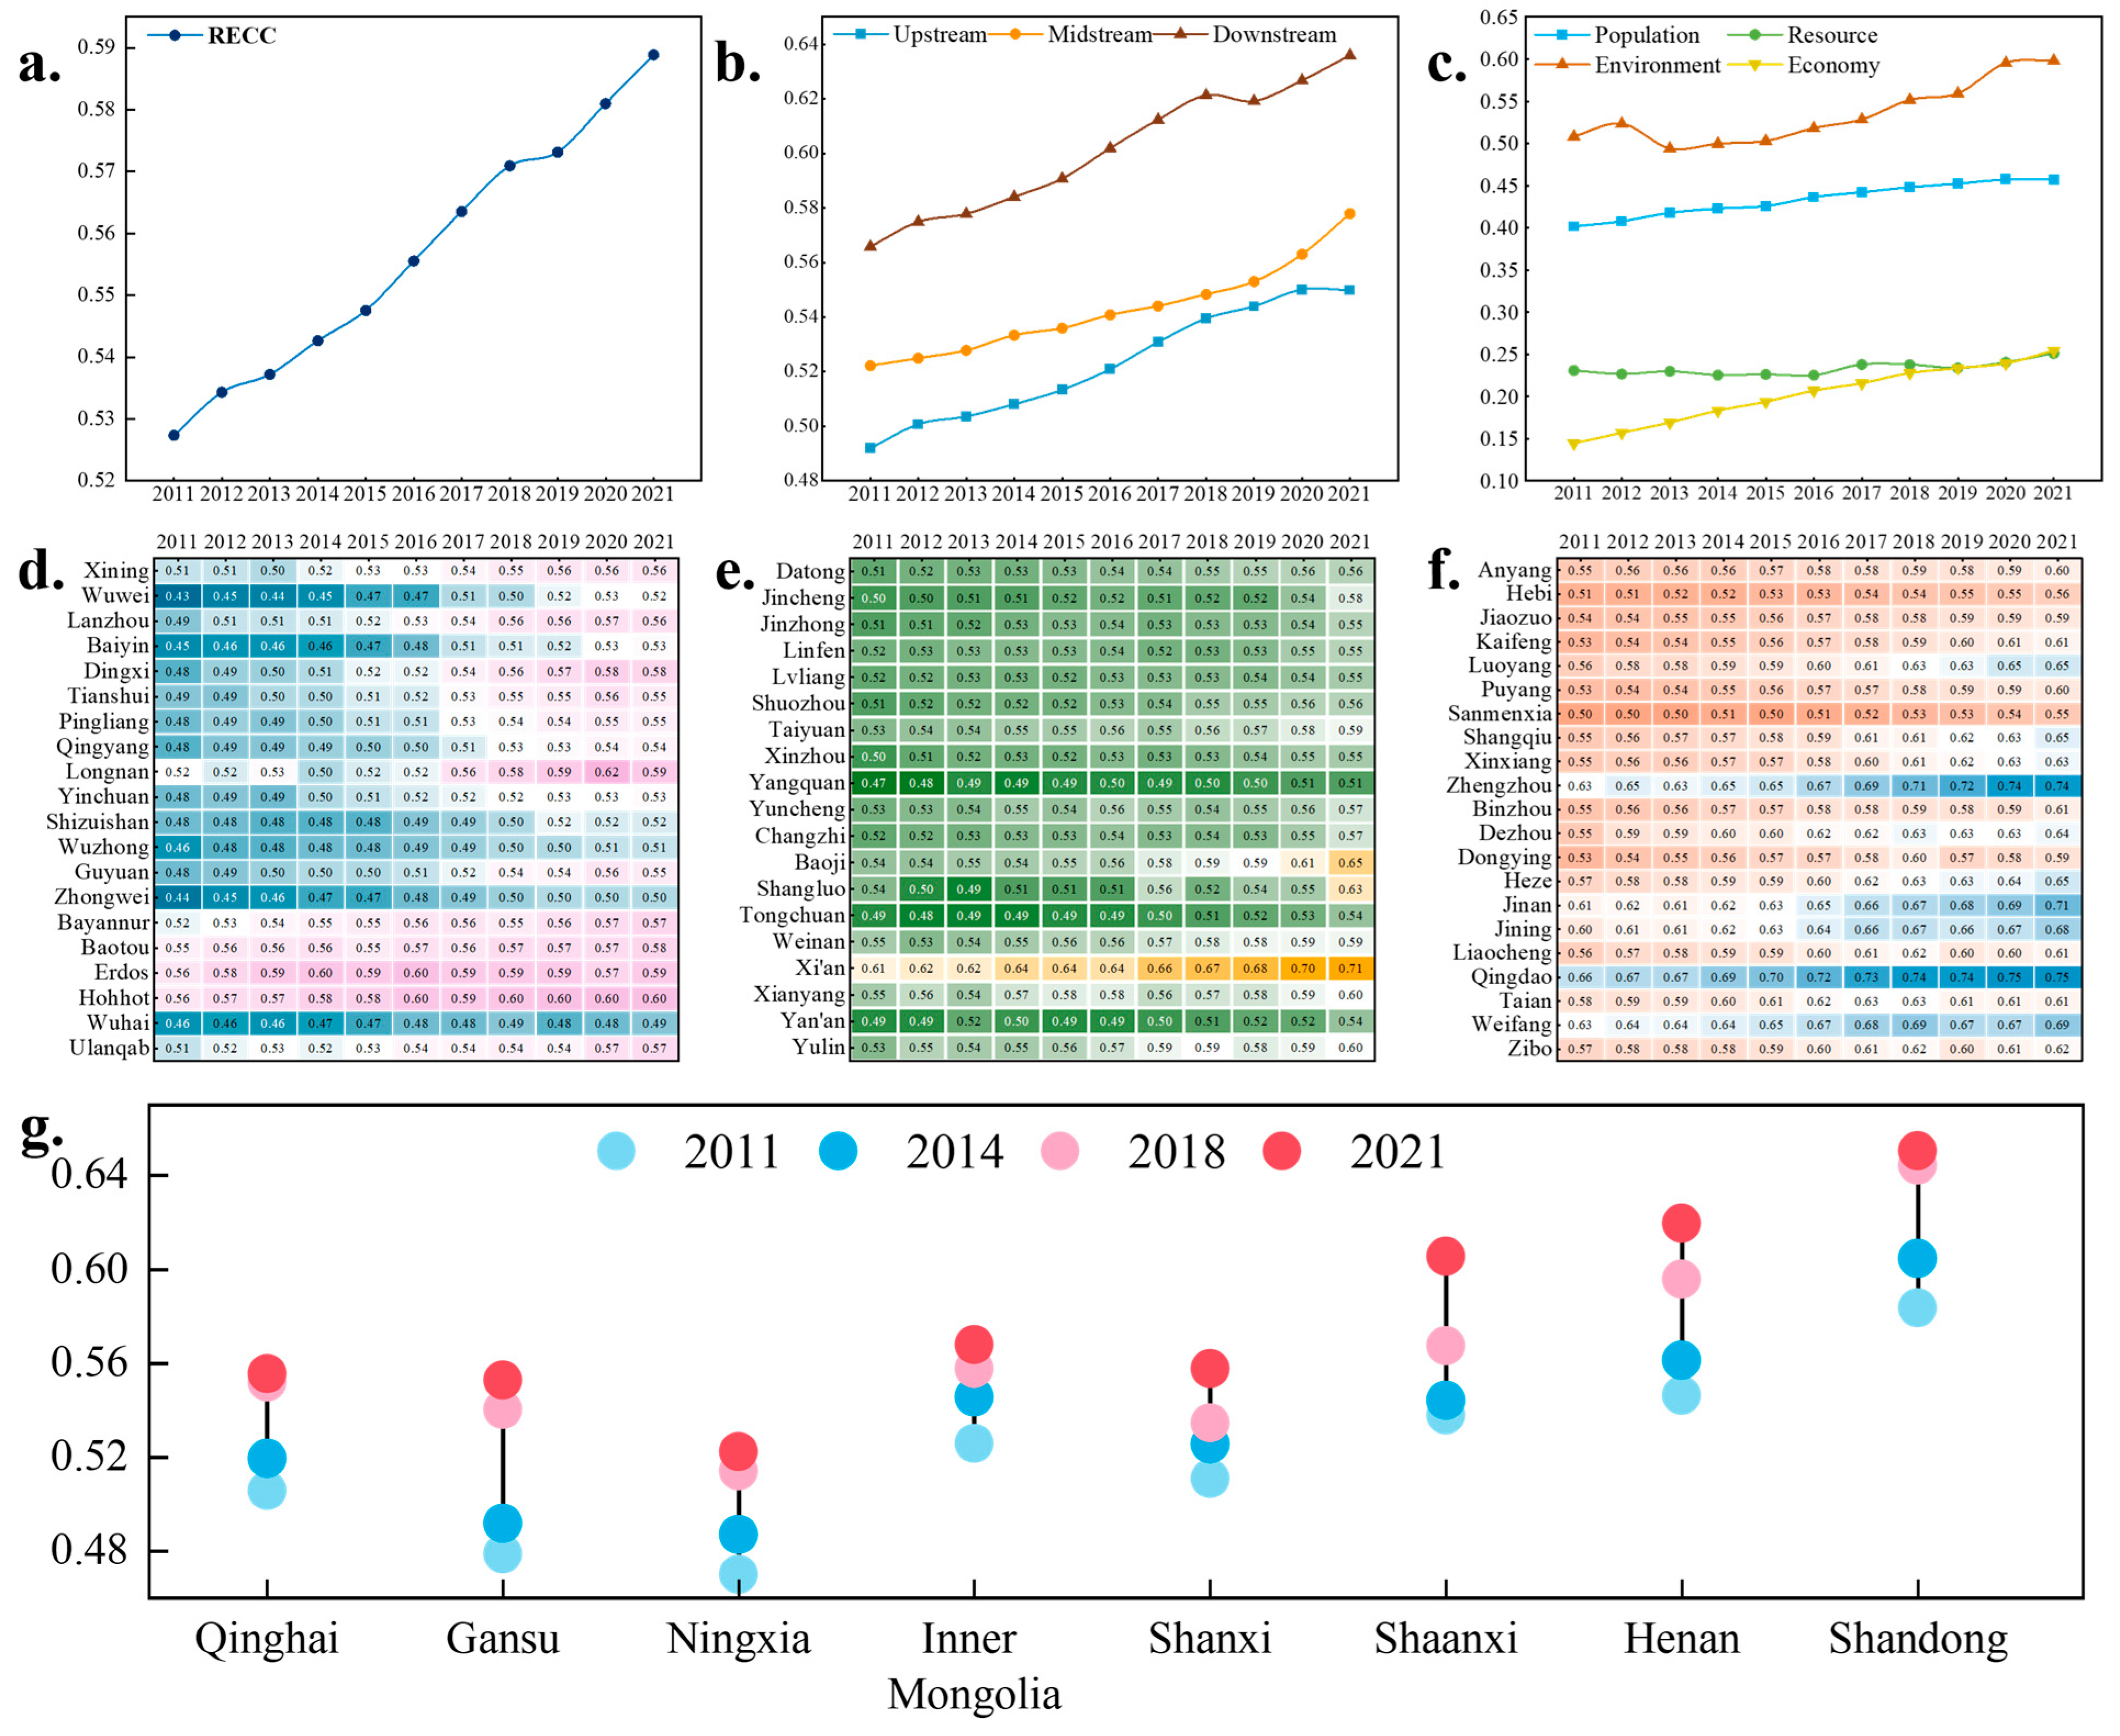
Figure 5 illustrates the temporal evolution of RECC. As shown in
Figure 5a, the composite RECC index increased from 0.53 to 0.58 during the research period, reflecting a 9.4% overall enhancement in carrying capacity. Significant spatial disparities emerged across the basin. Downstream regions consistently exhibited the highest RECC levels, followed by closely clustered midstream and upstream areas. Subsystem analysis (
Figure 5c) revealed diverging paths; the environmental subsystem maintained dominance, with values exceeding 0.70 throughout the study period, whereas both the resource availability and economic productivity subsystems demonstrated gradual growth.
The heatmaps illustrate the temporal distribution of each city within the basin, categorized by their stream position. As shown in
Figure 5d, cities located in the upstream region mostly exhibit an upward trend. In contrast, cities in the midstream region display a more fluctuating pattern, with several cities experiencing an initial increase, followed by a decline, and then another rise toward the end (
Figure 5e). This fluctuation may be attributed to policy adjustments affecting resource-based cities in the midstream region. Meanwhile, cities in the downstream region generally show favorable performance, with values consistently exceeding 0.6, likely due to the advantages of advanced infrastructure and a well-developed economy (
Figure 5f).
The temporal distribution of RECC performance is illustrated in
Figure 5g. In terms of developmental status, Shandong Province demonstrated superior performance, with consistent leadership across the evaluation period, while Ningxia trailed behind all other seven provincial units in the comparative assessment. Regarding development momentum, Gansu and Shaanxi provinces exhibited the most accelerated growth pathway, in marked contrast to Inner Mongolia, which showed the least progressive development pace throughout the observation period.
Figure 6 displays the geographical distribution of RECC and subsystems in the YRB. As can be observed from the graph, cities with high RECC values mainly clustered in the downstream region, and the cities with low values mostly gathered in the upstream region. The development of the population showed a similar trend, and cities with high values were mostly provincial capital cities, which encompassed a large proportion of the population and had a high urbanization rate. Low-value cities were focused on the ecological vulnerability area, which showed a lack of livability. In terms of resource subsystems, the distribution feature was closely related to the cities’ resource attributes, such as Longnan and Bayanur. In addition, the geographical distribution of the environmental subsystem showed a scattered characteristic with an increasing trend, demonstrating improvement in environmental quality in the basin. Lastly, the economy subsystem demonstrated a relatively unbalanced tendency. High-value cities accounted for a small proportion, and low-value cities were concentrated in the ecologically fragile area, which was consistent with the population distribution.
3.2. Standard Deviation Ellipse Results
The Standard Deviation Ellipse of the RECC results in the YRB (
Figure 7) revealed both a shift in the gravity center and an expansion of the spatial distribution over time. Between 2011 and 2021, the gravity center of RECC shifted slightly southward and westward. It moved from a longitude of 111.4502° and a latitude of 36.7164° in 2011 to a longitude of 111.4296° and a latitude of 36.6860° in 2021, indicating a gradual migration of the RECC’s focal point.
The shape area of the ellipse, which reflects the spatial extent of the RECC distribution, expanded slightly from 548,618 km2 in 2011 to 549,842 km2 in 2021. This small but notable increase suggests a broadening in the range of coordination across the region. The major axis, representing the primary direction of spatial distribution, increased from 553,887 km in 2011 to 556,563 km in 2021, signaling a moderate elongation of the spatial spread. Meanwhile, the minor axis saw a slight decrease, moving from 315,306 km to 314,490 km, showing a more compressed distribution in the perpendicular direction. These changes reflect a slight but continuous expansion of the spatial scope and coordination of the RECC in the YRB over time.
3.3. PVAR Results
3.3.1. Unit Root Test and Co-Integration Test
The LLC, IPS, ADF, and PP tests were employed to conduct the unit root test. The results indicated that the resource and economy subsystems initially exhibited non-stationary characteristics. However, after applying a first-order differencing process, all four subsystems achieved stationarity, as evidenced by passing the 1% significance level test, thereby confirming the stability of the panel data (
Table 1).
Following this, a cointegration test was implemented to assess the presence of long-term dependencies among the subsystems. The Westlund, Pedroni, and Kao tests all met the significance threshold, confirming that the variables in their first-order differenced form were suitable for initiating the PVAR analysis (
Table 2).
3.3.2. Granger Causality Test
It is essential to confirm both the validity and the degrees of freedom of the estimated parameters prior to conducting the Granger causality test. To identify the optimal lag order for the two variables and ensure the most suitable specification for the PVAR model, the minimum values of the AIC, BIC, and HQIC criteria should be calculated and compared. This process helps in selecting the most effective lag structure for robust analysis. The results in
Table 3 reveal that the AIC, BIC, and HQIC criteria all reach their minimum values at lag order 1, suggesting that a lag order of 1 is optimal.
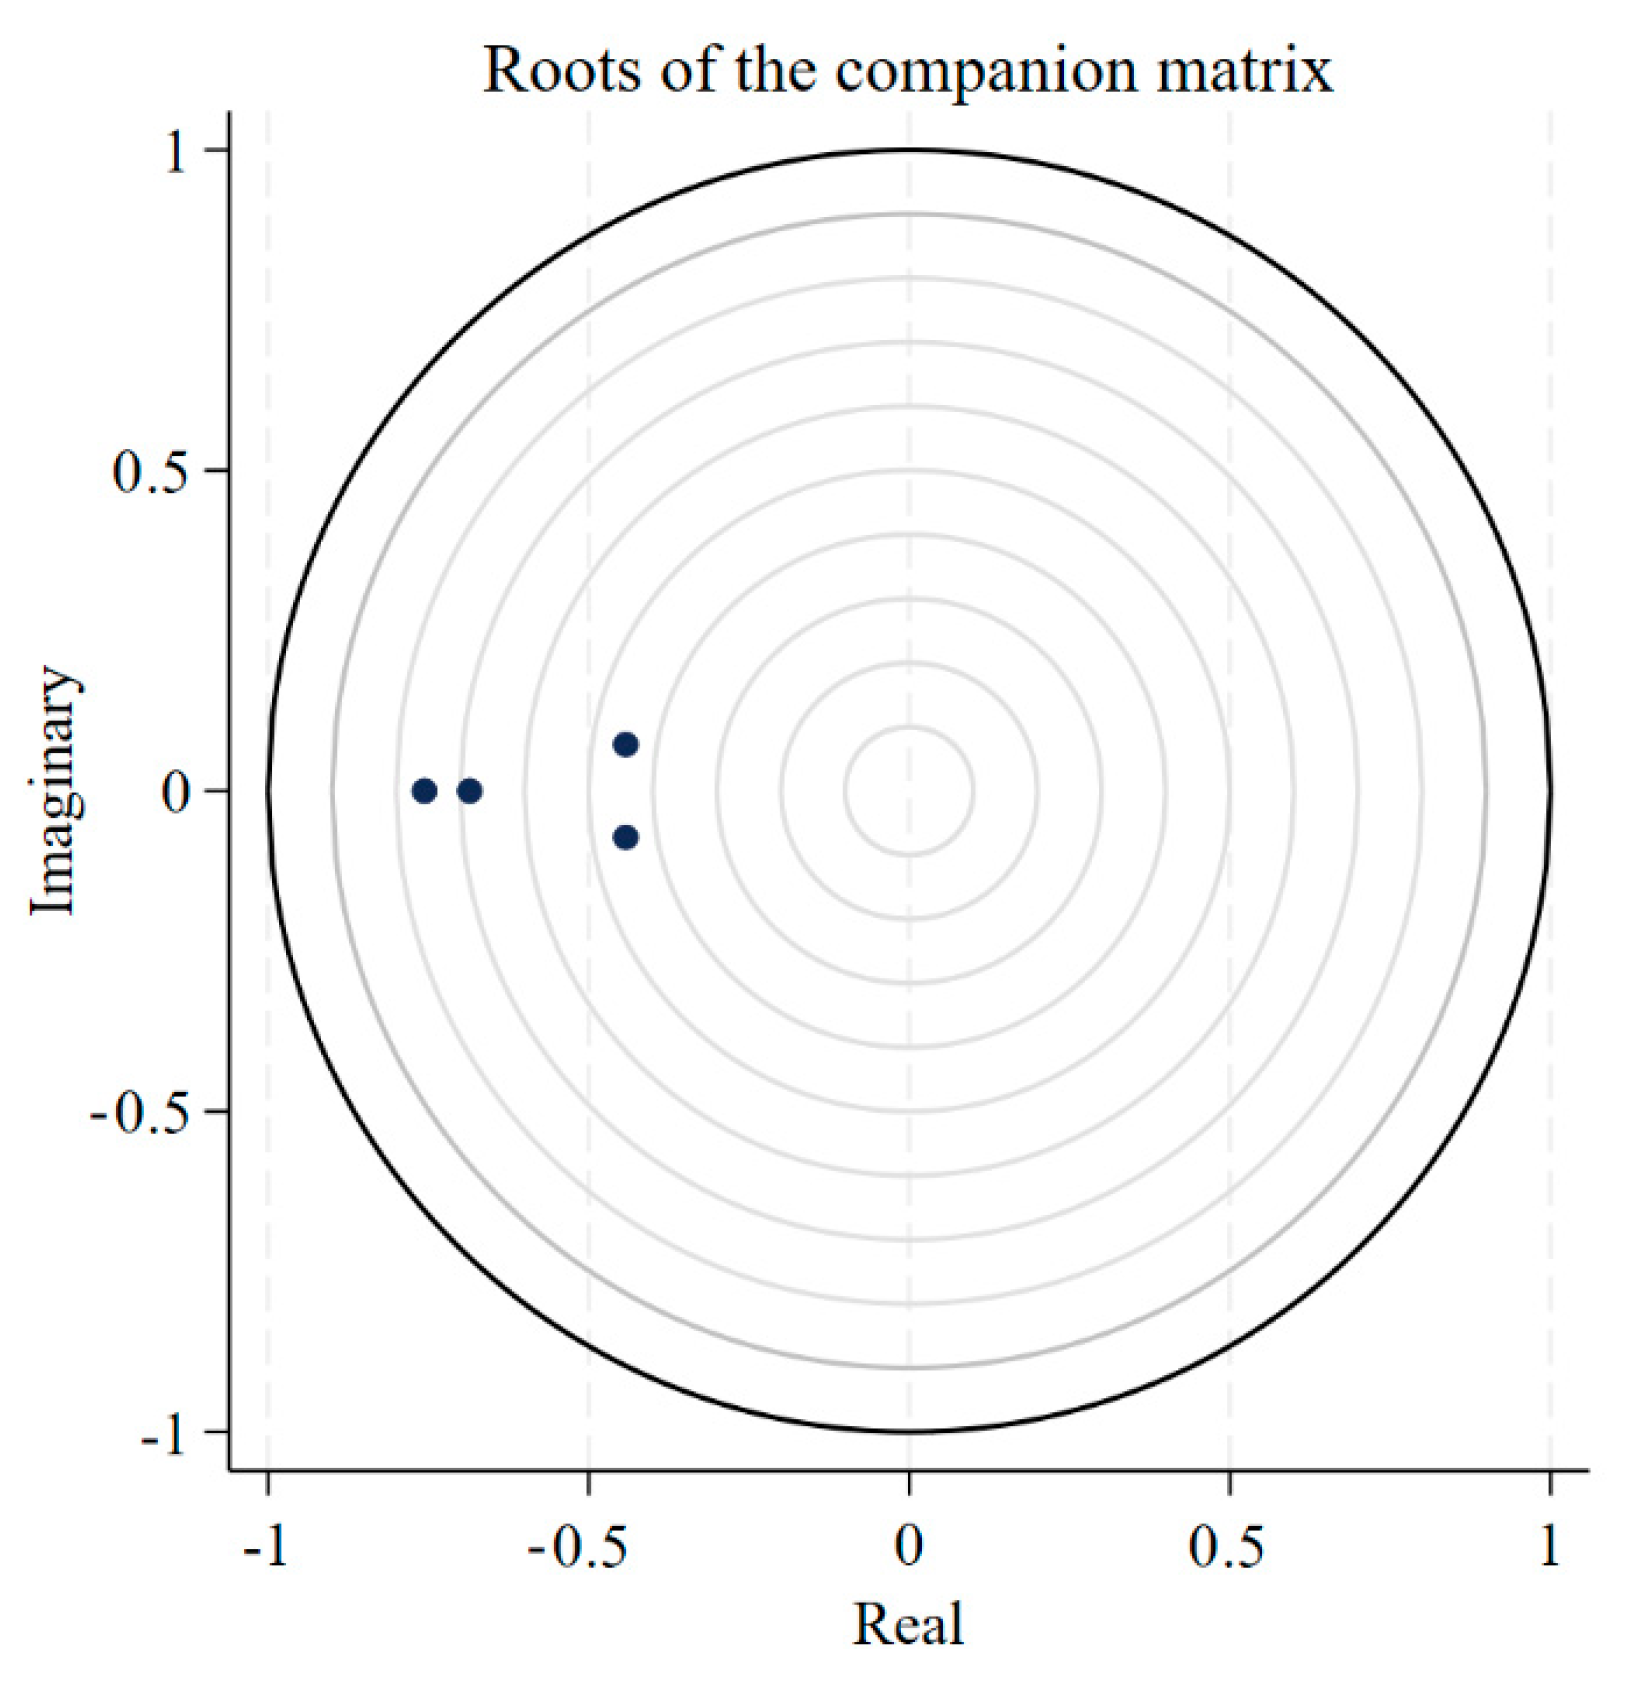
To enhance the effectiveness of model estimation and impulse response analysis, the robustness of the model is evaluated. A PVAR model is deemed robust if the eigenvalues of the adjoint matrix are less than one, indicating that they lie within the unit circle. As illustrated in
Figure 8, all eigenvalues fall within the unit circle, confirming that the model exhibits strong robustness.
The Granger causality test was conducted using the optimal lag order to assess the presence of causal relationships among the four systems: population, resources, environment, and economy (
Table 4). The results revealed that the Granger causality relationship existed between population and resource subsystems, indicating a dynamic interaction in the YRB where changes in population impact resource availability and usage. Meanwhile, resource availability can influence population patterns, as limitations in essential resources can impact urban growth and migration. Additionally, the Granger causality analysis revealed a reciprocal relationship between the population and economy subsystems. It confirmed that population growth has driven economic development, while economic progress during the study period has also contributed to population expansion.
The analysis also identified certain unidirectional causality relationships. For instance, the economy was found to influence the environment subsystem, suggesting that economic growth impacted environmental conditions. However, the environmental subsystem did not exert sufficient influence to affect the economy in return. Additionally, interactions were observed among other dimensions with specific subsystems, and hypotheses were rejected in the population, environment, and economy subsystems, indicating that combined effects interact with these individual subsystems.
3.3.3. Impulse Response
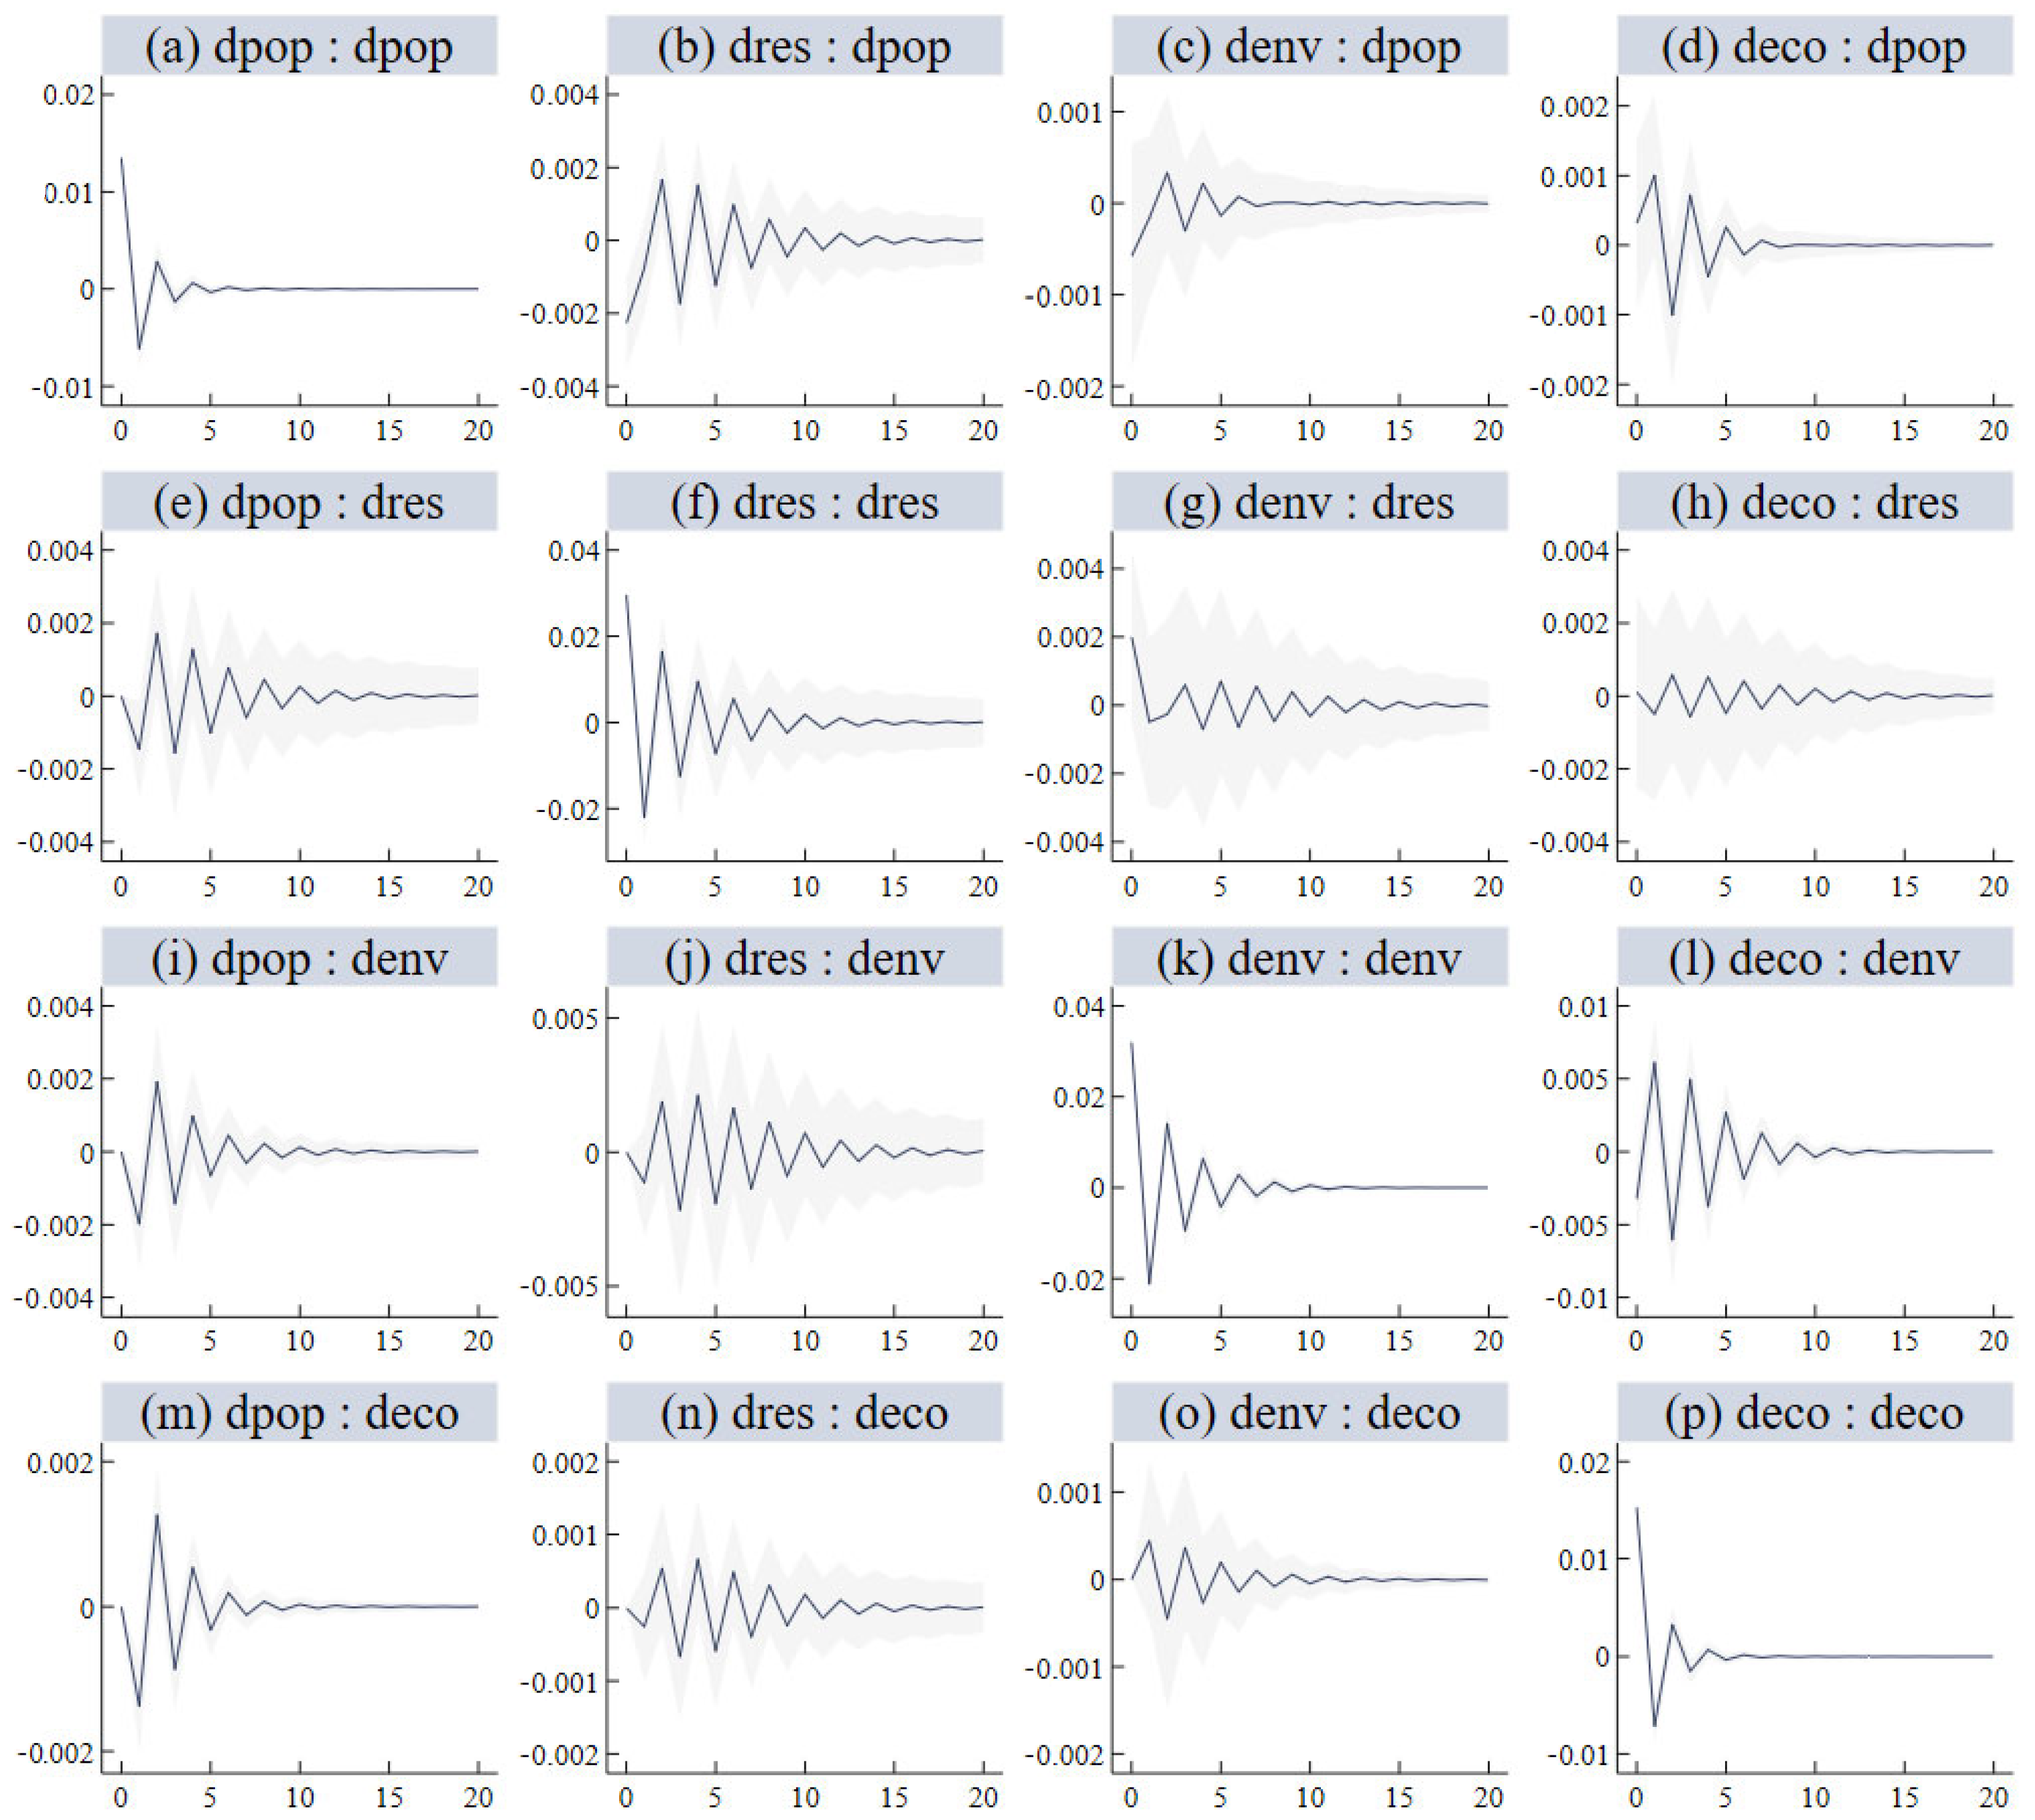
The impulse response analysis was employed to assess how a one standard deviation shock in each subsystem—population, resources, environment, or economy—affects both the immediate and future value. To minimize random effects and enhance the stability and reliability of the results, 200 Monte Carlo simulations were conducted. The impulse response functions (IRF) analysis elucidated the interconnections and feedback mechanisms present within the RECC system.
Figure 9 depicts the impulse response functions of the subsystem across 20 stages.
In terms of self-responses, the economic and environmental subsystems display prolonged effects from their own shocks, with responses that gradually diminish. In contrast, the population and resource subsystems exhibit shorter-lived responses that stabilize quickly. For cross-subsystem responses, economic shocks initially yield a positive impact on both the environment and resource availability, which subsequently fluctuate before stabilizing. Environmental shocks similarly lead to oscillating responses in economic and resource subsystems, reflecting notable dynamic interactions. Population shocks display limited impact on other subsystems, with only a slight positive response observed in the economic subsystem, while resource shocks create notable oscillations within the economic and environmental subsystems.
Overall, these impulse response functions reveal dynamic interactions among all subsystems, with economic and environmental factors showing the strongest cross-subsystem effects. Most of these impacts, however, appear to be transient, gradually dissipating over time and stabilizing within the RECC system.
3.4. Random Forest Regression
This study employed the random forest regression model to analyze the impact of several selected factors on the RECC system. The factors included Slope (X1), Elevation (X2), Precipitation (X3), Population Density (X4), Economic Influence Level (X5), Trade Level (X6), Consumption Level (X7), Industrial Upgradation (X8), and Green Innovation Level (X9).
The random forest regression model’s performance on the testing dataset yielded an R2 value of 0.8600, indicating that 86.00% of the variance in RECC is explained by the model. Additionally, the mean absolute error (MAE) was 0.6825, with the mean squared error (MSE) and root mean squared error (RMSE) recorded at 1.1142 and 1.0556, respectively. The mean absolute percentage error (MAPE) was 0.8873%. These results highlight the effectiveness of the random forest regression model in predicting RECC based on the selected factors.
3.4.1. Feature Importance Analysis
To assess the relative importance of selected influencing factors, the increase in node purity (IncNodePurity) and mean squared error (MSE) estimation methods were applied to analyze feature importance in the random forest regression model, as illustrated in
Figure 10. Despite differences between these methods, the results consistently highlighted that Economic Development Level (X5), Consumption Level (X7), Slope (X1), and Population Density (X4) emerged as the most influential factors, each exceeding a value of 1 in IncNodePurity and 50% in MSE. Aside from Precipitation (X3), which ranked ninth, the remaining factors displayed varied sequences of importance. Overall, this feature importance analysis indicated that socioeconomic factors played a substantial role in influencing the coordination and development of RECC, while technological innovation had a comparatively lesser impact.
3.4.2. Partial Dependence Analysis
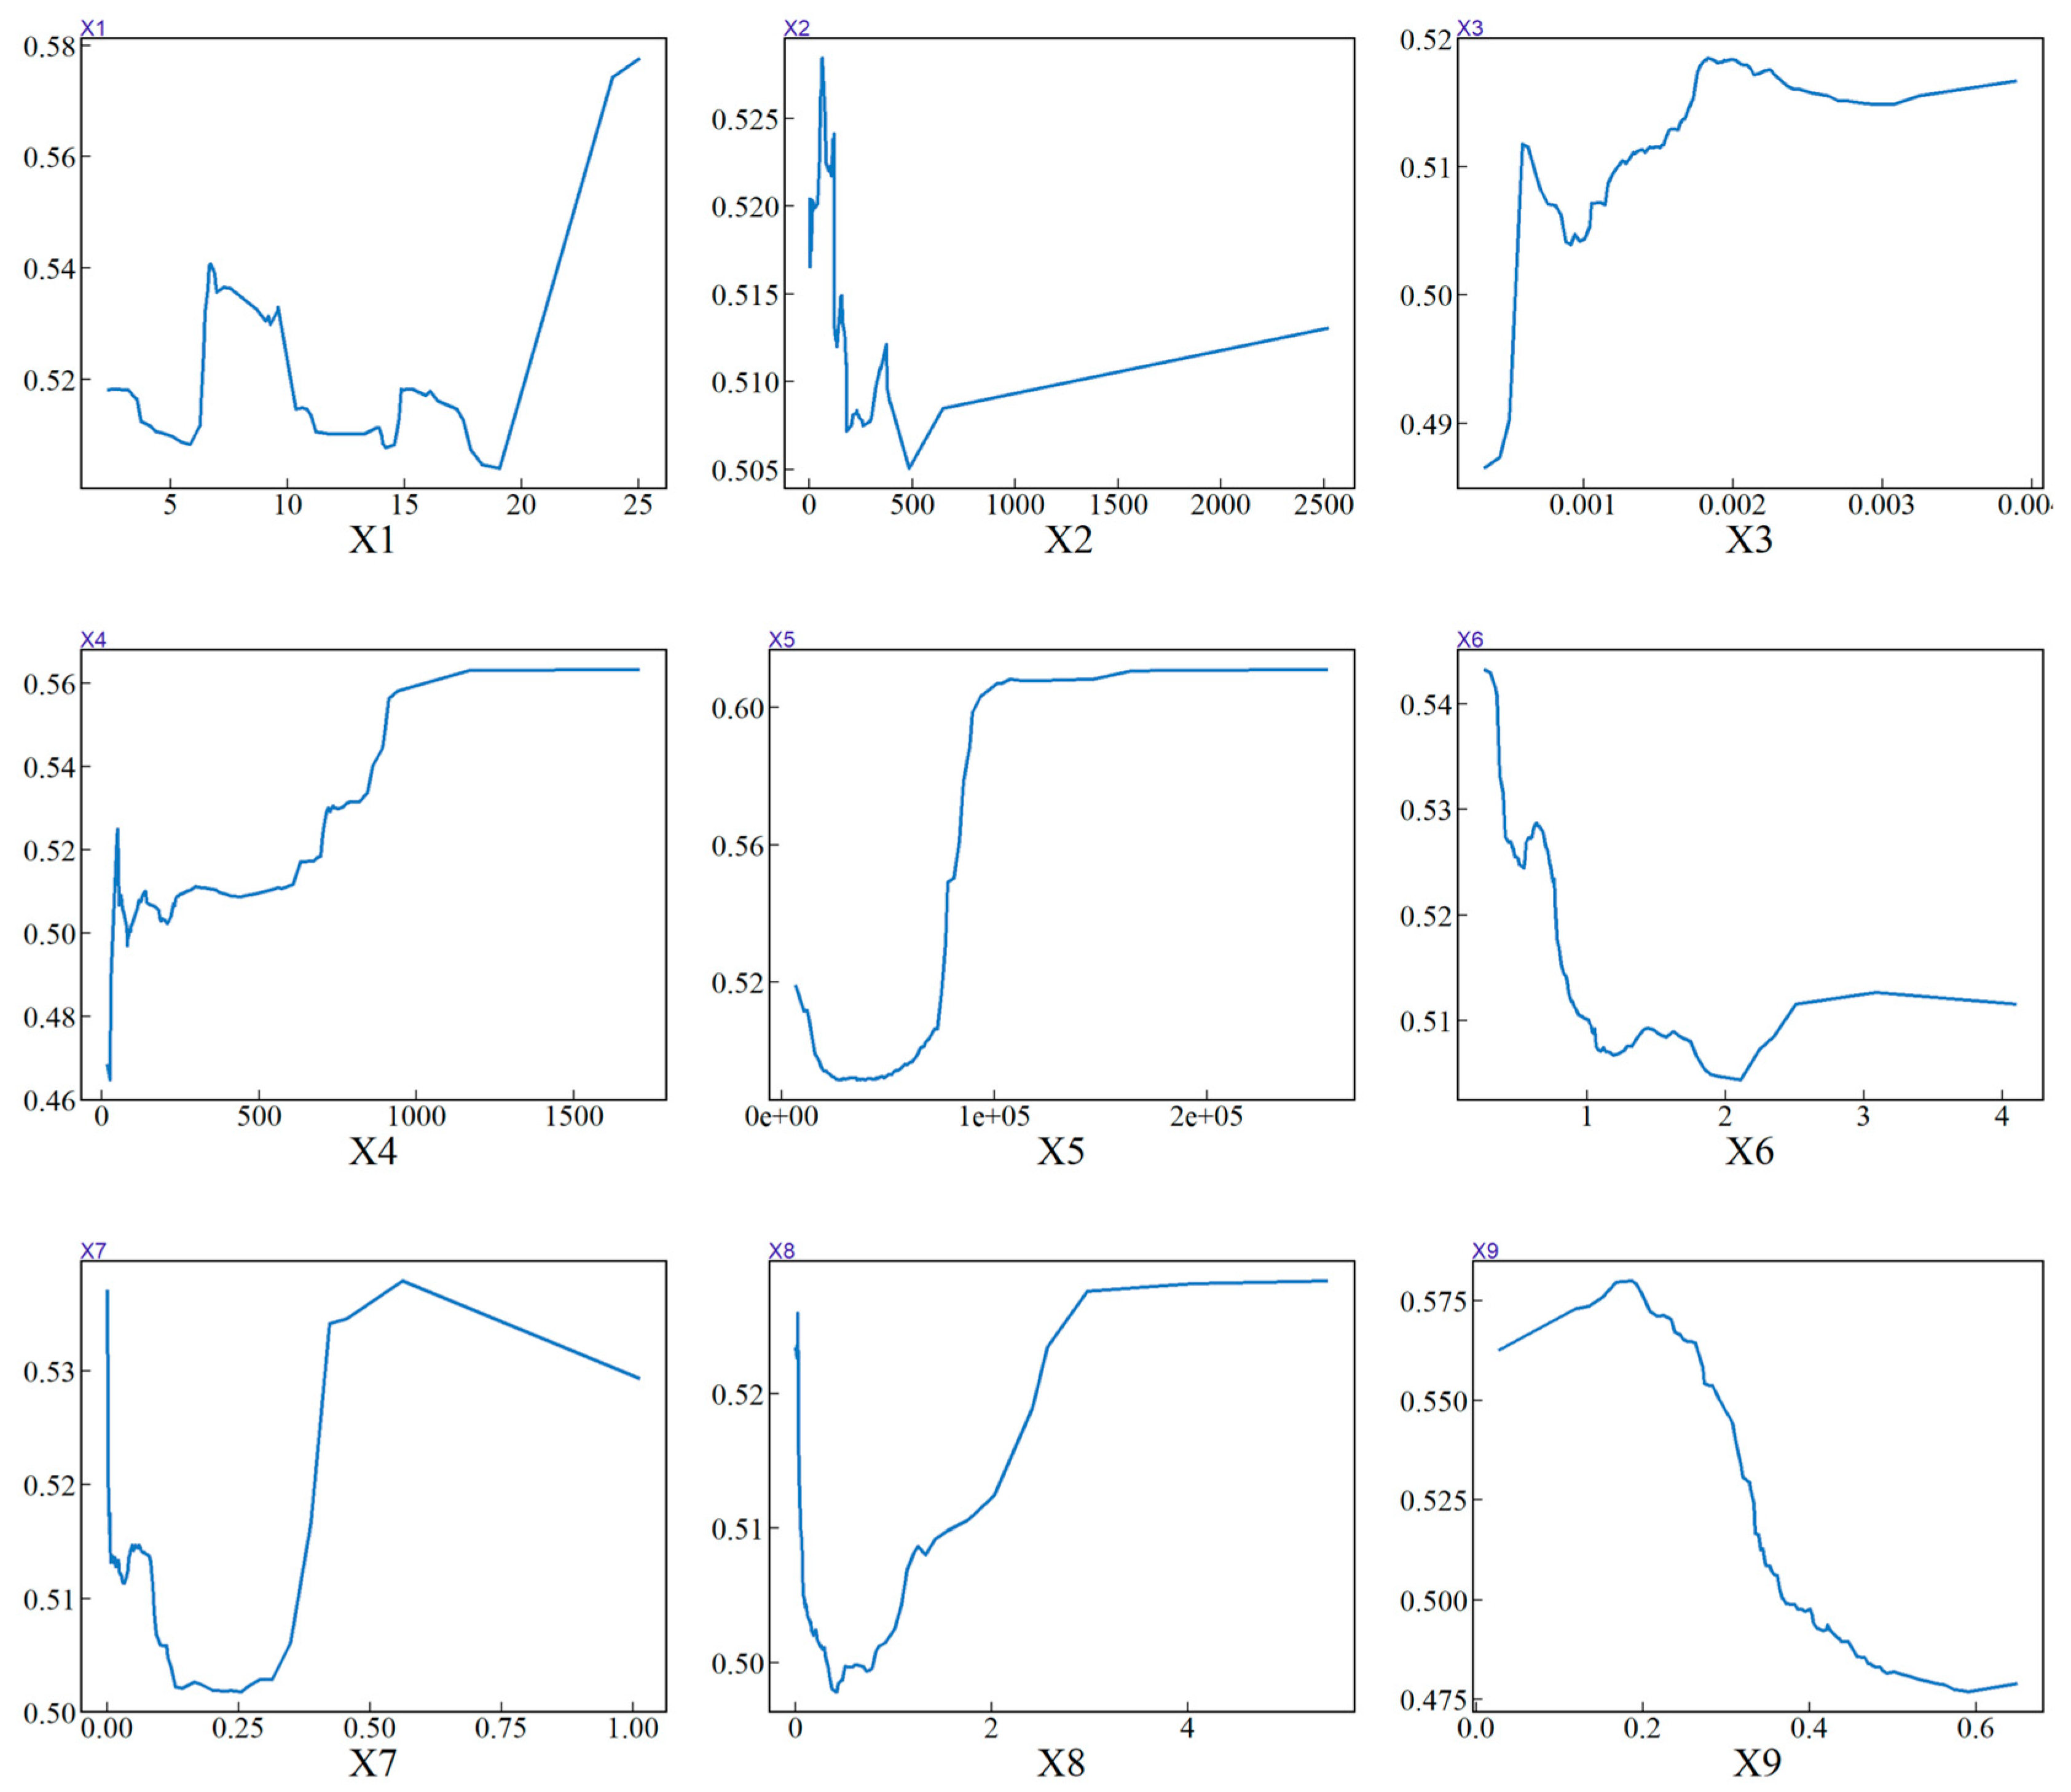
The partial dependence analysis was conducted to investigate the relationship between each influencing factor and RECC outcomes, as shown in
Figure 11. The analysis revealed that none of the influencing factors exhibited a strictly linear relationship with RECC; instead, each graph displayed notable fluctuations, suggesting complex, non-linear interactions.
For natural factors, Slope (X1) exhibited initial fluctuations followed by an upward trend, while Elevation (X2) and Precipitation (X3) showed modest positive effects on RECC with minor variations, indicating limited but non-linear influences. In the socioeconomic category, Population Density (X4) and Economic Influence Level (X5) were significant drivers, with RECC values rising sharply at lower levels before plateauing. Trade Level (X6), however, showed a negative trend, possibly reflecting trade-related impacts on environmental or resource management. Consumption Level (X7) displayed an increase at moderate levels, followed by a slight decrease, indicating diminishing returns. Among technological factors, Industrial Upgradation (X8) positively influenced RECC initially but reached a point of diminishing returns. Green Innovation Level (X9) showed a declining trend, suggesting a short-term trade-off in resources that could impact RECC outcomes.
Overall, socioeconomic factors—especially economic influence and population density—emerged as primary drivers of RECC. Geographical and technological factors had more nuanced, context-dependent impacts, highlighting the need for balanced policies that account for these complex interactions in promoting coordinated development.
3.5. GTWR Regression
3.5.1. Key Factor Identification
Based on the importance ranking analysis results from the random forest regression model, X1, X2, X4, X5, X6, and X7 were selected to deeply discover the geographical and time relationship between driving factors and RECC. Variance Inflation Factor (VIF) was conducted to diagnose the multicollinearity, and the results demonstrated that all the VIF values remained below 10, which verified the reliability of the model (
Table 5).
3.5.2. GTWR Estimated Results
Based on
Table 6, the OLS estimates were lower than those of GTWR, highlighting the greater explanatory power of GTWR. Additionally, the R
2 and AICc values further demonstrate that GTWR outperforms GWR in model performance.
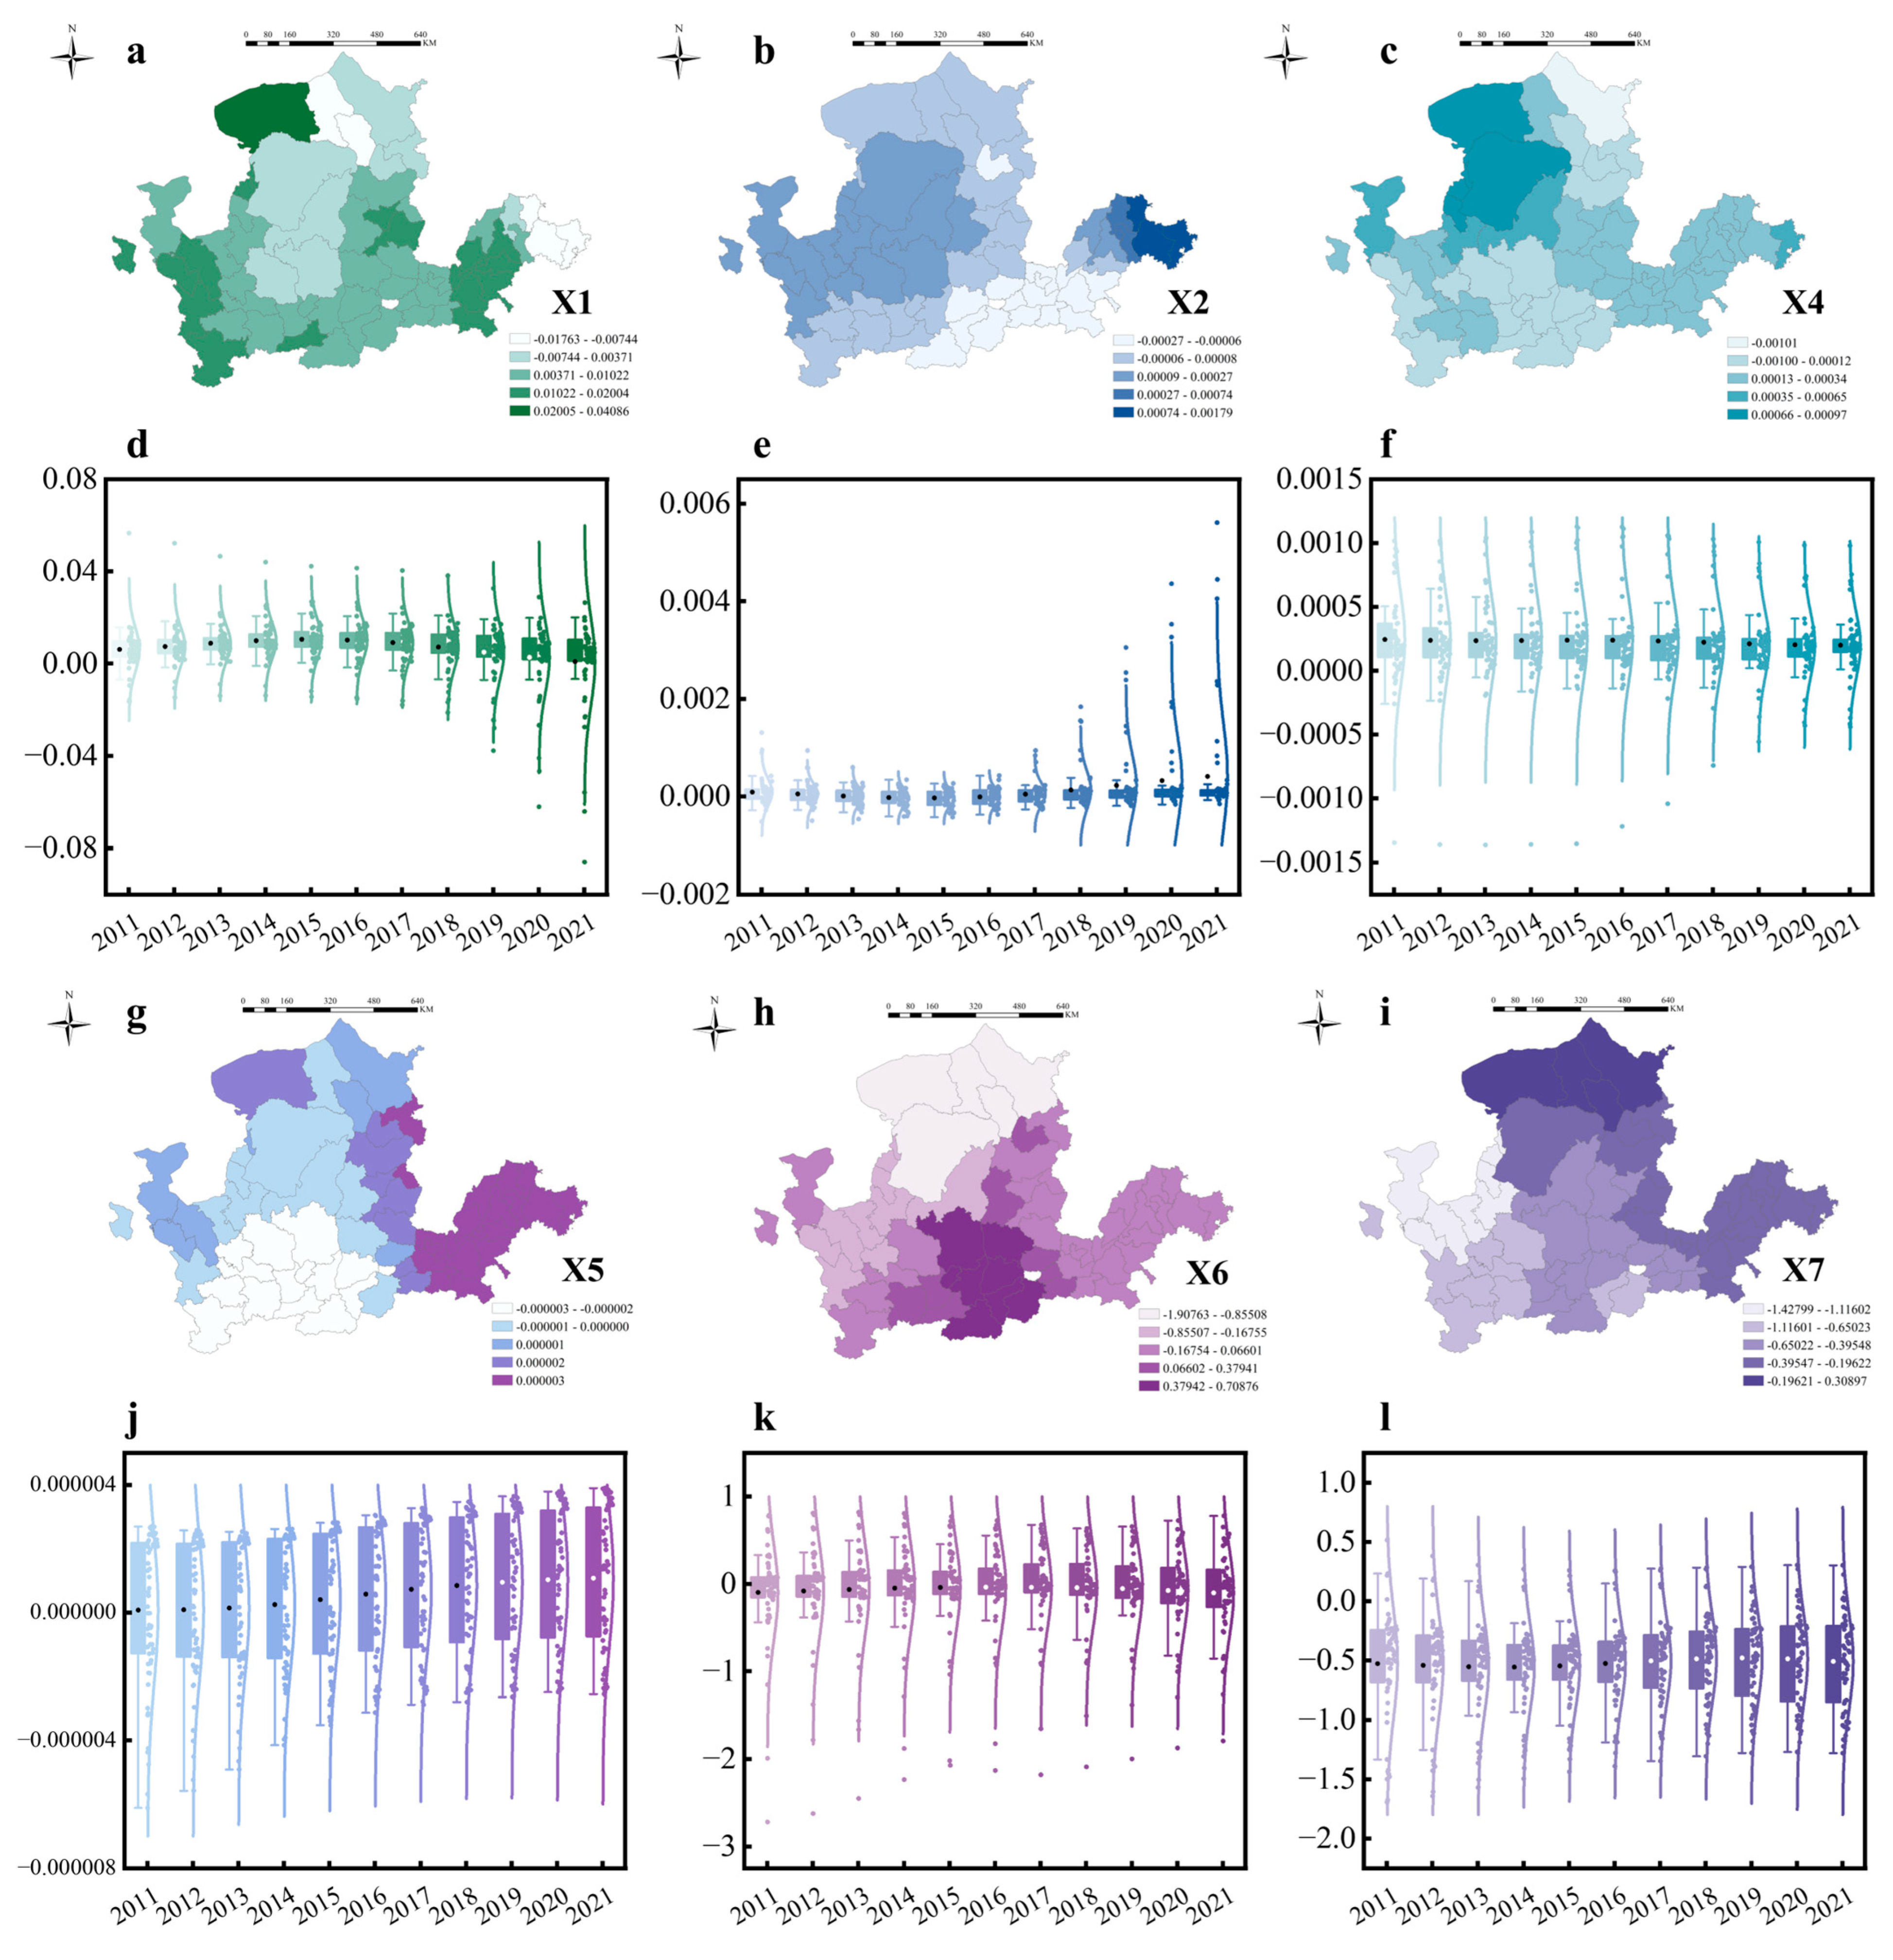
The GTWR model was employed to analyze the influence of various factors on RECC values across different periods and locations. This method generated fitting coefficients for each factor at specific spatiotemporal points, allowing their temporal evolution to be visualized through a box plot. To further highlight spatial differences in the Yellow River Basin, the study calculated the average fitting coefficient for each factor over the research period, as shown in
Figure 12.
In terms of the geography category, the slope (X1) coefficient exhibited a fluctuating downward trend with increasing dispersion, suggesting a weakening influence on RECC over time. Positive coefficients were concentrated upstream, while negative ones were mainly downstream, likely due to natural terrain shaping urban development and promoting environmental conservation for sustainable balance (
Figure 12a,d). The altitude (X2) coefficient demonstrated a slight upward trend from 2011 to 2021, with increased dispersion over time. Spatially, high coefficients were concentrated in downstream coastal cities, moderate coefficients appeared in the upstream areas, and negative coefficients were found primarily in downstream inland cities (
Figure 12b,e).
Regarding socioeconomic factors, the population density (X4) coefficient demonstrated a relatively stable trend over the study period, with a decrease in dispersion. Notably, the average coefficient remained positive each year, suggesting that higher population density may enhance the RECC. Geographically, the driving effect of population density was predominantly concentrated in the upstream and downstream regions. The economic development level (X5) coefficient remained close to zero overall, though a slight upward trend was observed. Spatially, negative coefficients were concentrated in the Loess Plateau, while positive coefficients were found primarily in downstream cities. This suggests that economic development supports higher RECC in downstream areas, whereas the Loess Plateau faces constraints, such as limited infrastructure, fragile ecosystems, and resource scarcity, which may limit the positive impact of economic development on RECC in that region. The trade level (X6) coefficient showed a negative effect on RECC with reduced dispersion over time. Inner Mongolia, particularly Bayannur, Baotou, Ulanqab, Erdos, and Hohhot, experienced significant negative impacts, likely due to trade-related resource extraction and environmental pressures that disrupt sustainable development in these areas (
Figure 12h,k). The consumption level (X7) exhibited a relatively stable negative influence on RECC in the Yellow River Basin (YRB), with considerable spatial variation. A strong negative impact was observed in Gansu province, while positive coefficients were primarily concentrated in parts of Inner Mongolia and Shandong (
Figure 12i,l).
4. Discussion
The Yellow River Basin (YRB) serves as both a vital economic development zone and a key area for ecological conservation. Analyzing the interactions among population, resources, environment, and economy offers valuable insights for promoting the region’s high-quality development. The previous analytical results reveal notable findings regarding the spatiotemporal distribution patterns, interaction mechanisms, and influence of key factors.
First, a noticeable regional disparity of RECC was observed within the Yellow River Basin, aligning with findings in previous studies [
41]. The findings indicate a gradual improvement in RECC performance, with an expansion of coordinated areas over the study period, as illustrated by the standard deviation ellipse. It is evident that distinct challenges were faced across different regions; notably, the rate of increase was slower upstream compared to midstream and downstream, primarily due to pressures from the fragile ecological environment in upstream areas [
6]. In general, downstream cities exhibited higher RECC levels, largely due to their advanced development status, more sustainable development pathways, fewer constraints imposed by natural conditions, and lower dependency on natural resources [
29].
Second, the interaction mechanism among the subsystems from the PVAR analysis demonstrated the complex interdependencies among the subsystems. The Granger causality analysis demonstrated bidirectional relationships between the population and resource subsystems, as well as between the population and economy subsystems. The results indicated that resource exploration and economic development supported population growth by creating jobs and improving living standards [
13]. In turn, population growth stimulated economic activity and increased resource consumption to meet rising demand [
42]. Additionally, a unidirectional relationship was observed between the economy and environment subsystems, suggesting that the current economic development model is already placing pressure on the environment in the YRB, a trend that has been substantiated in practice [
43]. The impulse response analysis results revealed complex interactions among the subsystems, which ultimately converged, indicating interdependence and correlation between the subsystems.
Third, the effect of the influencing factors has demonstrated the importance and variance in the YRB during the research period. The random forest regression results revealed the importance of socioeconomic categories, especially economic development level and consumption level, indicating that economic performance could profoundly impact the RECC. However, the geographical categories showed limited importance. Considering the climate change impact, precipitation exhibited less contribution, indicating that the variation of RECC is mainly driven by the change in socioeconomic development. Technological innovation contributed minimally to coordination, likely due to the lag in technological development relative to the RECC system’s needs, which limits its capacity to enhance system performance. Historically, the Yellow River Basin’s economic growth has been predominantly driven by heavy industries such as coal, chemicals, and manufacturing. While these sectors have contributed significantly to regional development, they have also led to slower progress in technological innovation and green transitions [
23]. GTWR results demonstrated the influenced differentiation both temporally and geographically. It turned out that the coefficients showed spatial clustering characteristics. The economic development level showed its strong influence in the downstream cities, indicating that higher economic development often aligned with advancements in infrastructure and policy implementation, which facilitated effective integration and coordination. Spatial differences in regional strategic planning and industrial structure are the two main reasons. Upstream focus on ecological protection (e.g., the “Three-River-Source National Park” policy). Economic growth is limited given the geographical conditions. Industries rely on farming and basic resource extraction with lower added value. In terms of midstream, coal and chemical industries dominate the regional economic development. These industries contribute to substantial carbon emissions and pollution, exacerbating ecological stress. Although technological progress has been made, its effect on RECC enhancement has been minimal. Downstream cities follow the “High-Quality Development” policy. Industries are shifting to advanced manufacturing and modern services. Moreover, the geographical condition is more suitable for economic development. Moreover, the positive impact of trade levels was concentrated in select cities in Henan, Shaanxi, and Shanxi, suggesting that some downstream coastal cities have already benefited from the advantages of trade on coordinated development. Now, midstream cities are beginning to experience these benefits, making the effect more prominent within the study period. This pattern aligns with the general trend of urban development in China, progressing from coastal to inland regions [
44].
In terms of policy implications, it is important for the administration to customize the regional development strategy. The upstream regions face severe geographical constraints and limited resources. Their top priority should be ecological protection, such as strengthening nature reserves and enforcing strict pollution controls. Policymakers could support these efforts by offering financial incentives for conservation projects and promoting eco-tourism as a sustainable alternative. Midstream areas are dominated by resource-based industries like coal and chemicals, leading to heavy environmental pressure. Industrial upgrading is critical, which includes shifting toward clean energy, improving production efficiency, and adopting circular economy practices. Governments should facilitate this transition by subsidizing green technology and providing workforce retraining programs. Downstream cities must address high population density, which intensifies RECC strain. Sustainable urban planning, such as compact city design and expanded public transport, can help reduce resource consumption. Investments in smart infrastructure would further ease environmental burdens. A coordinated approach is essential. Establishing a real-time RECC monitoring network would enable data-driven decisions. Additionally, implementing ecological compensation mechanisms, where downstream cities financially support upstream conservation, could balance regional equity and sustainability goals.
This study has some limitations, and potential directions for future research are discussed. Due to data limitations, certain cities and datasets were excluded, which may have constrained the analysis. Expanding data sources could enable a more comprehensive assessment of coordination development in the Yellow River Basin. Furthermore, incorporating additional geographical factors may provide deeper insights into the natural constraints affecting RECC, allowing for a more nuanced understanding of spatial influences on development pathways. Additionally, the current analysis is limited by its focus on city-level data, which may overlook finer regional differences; future research could include data from smaller administrative units to capture local variation more precisely.


