


Monitoring Vegetation Dynamics and Driving Forces in the Baijiu Golden Triangle Using Multi-Decadal Landsat NDVI and Geodetector Modeling

 ,
,
Abstract
1. Introduction
2. Materials and Methods
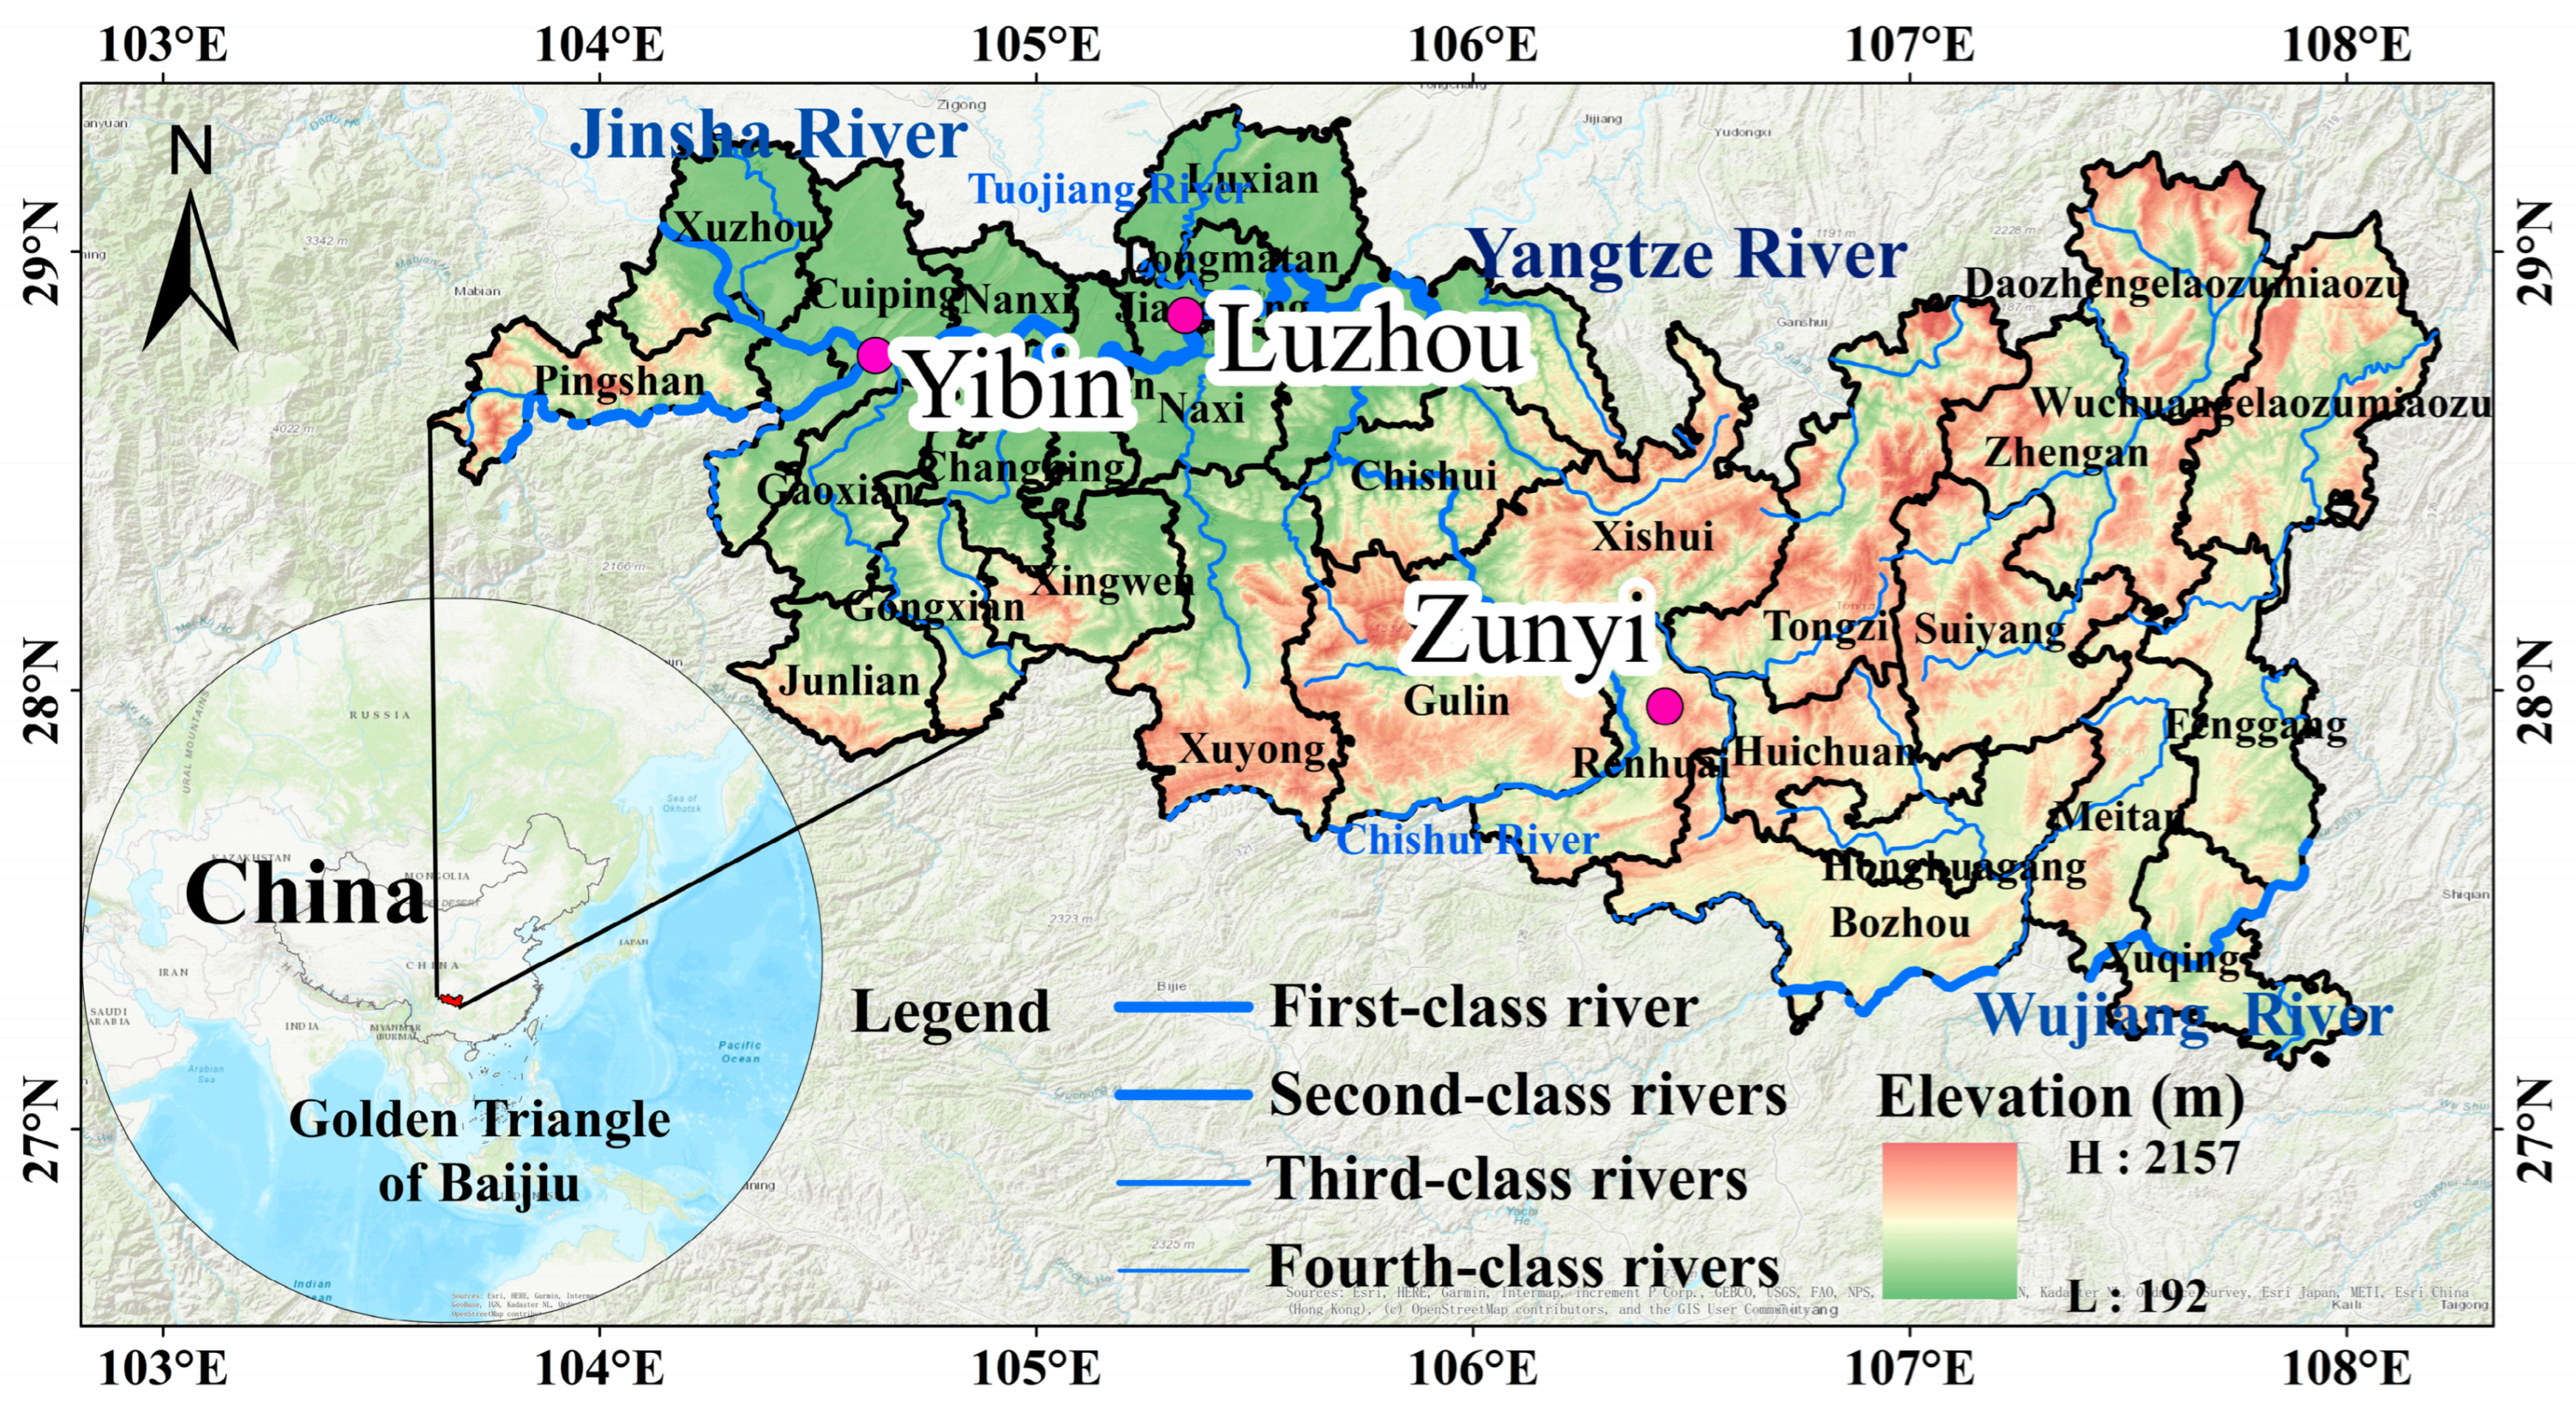
2.1. Study Area
2.2. Overview of the BGT
2.3. Data Sources
2.3.1. NDVI Data
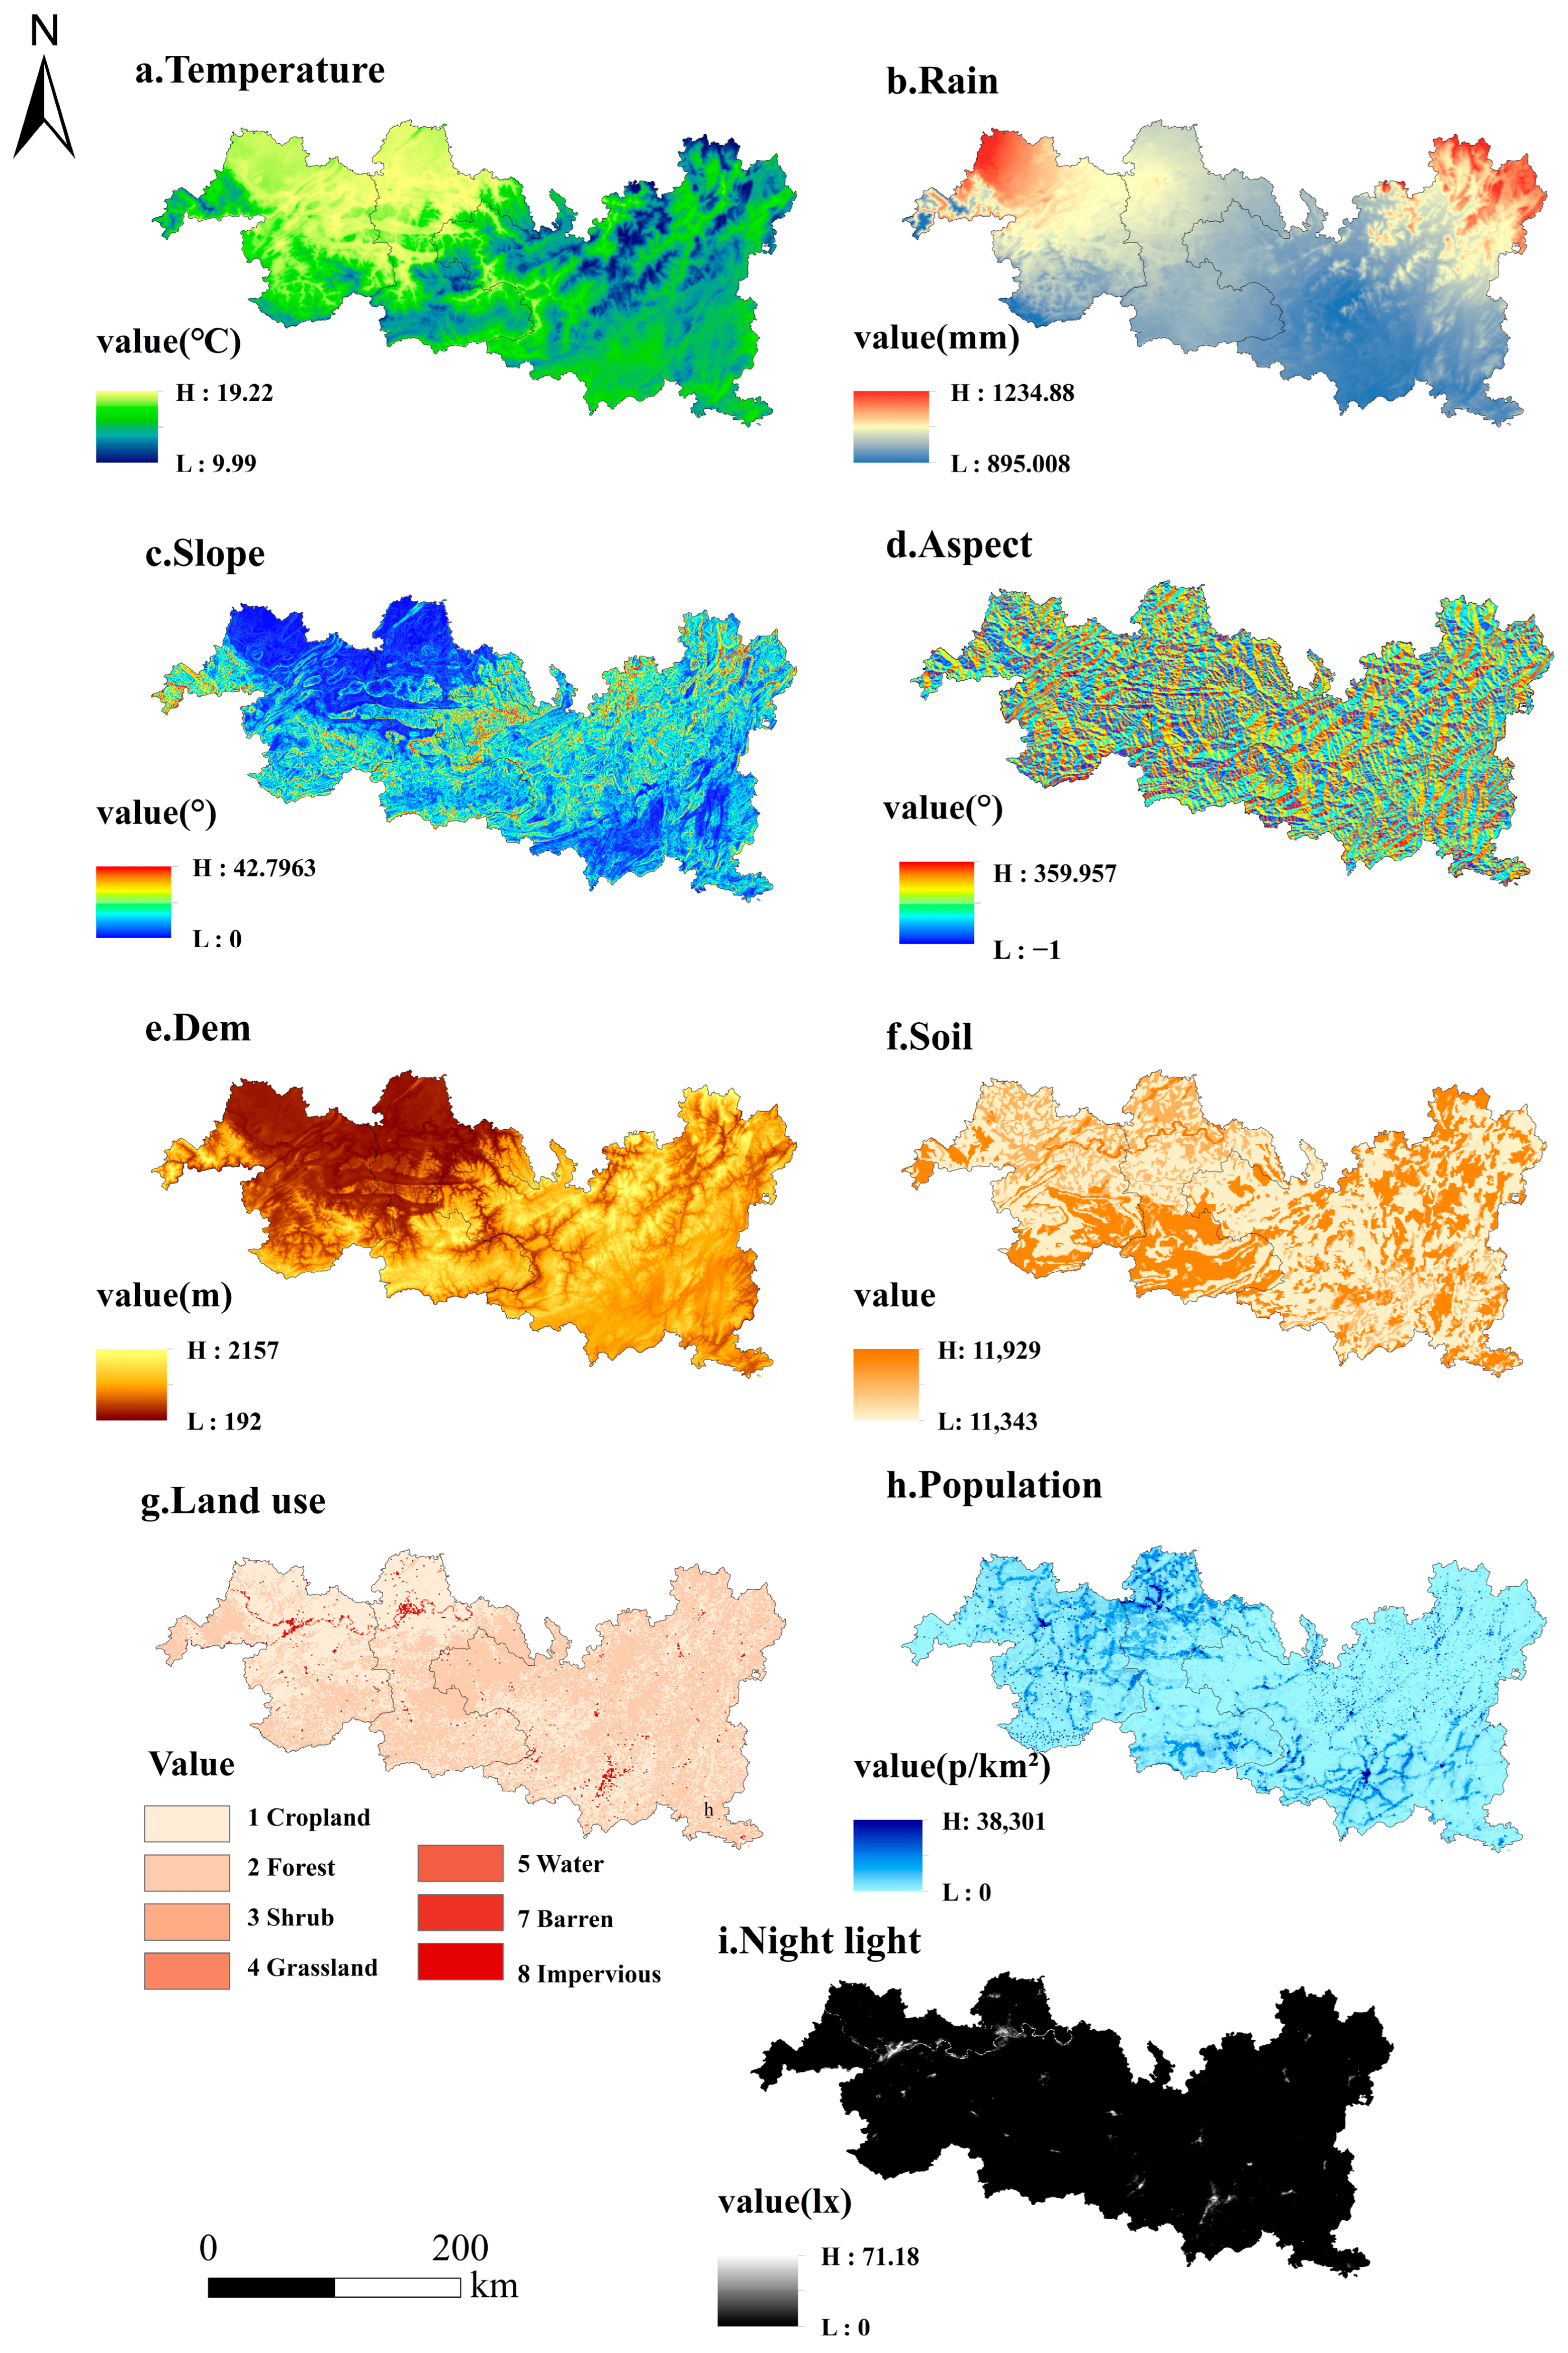
2.3.2. Other Data
2.3.3. Data-Processing Platform
2.3.4. Technical Roadmap
2.4. Research Methods
2.4.1. Theil–Sen Median Trend Analysis and MK Test
2.4.2. Pixel-Based Calculation of the CV for Vegetation NDVI
2.4.3. GD Model
3. Results
3.1. Spatiotemporal Variation Characteristics of NDVI
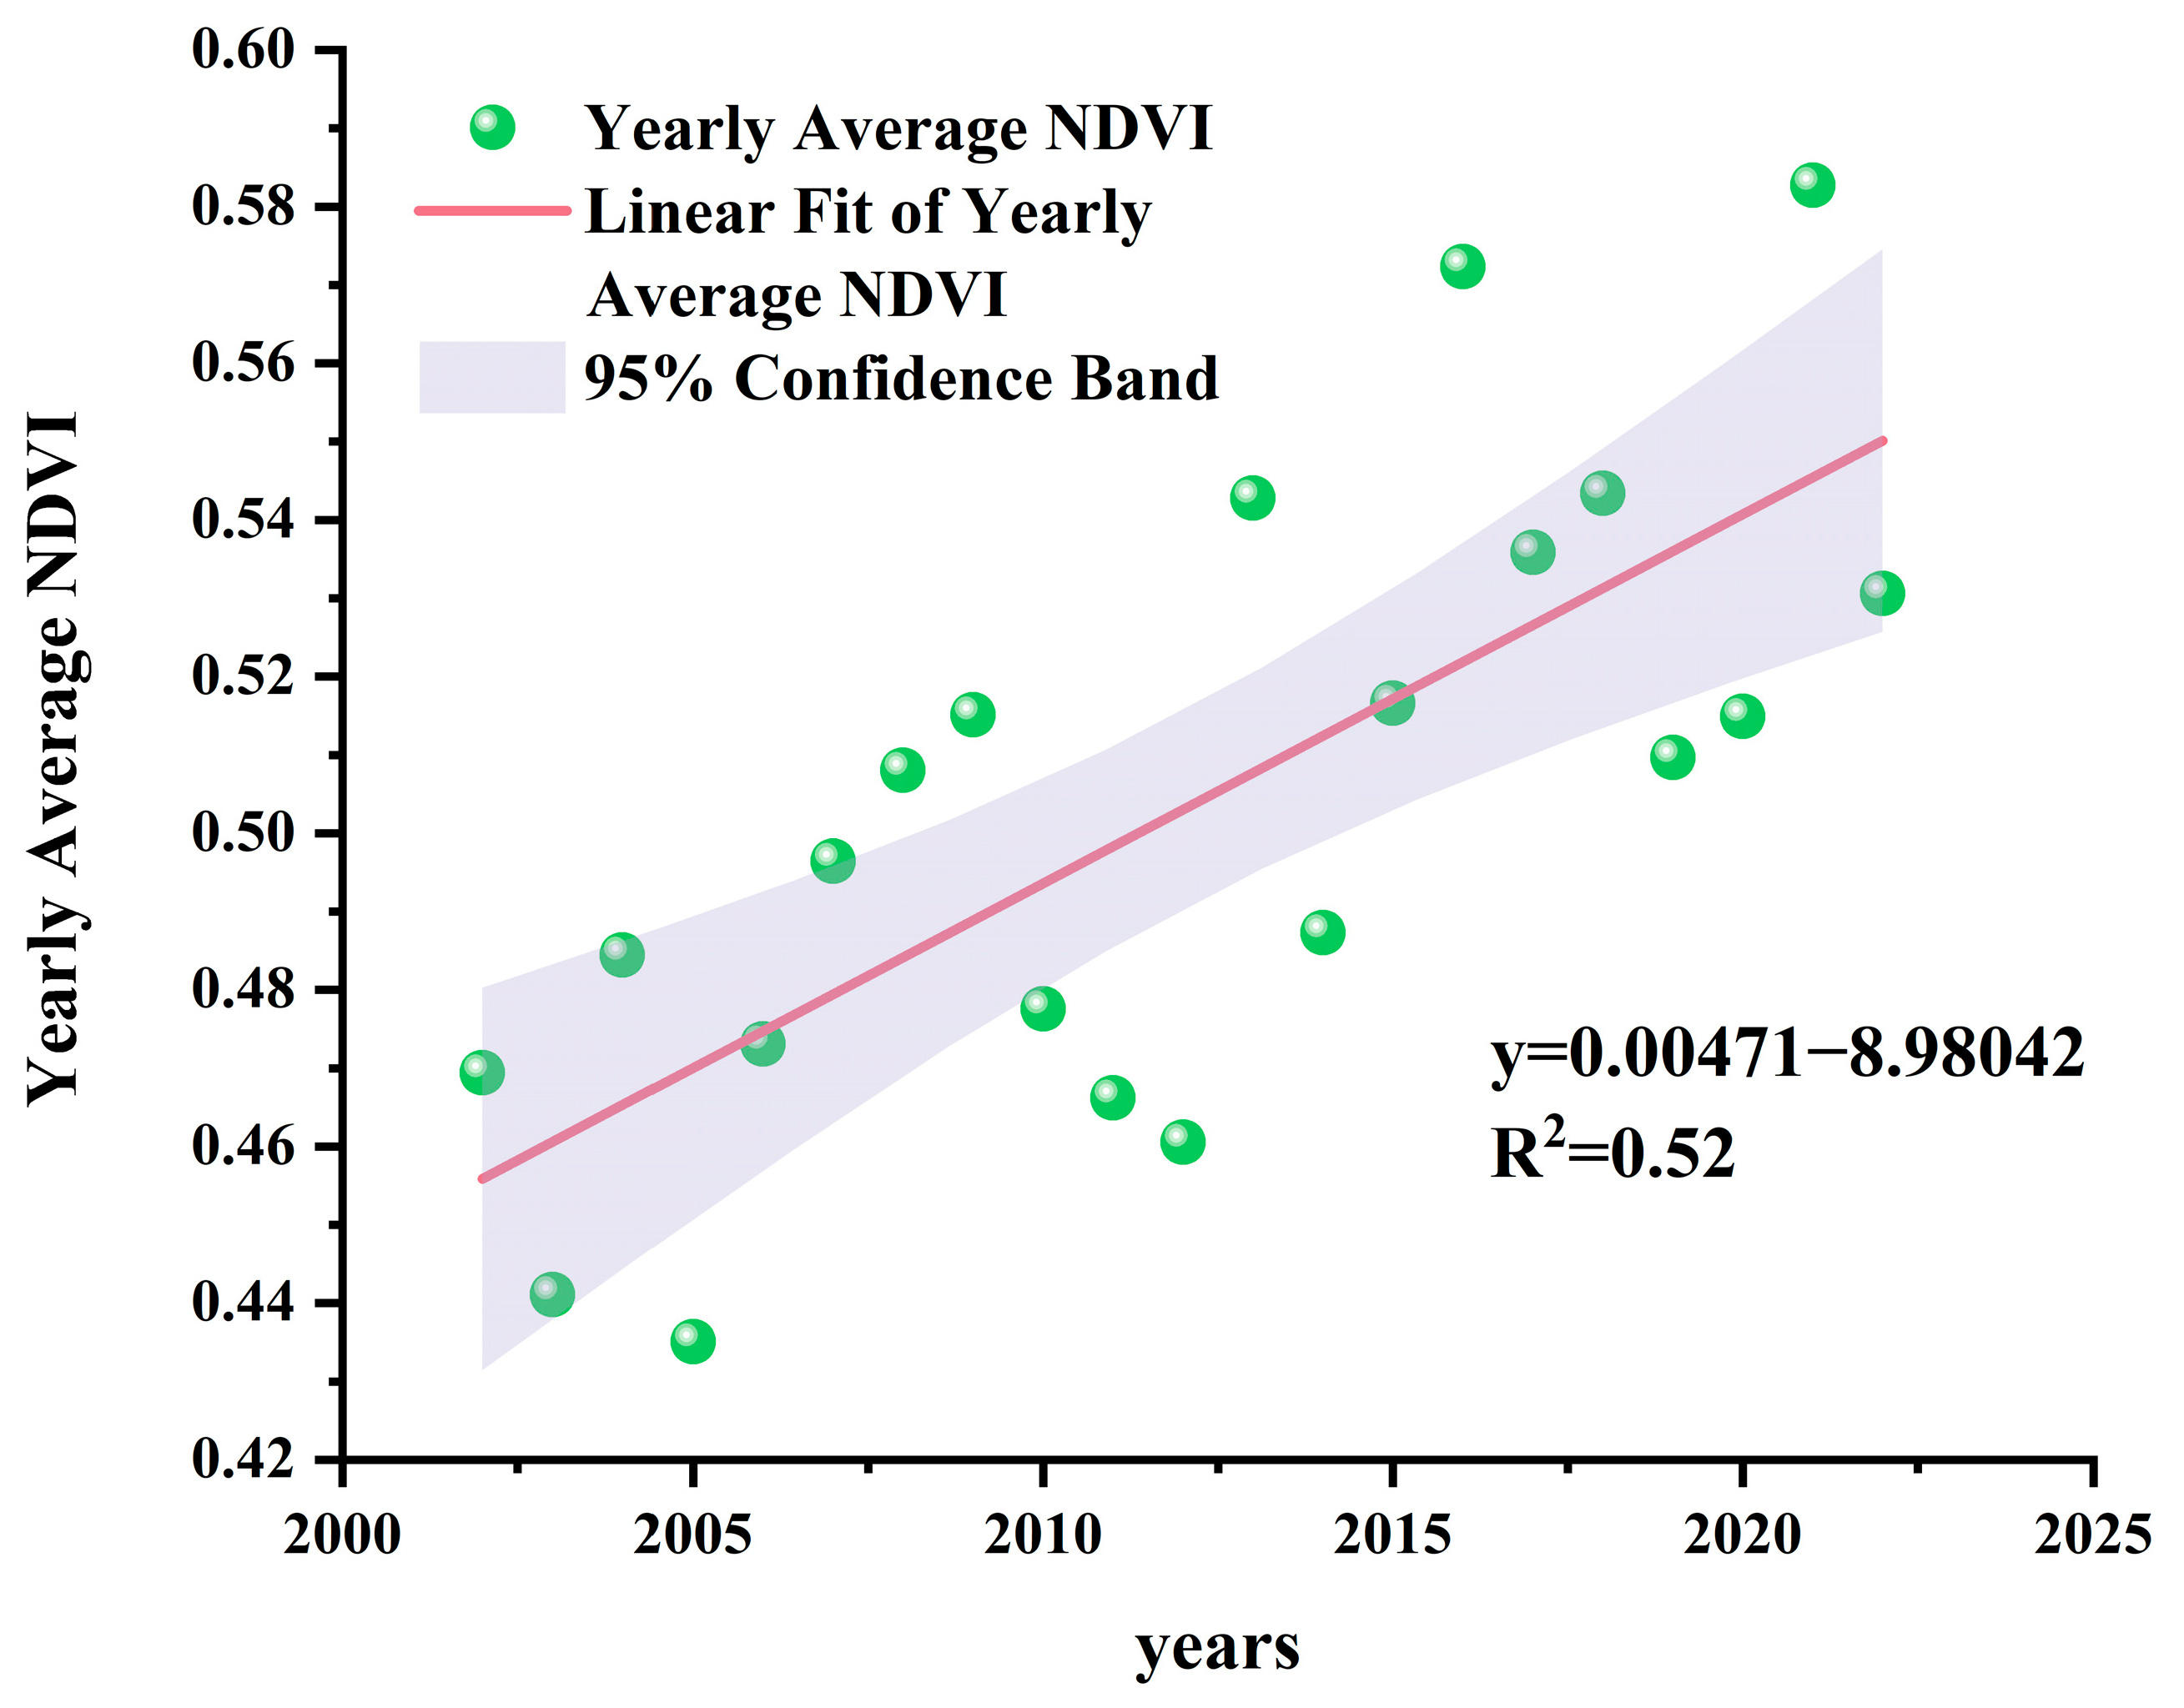
3.1.1. Temporal Variation Characteristics of NDVI
3.1.2. Spatial Variation Characteristics of NDVI
3.2. Sustainability of Vegetation NDVI Changes
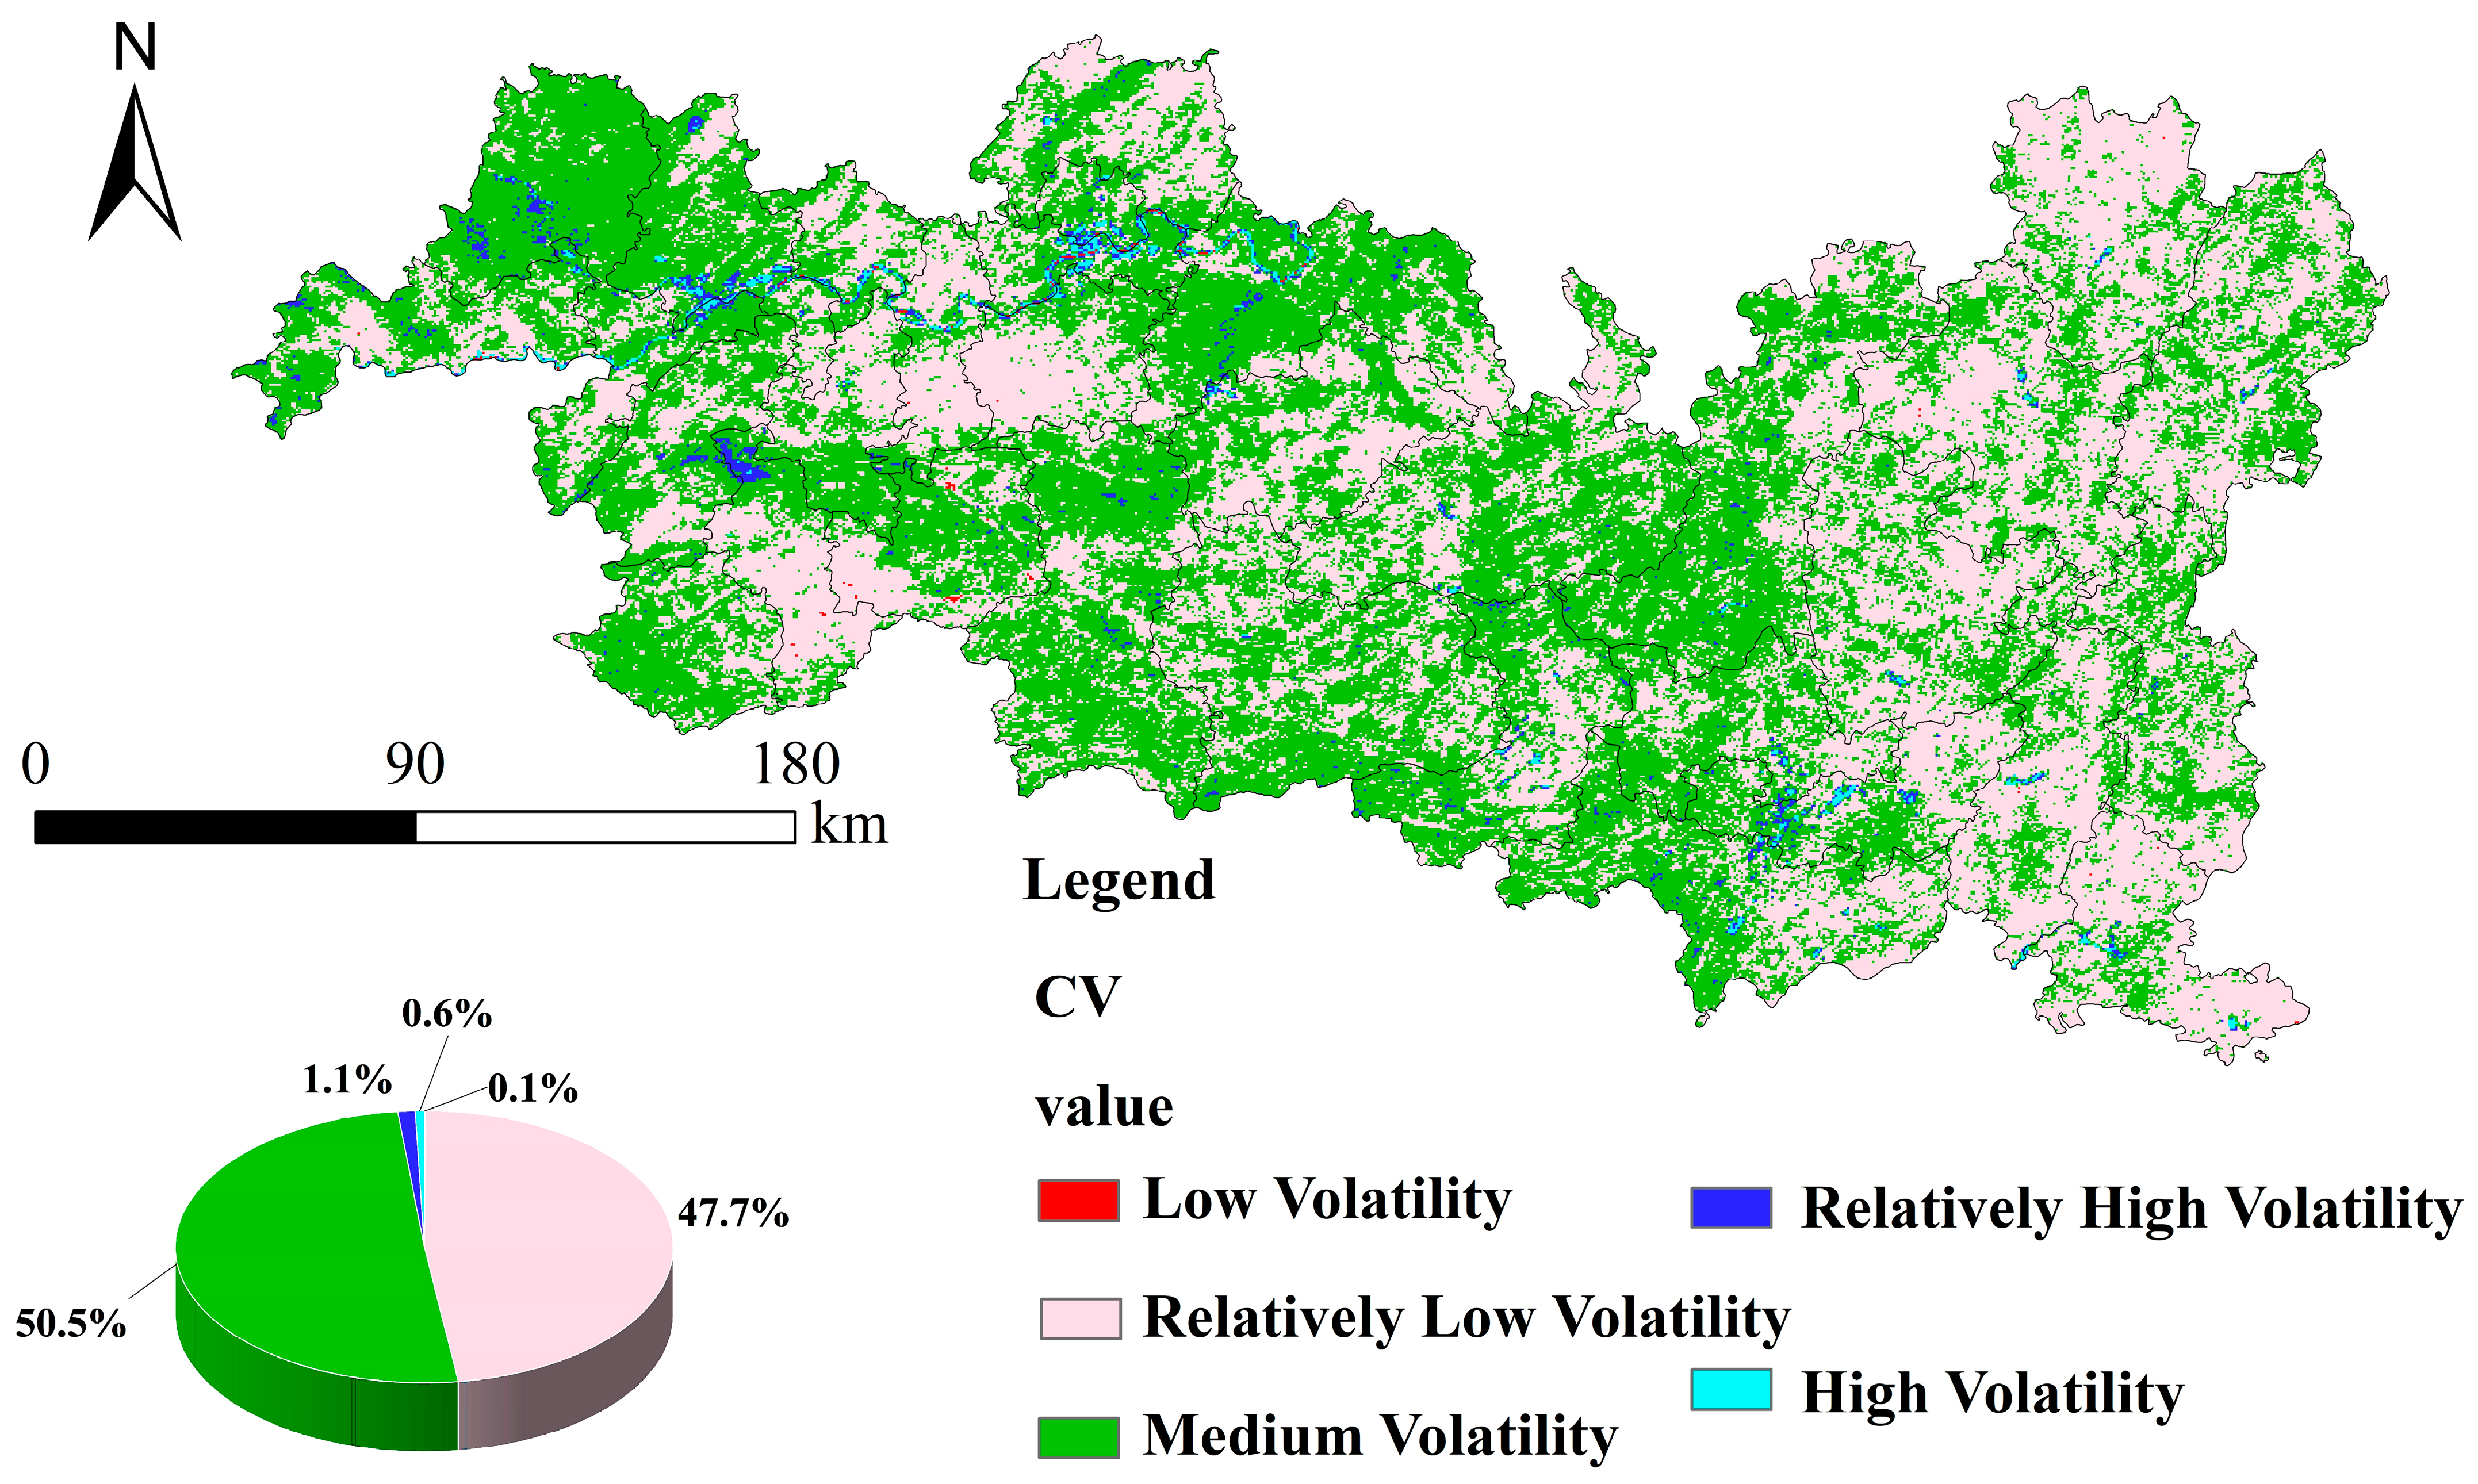
3.3. Volatility of Vegetation NDVI
3.4. Analysis of Driving Factors Influencing Vegetation NDVI Changes
3.4.1. Factor Detection
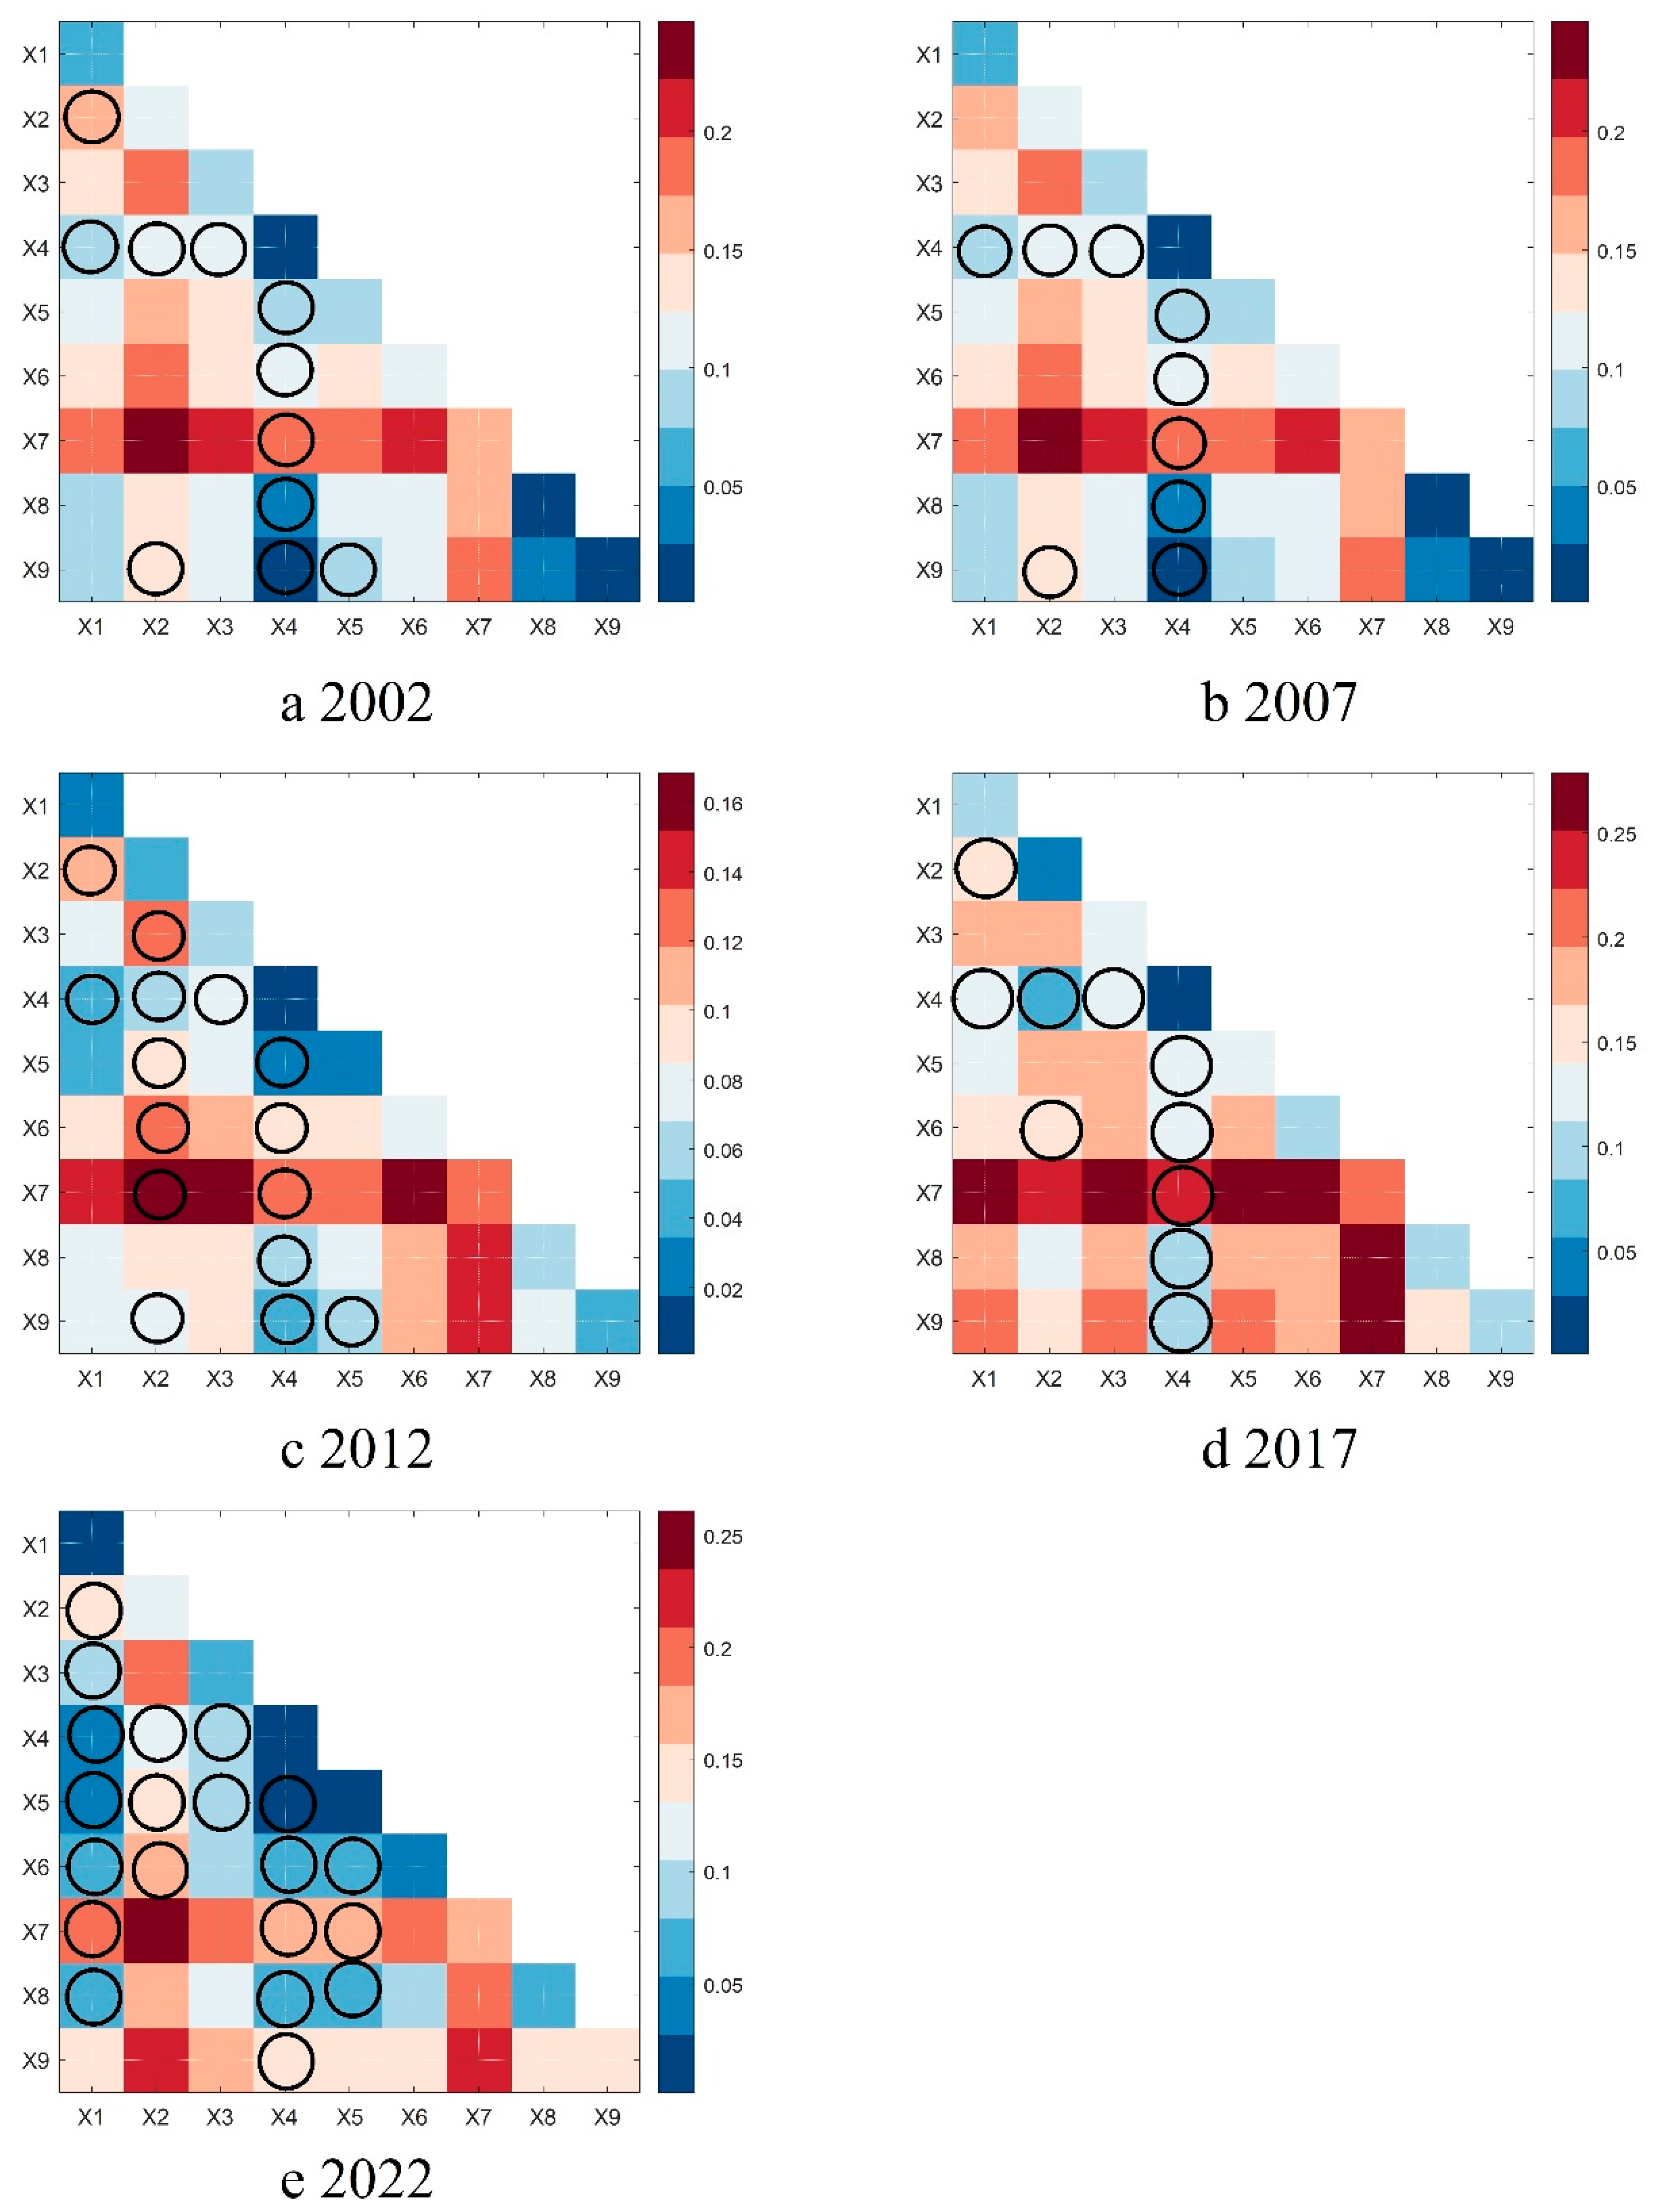
3.4.2. Interaction Detection
3.4.3. Ecological Detection
4. Discussion
4.1. Spatiotemporal Evolution of Vegetation NDVI and Its Ecological Significance
4.2. Driving Mechanisms of Vegetation NDVI: Interaction Between Natural Environment and Human Activities
4.2.1. Dominant Role of Natural Factors
4.2.2. Enhanced Role of Human Activities
4.3. Limitations of This Study
4.3.1. Limitations of Data Accuracy
4.3.2. Incomplete Collection of Influencing Factors
5. Conclusions and Policy Recommendations
5.1. Conclusions
- (1)
- Overall upward trend in vegetation NDVI with phased fluctuations and spatial heterogeneity: Between 2002 and 2022, the mean NDVI in the BGT region increased from 0.45 to 0.67, reflecting a general improvement in vegetation conditions. However, transient declines observed in 2006 and 2011 may be attributable to extreme climatic events or shifts in land use. High vegetation coverage was predominantly concentrated in ecologically advantageous high-altitude forested areas, whereas reductions in vegetation were more pronounced in zones undergoing urban expansion.
- (2)
- Precipitation and topography as dominant natural drivers of vegetation dynamics: Precipitation emerged as the most influential factor affecting NDVI variations. High-altitude zones, characterized by extensive forest cover and favorable climatic conditions, exhibited relatively stable NDVI values. In contrast, low-altitude areas, subject to intensified human interference, displayed greater vegetation fluctuations.
- (3)
- Increasing impact of human activities, with land use and urbanization as pivotal factors: Land use change demonstrated the strongest explanatory power for NDVI variations. The expansion of urban areas, evidenced by increased land conversion and a rising night-time light index, highlights the growing influence of economic development on vegetation cover in the BGT region. This impact was particularly notable in industrial agglomeration zones, where the positive effects of vegetation recovery were partially constrained.
- (4)
- Interactive effects of natural and anthropogenic factors shaping regional vegetation patterns: A nonlinear interaction between night-time light and precipitation indicates that urban expansion not only directly impacts vegetation but may also indirectly modify ecosystems by altering hydrological and climatic processes. This interaction exacerbates the spatial differentiation of vegetation across the region.
5.2. Policy Suggestions
Author Contributions
Funding
Data Availability Statement
Acknowledgments
Conflicts of Interest
References
- Wu, Z.; Lai, X.; Li, K. Water Quality Assessment of Rivers in Lake Chaohu Basin (China) Using Water Quality Index. Ecol. Indic. 2021, 121, 107021. [Google Scholar] [CrossRef]
- Wu, X.; Zhao, X.; Wang, L.; Chen, B.; Li, F.; Tang, Z.; Wu, F. Unraveling the Regional Environmental Ecology Dominated Baijiu Fermentation Microbial Community Succession and Associated Unique Flavor. Front. Microbiol. 2024, 15, 1487359. [Google Scholar] [CrossRef] [PubMed]
- Liu, D.; Zhang, P.; Chen, D.; Howell, K. From the Vineyard to the Winery: How Microbial Ecology Drives Regional Distinctiveness of Wine. Front. Microbiol. 2019, 10, 02679. [Google Scholar] [CrossRef]
- Wood, A.; Gascoigne, S.J.L.; Gambetta, G.A.; Jeffers, E.S.; Coulson, T. Seasonal Weather Impacts Wine Quality in Bordeaux. iScience 2023, 26, 107954. [Google Scholar] [CrossRef]
- Visser-Quinn, A.; Beevers, L.; Lau, T.; Gosling, R. Mapping Future Water Scarcity in a Water Abundant Nation: Near-Term Projections for Scotland. Clim. Risk Manag. 2021, 32, 100302. [Google Scholar] [CrossRef]
- Meier-Augenstein, W.; Kemp, H.F.; Hardie, S.M.L. Detection of Counterfeit Scotch Whisky by 2H and 18O Stable Isotope Analysis. Food Chem. 2012, 133, 1070–1074. [Google Scholar] [CrossRef]
- Sato, J.; Kohsaka, R. Japanese sAke and Evolution of Technology: A Comparative View with Wine and Its Implications for Regional Branding and Tourism. J. Ethn. Foods 2017, 4, 88–93. [Google Scholar] [CrossRef]
- Kodama, T. GIs and the Concept of Terroir for the Development of Local Wine and Sake Clusters in Japan. BIO Web Conf. 2019, 15, 03006. [Google Scholar] [CrossRef]
- Liu, Y.; Sun, M.; Hou, P.; Wang, W.; Shen, X.; Zhang, L.; Han, S.; Pan, C. Analysis of Microbial Community Structure and Volatile Compounds in Pit Mud Used for Manufacturing Taorong-Type Baijiu Based on High-Throughput Sequencing. Sci. Rep. 2022, 12, 7347. [Google Scholar] [CrossRef]
- Zhao, W.; Liu, Y.; Zhou, K.; Li, K.; Shen, J. How Sorghum Grain Composition Affects the Quality of Chinese Baijiu—A Comprehensive Review. J. Food Compos. Anal. 2024, 134, 106512. [Google Scholar] [CrossRef]
- Huang, H.; Wu, Y.; Chen, H.; Hou, Y.; Wang, J.; Hong, J.; Zhao, D.; Sun, J.; Huang, M.; Sun, B. Identification of Regionalmarkers Based on the Flavor Molecular Matrix Analysis of Sauce-Aroma Style Baijiu. J. Sci. Food Agric. 2023, 103, 7434–7444. [Google Scholar] [CrossRef] [PubMed]
- Chen, J.; Zhang, Y.; Kuzyakov, Y.; Wang, D.; Olesen, J.E. Challenges in Upscaling Laboratory Studies to Ecosystems in Soil Microbiology Research. Glob. Change Biol. 2023, 29, 569–574. [Google Scholar] [CrossRef] [PubMed]
- Hazard, C.; Prosser, J.I.; Nicol, G.W. Use and Abuse of Potential Rates in Soil Microbiology. Soil Biol. Biochem. 2021, 157, 108242. [Google Scholar] [CrossRef]
- Paul, E.A. Chapter 1—Continuing Our Excellence in Soil Microbiology, Ecology, and Biochemistry and Using It to Achieve a Sustainable Future. In Soil Microbiology, Ecology and Biochemistry, 5th ed.; Paul, E.A., Frey, S.D., Eds.; Elsevier: Amsterdam, The Netherlands, 2024; pp. 1–12. ISBN 978-0-12-822941-5. [Google Scholar]
- Li, Y.; Cheng, Y.; Wang, H.; Hu, X.; Wang, L.; Huang, Y. Diverse Structure and Characteristics of the Fungal Community during the Different Rounds of Jiang-Flavoured Baijiu Production in Moutai Town. LWT 2022, 161, 113313. [Google Scholar] [CrossRef]
- Zhan, J.; Wu, Z. Effects of Liquor Production Wastewater Discharge on Water Quality and Health Risks in the Chishui River Basin, Southwest China. J. Clean. Prod. 2023, 418, 138136. [Google Scholar] [CrossRef]
- Asadollah, S.B.H.S.; Sharafati, A.; Motta, D.; Yaseen, Z.M. River Water Quality Index Prediction and Uncertainty Analysis: A Comparative Study of Machine Learning Models. J. Environ. Chem. Eng. 2021, 9, 104599. [Google Scholar] [CrossRef]
- Zhou, R.; Zhou, R.; Wang, P.; Xian, Y.; Mai-Prochnow, A.; Lu, X.; Cullen, P.J.; Ostrikov, K.; Bazaka, K. Plasma Activated Water (PAW): Generation, Origin of Reactive Species and Biological Applications. J. Phys. D Appl. Phys. 2020, 53, 303001. [Google Scholar] [CrossRef]
- Motazedian, A.; Coutts, A.M.; Tapper, N.J. The Microclimatic Interaction of a Small Urban Park in Central Melbourne with Its Surrounding Urban Environment during Heat Events. Urban For. Urban Green. 2020, 52, 126688. [Google Scholar] [CrossRef]
- Kousis, I.; Pigliautile, I.; Pisello, A.L. Intra-Urban Microclimate Investigation in Urban Heat Island through a Novel Mobile Monitoring System. Sci. Rep. 2021, 11, 9732. [Google Scholar] [CrossRef]
- Yang, S.; Wang, L.; Stathopoulos, T.; Marey, A.M. Urban Microclimate and Its Impact on Built Environment—A Review. Build. Environ. 2023, 238, 110334. [Google Scholar] [CrossRef]
- Fung, T.; Siu, W. Environmental Quality and Its Changes, an Analysis Using NDVI. Int. J. Remote Sens. 2000, 21, 1011–1024. [Google Scholar] [CrossRef]
- Resende Vieira, F.; Christofaro, C. Contributions of the Vegetation Index (NDVI) in Water Quality Prediction Models in a Semi-Arid Tropical Watershed. J. Arid Environ. 2024, 220, 105122. [Google Scholar] [CrossRef]
- Wang, X.; Yao, X.; Jiang, C.; Duan, W. Dynamic Monitoring and Analysis of Factors Influencing Ecological Environment Quality in Northern Anhui, China, Based on the Google Earth Engine. Sci. Rep. 2022, 12, 20307. [Google Scholar] [CrossRef]
- Matas-Granados, L.; Pizarro, M.; Cayuela, L.; Domingo, D.; Gómez, D.; García, M.B. Long-Term Monitoring of NDVI Changes by Remote Sensing to Assess the Vulnerability of Threatened Plants. Biol. Conserv. 2022, 265, 109428. [Google Scholar] [CrossRef]
- Zhang, Y.; Wang, X.; Li, C.; Cai, Y.; Yang, Z.; Yi, Y. NDVI Dynamics under Changing Meteorological Factors in a Shallow Lake in Future Metropolitan, Semiarid Area in North China. Sci. Rep. 2018, 8, 15971. [Google Scholar] [CrossRef]
- Yang, J.; Yan, D.; Yu, Z.; Wu, Z.; Wang, H.; Liu, W.; Liu, S.; Yuan, Z. NDVI Variations of Different Terrestrial Ecosystems and Their Response to Major Driving Factors on Two Side Regions of the Hu-Line. Ecol. Indic. 2024, 159, 111667. [Google Scholar] [CrossRef]
- Guo, Y.; Wu, Z.; Zheng, Z.; Li, X. An Optimal Multivariate-Stratification Geographical Detector Model for Revealing the Impact of Multi-Factor Combinations on the Dependent Variable. GIScience Remote Sens. 2024, 61, 2422941. [Google Scholar] [CrossRef]
- Qiao, Y.; Wang, X.; Han, Z.; Tian, M.; Wang, Q.; Wu, H.; Liu, F. Geodetector Based Identification of Influencing Factors on Spatial Distribution Patterns of Heavy Metals in Soil: A Case in the Upper Reaches of the Yangtze River, China. Appl. Geochem. 2022, 146, 105459. [Google Scholar] [CrossRef]
- Guo, Y.; Cheng, L.; Ding, A.; Yuan, Y.; Li, Z.; Hou, Y.; Ren, L.; Zhang, S. Geodetector Model-Based Quantitative Analysis of Vegetation Change Characteristics and Driving Forces: A Case Study in the Yongding River Basin in China. Int. J. Appl. Earth Obs. Geoinf. 2024, 132, 104027. [Google Scholar] [CrossRef]
- Liang, Y.; Xu, C. Knowledge Diffusion of Geodetector: A Perspective of the Literature Review and Geotree. Heliyon 2023, 9, e19651. [Google Scholar] [CrossRef]
- Yu, L.; Du, Z.; Li, X.; Zheng, J.; Zhao, Q.; Wu, H.; Weise, D.; Yang, Y.; Zhang, Q.; Li, X.; et al. Enhancing Global Agricultural Monitoring System for Climate-Smart Agriculture. Clim. Smart Agric. 2025, 2, 100037. [Google Scholar] [CrossRef]
- Milliet, E.; Plancherel, C.; Roulin, A.; Butera, F. The Effect of Collaboration on Farmers’ pro-Environmental Behaviors—A Systematic Review. J. Environ. Psychol. 2024, 93, 102223. [Google Scholar] [CrossRef]
- Shen, J.; Zhu, Q.; Jiao, X.; Ying, H.; Wang, H.; Wen, X.; Xu, W.; Li, T.; Cong, W.; Liu, X.; et al. Agriculture Green Development: A Model for China and the World. Front. Agric. Sci. Eng. 2020, 7, 5–13. [Google Scholar] [CrossRef]
- Deines, J.M.; Guan, K.; Lopez, B.; Zhou, Q.; White, C.S.; Wang, S.; Lobell, D.B. Recent Cover Crop Adoption Is Associated with Small Maize and Soybean Yield Losses in the United States. Glob. Change Biol. 2023, 29, 794–807. [Google Scholar] [CrossRef]
- Zhang, B.; Liu, Y.; Du, S.; Chen, D.; Li, X.; Liu, T.; Cao, J.; Zhang, Z. Driving Mechanisms of Ecological Suitability Index in the Yellow River Basin from 1990 to 2020. Sustainability 2025, 17, 1307. [Google Scholar] [CrossRef]
- Islam, M.Z.; Wang, S. Exploring the Unique Characteristics of Environmental Sustainability in China: Navigating Future Challenges. Chin. J. Popul. Resour. Environ. 2023, 21, 37–42. [Google Scholar] [CrossRef]
- Liu, Y.; Yang, S.; Han, C.; Ni, W.; Zhu, Y. Variability in Regional Ecological Vulnerability: A Case Study of Sichuan Province, China. Int. J. Disaster Risk Sci. 2020, 11, 696–708. [Google Scholar] [CrossRef]
- A Dynamic Landsat Derived Normalized Difference Vegetation Index (NDVI) Product for the Conterminous United States. Available online: https://www.mdpi.com/2072-4292/9/8/863 (accessed on 13 May 2025).
- Tan, K.C.; Lim, H.S.; Matjafri, M.Z.; Abdullah, K. A Comparison of Radiometric Correction Techniques in the Evaluation of the Relationship between LST and NDVI in Landsat Imagery. Environ. Monit. Assess. 2012, 184, 3813–3829. [Google Scholar] [CrossRef]
- Chen, X.; Vierling, L.; Deering, D. A Simple and Effective Radiometric Correction Method to Improve Landscape Change Detection across Sensors and across Time. Remote Sens. Environ. 2005, 98, 63–79. [Google Scholar] [CrossRef]
- Guyot, G.; Gu, X.-F. Effect of Radiometric Corrections on NDVI-Determined from SPOT-HRV and Landsat-TM Data. Remote Sens. Environ. 1994, 49, 169–180. [Google Scholar] [CrossRef]
- Gandhi, G.M.; Parthiban, S.; Thummalu, N.; Christy, A. Ndvi: Vegetation Change Detection Using Remote Sensing and Gis—A Case Study of Vellore District. Procedia Comput. Sci. 2015, 57, 1199–1210. [Google Scholar] [CrossRef]
- Mehmood, K.; Anees, S.A.; Muhammad, S.; Hussain, K.; Shahzad, F.; Liu, Q.; Ansari, M.J.; Alharbi, S.A.; Khan, W.R. Analyzing Vegetation Health Dynamics across Seasons and Regions through NDVI and Climatic Variables. Sci. Rep. 2024, 14, 11775. [Google Scholar] [CrossRef]
- Miao, W.; Chen, Y.; Kou, W.; Lai, H.; Sazal, A.; Wang, J.; Li, Y.; Hu, J.; Wu, Y.; Zhao, T. The HANTS-Fitted RSEI Constructed in the Vegetation Growing Season Reveals the Spatiotemporal Patterns of Ecological Quality. Sci. Rep. 2024, 14, 14686. [Google Scholar] [CrossRef]
- Mohsin, T.; Gough, W.A. Trend Analysis of Long-Term Temperature Time Series in the Greater Toronto Area (GTA). Theor. Appl. Clim. 2010, 101, 311–327. [Google Scholar] [CrossRef]
- Ding, Y.; Feng, Y.; Chen, K.; Zhang, X. Analysis of Spatial and Temporal Changes in Vegetation Cover and Its Drivers in the Aksu River Basin, China. Sci. Rep. 2024, 14, 10165. [Google Scholar] [CrossRef]
- Chang, L.; Li, Y.; Zhang, K.; Zhang, J.; Li, Y. Temporal and Spatial Variation in Vegetation and Its Influencing Factors in the Songliao River Basin, China. Land 2023, 12, 1692. [Google Scholar] [CrossRef]
- Liu, C.; Zhang, X.; Wang, T.; Chen, G.; Zhu, K.; Wang, Q.; Wang, J. Detection of Vegetation Coverage Changes in the Yellow River Basin from 2003 to 2020. Ecol. Indic. 2022, 138, 108818. [Google Scholar] [CrossRef]
- Yao, B.; Gong, X.; Li, Y.; Li, Y.; Lian, J.; Wang, X. Spatiotemporal Variation and GeoDetector Analysis of NDVI at the Northern Foothills of the Yinshan Mountains in Inner Mongolia over the Past 40 Years. Heliyon 2024, 10, e39309. [Google Scholar] [CrossRef]
- Huang, Y.; Jin, Y.; Chen, S. The Spatiotemporal Dynamics of Vegetation Cover and Its Response to the Grain for Green Project in the Loess Plateau of China. Forests 2024, 15, 1949. [Google Scholar] [CrossRef]
- Liu, D.; Pan, P.; Fu, J.; Ouyang, X. Spatiotemporal Variation and Driving Factor of Vegetation Coverage from 2000 to 2020 in Southern Jiangxi Province, China. Chin. J. Appl. Ecol. 2023, 34, 2919. [Google Scholar] [CrossRef]
- Shrestha, B.; Zhang, L.; Shrestha, S.; Khadka, N.; Maharjan, L. Spatiotemporal Patterns, Sustainability, and Primary Drivers of NDVI-Derived Vegetation Dynamics (2003–2022) in Nepal. Environ. Monit. Assess. 2024, 196, 607. [Google Scholar] [CrossRef] [PubMed]
- Xu, Q.; Li, J.; Zhang, S.; Yuan, Q.; Ren, P. Spatio-Temporal Changes and Driving Mechanisms of Vegetation Net Primary Productivity in Xinjiang, China from 2001 to 2022. Land 2024, 13, 1305. [Google Scholar] [CrossRef]
- Li, L.; Zhang, Y.; Liu, L.; Wu, J.; Wang, Z.; Li, S.; Zhang, H.; Zu, J.; Ding, M.; Paudel, B. Spatiotemporal Patterns of Vegetation Greenness Change and Associated Climatic and Anthropogenic Drivers on the Tibetan Plateau during 2000–2015. Remote Sens. 2018, 10, 1525. [Google Scholar] [CrossRef]
- Yang, S.; Zhao, Y.; Yang, D.; Lan, A. Analysis of Vegetation NDVI Changes and Driving Factors in the Karst Concentration Distribution Area of Asia. Forests 2024, 15, 398. [Google Scholar] [CrossRef]
- Yang, Y.; Wu, T.; Wang, S.; Li, J.; Muhanmmad, F. The NDVI-CV Method for Mapping Evergreen Trees in Complex Urban Areas Using Reconstructed Landsat 8 Time-Series Data. Forests 2019, 10, 139. [Google Scholar] [CrossRef]
- Huang, H.; Xi, G.; Ji, F.; Liu, Y.; Wang, H.; Xie, Y. Spatial and Temporal Variation in Vegetation Cover and Its Response to Topography in the Selinco Region of the Qinghai-Tibet Plateau. Remote Sens. 2023, 15, 4101. [Google Scholar] [CrossRef]
- Gao, W.; Zhou, S.; Yin, X. Spatio-Temporal Evolution Characteristics and Driving Factors of Typical Karst Rocky Desertification Area in the Upper Yangtze River. Sustainability 2024, 16, 2669. [Google Scholar] [CrossRef]
- He, Y.; Wang, L.; Niu, Z.; Nath, B. Vegetation Recovery and Recent Degradation in Different Karst Landforms of Southwest China over the Past Two Decades Using GEE Satellite Archives. Ecol. Inform. 2022, 68, 101555. [Google Scholar] [CrossRef]
- Huang, Y.; Li, X.; Liu, D.; Duan, B.; Huang, X.; Chen, S. Evaluation of Vegetation Restoration Effectiveness along the Yangtze River Shoreline and Its Response to Land Use Changes. Sci. Rep. 2024, 14, 7611. [Google Scholar] [CrossRef]
- Zhu, L.; Sun, S.; Li, Y.; Liu, X.; Hu, K. Effects of Climate Change and Anthropogenic Activity on the Vegetation Greening in the Liaohe River Basin of Northeastern China. Ecol. Indic. 2023, 148, 110105. [Google Scholar] [CrossRef]
- Lu, Q.; Zhang, Y.; Sun, W.; Wei, J.; Xu, K. From Mountains to Basins: Asymmetric Ecosystem Vulnerability and Adaptation to Extreme Climate Events in Southwestern China. Remote Sens. 2025, 17, 392. [Google Scholar] [CrossRef]
- Yao, N.; Huang, C.; Yang, J.; Konijnendijk van den Bosch, C.C.; Ma, L.; Jia, Z. Combined Effects of Impervious Surface Change and Large-Scale Afforestation on the Surface Urban Heat Island Intensity of Beijing, China Based on Remote Sensing Analysis. Remote Sens. 2020, 12, 3906. [Google Scholar] [CrossRef]
- Seifollahi-Aghmiuni, S.; Kalantari, Z.; Egidi, G.; Gaburova, L.; Salvati, L. Urbanisation-Driven Land Degradation and Socioeconomic Challenges in Peri-Urban Areas: Insights from Southern Europe. Ambio 2022, 51, 1446–1458. [Google Scholar] [CrossRef]
- Coseo, P.; Larsen, L. Accurate Characterization of Land Cover in Urban Environments: Determining the Importance of Including Obscured Impervious Surfaces in Urban Heat Island Models. Atmosphere 2019, 10, 347. [Google Scholar] [CrossRef]
- Liu, Z.; Zhang, Y. Vegetation Cover Change and Its Response to Human Activities in the Southwestern Karst Region of China. Front. Ecol. Evol. 2024, 12, 1326601. [Google Scholar] [CrossRef]
- Dong, X.; Zhou, Y.; Liang, J.; Zou, D.; Wu, J.; Wang, J. Assessment of Spatiotemporal Patterns and the Effect of the Relationship between Meteorological Drought and Vegetation Dynamics in the Yangtze River Basin Based on Remotely Sensed Data. Remote Sens. 2023, 15, 3641. [Google Scholar] [CrossRef]
- Jiang, W.; Niu, Z.; Wang, L.; Yao, R.; Gui, X.; Xiang, F.; Ji, Y. Impacts of Drought and Climatic Factors on Vegetation Dynamics in the Yellow River Basin and Yangtze River Basin, China. Remote Sens. 2022, 14, 930. [Google Scholar] [CrossRef]
- Ning, L.; Peng, W.; Yu, Y.; Xiang, J.; Wang, Y. Quantifying Vegetation Change and Driving Mechanism Analysis in Sichuan from 2000 to 2020. Front. Environ. Sci. 2023, 11, 1261295. [Google Scholar] [CrossRef]
- Chen, C.; Xu, Y. Spatial Heterogeneity of Human Activities and Its Driving Factors in Karst Areas of Southwest China over the Past 20 Years. Front. Environ. Sci. 2023, 11, 1225888. [Google Scholar] [CrossRef]
- Zhang, S.; Zhou, Y.; Yu, Y.; Li, F.; Zhang, R.; Li, W. Using the Geodetector Method to Characterize the Spatiotemporal Dynamics of Vegetation and Its Interaction with Environmental Factors in the Qinba Mountains, China. Remote Sens. 2022, 14, 5794. [Google Scholar] [CrossRef]
- Zhang, Y.; Zhang, L.; Wang, J.; Dong, G.; Wei, Y. Quantitative Analysis of NDVI Driving Factors Based on the Geographical Detector Model in the Chengdu-Chongqing Region, China. Ecol. Indic. 2023, 155, 110978. [Google Scholar] [CrossRef]
- Li, D.; Zhang, J. Measurement and Analysis of Ecological Pressure Due to Industrial Development in the Yangtze River Economic Belt From. J. Clean. Prod. 2022, 353, 131614. [Google Scholar] [CrossRef]
- Xu, G.; Fan, H.; Oliver, D.M.; Dai, Y.; Li, H.; Shi, Y.; Long, H.; Xiong, K.; Zhao, Z. Decoding River Pollution Trends and Their Landscape Determinants in an Ecologically Fragile Karst Basin Using a Machine Learning Model. Environ. Res. 2022, 214, 113843. [Google Scholar] [CrossRef]
- Xia, N.; Li, M.; Cheng, L. Mapping Impacts of Human Activities from Nighttime Light on Vegetation Cover Changes in Southeast Asia. Land 2021, 10, 185. [Google Scholar] [CrossRef]
- Guo, E.; Wang, Y.; Wang, C.; Sun, Z.; Bao, Y.; Mandula, N.; Jirigala, B.; Bao, Y.; Li, H. NDVI Indicates Long-Term Dynamics of Vegetation and Its Driving Forces from Climatic and Anthropogenic Factors in Mongolian Plateau. Remote Sens. 2021, 13, 688. [Google Scholar] [CrossRef]
- Xin, Z.; Xu, J.; Zheng, W. Spatiotemporal Variations of Vegetation Cover on the Chinese Loess Plateau (1981–2006): Impacts of Climate Changes and Human Activities. Sci. China Ser. D-Earth Sci. 2008, 51, 67–78. [Google Scholar] [CrossRef]
- Sari, N.M.; Chulafak, G.A.; Zylshal, Z.; Kushardono, D. The Relationship between the Mixed Pixel Spectral Value of Landsat 8 OLI Data and LAPAN Surveillance Aircraft (LSA) Aerial-Photo Data. Forum Geogr. 2017, 31, 83–98. [Google Scholar] [CrossRef]


| Data Type | Driving Factors | Year | Data Source | Data Accuracy |
|---|---|---|---|---|
| Climate | mean annual temperature | 2002~2022 | National Earth System Science Data Center (https://www.geodata.cn (accessed on 5 March 2024)) | 1 km |
| annual precipitation | 2002~2022 | |||
| Terrain | slope | 2009 | SRTM Dataset (https://openmaptiles.org/languages/zh/ (accessed on 25 May 2024)) | 500 m |
| aspect | 2009 | |||
| elevation | 2009 | |||
| Soil | soil data | 2011 | HWSD v1.2: World Soil Database HWSD v1.2 (http://webarchive.iiasa.ac.at/Research/LUC/External-World-soil-database (accessed on 20 April 2024)) | 500 m |
| Land use | land use | 2002~2022 | CLCD (China Land Cover Dataset) (https://zenodo.org/records/8176941 (accessed on 20 March 2024)) | 500 m |
| Human activities | population density | 2002~2022 | LandScan Global Population Dataset (https://landscan.ornl.gov/ (accessed on 13 May 2024)) | 500 m |
| night-time lights | 2002~2022 | Night-time Lights Dataset (http://geodata.nnu.edu.cn (accessed on 20 May 2024)) | 500 m |
| Determination | Interaction Effect |
|---|---|
| q (X1 ∩ X2) < min [q (X1), q (X2)] | Nonlinear attenuation |
| min [q (X1), q (X2)] < q (X1 ∩ X2) < max [q (X1), q (X2)] | Single-factor nonlinear attenuation |
| q (X1 ∩ X2) > max [q (X1), q (X2)] | Two-factor synergistic enhancement |
| q (X1 ∩ X2)= q (X1) + q (X2) | Independence |
| q (X1 ∩ X2) > q (X1) + q (X2) | Nonlinear amplification |
| Driving Factors | Codes | Units |
|---|---|---|
| mean annual temperature | X1 | °C |
| annual precipitation | X2 | mm |
| slope | X3 | ° |
| aspect | X4 | ° |
| elevation | X5 | m |
| soil data | X6 | / |
| land use | X7 | / |
| population density | X8 | person/km2 |
| night-time lights | X9 | lx |
| NDVI | Vegetation Condition Classification | Area Proportion of NDVI Classification/% | ||||
|---|---|---|---|---|---|---|
| 2002 | 2009 | 2015 | 2022 | Multi-Year Average | ||
| <0.2 | Low Coverage | 0.41 | 0.32 | 0.29 | 0.26 | 0.32 |
| 0.2~0.4 | Moderate–Low Coverage | 8.99 | 2.66 | 3.30 | 3.28 | 4.56 |
| 0.4~0.6 | Moderate–High Coverage | 88.92 | 89.84 | 86.79 | 81.96 | 86.88 |
| >0.6 | High Coverage | 1.68 | 7.18 | 9.62 | 14.50 | 8.25 |
| Z | Trend Characteristics | Area Proportion/% | |
|---|---|---|---|
| 2.58 < Z | Extremely significant decrease | 0.58 | |
| 1.96 < Z < 2.58 | Highly significant decrease | 0.41 | |
| 1.65 < Z < 1.96 | Moderately significant decrease | 0.21 | |
| Z < 1.65 | Non-significant decrease | 2.93 | |
| Z | No significant change | 0.04 | |
| Z < 1.65 | Non-significant increase | 19.14 | |
| 1.65 < Z < 1.96 | Marginally significant increase | 6.85 | |
| 1.96 < Z < 2.58 | Significant increase | 18.15 | |
| 2.58 < Z | Extremely significant increase | 51.68 |
| Driving Factor | X1 | X2 | X3 | X4 | X5 | X6 | X7 | X8 |
|---|---|---|---|---|---|---|---|---|
| X2 | Y | |||||||
| X3 | Y | N | ||||||
| X4 | N | Y | Y | |||||
| X5 | N | Y | Y | N | ||||
| X6 | N | Y | N | N | N | |||
| X7 | Y | Y | Y | Y | Y | Y | ||
| X8 | N | N | N | Y | N | N | Y | |
| X9 | Y | N | Y | Y | Y | Y | N | Y |
Disclaimer/Publisher’s Note: The statements, opinions and data contained in all publications are solely those of the individual author(s) and contributor(s) and not of MDPI and/or the editor(s). MDPI and/or the editor(s) disclaim responsibility for any injury to people or property resulting from any ideas, methods, instructions or products referred to in the content. |
© 2025 by the authors. Licensee MDPI, Basel, Switzerland. This article is an open access article distributed under the terms and conditions of the Creative Commons Attribution (CC BY) license (https://creativecommons.org/licenses/by/4.0/).
Share and Cite
Zhang, M.; Deng, Y.; Hai, Y.; Chen, H.; Ma, A.; Wang, W.; Ming, L.; Dang, H.; Peng, M.; Jize, D.; et al. Monitoring Vegetation Dynamics and Driving Forces in the Baijiu Golden Triangle Using Multi-Decadal Landsat NDVI and Geodetector Modeling. Land 2025, 14, 1111. https://doi.org/10.3390/land14051111
Zhang M, Deng Y, Hai Y, Chen H, Ma A, Wang W, Ming L, Dang H, Peng M, Jize D, et al. Monitoring Vegetation Dynamics and Driving Forces in the Baijiu Golden Triangle Using Multi-Decadal Landsat NDVI and Geodetector Modeling. Land. 2025; 14(5):1111. https://doi.org/10.3390/land14051111
Chicago/Turabian StyleZhang, Miao, Yuanjie Deng, Yifeng Hai, Hang Chen, Aiting Ma, Wenjing Wang, Lu Ming, Huae Dang, Minghong Peng, Dingdi Jize, and et al. 2025. "Monitoring Vegetation Dynamics and Driving Forces in the Baijiu Golden Triangle Using Multi-Decadal Landsat NDVI and Geodetector Modeling" Land 14, no. 5: 1111. https://doi.org/10.3390/land14051111
APA StyleZhang, M., Deng, Y., Hai, Y., Chen, H., Ma, A., Wang, W., Ming, L., Dang, H., Peng, M., Jize, D., Jiao, C., & Zhang, M. (2025). Monitoring Vegetation Dynamics and Driving Forces in the Baijiu Golden Triangle Using Multi-Decadal Landsat NDVI and Geodetector Modeling. Land, 14(5), 1111. https://doi.org/10.3390/land14051111