

Spatial Representation of Soil Erosion and Vegetation Affected by a Forest Fire in the Sierra de Francia (Spain) Using RUSLE and NDVI

Abstract
1. Introduction
- -
- To analyse the variation in organic matter content, sands, clays, silts and pH of the soils affected by the fire, before and after the event.
- -
- To draw up cartographies reflecting the evolution of the soil–flora dynamics resulting from this event.
- -
- To calculate the percentage of erosion in the study area, using the data obtained in the analyses carried out before and after the fire, thus making it possible to assess whether the consequences of the fire have led to an increase in soil erosion.
2. Materials and Methods
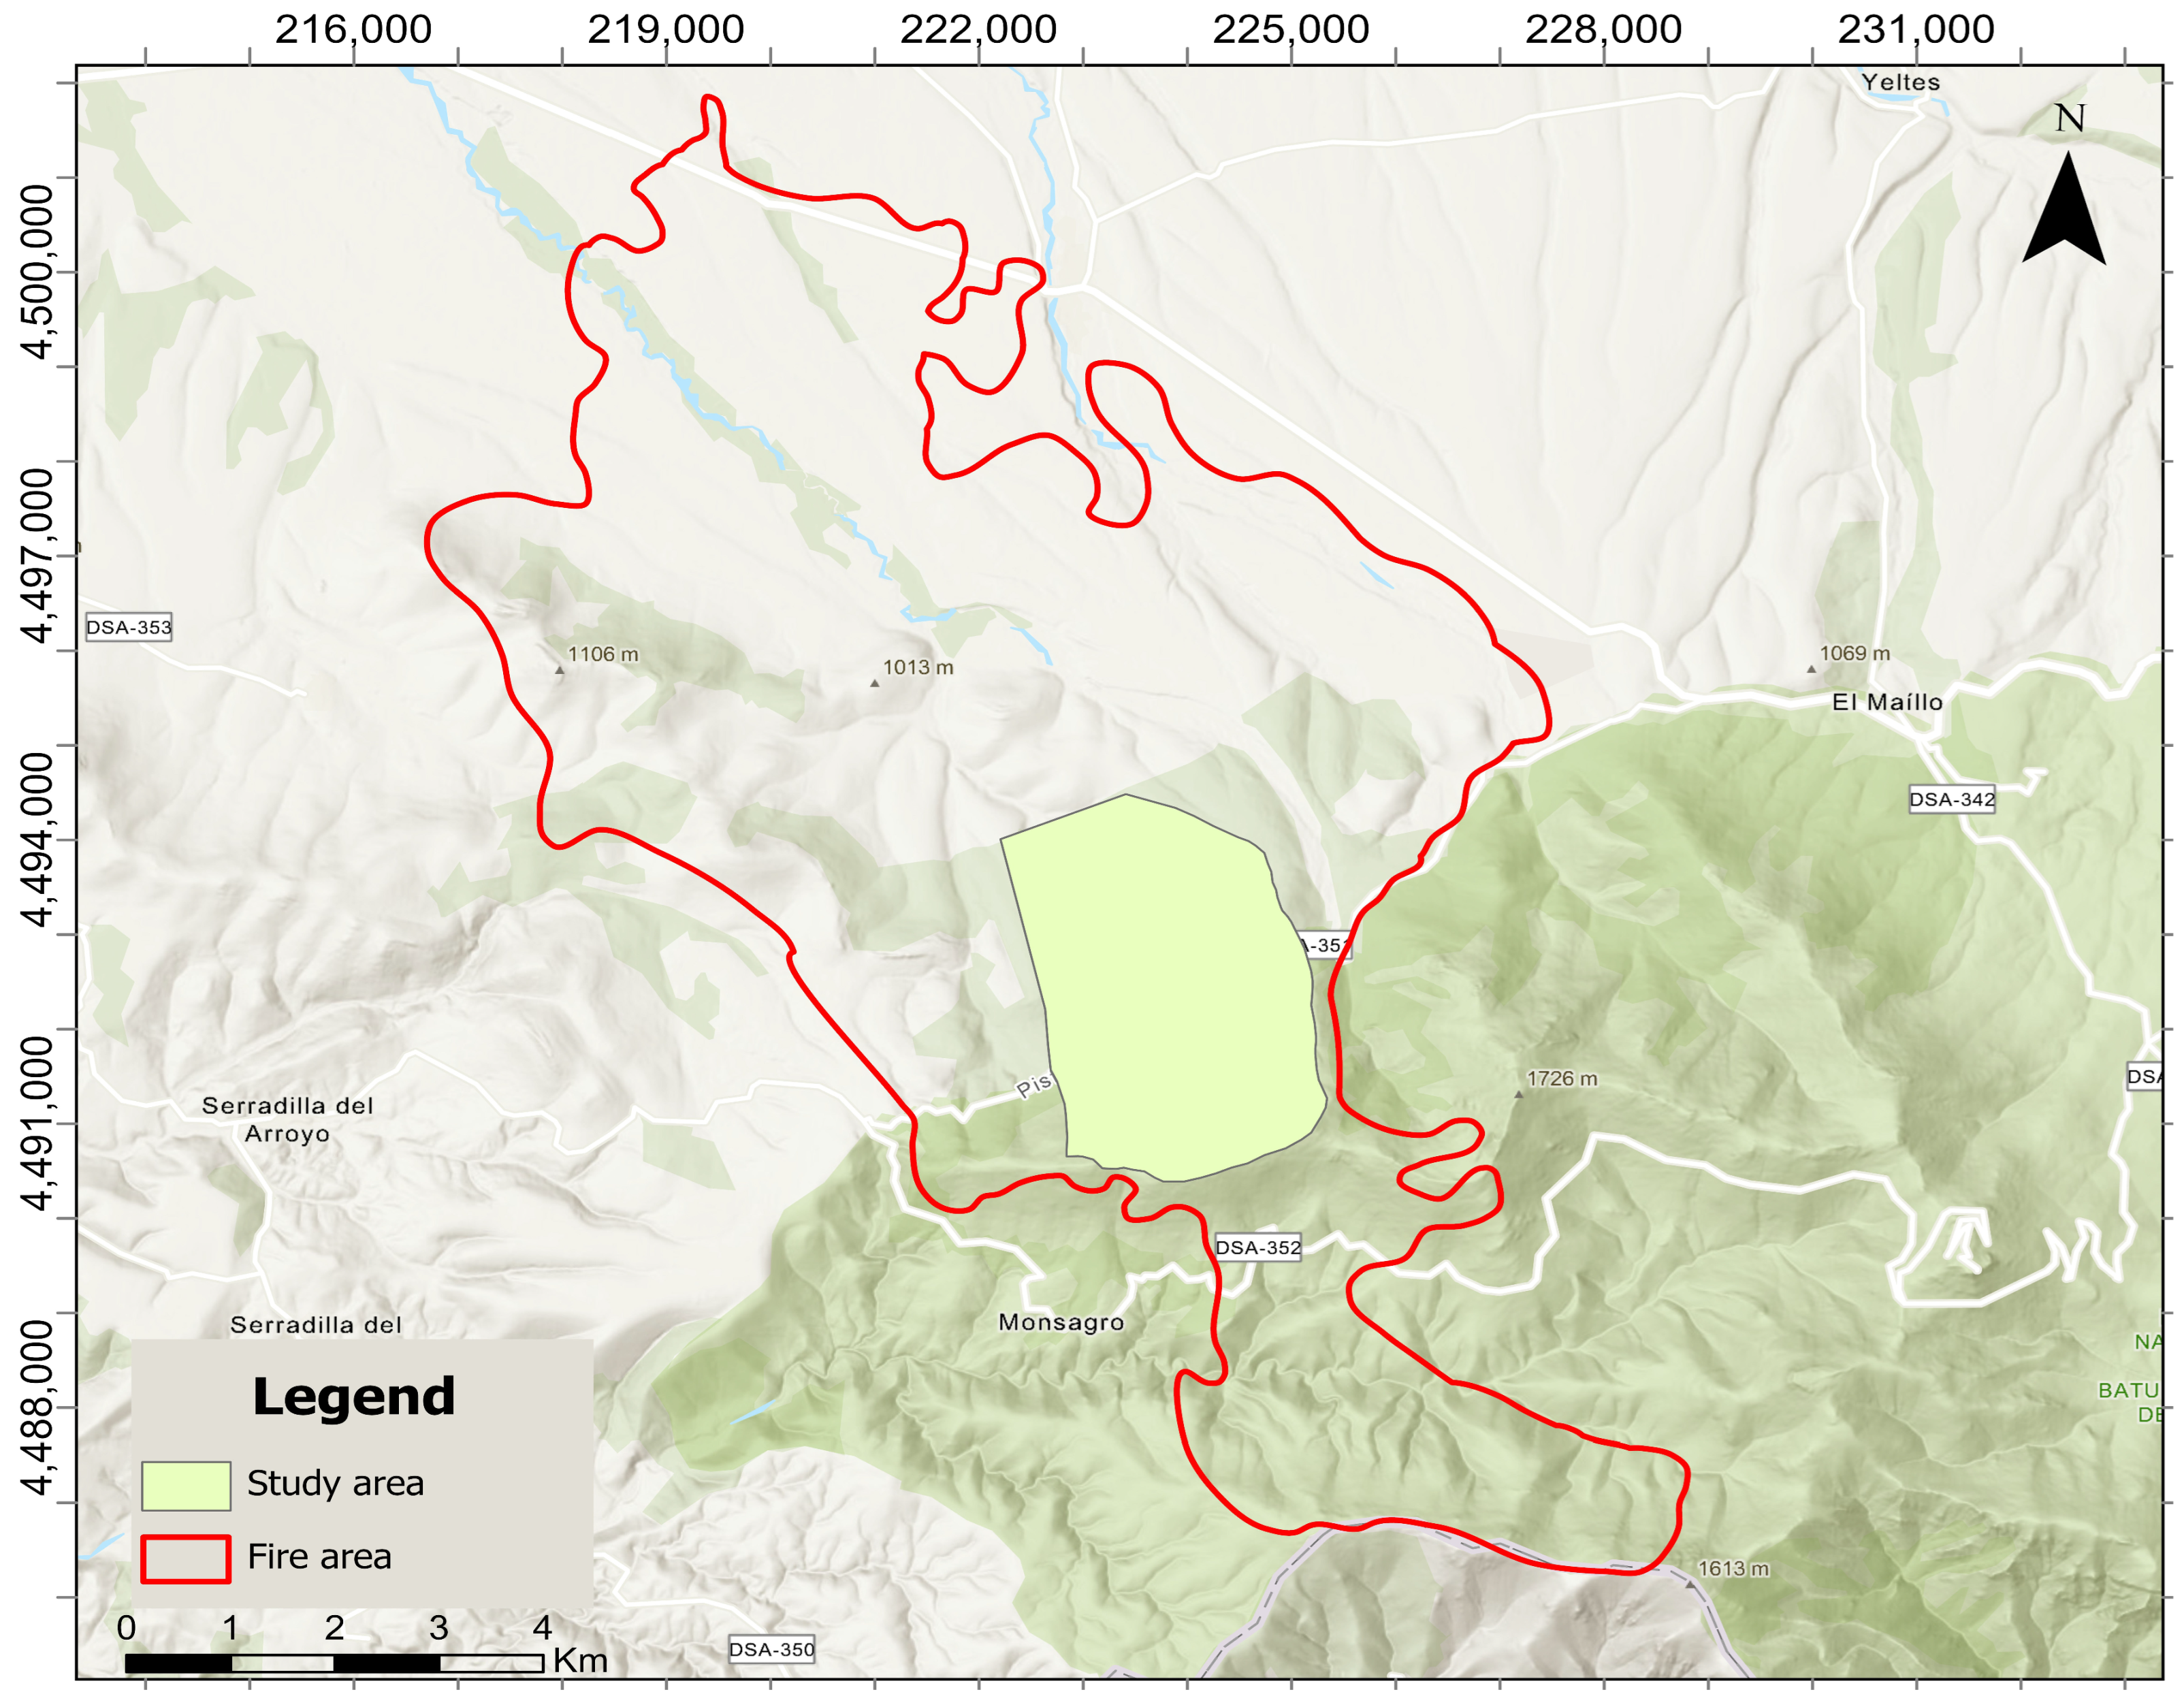
2.1. Study Area
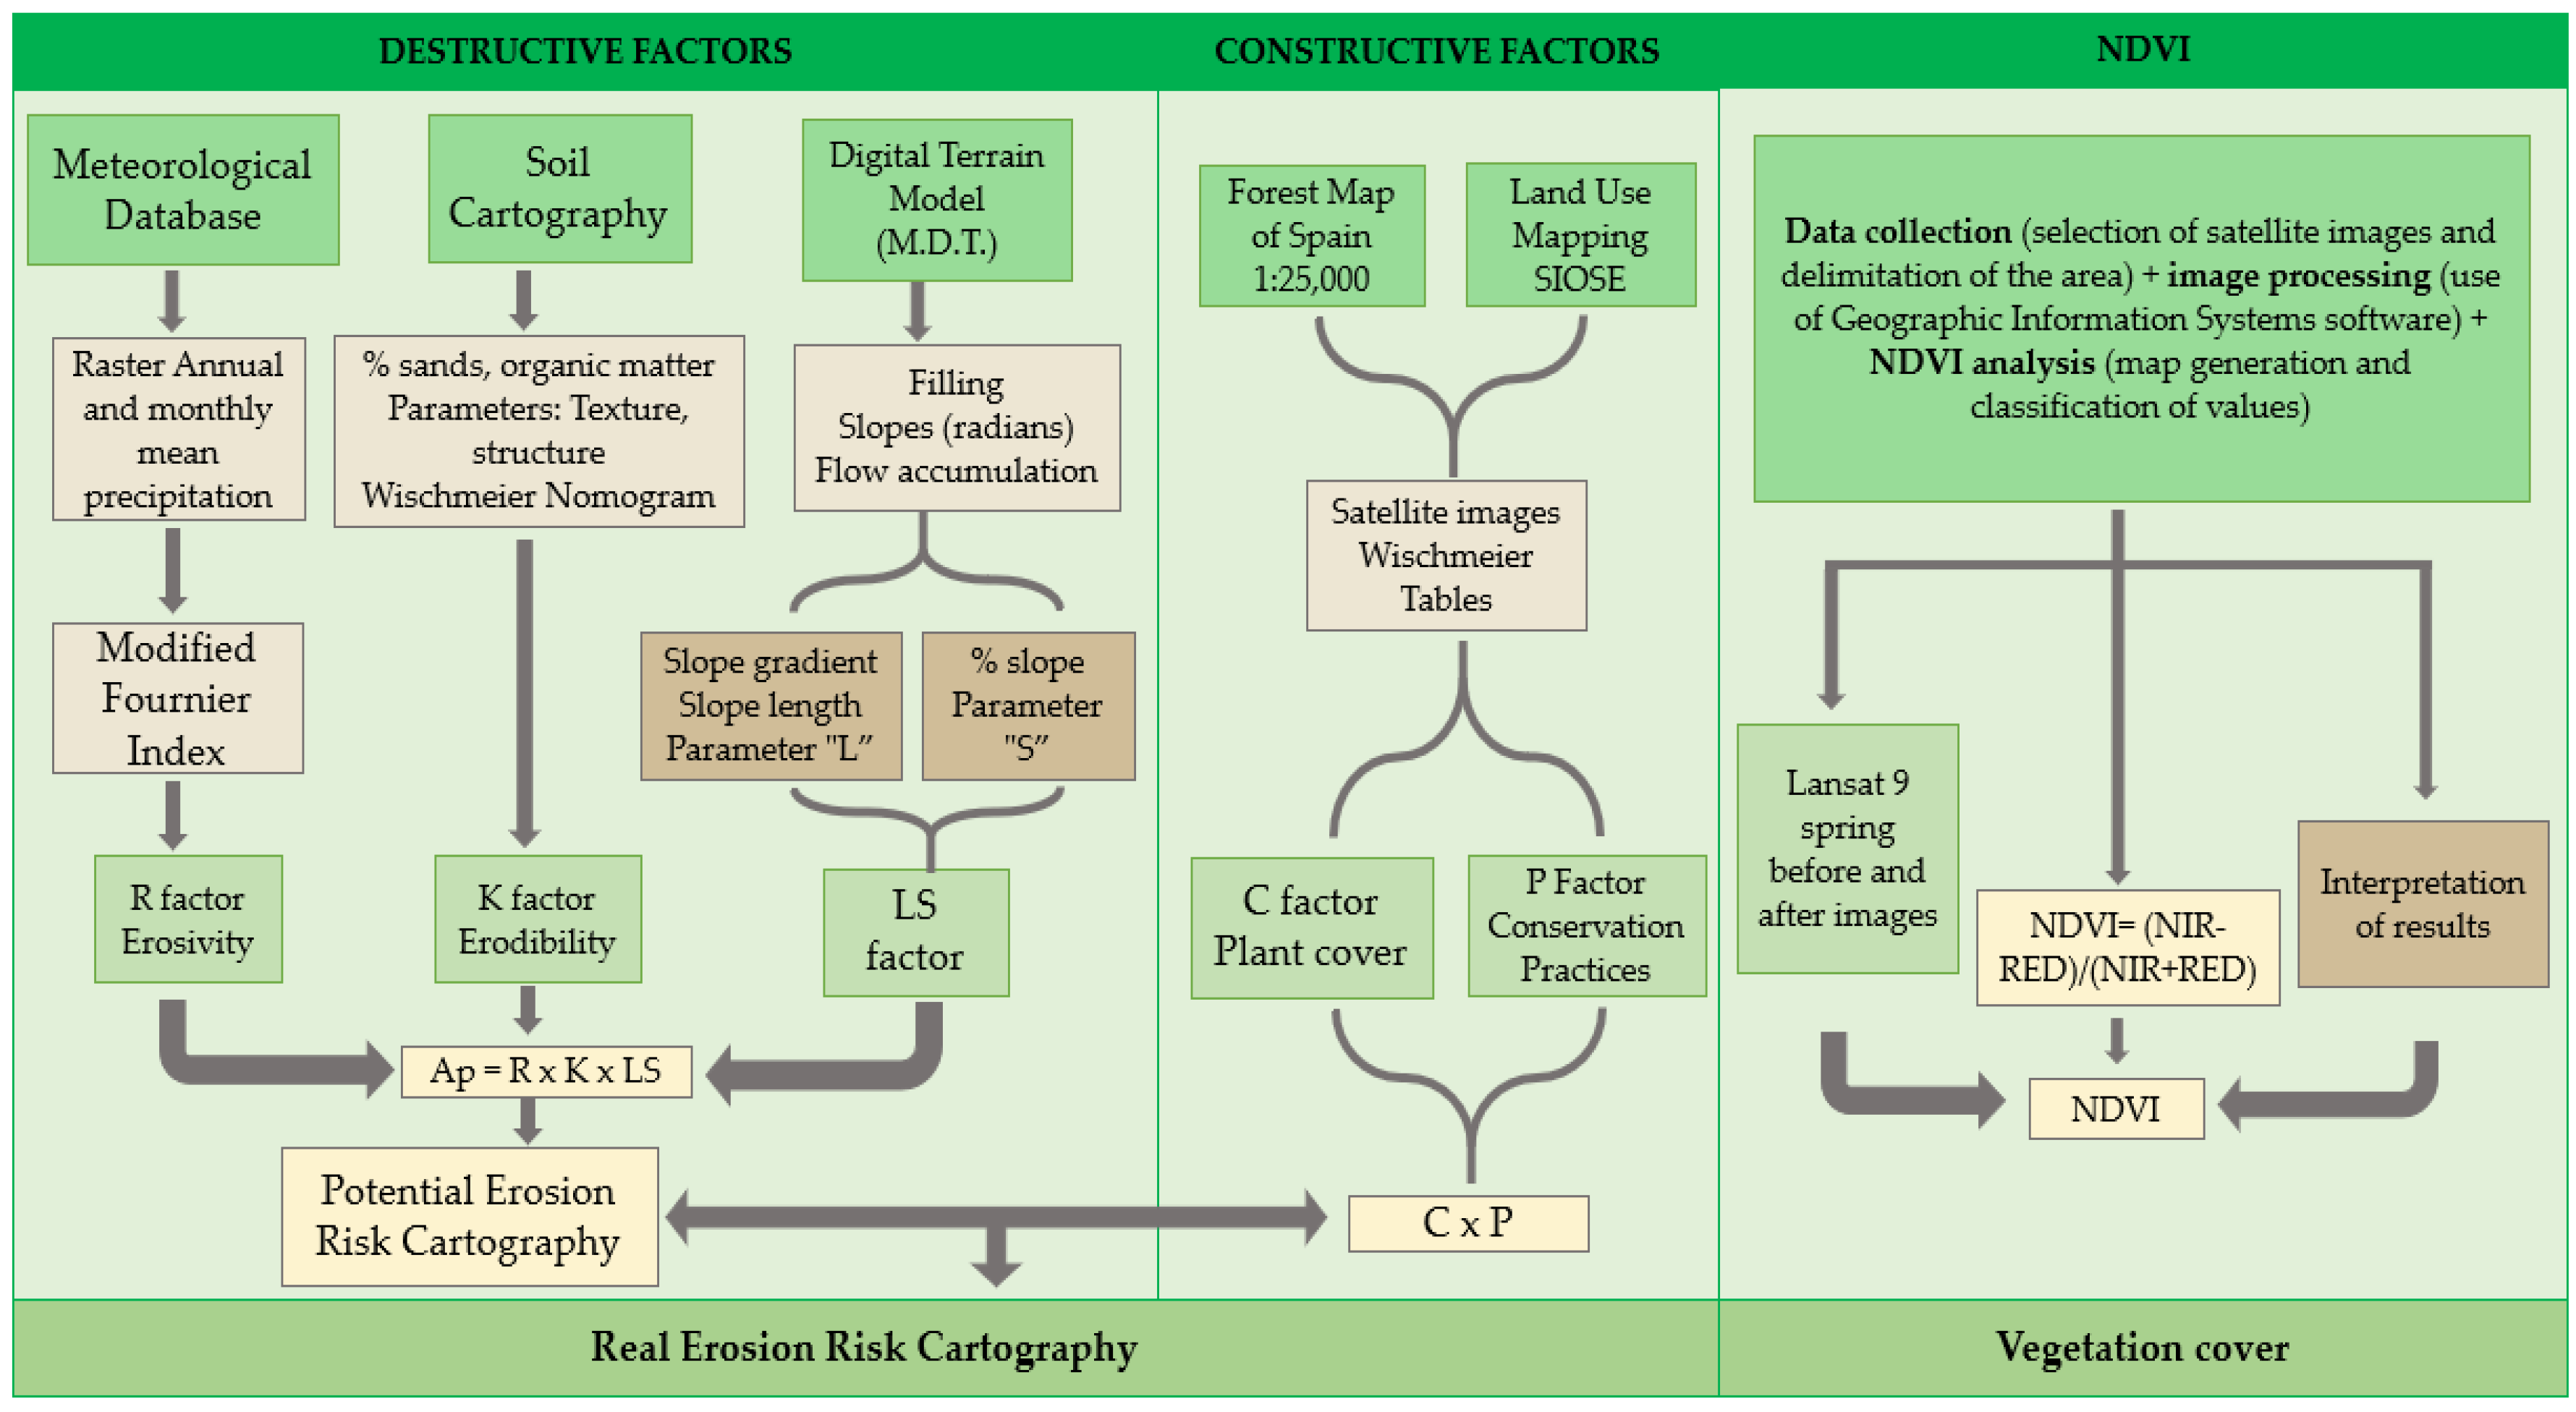
2.2. Methodology
- -
- Meteorological data: Average and annual rainfall from the 3 meteorological stations located in the study area. These data require a continuous record of rainfall intensity variations and has been obtained from the database of the Geographic Information System for Agricultural Data (SIGA).
- -
- Digital terrain models: These have an accuracy of 1 × 1 m per pixel and have been downloaded from the IGN.
- -
- Satellite images: Obtained from the Spanish Geographic Institute.
- -
- Soil data: These were obtained from the physico-chemical analyses carried out in the laboratory of the 5 soil profiles taken in the study area. For the pre-fire data, data from two studies [42,43] have been used and have been contrasted with others carried out later that, due to conflicts of interest, cannot be published, showing their accuracy.
2.3. Determination of Physico-Chemical Properties
2.4. Determination of Soil Erosion Rate
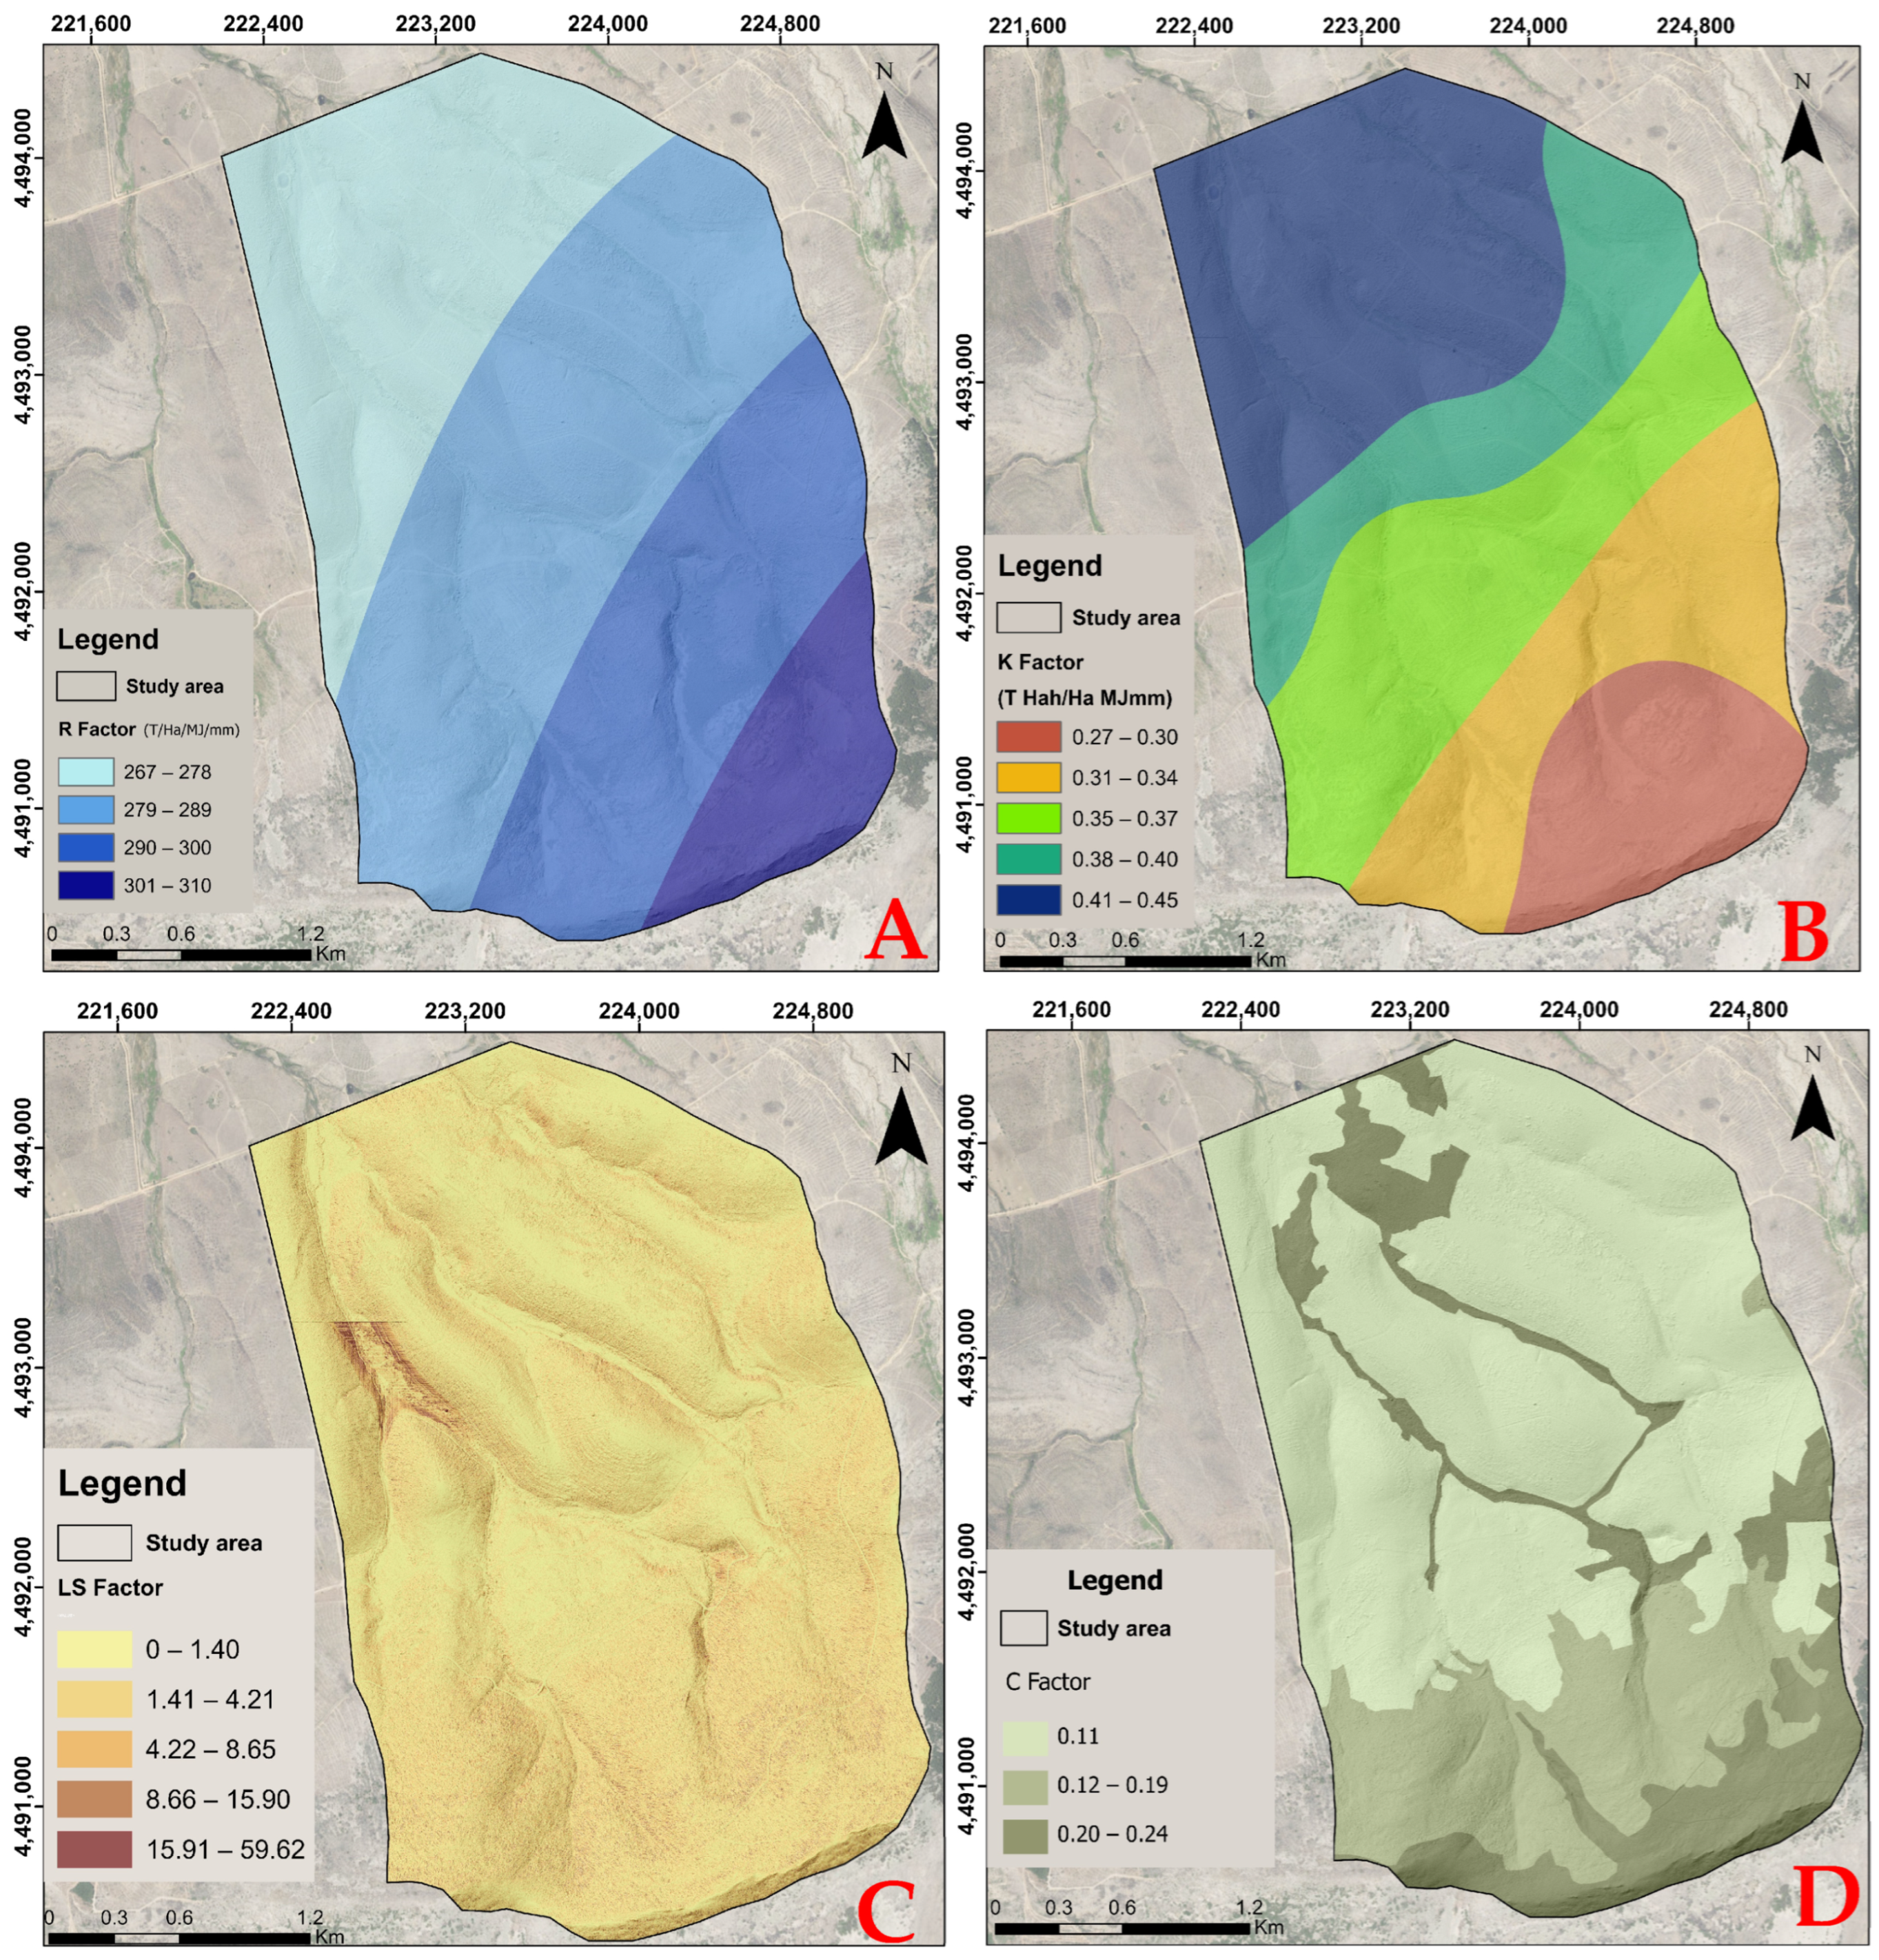
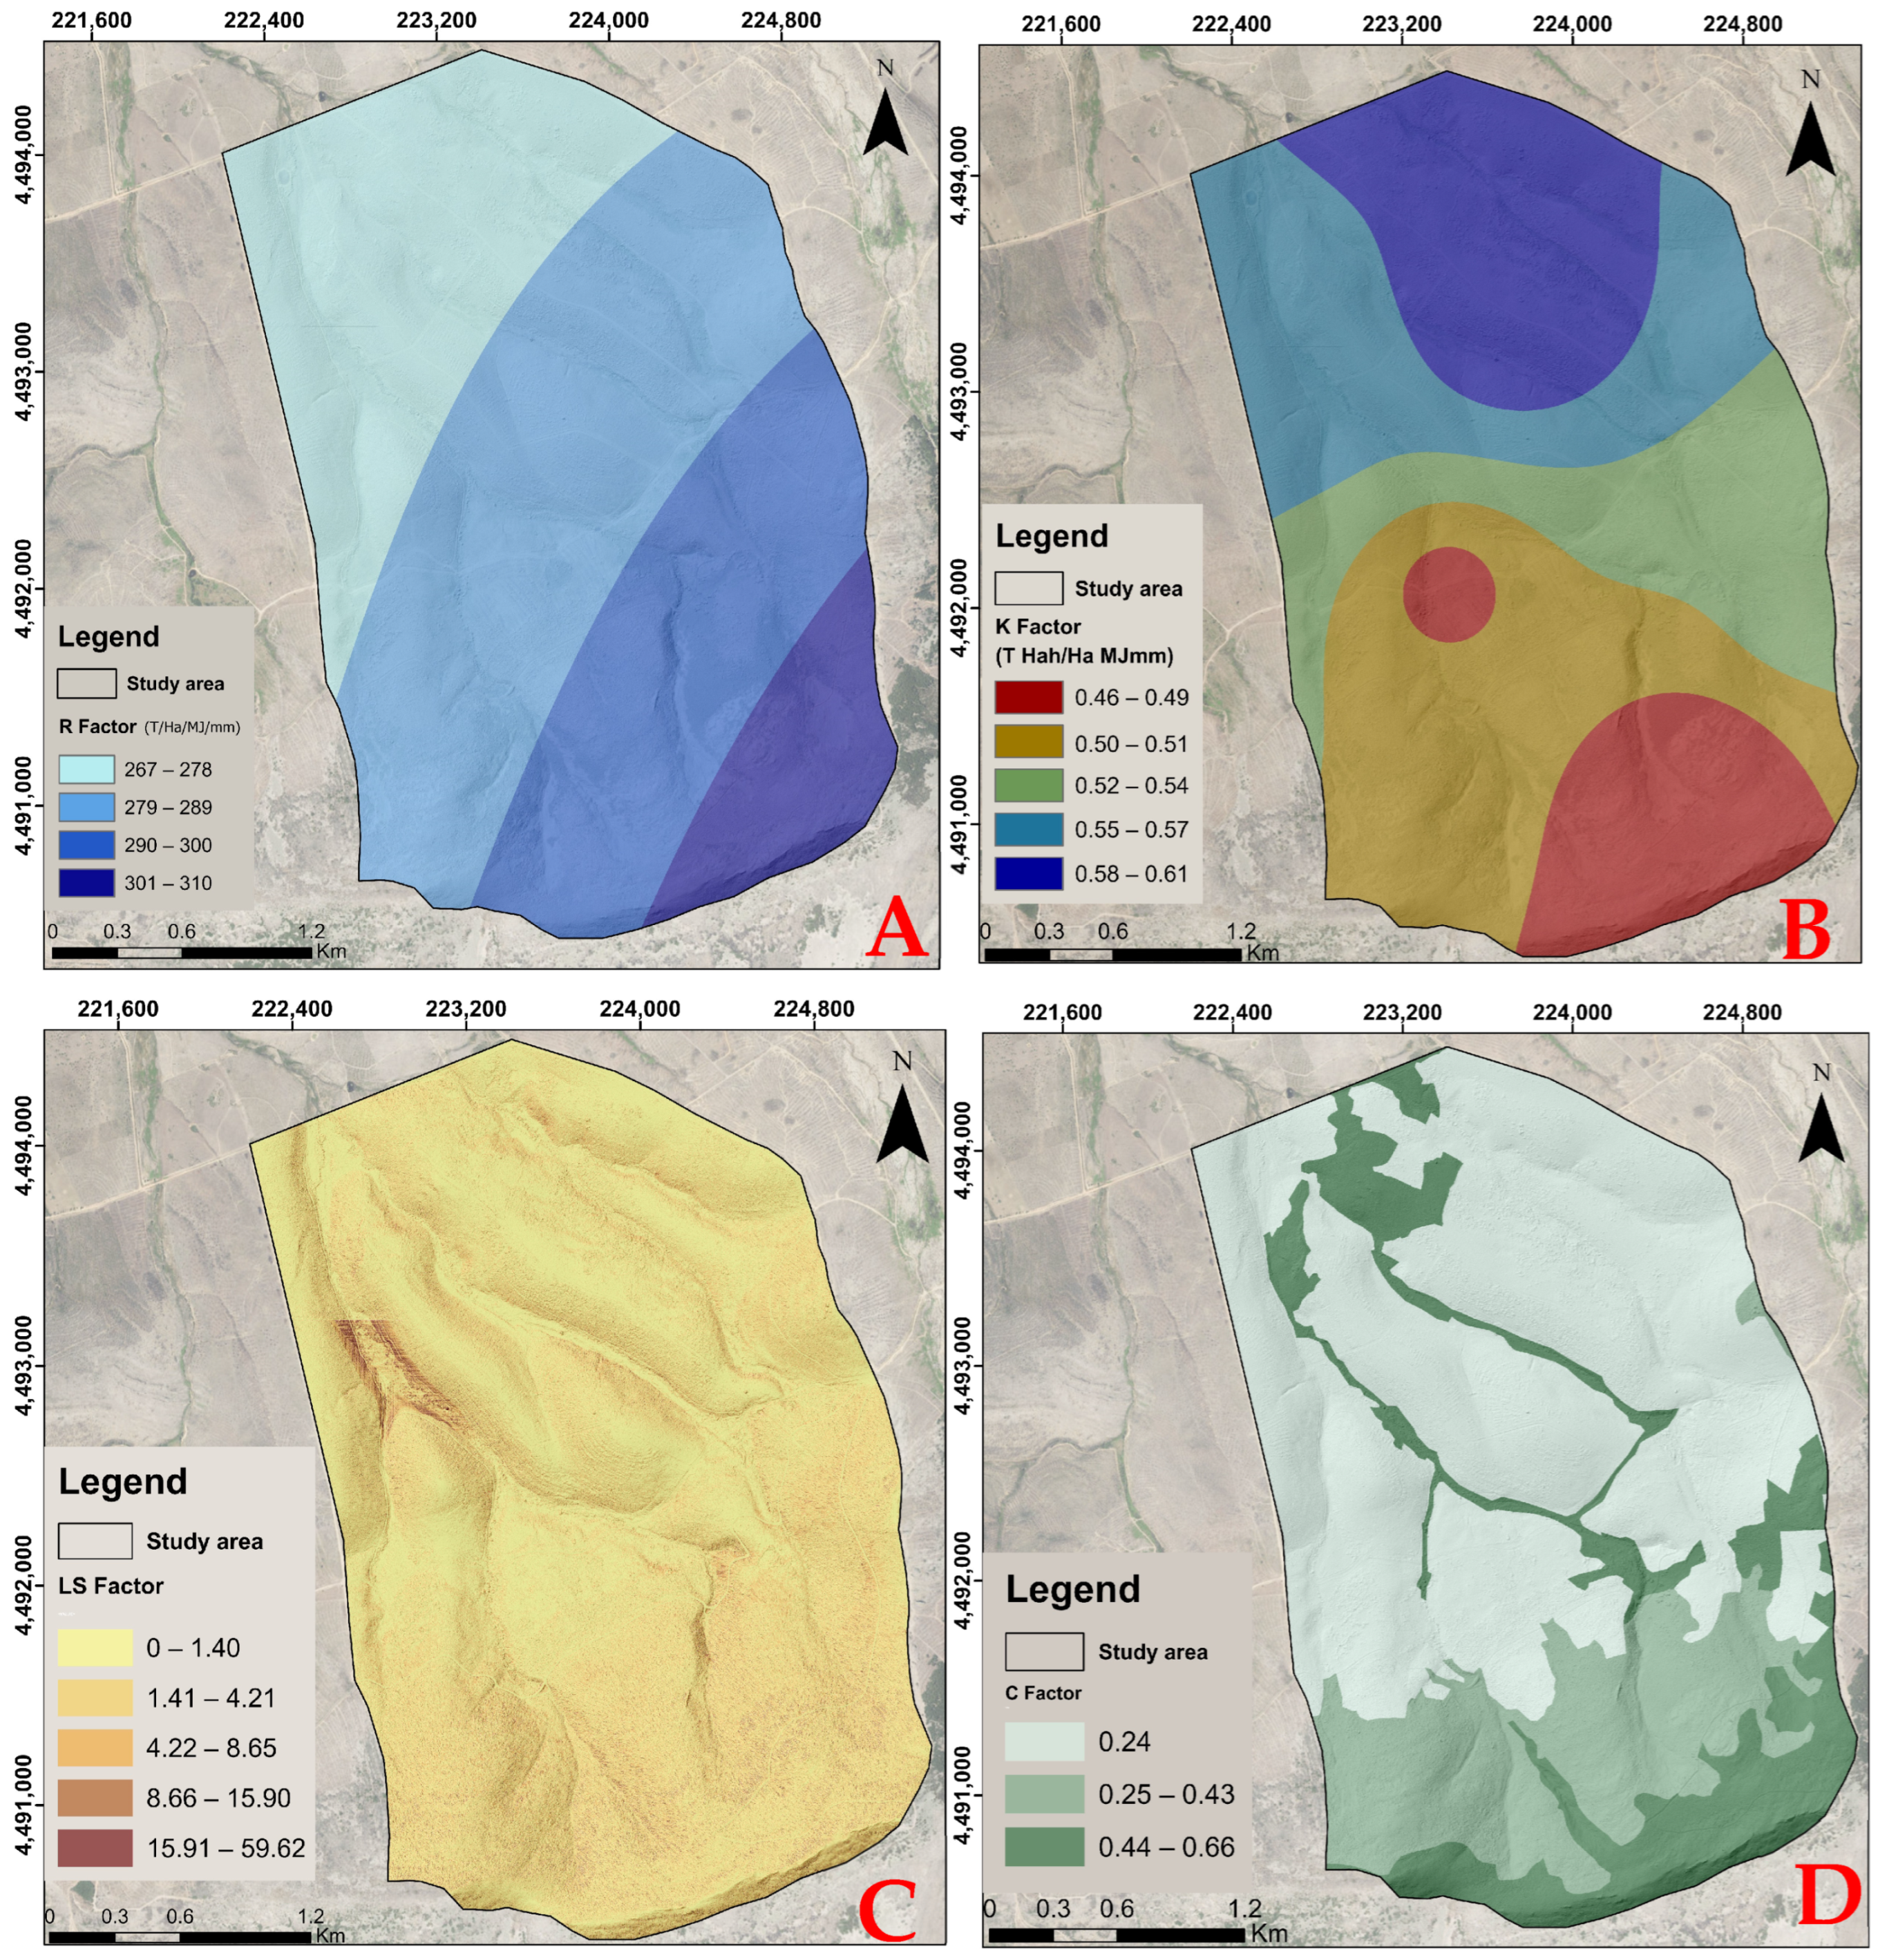
2.4.1. Rain Erosivity Factor R
2.4.2. Soil Erodibility Factor (K)
2.4.3. Topographic Factor (LS)
2.4.4. Plant Cover Factor (C)
2.4.5. Soil Conservation Practices Factor (P)
2.5. Normalized Difference Vegetation Index
3. Results
3.1. Physical–Chemical Properties
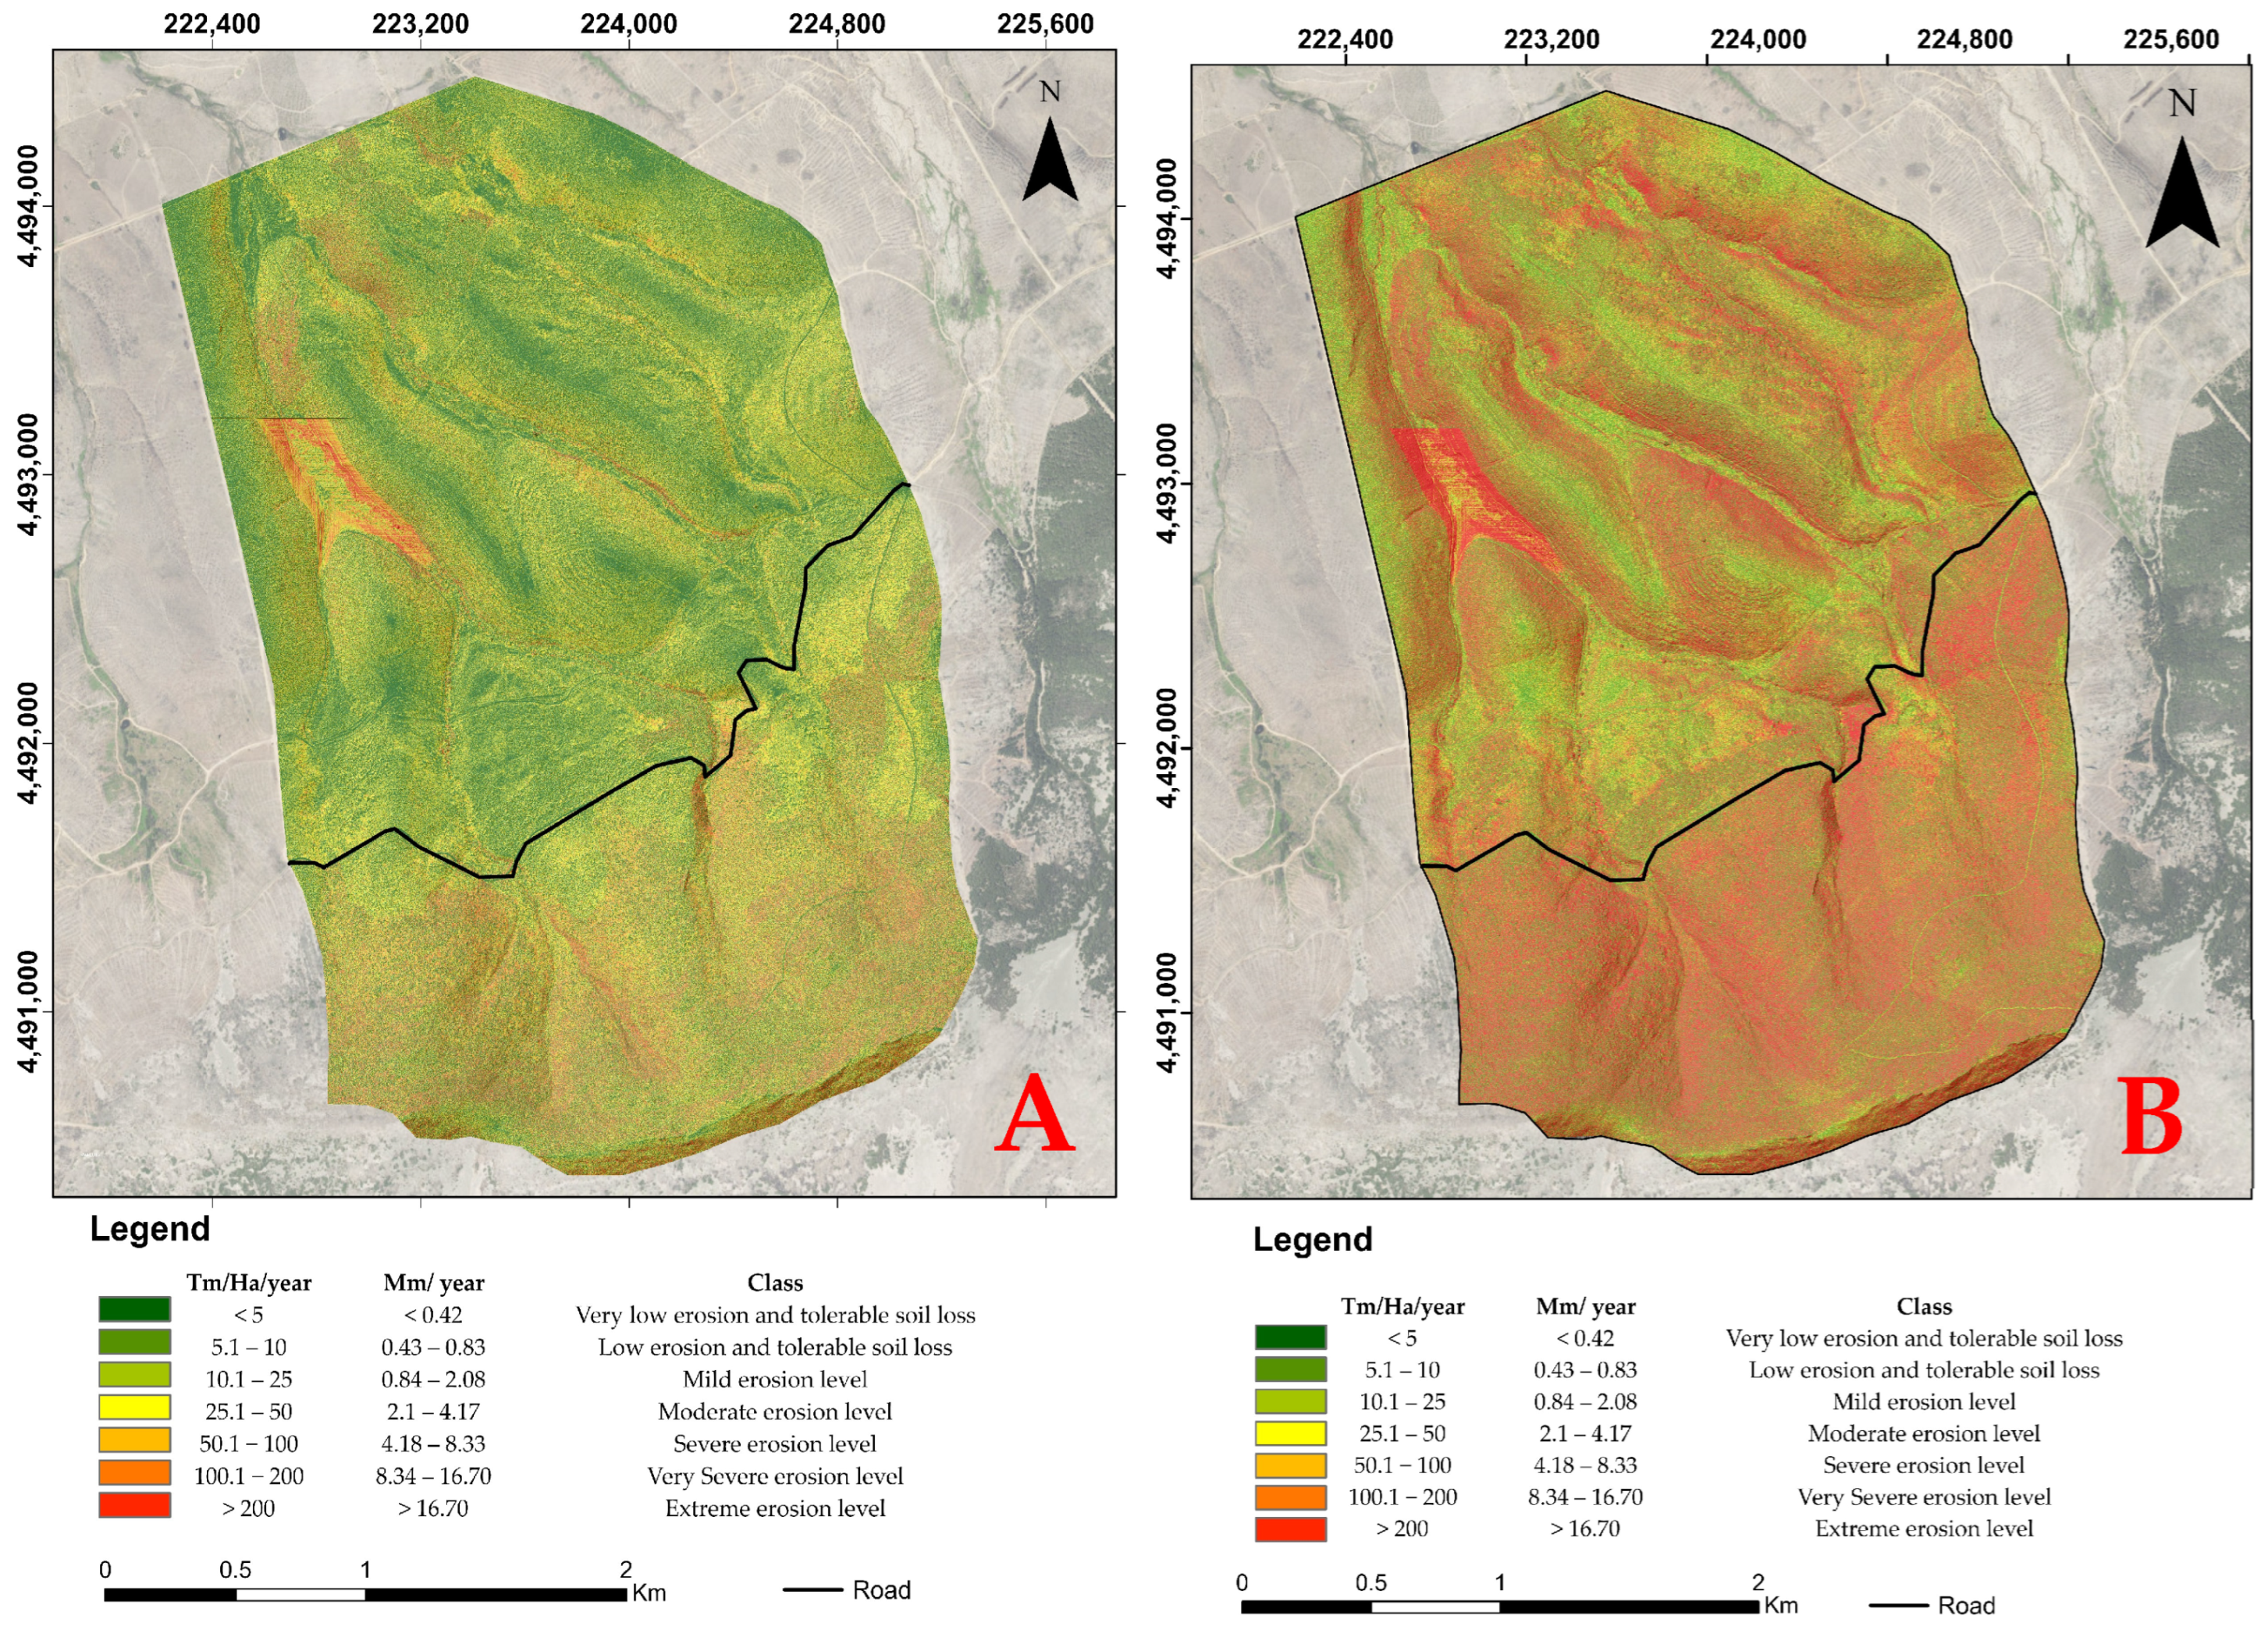
3.2. Soil Erosion
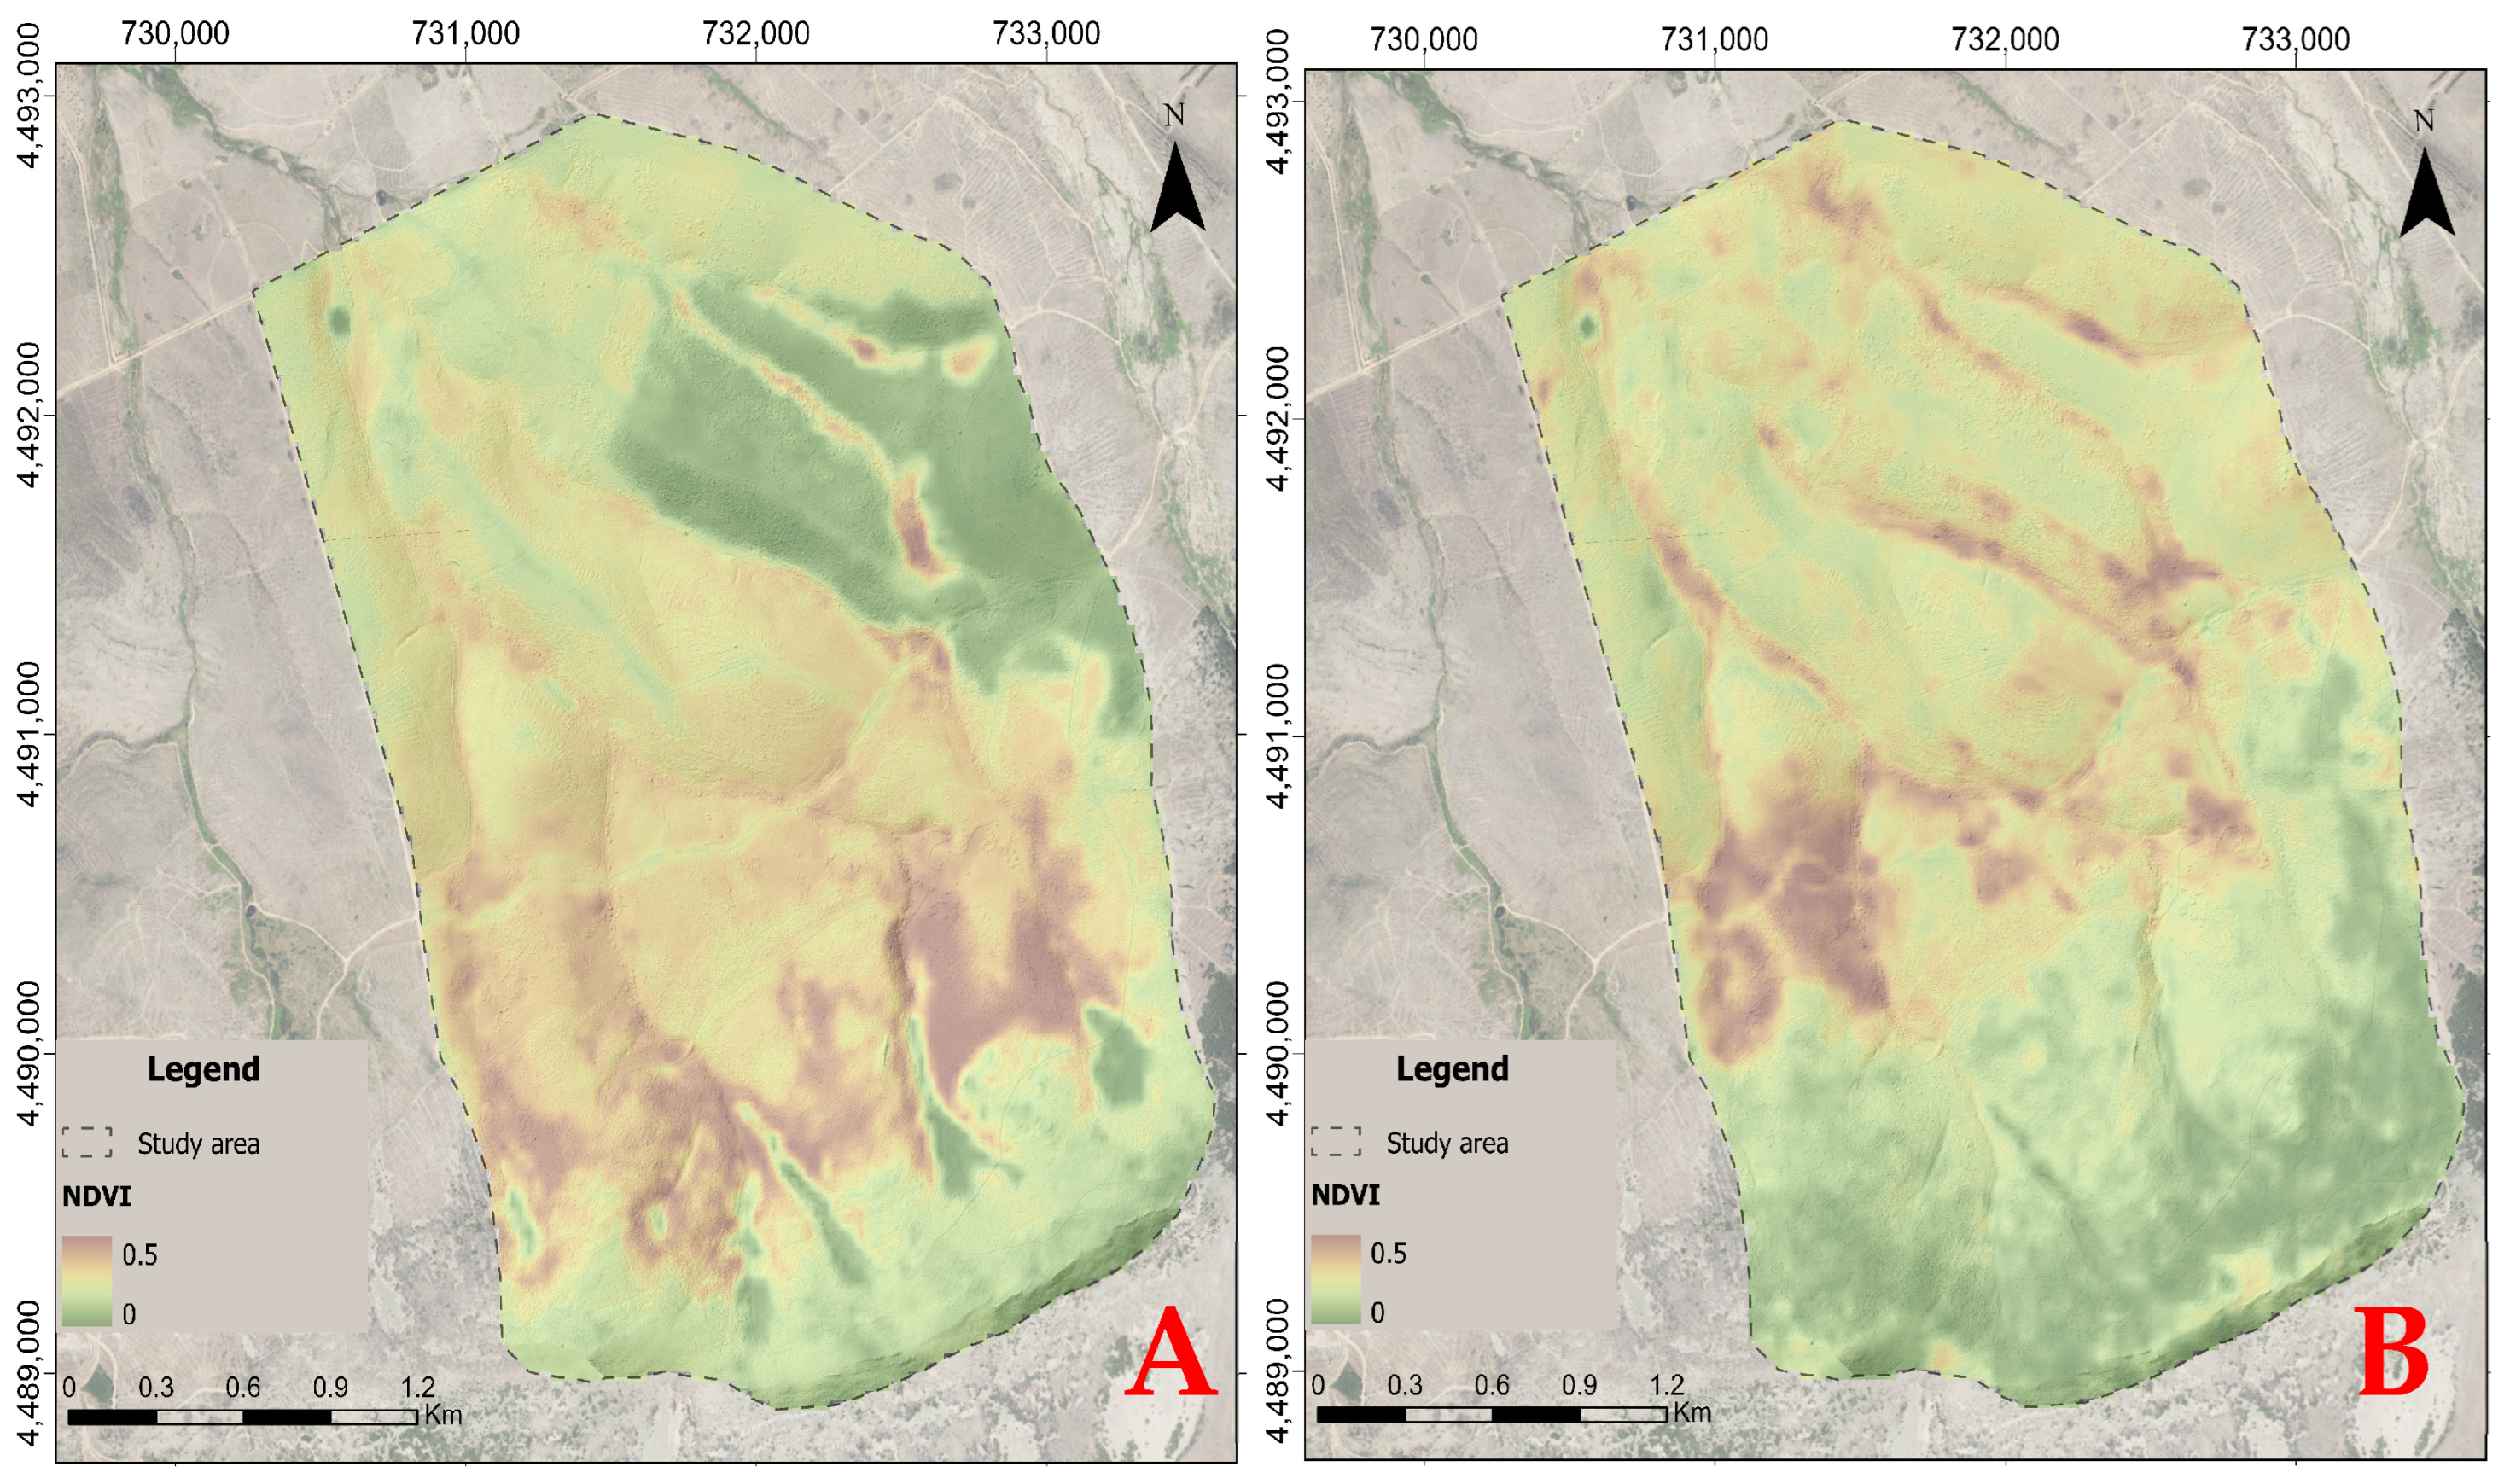
3.3. Normalised Difference Vegetation Index
3.4. Recovery Measures
4. Discussion
4.1. Physical and Chemical Properties
- -
- Heat-induced dehydration of clay minerals in the soil samples, causing strong interactions between clay particles, leading to a decrease [73].
- -
- -
- Aluminium oxides and hydroxides released during clay decomposition act as cementing agents in the formation of area-sized particles, therefore, an increase in sands is strongly associated with a decrease in clay content [74,77,78]. In addition, clay decomposition results from the removal of structural hydroxyl ions, leading to the disintegration of the crystalline structure of clay minerals [77].
4.2. Soil Erosion Discussions
4.3. Normalised Difference Vegetation Index (NDVI)
4.4. Implications
5. Conclusions
Author Contributions
Funding
Data Availability Statement
Acknowledgments
Conflicts of Interest
Appendix A

| Plant Species | Before Forest Fire | After Forest Fire |
|---|---|---|
| Achillea millefolium L. | 2 | |
| Agrostis castellana Boiss. & Reuter | 7 | |
| Agrostis truncatula Parl. subsp. truncatula | 9 | Presence |
| Anagallis tenella (L.) L. | 3 | |
| Anarrhinum bellidifolium (L.) Wild. | 1 | |
| Andryala integrifolia L. | 7 | |
| Anthericum liliago L. | 1 | |
| Anthoxanthum odoratum L. | 2 | |
| Arenaria montana L. subsp. montana | 8 | |
| Arenaria querioides Pourret ex DC. | 4 | |
| Arnoseris minima (L.) Schwigger & Koerte | 4 | |
| Arrhenatherum elatius (L.) Beauv. ex J. & C. subsp. elatius | 10 | |
| Asphodelus albus Miller | 2 | |
| Asphodelus ramosus L. subsp. ramosus | 2 | |
| Blechnum spicant (L.) Roth subsp. spicant | 1 | |
| Calluna vulgaris (L.) Hull | 5 | |
| Campanula lusitanica L.subsp. lusitanica | 2 | |
| Campanula rapunculus L. | 2 | |
| Carex binervis Sm. | 3 | |
| Carex echinata Murray. | 1 | |
| Carum verticillatum (L.) W.D.J.Koch | 1 | |
| Centranthus calcitrapae (L.) Dufresne | 2 | |
| Ceratocapnos claviculata L. Lidén subsp. claviculata | 2 | |
| Chamaemelum mixtum (L.) All. | 1 | |
| Cistus ladanifer L. subsp. ladanifer | 1 | |
| Cistus populifolius L. | 1 | |
| Cistus psilosepalus Sweet | 3 | Presence |
| Cistus salviifolius L. | 1 | |
| Conopodium pyrenaeum (Loisel.) Miégev. | 5 | |
| Conopodium subcarneum (Boiss. & Reunt.) | 1 | |
| Corrigiola litoralis L. subsp. litoralis | 4 | |
| Crepis capillaris (L.) Wallr. | 3 | Presence |
| Crucianella angustifolia L. | 1 | |
| Cruciata glabra (L.) Ehrend. | 3 | |
| Cynosurus echinatus L. | 1 | |
| Cynosurus elegans Desf. | 1 | |
| Cytisus oromediterraneus Rivas Mart. & al. | 3 | |
| Cytisus striatus (Hill) Rothm. | 1 | |
| Dactylis glomerata L. | 1 | |
| Dactylorhiza caramulensis (Vermeulen) Tyteca | 3 | |
| Dactylorhiza elata (Poiret) Soó | 1 | |
| Danthonia decumbens (L.) DC. | 1 | |
| Deschampsia cespitosa (L.) Beauv. | 5 | |
| Dianthus laricifolius Boiss. & Reuter | 2 | |
| Digitalis thapsi L. | 5 | |
| Drosera rotundifolia L. | 3 | |
| Eleocharis palustris (L.) Roemer & Schultes subsp. palustris | 1 | |
| Epilobium tetragonum L. subsp. tetragonum | 1 | |
| Erica arborea L. | 10 | |
| Erica australis L. | 13 | |
| Erica tetralix L. | 3 | |
| Erica umbellata Loefl. Ex L. | 5 | |
| Frangula alnus Miller subsp. alnus | 1 | |
| Galium mollugo L. | 3 | |
| Galium verum L. subsp. verum | 1 | |
| Genista anglica L. | 3 | Presence |
| Genista florida L. | 9 | Presence |
| Genista hystrix Lange | 1 | Presence |
| Geranium purpureum Vill. | 2 | |
| Geum sylvaticum Pour | 1 | |
| Halimium lasianthum subsp. alyssoides (Lam.) Greuter | 8 | |
| Halimium ocymoides (Lam.) Willk. | 2 | |
| Helianthemum nummularium (L.) Mill. | 1 | |
| Herniaria hirsuta L. subsp. hirsuta | 1 | |
| Hispidella hispánica Barnades | 1 | |
| Holcus gayanus Boiss. | 1 | |
| Holcus lanatus L. | 2 | |
| Holcus mollis L. | 1 | |
| Hypericum humifusum L. | 1 | |
| Hypericum perforatum L. | 1 | |
| Hypochoeris radicata L. | 5 | |
| Jasione crispa (Pourret) Samp. | 2 | |
| Jasione montana L. | 7 | |
| Juncus squarrosus L. | 3 | |
| Koeleria crassipes Lange | 1 | |
| Lactuca viminea (L.) J. & C. Presl | 3 | |
| Leucanthemopsis flaveola (Hoffmanss. & Link) Heywood | 6 | |
| Linaria saxatilis (L.) Chaz. | 1 | |
| Linkagrostis juressi (Link) Romero García, Blanca & Morales Torres | 2 | |
| Lobelia urens L. | 3 | |
| Logfia minima (Sm.) Dumort. | 8 | |
| Lonicera periclymenum subsp. hispánica (Boiss. & Reuter) Nyman | 2 | |
| Lotus hispidus Desf. | 2 | |
| Lotus pedunculatus Cav. | 1 | |
| Luzula láctea (Link) E.H.F.Meyer | 8 | |
| Luzula multiflora (Retz.) Lej. | 1 | |
| Lycopodiella inundata (L.) J. Holub | 3 | |
| Malva tourmefortiana L. | 1 | |
| Micropyrum patens (Brot.) Rothm. ex Pliger | 3 | |
| Micropyrum tenellum (L.) Link | 8 | |
| Molinia caerulea (L.) Moench | 3 | |
| Narcissus bulbocodium L. | 1 | |
| Ornithogalum concinnum (Salisb.) Countinho | 3 | |
| Ornithopus compressus L. | 2 | |
| Ornithopus perpusillus L. | 1 | |
| Periballia involucrata (Cav.) Janka | 1 | |
| Pedicularis sylvatica subsp. lusitanica (Hoffmanns. & Link) Coutinho | 3 | |
| Physospermum cornubiense (L.) DC. | 1 | |
| Pilosella officinarum F.W. Schultz & Sch. Bip. | 2 | |
| Pinus pinaster Aiton | 3 | Presence |
| Pinus sylvestris L. | 4 | Presence |
| Plantago lanceolata L. | 1 | |
| Polygala vulgaris L. | 1 | |
| Potentilla erecta (L.) Raeusch. | 4 | |
| Prunella grandiflora (L.) Scholler | 1 | |
| Pteridium aquilinum (L.) Kuhn subsp. aquilinum | 3 | |
| Pterospartum tridentatum (L.) | 8 | |
| Quercus ilex subsp. ballota (Desf.) Samp. | 1 | Presence |
| Quercus pyrenaica Willd. | 9 | Presence |
| Radiola linoides Roth | 1 | |
| Ranunculus nodiflorus L. | 1 | |
| Rhynchospora alba (L.) Vahl | 2 | |
| Rosa canina L. | 1 | Presence |
| Rubus ulmifolius Schott | 2 | |
| Rumex acetosella subsp. angiocarpus (Murb.) Murb. | 8 | |
| Salix atrocinerea Brot. | 2 | |
| Salix salviiflora Brot. | 1 | |
| Sanguisorba minor Scop. | 1 | |
| Clinopodium vulgaris (L.) Fritsch | 3 | |
| Saxifraga fragosoi Sennen | 2 | |
| Scirpus holoschoenus L. | 1 | |
| Scrophularia scorodonia L. | 1 | |
| Scutellaria minor Hudson | 3 | |
| Sedum amplexicaule DC. | 1 | |
| Sedum brevifolium DC. | 5 | |
| Sedum forsterianum Sm. | 2 | |
| Sedum hirsutum All. subsp. hirsutum | 3 | |
| Senecio lividus L. | 1 | |
| Sesamoides purpurascens (L.) G.López | 1 | |
| Silene nutans L. subsp. nutans | 1 | |
| Simethis planifolia (L.) Gren. | 4 | |
| Solidago virgaurea L. | 2 | Presence |
| Sorbus latifolia (Lam.) Pers. | 1 | |
| Spergula arvensis L. | 3 | |
| Tanacetum corymbosum (L.) Schultz Bip. | 1 | |
| Teesdalia nudicaulis (L.) R. Br. | 1 | |
| Teucrium scorodonia L. | 4 | |
| Thapsia minor Hoffmanns. & Link | 1 | |
| Thapsia villosa L. | 1 | |
| Tolpis barbata (L.) Gaertner | 1 | |
| Tuberaria lignosa (Sweet) Samp. | 1 | |
| Urtica dioica L. | 1 | |
| Utricularia minor L. | 1 | |
| Verbascum thapsus L. | 1 | Presence |
| Viola riviniana Rhb. | 2 | |
| Vulpia myuros (L.) C.C. Gmelin | 1 | |
| Wahlenbergia hederácea (L.) Rchb. | 4 |
References
- McGuire, L.A.; Ebel, B.A.; Rengers, F.K.; Vieira, D.C.; Nyman, P. Fire effects on geomorphic processes. Nat. Rev. Earth Environ. 2024, 5, 486–503. [Google Scholar]
- DeBano, L.F.; Neary, D.G.; Ffolliott, P.F. Fire Effects on Ecosystems; John Wiley & Sons: Hoboken, NJ, USA, 1998. [Google Scholar]
- Shakesby, R.A.; Doerr, S.H. Wildfire as a hydrological and geomorphological agent. Earth-Sci. Rev. 2006, 74, 269–307. [Google Scholar] [CrossRef]
- Agbeshie, A.A.; Abugre, S.; Atta-Darkwa, T.; Awuah, R. A review of the effects of forest fire on soil properties. J. For. Res. 2022, 33, 1419–1441. [Google Scholar] [CrossRef]
- Shakesby, R.A. Post-wildfire soil erosion in the Mediterranean: Review and future research directions. Earth-Sci. Rev. 2011, 105, 71–100. [Google Scholar] [CrossRef]
- Urbieta, I.R.; Zavala, G.; Bedia, J.; Gutiérrez, J.M.; San Miguel-Ayanz, J.; Camia, A.; Keeley, J.E.; Moreno, J.M. Fire activity as a function of fire–weather seasonal severity and antecedent climate across spatial scales in southern Europe and Pacific western USA. Environ. Res. Lett. 2015, 10, 114013. [Google Scholar] [CrossRef]
- De Girolamo, A.M.; Cerdan, O.; Grangeon, T.; Ricci, G.F.; Vandromme, R.; Porto, A.L. Modelling effects of forest fire and post-fire management in a catchment prone to erosion: Impacts on sediment yield. Catena 2022, 212, 106080. [Google Scholar] [CrossRef]
- Zema, D.A.; Lucas-Borja, M.E. Efectos del fuego prescrito en los procesos hidrológicos post-incendio en ecosistemas agroforestales: Una revisión sistemática y un meta-análisis. Procesos Hidrol. 2023, 37, e14957. [Google Scholar] [CrossRef]
- Pausas, J.G. Incendios Forestales. Una Visión Desde la Ecología; Consejo Superior de Investigaciones Científicas (España). Libros de Catarata: Madrid, Spain, 2012. [Google Scholar]
- García-Llamas, P.; Suárez-Seoane, S.; Taboada, A.; Fernández-Manso, A.; Quintano, C.; Fernández-García, V.; Calvo, L. Environmental drivers of fire severity in extreme fire events that affect Mediterranean pine forest ecosystems. For. Ecol. Manag. 2019, 433, 24–32. [Google Scholar] [CrossRef]
- Cuesta, J.R.; Giraldo, I.O. Efectos de los incendios forestales en las propiedades del suelo. Estado del arte. Cuad. Act. 2013, 5, 59–67. [Google Scholar]
- Lee, R.J.; Chow, T.E. Post-wildfire assessment of vegetation regeneration in Bastrop, Texas, using Landsat imagery. GISci. Remote Sens. 2015, 52, 609–626. [Google Scholar] [CrossRef]
- Stow, D.; Petersen, A.; Rogan, J.; Franklin, J. Mapping burn severity of Mediterranean-type vegetation using satellite multispectral data. Gisci. Remote Sens. 2007, 44, 1–23. [Google Scholar]
- Weber, K.T.; Seefeldt, S.; Moffet, C.; Norton, J. Comparing fire severity models from post-fire and pre/post-fire differenced imagery. Gisci. Remote Sens. 2008, 45, 392–405. [Google Scholar]
- Chu, T.; Guo, X. Remote sensing techniques in monitoring post-fire effects and patterns of forest recovery in boreal forest regions: A review. Remote Sens. 2013, 6, 470–520. [Google Scholar] [CrossRef]
- Miller, C.W.; Harvey, B.J.; Kane, V.R.; Moskal, L.M.; Alvarado, E. Different approaches make comparing studies of burn severity challenging: A review of methods used to link remotely sensed data with the Composite Burn Index. Int. J. Wildland Fire 2023, 32, 449–475. [Google Scholar]
- Moody, J.A.; Shakesby, R.A.; Robichaud, P.R.; Cannon, S.H.; Martin, D.A. Current research issues related to post-wildfire runoff and erosion processes. Earth-Sci. Rev. 2013, 122, 10–37. [Google Scholar]
- Vega, J.A.; Fontúrbel, T.; Merino, A.; Fernández, C.; Ferreiro, A.; Jiménez, E. Testing the ability of visual indicators of soil burn severity to reflect changes in soil chemical and microbial properties in pine forests and shrubland. Plant Soil 2013, 369, 73–91. [Google Scholar]
- Hammad, A.A.; Lundekvam, H.; Børresen, T.J.E.M. Adaptation of RUSLE in the eastern part of the Mediterranean region. Environ. Manag. 2004, 34, 829–841. [Google Scholar]
- Kouli, M.; Soupios, P.; Vallianatos, F. Soil erosion prediction using the revised universal soil loss equation (RUSLE) in a GIS framework, Chania, Northwestern Crete, Greece. Environ. Geol. 2009, 57, 483–497. [Google Scholar]
- Meusburger, K.; Konz, N.; Schaub, M.; Alewell, C. Soil erosion modelled with USLE and PESERA using QuickBird derived vegetation parameters in an alpine catchment. Int. J. Appl. Earth Obs. Geoinf. 2010, 12, 208–215. [Google Scholar]
- Miller, J.D.; Nyhan, J.W.; Yool, S.R. Modeling potential erosion due to the Cerro Grande Fire with a GIS-based implementation of the Revised Universal Soil Loss Equation. Int. J. Wildland Fire 2003, 12, 85–100. [Google Scholar]
- Rulli, M.C.; Offeddu, L.; Santini, M. Modeling post-fire water erosion mitigation strategies. Hydrol. Earth Syst. Sci. 2013, 17, 2323–2337. [Google Scholar] [CrossRef]
- Xu, L.; Xu, X.; Meng, X. Risk assessment of soil erosion in different rainfall scenarios by RUSLE model coupled with Information Diffusion Model: A case study of Bohai Rim, China. Catena 2013, 100, 74–82. [Google Scholar] [CrossRef]
- Merchán, L.; Martínez-Graña, A.M.; Alonso Rojo, P.; Criado, M. Water Erosion Risk Analysis in the Arribes del Duero Natural Park (Spain) Using RUSLE and GIS Techniques. Sustainability 2023, 15, 1627. [Google Scholar] [CrossRef]
- Terranova, O.; Antronico, L.; Coscarelli, R.; Iaquinta, P. Soil erosion risk scenarios in the Mediterranean environment using RUSLE and GIS: An application model for Calabria (southern Italy). Geomorphology 2009, 112, 228–245. [Google Scholar] [CrossRef]
- Vavassori, A.; Oxoli, D.; Venuti, G.; Brovelli, M.A.; de Cumis, M.S.; Sacco, P.; Tapete, D. A combined Remote Sensing and GIS-based method for Local Climate Zone mapping using PRISMA and Sentinel-2 imagery. Int. J. Appl. Earth Obs. Geoinf. 2024, 131, 103944. [Google Scholar] [CrossRef]
- Zhang, W.; Zhu, G.; Zhao, L.; Wang, L.; Qiu, D.; Ye, L.; Lu, S.; Lin, X. Quantifying the changes in solute transport caused by human influence on river connectivity in inland river basins. Catena 2024, 246, 108360. [Google Scholar]
- Fatima, B.; Rachid, H.; Abdeldjalil, B.; Abdessalam, O.; Mohamed, B.; Alfagham, A.T.; Tariq, A. Monitoring and forecasting water erosion in response to climate change effects using the integration of the global RUSLE/SDR model and predictive models. Appl. Soil Ecol. 2025, 206, 105910. [Google Scholar] [CrossRef]
- Sidi Almouctar, M.A.; Wu, Y.; Zhao, F.; Dossou, J.F. Soil erosion assessment using the RUSLE model and geospatial techniques (Remote Sensing and GIS) in South-Central Niger (Maradi Region). Water 2021, 13, 3511. [Google Scholar] [CrossRef]
- Ministerio para la Transición Ecológica y el Reto Demográfico. Avances Informativos. Los Incendios Forestales en España, 1 de Enero-31 de Diciembre 2022. Available online: https://www.miteco.gob.es/content/dam/miteco/es/biodiversidad/temas/incendios-forestales/avance_1_enero_31_diciembre_2021_tcm30-542118.pdf (accessed on 20 January 2025).
- Castro, A.L.; do Amaral, A.C. Normalized Difference Vegetation Index (NDVI) Analysis for Evaluation of Forest Fires in the Summer of 2016 in Portugal; University of Porto: Porto, Portugal, 2017. [Google Scholar]
- Novo, A.; Fariñas-Álvarez, N.; Martínez-Sánchez, J.; González-Jorge, H.; Fernández-Alonso, J.M.; Lorenzo, H. Mapping forest fire risk-A case study in Galicia (Spain). Remote Sens 2020, 12, 3705. [Google Scholar]
- Veraverbeke, S.; Verstraeten, W.W.; Lhermitte, S.; Goossens, R. Evaluating Landsat Thematic Mapper spectral indices for estimating burn severity of the 2007 Peloponnese wildfires in Greece. Int. J. Wildland Fire 2010, 19, 558–569. [Google Scholar] [CrossRef]
- Telesca, L.; Lasaponara, R. Pre-and post-fire behavioral trends revealed in satellite NDVI time series. Geophys. Res. Lett. 2006, 33, L14401. [Google Scholar]
- Clemente, R.H.; Cerrillo, R.M.N.; Gitas, I.Z. Monitoring post-fire regeneration in Mediterranean ecosystems by employing multitemporal satellite imagery. Int. J. Wildland Fire 2009, 18, 648–658. [Google Scholar]
- Storey, E.A.; Stow, D.A.; Roberts, D.A. Evaluating uncertainty in Landsat-derived postfire recovery metrics due to terrain, soil, and shrub type variations in southern California. Gisci. Remote Sens. 2020, 57, 352–368. [Google Scholar]
- Gray, M.E.; Zachmann, L.J.; Dickson, B.G. A weekly, continually updated dataset of the probability of large wildfires across western US forests and woodlands. Earth Syst. Sci. Data 2018, 10, 1715–1727. [Google Scholar]
- Domingo, D.; de la Riva, J.; Lamelas, M.T.; García-Martín, A.; Ibarra, P.; Echeverría, M.; Hoffrén, R. Fuel type classification using airborne laser scanning and Sentinel 2 data in Mediterranean forest affected by wildfires. Remote Sens. 2020, 12, 3660. [Google Scholar] [CrossRef]
- Martínez-Graña, A.M.; Goy y Goy, J.L.; De Bustamante Gutiérrez, I.; Cardeña, C.Z. Characterization of environmental impact on resources, using strategic assessment of environmental impact and management of natural spaces of “Las Batuecas-Sierra de Francia” and “Quilamas” (Salamanca, Spain). Environ. Earth Sci. 2014, 71, 39–51. [Google Scholar]
- Junta de Castilla y León. Conserjería de Medio Ambiente, Vivienda y Ordenación del Territorio. Plan de Restauración del incendio de Monsagro (Salamanca). 2024. Available online: https://contrataciondelestado.es/wps/wcm/connect/PLACE_es/Site/area/docAccCmpnt?srv=cmpnt&cmpntname=GetDocumentsById&source=library&DocumentIdParam=b7c2e7b9-45ec-4963-8fb6-8a1ad2c89d1f (accessed on 11 July 2024).
- Egido Rodríguez, J.A. Contribución al Estudio Edafoquímico de Suelos Forestales. Ph.D. Thesis, Universidad de Salamanca, Salamanca, Spain, 1978. no publicada. [Google Scholar]
- Martínez Graña, A.M. Estudio geológico ambiental para la ordenación de los espacios naturales de” Las Batuecas-Sierra de Francia” y” Quilamas”. Aplicaciones Geomorfológicas al Paisaje, Riesgos e Impactos. Ph.D. Thesis, Universidad de Salamanca, Salamanca, Spain, 2010. [Google Scholar]
- Food and Agriculture Organization of the United Nations (FAO). Base Referencial Mundial del Recurso Suelo 2014: Sistema Internacional de Clasificación de Suelos para la Nomenclatura de Suelos y la Creación de Leyendas de Mapas de Suelos; FAO: Roma, Italia, 2016. [Google Scholar]
- Walkley, A. A critical examination of a rapid method for determining organic carbon in soils—Effect of variations in digestion conditions and of inorganic soil constituents. Soil Sci. 1947, 63, 251–264. [Google Scholar]
- Loveland, P.J.; Whalley, W.R. Particle size analysis. In Soil and Environmental Analysis 1991; CRC Press: Boca Raton, FL, USA, 2000; pp. 293–326. [Google Scholar]
- Wischmeier, W.H.; Smith, D.D. Predicting Rainfall Erosión Losses: A Guide to Conservation Planning; Department of Agriculture, Science and Education Administration: Washington, DC, USA, 1978; No. 537. [Google Scholar]
- Renard, K.G. Predicting Soil Erosion by Water: A Guide to Conservation Planning with the Revised Universal Soil Loss Equation (RUSLE); US Department of Agriculture, Agricultural Research Service: Washington, DC, USA, 1997. [Google Scholar]
- Jahun, B.G.; Ibrahim, R.; Dlamini, N.S.; Musa, S.M. Review of soil erosion assessment using RUSLE model and GIS. J. Biol. Agric. Healthc. 2015, 5, 36–47. [Google Scholar]
- Panagos, P.; De Rosa, D.; Liakos, L.; Labouyrie, M.; Borrelli, P.; Ballabio, C. Soil bulk density assessment in europe. Agric. Ecosyst. Environ. 2024, 364, 108907. [Google Scholar] [CrossRef]
- González de Tánago, M. La ecuación universal de pérdidas de suelo: Pasado, presente y futuro. Ecología 1991, 5, 13–50. [Google Scholar]
- Luvai, A.; Obiero, J.; Omuto, C. Soil loss assessment using the revised universal soil loss equation (RUSLE) model. Appl. Environ. Soil Sci. 2022, 2022, 2122554. [Google Scholar] [CrossRef]
- Angulo-Martínez, M.; Beguería, S. Estimating rainfall erosivity from daily precipitation records: A comparison among methods using data from the Ebro Basin (NE Spain). J. Hydrol. 2009, 379, 111–121. [Google Scholar]
- Sistema de Información Geográfica de Datos Agrarios (SIGA). Ministerio de Agricultura, Pesca y Alimentación. Available online: https://sig.mapama.gob.es/siga/ (accessed on 4 June 2024).
- ESRI. ArcMap: Versión 10.8 [Software]. Environmental Systems Research Institute. Available online: https://www.esri.com/en-us/home (accessed on 18 July 2024).
- Instituto para la Conservación de la Naturaleza (ICONA). Mapas de Estados Erosivos. In Cuenca Hidrográfica del Duero; ICONA: Madrid, Spain, 1990; 96p. [Google Scholar]
- Al Rammahi, A.H.J.; Khassaf, S.I. Estimation of soil erodibility factor in RUSLE equation for Euphrates river watershed using GIS. GEOMATE J. 2018, 14, 164–169. [Google Scholar]
- Moore, I.D.; Burch, G.J. Base física del factor longitud-pendiente en la ecuación universal de pérdida de suelo. Soil Sci. Soc. Am. J. 1986, 50, 1294–1298. [Google Scholar]
- Alexandridis, T.K.; Sotiropoulou, A.M.; Bilas, G.; Karapetsas, N.; Silleos, N.G. The effects of seasonality in estimating the C-factor of soil erosion studies. Land Degrad. Dev. 2015, 26, 596–603. [Google Scholar] [CrossRef]
- Schmidt, S.; Alewell, C.; Meusburger, K. Mapping spatio-temporal dynamics of the cover and management factor (C-factor) for grasslands in Switzerland. Remote Sens. Environ. 2018, 211, 89–104. [Google Scholar]
- Puktlang, W.; Mongkolsawat, C.; Suwanwerakamtorn, R. The Impact of Expanding Rubber Tree Plantation on Soil Erosion in the Mekong-Sub Basin. In Proceedings of the 34th Asian Conference on Remote Sensing, Bali, Indonesia, 20–24 October 2013. [Google Scholar]
- Ayalew, D.A.; Deumlich, D.; Šarapatka, B.; Doktor, D. Quantifying the sensitivity of NDVI-based C factor estimation and potential soil erosion prediction using Spaceborne earth observation data. Remote Sens. 2020, 12, 1136. [Google Scholar] [CrossRef]
- Wischmeier, W.H. New developments in estimating water erosión. In Proceedings of the 29th Annual Meeting of the Soil Conservation Society of America, Ankeney, IA, USA, 4–6 May 1974; pp. 179–186. [Google Scholar]
- Kundu, A.; Denis, D.M.; Patel, N.R.; Dutta, D. A Geo-spatial study for analysing temporal responses of NDVI to rainfall. Singap. J. Trop. Geogr. 2018, 39, 107–116. [Google Scholar]
- Ramos-Aguilar, R.; Máximo-Romero, P.; Narciso-Hernández, J.; Mirón-Morales, M.; Beltrán-Cruz, M.A. Estudio geoestadístico para obtener la gravedad local, pendiente y cálculo hidrológico de las barrancas Xaltelulco, Tepeloncocone, Tenepanco, Colorada y Quimichule del volcán Popocatépetl. Bol. Cienc. Tierra 2012, 31, 65–84. [Google Scholar]
- Tun-Dzul, F.J.; Vester, H.; Durán García, R.; Schmook, B. Estructura arbórea y variabilidad temporal del NDVI en los” bajos inundables” de la Península de Yucatán, México. Polibotánica 2008, 25, 69–90. [Google Scholar]
- Arocena, J.M.; Opio, C. Prescribed fire-induced changes in properties of sub-boreal forest soils. Geoderma 2003, 113, 1–16. [Google Scholar]
- US Geological Survey (USGS). Earth Explorer. Available online: https://earthexplorer.usgs.gov/ (accessed on 26 July 2024).
- Demir, S.; Dursun, İ. Assessment of pre-and post-fire erosion using the RUSLE equation in a watershed affected by the forest fire on Google Earth Engine: The study of Manavgat River Basin. Nat. Hazards 2024, 120, 2499–2527. [Google Scholar] [CrossRef]
- Castro, J.; Leverkus, A.B.; Guzmán-Álvarez, J.R. Técnicas blandas para la restauración de zonas quemadas en ambientes mediterráneos. Los Bosques Biodivers. Frente Cambio Clim. Impactos Vulnerabilidad Adapt. Esp. 2015, 56, 595–604. [Google Scholar]
- Giovannini, G.; Lucchesi, S.; Giachetti, M. Effect of heating on some physical and chemical parameters related to soil aggregation and erodibility. Soil Sci. 1988, 146, 255–261. [Google Scholar]
- Ulery, A.L.; Graham, R.C. Forest fire effects on soil color and texture. Soil Sci. Soc. Am. J. 1993, 57, 135–140. [Google Scholar] [CrossRef]
- Terefe, T.; Mariscal-Sancho, I.; Peregrina, F.; Espejo, R. Influence of heating on various properties of six Mediterranean soils. A laboratory study. Geoderma 2008, 143, 273–280. [Google Scholar] [CrossRef]
- Sertsu, S.M.; Sanchez, P.A. Effects of heating on some changes in soil properties in relation to an Ethiopian land management practice. Soil Sci. Soc. Am. J. 1978, 42, 940–944. [Google Scholar]
- Ketterings, Q.M.; Bigham, J.M.; Laperche, V. Changes in soil mineralogy and texture caused by slash-and-burn fires in Sumatra, Indonesia. Soil Sci. Soc. Am. J. 2000, 64, 1108–1117. [Google Scholar] [CrossRef]
- Bai, Z.G.; Dent, D.L.; Olsson, L.; Schaepman, M.E. Global Assessment of Land Degradation and Improvement 1. Identification by Remote Sensing; ISRIC World Soil Information: Wageningen, NL, USA, 2008. [Google Scholar] [CrossRef]
- Kapalanga, T.S. A review of land degradation assessment methods. In Final Project 2008; Land Restoration Training Programme: Reykjavík, Iceland, 2008. [Google Scholar]
- Karydas, C.G.; Panagos, P.; Gitas, I.Z. A classification of water erosion models according to their geospatial characteristics. Int. J. Digit. Earth 2014, 7, 229–250. [Google Scholar] [CrossRef]
- Efthimiou, N.; Psomiadis, E.; Panagos, P. Fire severity and soil erosion susceptibility mapping using multi-temporal Earth Observation data: The case of Mati fatal wildfire in Eastern Attica, Greece. Catena 2020, 187, 104320. [Google Scholar] [CrossRef]
- Larsen, I.J.; MacDonald, L.H. Predicting postfire sediment yields at the hillslope scale: Testing RUSLE and Disturbed WEPP. Water Resour. Res. 2007, 43, W1141. [Google Scholar] [CrossRef]
- Fernández, C.; Vega, J.A.; Vieira, D.C.S. Assessing soil erosion after fire and rehabilitation treatments in NW Spain: Performance of RUSLE and revised Morgan–Morgan–Finney models. Land Degrad. Dev. 2010, 21, 58–67. [Google Scholar]
- Caon, L.; Vallejo, V.R.; Ritsema, C.J.; Geissen, V. Effects of wildfire on soil nutrients in Mediterranean ecosystems. Earth-Sci. Rev. 2014, 139, 47–58. [Google Scholar]
- Karamesouti, M.; Petropoulos, G.P.; Papanikolaou, I.D.; Kairis, O.; Kosmas, K. Erosion rate predictions from PESERA and RUSLE at a Mediterranean site before and after a wildfire: Comparison & implications. Geoderma 2016, 261, 44–58. [Google Scholar]
- Gabban, A.; San-Miguel-Ayanz, J.; Viegas, D.X. A comparative analysis of the use of NOAA-AVHRR NDVI and FWI data for forest fire risk assessment. Int. J. Remote Sens. 2008, 29, 5677–5687. [Google Scholar] [CrossRef]
- Chéret, V.; Denux, J.P. Analysis of MODIS NDVI time series to calculate indicators of Mediterranean forest fire susceptibility. Gisci. Remote Sens. 2011, 48, 171–194. [Google Scholar]
- Hislop, S.; Jones, S.; Soto-Berelov, M.; Skidmore, A.; Haywood, A.; Nguyen, T.H. Using landsat spectral indices in time-series to assess wildfire disturbance and recovery. Remote Sens. 2018, 10, 460. [Google Scholar] [CrossRef]
- Robichaud, P.R.; Lewis, S.A.; Wagenbrenner, J.W.; Ashmun, L.E.; Brown, R.E. Post-fire mulching for runoff and erosion mitigation: Part I: Effectiveness at reducing hillslope erosion rates. Catena 2013, 105, 75–92. [Google Scholar]

| Sample | Coordinates X | Coordinates Y |
|---|---|---|
| S.1 | 225083,754338 | 4492011,62344 |
| S.2 | 224601,153372 | 4491167,07176 |
| S.3 | 223413,700998 | 4492094,17361 |
| S.4 | 223718,501607 | 4493357,82614 |
| S.5 | 222734,249639 | 4492976,82538 |
| Class | t/ha/year | mm/year |
|---|---|---|
| Very low erosion and tolerable soil loss | <5 | <0.50 |
| Low erosion and tolerable soil loss | 5–10 | 0.50–1.00 |
| Mild erosion level | 10–25 | 1.00–2.50 |
| Moderate erosion level | 25–50 | 2.50–5.00 |
| Severe erosion level | 50–100 | 5.00–10.00 |
| Very severe erosion level | 100–200 | 10.00–20.00 |
| Extreme erosion level | >200 | >20.00 |
| Vegetation Cover Type | C Value |
|---|---|
| Mixed hardwood forests | 0.003 |
| Pyrenean oak | 0.04 |
| Riparian forest | 0.09 |
| Poplar and banana plantation in production | 0.09 |
| Ash groves | 0.09 |
| Wild olive groves | 0.18 |
| Juniper groves | 0.18 |
| Cork oak forests | 0.19 |
| Evergreen oak groves | 0.19 |
| Portuguese oak groves | 0.19 |
| Chestnut groves | 0.22 |
| Non-wooded | 0.24 |
| Mix conifer forest | 0.42 |
| NDVI Value | Interpretation |
|---|---|
| 0 a 0.20 | Dead vegetation |
| 0.21 a 0.33 | Sick vegetation |
| 0.34 a 0.66 | Healthy vegetation |
| 0.67 a 1 | Very healthy vegetation |
| Year 1978 y 2010 | Year 2023 | Year 2024 | ||||||||||||
|---|---|---|---|---|---|---|---|---|---|---|---|---|---|---|
| Sample | pH | % Organic Matter | Soil Structure | pH | % Organic Matter | pH | % Organic Matter | Soil Structure | ||||||
| % Coarse Sands | % Fine Sands | % Silt | % Clay | % Coarse Sands | % Fine Sands | % Silt | % Clay | |||||||
| S.1 | 4.4 | 17.8 | 10.4 | 48.0 | 11.5 | 8.6 | 4.22 | 8.55 | 4.56 | 6.18 | 13.29 | 46.53 | 35.04 | 5.13 |
| S.2 | 4.6 | 18.60 | 11.5 | 44.0 | 15.0 | 8.0 | 4.04 | 25.26 | 4.60 | 18.25 | 17.81 | 43.70 | 27.90 | 10.59 |
| S.3 | 4.9 | 13.00 | 9.0 | 43.0 | 23.0 | 10.5 | 4.18 | 17.18 | 4.63 | 21.88 | 12.78 | 50.62 | 25.01 | 11.60 |
| S.4 | 5.3 | 8.20 | 6.0 | 36.5 | 35.4 | 13.9 | 4.27 | 5.91 | 5.09 | 7.34 | 5.64 | 56.24 | 30.59 | 7.53 |
| S.5 | 5.0 | 4.27 | 5.5 | 44.0 | 31.4 | 15.8 | 4.67 | 9.01 | 4.67 | 10.64 | 12.94 | 44.94 | 30.50 | 11.63 |
Disclaimer/Publisher’s Note: The statements, opinions and data contained in all publications are solely those of the individual author(s) and contributor(s) and not of MDPI and/or the editor(s). MDPI and/or the editor(s) disclaim responsibility for any injury to people or property resulting from any ideas, methods, instructions or products referred to in the content. |
© 2025 by the authors. Licensee MDPI, Basel, Switzerland. This article is an open access article distributed under the terms and conditions of the Creative Commons Attribution (CC BY) license (https://creativecommons.org/licenses/by/4.0/).
Share and Cite
Fernández, G.; Merchán, L.; Sánchez, J.Á. Spatial Representation of Soil Erosion and Vegetation Affected by a Forest Fire in the Sierra de Francia (Spain) Using RUSLE and NDVI. Land 2025, 14, 793. https://doi.org/10.3390/land14040793
Fernández G, Merchán L, Sánchez JÁ. Spatial Representation of Soil Erosion and Vegetation Affected by a Forest Fire in the Sierra de Francia (Spain) Using RUSLE and NDVI. Land. 2025; 14(4):793. https://doi.org/10.3390/land14040793
Chicago/Turabian StyleFernández, Gloria, Leticia Merchán, and José Ángel Sánchez. 2025. "Spatial Representation of Soil Erosion and Vegetation Affected by a Forest Fire in the Sierra de Francia (Spain) Using RUSLE and NDVI" Land 14, no. 4: 793. https://doi.org/10.3390/land14040793
APA StyleFernández, G., Merchán, L., & Sánchez, J. Á. (2025). Spatial Representation of Soil Erosion and Vegetation Affected by a Forest Fire in the Sierra de Francia (Spain) Using RUSLE and NDVI. Land, 14(4), 793. https://doi.org/10.3390/land14040793