Article

Research on the Spatio-Temporal Evolution and Impact of China’s Digital Economy and Green Innovation

1
School of Geography and Planning, Sun Yat-Sen University, Guangzhou 510006, China
2
School of Finance, Guangdong University of Finance and Economics, Guangzhou 510320, China
*
Author to whom correspondence should be addressed.
Land 2025, 14(3), 633; https://doi.org/10.3390/land14030633
Submission received: 8 February 2025 / Revised: 27 February 2025 / Accepted: 16 March 2025 / Published: 17 March 2025

Abstract

:
It is of great significance to study the impact of China’s digital economy on green innovation under present conditions. In this work, panel data were used, and research tools such as the entropy method, the Markov chain with a spatial Markov probability transition matrix, and a spatial Durbin model were applied to analyze the temporal and spatial evolution of the digital economy and green innovation in 287 Chinese cities from 2011 to 2021, exploring the influence of the digital economy on green innovation. The results show that the digital economy and green innovation in Chinese cities exhibited an upward trend. There was a basic spatial pattern consisting of “high levels in the east and low levels in the west” regarding the digital economy and green innovation, with the aggregation types primarily being “HH” and “LH”. Moreover, the types of digital economy and green innovation in Chinese cities are relatively stable, with neighboring areas influencing local changes. The digital economy has a significant promotional effect on green innovation, as well as spatial spillover effects; the differing influences over time can be used to categorize the cities into four groups, with most falling within the first two categories. Based on these findings, relevant countermeasures are proposed, seeking to further enhance the role of the digital economy in promoting green innovation. This work provides a research basis and policy suggestions to contribute to continuous improvements in China’s digital economy and green innovation, leveraging the promotional effects of the former on the latter.

1. Introduction

“Green” and “innovation” are the mainstays of transformational development in countries around the world today. Since the onset of the global financial crisis in 2008, countries around the world have realized that the black economic development model characterized by resource depletion and a dependence on fossil fuels is unsustainable and that it is necessary to transition to a green model to achieve sustainable development at the economic level [1]. At the same time, with the emergence of global economic integration, the traditional industrial structure has been reshaped. It has gradually shifted from labor- and resource-intensive industries to technology- and knowledge-intensive industries, in which modern scientific and technological innovation and research and development have become the main power. Therefore, “green” and “innovation” have become the main directions of the world’s transformation and development, and they are also important entry points for the new era of Chinese-style modernization. In particular, considering the international community’s increasing focus on ecological and environmental issues, green innovation has become an important means to promote high-quality economic development. It also represents an inevitable choice in the achievement of sustainable development [2].
The digital economy is developing rapidly, thanks to the continuous innovation of information technology and the acceleration of the globalization process, as well as the continuous iteration and upgrading of emerging technologies such as the Internet of Things, big data, and artificial intelligence. In 2022, the digital economy, comprising 51 major economies around the world, accounted for 46.1% of GDP, and it has become an important source of support in the development of the global economy. China is the second-largest country in the world in terms of the scale of its digital economy. In 2022, China’s digital economy exceeded the 50 trillion mark, and it has served to significantly boost urban economic growth and support high-quality economic development [3]. It is a key driving force for national innovation and change [4] and can provide diversified support for the achievement of regional green innovation. The National Informatization Plan within the 14th Five-Year Plan emphasizes the need to “lead greening with digitalization”, reflecting the enormous potential of the digital economy to drive green innovation. The digital economy enables us to overcome temporal and spatial limitations, optimize the allocation of innovative resources, and introduce new business forms and models, providing a strong foundation for green innovation [5]. Therefore, the digital economy offers strong impetus for the green development of the economy [6], and it also supports green innovation [4,7]. Thus, it is meaningful and valuable to study the impact of the digital economy on green innovation in Chinese cities under the current conditions.

2. Literature Review

Through the combing of the viewpoints in the existing literature on the digital economy and green innovation, it is found that, after several years of development and research, the academic community has achieved some progress in identifying the connotations of the digital economy [8] and green innovation [9,10], and the current research mainly focuses on empirical analysis, including indicator systems and measurements, research on influencing factors, and research on the interrelationship between the two.
In terms of the construction and measurement of an indicator system, regarding the digital economy, studies have focused on constructing a multi-dimensional, comprehensive evaluation system from the perspectives of digital industrialization, industrial digitization, digital governance [11], and digital infrastructure [12]. The research methodologies mainly include principal component analysis [13], the entropy value method [14], and other objective methods, seeking to comprehensively evaluate the level of development of the digital economy. Regarding green innovation, three main types of measures are commonly used. The first aims to establish a comprehensive evaluation index reflecting the green innovation capacity; the constructed system usually includes dimensions such as innovation input, innovation output, and green development [15,16]. Secondly, green innovation is measured from the perspective of efficiency, and the methods used include data envelopment analysis (DEA) [17,18] and the SBM model of non-expected outputs [5]. Thirdly, the number of green patents is used as a proxy variable for green innovation [19,20].
In terms of impact factor studies, since the 20th century, the impact of the digital economy on regional development has been increasingly emphasized by researchers. Its impact is reflected in various aspects, such as promoting economic development [21,22], reducing carbon emissions [23], enhancing the regional innovation capacity [24], and facilitating industrial transformation and upgrading [25]. The factors that influence green innovation are diverse and include government intervention [26], foreign investment [27], the economic development level [28], and the industrial structure [29].
As the digital economy and green innovation development will become the mainstream of China’s economic development, the amount of literature exploring the interrelationship between the two is gradually increasing. In terms of theoretical research, some scholars have summarized three specific methods of enhancing the efficiency of green technological innovation in enterprises empowered by the digital economy—namely, digital technology upgrading, the all-round synergistic cooperation mode, and the standardized thinking mode. Moreover, the challenges currently faced have been analyzed [30]. Empirical studies have shown that the development and application of digital technology [31] and enterprise digital transformation [32] can significantly promote green innovation, and the degree of coupling and coordination between China’s digital economy and green innovation is gradually rising, while regional differences exhibit a downward trend [33,34]. The digital economy significantly promotes green technological innovation in cities [1], and this positive impact has spatial spillover effects [35]. The digital government plays an important role in enabling green innovation in the digital economy [36]. However, some scholars believe that the expansion of the scale of digitalization does not necessarily promote green innovation [37]. Some studies have found that the development of the digital economy has a U-shaped influence on regional green innovation, characterized by an inhibitory effect followed by a promotional effect [38].
In general, the existing literature contains extensive information about the digital economy and regional green innovation, with a number of relevant research results. Several studies have shown that the digital economy has a significant role in promoting green innovation; this provides a strong theoretical basis and empirical support for the impact of the digital economy on regional green innovation. However, a summary of the available studies reveals that most of them are based on an economic perspective, involving the direct construction of econometric models to measure the relationship between the two roles [39,40,41], and they rarely consider the temporal evolution, spatial distribution, spatial agglomeration, and spatial–temporal evolution of the digital economy and green innovation from a geographic point of view. Moreover, for the analysis of heterogeneity, fewer studies on temporal heterogeneity have been conducted. Most of the current studies on regional heterogeneity analyze the division of China into several regions based on geographic location [1,4,42], ignoring the fact that cities in different provinces within the same region also differ in their development and cannot be generalized. Based on this, this research took 287 cities in China as the study area and used the entropy method, Markov chain, spatial Markov transfer probability matrix, and spatial autocorrelation methods to explore the overall development trend in China’s digital economy and green innovation in the period 2011–2021; further analyzed the trends in changes in different sub-dimensions; and summarized the spatial distribution and agglomeration characteristics of the digital economy and green innovation. The impact of the digital economy on green innovation was analyzed using the spatial Durbin model to further investigate its temporal and spatial heterogeneity. The purpose of this study was to summarize the spatial and temporal evolution characteristics of China’s digital economy and green innovation from a geographic perspective, and to explore the impact of the digital economy on green innovation and its temporal and spatial heterogeneity, as well as to enhance China’s digital economy and green innovation and to achieve a benign interaction between the two. The possible contributions of this paper are as follows: (1) summarizing the trends in the digital economy and green innovation in Chinese cities for each dimension in order to grasp the main driving factors; (2) applying Markov and spatial Markov transfer probability matrices to analyze the temporal and spatial evolutionary patterns in China’s digital economy and green innovation, to reveal the dynamic evolutionary process and the change probability of China’s digital economy and green innovation and to demonstrate the impact of spatial correlation on the transfer probability; (3) analyzing the impact of the digital economy on green innovation at different stages and the causes, and revealing the roles of national policies and market demand factors; (4) not limiting ourselves to dividing China’s city types according to geographic location, but rather dividing them based on the results of this study, which is more in line with the actual situation of urban development and is conducive to the formulation of development policies according to the characteristics of different regions.

3. Research Area and Data

3.1. Research Area and Data Sources

Limited by the availability and completeness of the data, 287 cities in China, covering the period 2011–2021, were selected for this study. The data on digital-economy-related indicators were obtained from the 2012–2022 China Urban Statistical Yearbook, the Peking University Digital Inclusive Finance Index (2011~2021) compiled by the Peking University Digital Finance Center (https://idf.pku.edu.cn/, accessed on 30 January 2023)), and the China Research Data Service Platform (https://www.cnrds.com/, accessed on 1 December 2024). The data on green-innovation-related indicators were obtained from the China Research Data Service Platform (https://www.cnrds.com/, accessed on 1 December 2024). Some of the missing data were addressed by applying the average value method and interpolation method.

3.2. Indicator Descriptions

Combining the connotations and development characteristics of the digital economy and green innovation, and based on the principles of comprehensiveness, scientificity, systematicity, hierarchy, comparability, and accessibility, a comprehensive evaluation index system for the digital economy and green innovation was constructed (Table 1). The meaning of the indicators and the rationale for their selection are provided below:
(1) Explained variable: green innovation (GI). Compared with traditional innovation activities, green innovation takes greenness as the core concept to achieve a win–win situation of environmental benefits and economic effects. Based on existing research, a comprehensive evaluation index system for green innovation was created by considering the three dimensions of the green innovation foundation, input, and output [43]. The green innovation foundation of a city encompasses the city’s social and environmental foundations, referring to relevant literature [43,44], with the per capita green space area and the rate of the harmless treatment of domestic waste as the measurement indicators. From the perspective of production factors, green innovation inputs can be divided into human inputs and capital inputs; based on the availability of data, the selected indicators were the proportion of university students in general higher education to the total population and the proportion of the local government’s science and technology expenditure to GDP, respectively [45]. Green innovation outputs include new products and processes that can create value for consumers and enterprises and help to reduce the environmental impact or achieve ecological sustainability goals, and they can be considered in terms of both quality and quantity. Referring to the corresponding literature [46], the quality of green innovation in cities is measured as the logarithmic value of the number of patents granted for green inventions plus one, and the quantity of green innovation is measured as the logarithmic value of the number of patent applications for green inventions plus one.
(2) Core explanatory variable: digital economy (DE). Based on the connotations of the digital economy and existing research [47], the constructed evaluation index system for the digital economy includes four dimensions: the digital foundation, the digital industry, digital applications, and digital innovation. The digital foundation refers to infrastructure support, such as cables, optical fibers, broadband networks, and mobile interconnections, provided for emerging fields such as big data, cloud computing, and artificial intelligence. It reflects the construction level of the basic foundations required for the development of the digital economy. Referring to existing studies, the number of cell phone users per 100 people was selected to reflect the level of the digital foundation [11]. The digital industry mainly includes the information and communication industry, which represents the core industry in the development of the digital economy. Referring to existing studies, the percentage of computer service and software employees and the per capita telecommunication business income were selected to characterize the level of the digital industry [12]. Digital applications represent the integration of digital economic development and social production and life. Referring to existing studies, China’s digital inclusive finance index and the number of broadband users per 100 people were chosen to measure the level of digital applications [47]. Innovation is the primary driving force of development, and digital innovation is one of the most important factors in evaluating the level of digital economic development. With reference to existing studies, the logarithmic value of the number of invention patents authorized in the digital economy plus one was taken as the logarithm of the digital innovation level [48].
(3) Control variables: In view of the complexity of the factors influencing regional green innovation, in order to reduce the measurement bias caused by the model setup and obtain more accurate measurement results, other variables that may have an impact on green innovation were controlled based on the existing relevant literature [49,50]. The specific control variables include the level of economic development (EL), the level of local financial input (FI), and foreign investment (FD). Among them, the level of economic development is closely related to green innovation, and regions with higher levels of economic development generally have more sufficient resources for R&D investment, so the level of economic development was adopted to be represented by GDP per capita. The level of local financial input reflects the importance of local governments to green innovation, as they can provide financial support for green innovation projects, and this level was portrayed by adopting the ratio of public financial revenue to GDP. The advanced technology and management experience brought by foreign investment can impact green innovation, which is measured by the ratio of the actual amount of foreign investment used in the year to GDP.

3.3. Research Methods

3.3.1. Entropy Method

The entropy reflects the degree of disorganization among the indicator values, and the weight assigned reflects the relevance of the influence of the indicator within the overall system; the greater the weight is, the greater is the influence of the indicator as a whole. This method demonstrates objectivity in assessing the capacity for coordination between the layers of the regional system, and the specific calculation formula is derived from the related literature [51].

3.3.2. Markov Chain and Spatial Markov Transfer Probability Matrix

In order to further investigate the characteristics of the internal dynamic development of China’s digital economy and green innovation, this study was carried out using Markov chains and spatial Markov transfer probability matrices. The spatial statistical method can present the static processes of regional phenomena when revealing them; however, it has certain limitations. It cannot directly reflect the dynamic development characteristics of the region, and it is also difficult for it to provide the internal dynamic information of things in the process of evolution. Therefore, to compensate for these shortcomings, this study adopted the Markov chain method, which regards the evolution of regional phenomena as a Markov process and introduces transfer probability matrix analysis. In this way, it is possible to consider the dynamic evolution process of each individual phenomenon in the region in different periods, and then clearly reflect the state that each area in the region is in, as well as the mobility of its upward or downward transfer [52].
According to the evaluation level of the digital economy and green innovation, 287 prefecture-level cities were categorized into five types, namely, low, lower, medium, higher, and high, based on the natural breakpoint method. These are denoted as k = 1, 2, 3, 4, and 5, respectively, and the changes between different types are represented by the Markov transfer probability matrix M of k × k , where P i j is the probability of belonging to type i at moment t but belonging to type j at moment t + 1. A transfer from a low value to a high value is defined as an upward transfer and vice versa. The main diagonal data of the Markov transfer probability matrix indicate the probability that the digital economy or green innovation in Chinese cities will remain in its original state, and the non-diagonal data indicate the probability of an upward or downward transfer. The formula for P i j is
P i j = z i j z i
where z i j denotes the total number of studied areas belonging to type i at moment t and transferred to type j at the next moment throughout the study period; z i denotes the total number of areas belonging to type i throughout the study period.
Existing research has shown that spatial spillover effects due to geographical proximity play an important role in regional development evolution, and the spatial characteristics of regional phenomena cannot be ignored [52]. Therefore, considering the spatial characteristics of regional phenomena, the concept of a “spatial lag” was introduced into the traditional Markov chain transfer probability matrix, and the Markov matrix was constructed under different spatial lag conditions. The original k × k transfer matrix was decomposed into k probability matrices with the transfer conditions of k × k . The type of spatial lag of a spatial unit is determined by its spatial lag value, and the spatial lag value l a g a is the spatially weighted average of the attribute values of the neighboring regions of the spatial unit. The formula is
l a g a = b = 1 n Y b W a b
where Y b is the observed value of region b, l a g a is the spatial lag value of region a, n is the total number of cities, and the spatial weight matrix W a b represents the spatial relationship between region a and region b. In this work, the economic–geographical weight matrix was used to define the spatial relationship, and the specific definition of the economic geography matrix is shown in 3 :
W e c o = 1 d i j 2 × d i a g Y ¯ 1 Y ¯ , Y ¯ 2 Y ¯ , , Y ¯ n Y ¯
where W e c o is the economic–geographical weight matrix, d i j 2 denotes the square of the distance between region i and region j, Y ¯ i = 1 t 1 t 0 + 1 t 0 t 1 Y i t denotes the average GDP per capita of province i and province j, Y ¯ = 1 n ( t 1 t 0 + 1 ) i = 1 n t 0 t 1 Y i t denotes the average GDP per capita of the sample provinces, and t 1 t 0 + 1 is the period of examination.

3.3.3. Spatial Autocorrelation

Spatial autocorrelation analysis is a basic type of spatial analysis that is used to measure the degree of mutual influence and interdependence among different variables in a geographic location. It includes the global Moran’s I and local Moran’s I. In this study, we used the global Moran’s I to test the spatial autocorrelation between the digital economy and green innovation, as the local Moran’s I focuses on describing the spatial correlation patterns of different spatial units and their neighbors. For the calculation formula, please refer to the related literature [45].

3.3.4. Spatial Durbin Models

In order to explore the impact of the digital economy on green innovation in Chinese cities with extreme spatial spillover effects, a spatial Durbin model was constructed based on city panel data:
Y i t = α W Y i t + β 1 D E i t + β 2 W D E i t + γ 1 X i t + γ 2 W X i t + ε i t
where Y i t is the green innovation level of region i at time t; D E i t denotes the digital economy level of region i at time t; α W Y i t represents the impact of the local green innovation level according to the green innovation levels of neighboring regions; β 1 D E i t and β 2 W D E i t denote the impacts of the digital economy level and the digital economy levels of neighboring regions on the green innovation level of the region, respectively, which can be interpreted as the impacts of the digital economy of the region on the green innovation level of the region and its neighbors; X i t is the control variable; W is the spatial weight matrix, where we used the economic–geographical weight matrix in this work; and ε i t is the random error term.

4. Results

4.1. Spatio-Temporal Evolutionary Characteristics of China’s Digital Economy and Green Innovation

4.1.1. Time-Varying Patterns of Change in the Digital Economy and Green Innovation

In terms of the patterns of change over time, the overall trend of the digital economy and green innovation in Chinese cities showed a slow increase (Figure 1). Overall, the level of the digital economy in the studied cities rose from 0.0800 in 2011 to 0.1944 in 2021, but the overall level was not high. The level of green innovation in Chinese cities rose from 0.1040 to 0.1650 during 2011–2021. Despite this increase, the overall level was not high; it was lower than the level of the digital economy. Thus, China’s green innovation still needs to be improved.
From the perspective of the sub-dimensions of the digital economy and green innovation (Figure 1), the overall level of digital innovation was higher than the levels of the other three sub-dimensions, showing a fluctuating upward trend. The level of digital application showed a rising trend, with the obtained value increasing from 0.0785 to 0.3870 during the study period, which is the largest overall increase. The trends in the digital industry and digital foundation were roughly the same; i.e., the level fluctuated less, and the obtained value did not change significantly. The level of digital foundation was slightly higher than that of the digital industry; they increased by 0.0162 and 0.0273, respectively, during the study period. In the green innovation sub-dimension, the level of green innovation outputs was the highest, showing a fluctuating upward trend, ranging from 0.2173 in 2011 to 0.4032 in 2021. This was the largest incremental increase, demonstrating a larger driving effect on green innovation. The level of green innovation inputs was similar to that of green innovation, also showing a slow upward trend, increasing by 0.0496 in 11 years, while the level of the green innovation foundation was the lowest and the change was not obvious.

4.1.2. Characterizing the Spatial Distribution of the Digital Economy and Green Innovation

In terms of spatial distribution characteristics, China’s digital economy generally showed a spatial pattern consisting of “high levels in the east and low levels in the west” (Figure 2). In 2011, most Chinese cities were at low levels regarding the digital economy, while the Yangtze River Delta, the Pearl River Delta, the Shandong Peninsula, Beijing–Tianjin–Hebei, and Chengdu–Chongqing were relatively well developed; these regions have a strong economic foundation and industrial advantages, and the development of the digital economy started faster in these areas. Beijing and Shenzhen, with their developed economies and strong capacity for innovation, reached high digital economy levels. In 2016, the level of China’s digital economy increased across the board, with most cities reaching low levels. The level of the digital economy in the eastern coastal region was still relatively high, while developed cities such as Guangzhou, Shanghai, Nanjing, Hangzhou, and Xiamen had achieved high digital economy levels. In 2021, the level of China’s digital economy continued to increase, and most cities reached medium levels. Some cities in the western and northeastern regions remained at lower digital economy levels, while the numbers of cities in the eastern and central regions that reached high digital economy levels increased; these were mainly provincial capital cities.
During the study period, green innovation in Chinese cities showed a spatial pattern consisting of “decreasing from the southeast coast to the northwest inland” (Figure 3). In 2011, most Chinese cities exhibited low green innovation levels, while cities with higher levels were mainly concentrated in the eastern coastal region. The country generally showed a spatial pattern in which the eastern coastal region was leading, and the central, western, and northeastern regions were lagging behind. In 2016, cities with lower green innovation levels were observed in the inland region, and the green innovation level of the eastern coastal region was further improved, with the number of cities reaching medium and higher levels increasing. In 2021, the green innovation level continued to improve; more than half of the cities had reached lower and higher levels, the scope of the region with high and higher levels in the eastern coastal region had expanded, and the green innovation levels of some cities in the western region had also improved to a certain extent, especially some provincial capitals and resource-oriented cities.

4.1.3. Spatial Clustering Characteristics of the Digital Economy and Green Innovation

In terms of spatial agglomeration characteristics, the spatial agglomeration of the digital economy in Chinese cities was mainly dominated by HH-type agglomeration and LH-type agglomeration (Figure 4). In 2011, the HH-type cities were concentrated in the Pearl River Delta, the Yangtze River Delta, and the Beijing–Tianjin–Hebei clusters, which suggests that the eastern coastal region formed the core area for the development of the digital economy, with a strong agglomeration effect. In contrast, the higher level of the digital economy in the Pearl River Delta caused the neighboring cities to show LH-type agglomeration characteristics. In 2016, the distribution of HH-type cities did not change significantly, and they were still distributed in the southeastern coastal region. In 2021, the pattern of HH-type cities changed considerably, and they began to be distributed in the central and northeastern regions.
During the study period, the spatial agglomeration of green innovation in Chinese cities was mainly dominated by the HH type and LH type (Figure 5). In 2011, those exhibiting the HH type were mainly concentrated in eastern developed city clusters, such as the Yangtze River Delta, the Pearl River Delta, and Beijing–Tianjin–Hebei, indicating that the level of green innovation in these regions was higher, and they essentially formed a green innovation highland. In 2016, the HH type was still concentrated in the eastern region, and the number of LH-type regions declined, indicating that the gap between the levels of green innovation in Chinese cities was shrinking. In 2021, the overall pattern of the HH-type cities remained almost unchanged, and the distribution of LH-type cities was gradually reduced to the south, indicating that the gap in the green innovation of the cities in China’s northeastern and western regions is narrowing, while the level of green innovation in the developed cities in the southern region is still significantly higher than that of the neighboring cities, and the diffusion effect needs to be further improved.

4.1.4. Characterizing the Spatio-Temporal Evolution of the Digital Economy and Green Innovation

To further explore the spatiotemporal evolutionary characteristics of digital economy and green innovation levels in Chinese cities, the traditional Markov chain and spatial Markov chain were analyzed. From the results shown in Table 2 and Table 3, it can be seen that, firstly, the digital economy and green innovation in Chinese cities show the phenomenon of “club convergence”. The probability values on the diagonal are larger than those on the off-diagonal, indicating that the probability of the original state being maintained is higher, showing obvious growth inertia and path dependence. Secondly, the transitions between different digital economy types mostly occurred between neighboring cities, making it difficult to achieve leapfrog transfer. The probability of cross-ranking transfer for each type of digital economy was less than 2%, while the probability of cross-ranking transfer among the urban green innovation types was 0, indicating that there was no leapfrog development among the urban green innovation types in China. Thirdly, the probability of upward transfer among the digital economy and green innovation types in Chinese cities was greater than the probability of downward transfer, which confirms the previous conclusion that the level of China’s digital economy and green innovation is constantly improving.
The spatial lag condition was added to the traditional Markov transfer probability matrix to construct a spatial Markov transfer probability matrix, and the impact of the neighborhood background on the transfer of the digital economy or green innovation was explored through a comparative analysis of the probability of transfer among different levels of urban digital economy or green innovation against different neighborhood backgrounds. From the comparison of Table 4 with Table 2 and Table 5 with Table 3, we can derive the following: Firstly, there is a spatial spillover phenomenon in the development of the digital economy and green innovation in Chinese cities, and the levels of neighboring regions affect the probability of type transfer in a given region. Secondly, different neighboring regions have different impacts on the digital economy and green innovation in a given region. Specifically, when the neighboring region’s digital economy type is 1, the probability of a given region’s digital economy shifting from type 1 to type 2 is 0.1579, compared to the original value of 0.3500. In other words, a neighboring region with a low digital economy level will have a negative spillover effect on a given region. Similarly, neighboring regions with high digital economy levels will have positive spillover effects. Regarding green innovation, when the green innovation of both the examined region and neighboring region is type 2 or below, the probability that the green innovation of the examined region will remain as the original type or shift downwards increases. This suggests that neighboring regions with low levels of green innovation will have negative spillover effects on other regions. Thirdly, when the green innovation type of the neighboring region is 5, the probability of shifting in each type is 0. On the one hand, this may be due to the fact that the number of cities in China that have reached a high level of green innovation is small; therefore, the sample size is relatively small. On the other hand, it may also indicate that the cities with high levels of green innovation do not exert a spillover effect and have a weak impact on the neighboring cities.

4.2. The Effects of the Digital Economy on Green Innovation

4.2.1. Spatial Correlation Test Between Digital Economy and Green Innovation

Using the economic–geographical weight matrix, the global Moran’s index of the digital economy and green innovation in Chinese cities was calculated (Table 6). During the study period, there was a significant positive spatial correlation between the urban digital economy and green innovation. Specifically, the correlation of the digital economy decreased year by year, indicating that, although the digital economy has the characteristics of spatial agglomeration, they have weakened over time. In contrast, green innovation shows a fluctuating pattern, first increasing and then decreasing; in general, the level of change in the Moran’s I value is not significant, indicating that the agglomeration effect of green innovation changed during the study period.

4.2.2. Basic Effects of the Spatial Durbin Model

From the above, it can be seen that, during the study period, the digital economy and green innovation in Chinese cities all showed significant positive spatial autocorrelation. In order to further explore the extremely spatial spillover effects affecting the impact of the digital economy on green innovation, we introduced spatial modeling. After considering the LM test, LR test, Wald test, and Hausman test, the spatial Durbin model with spatial fixed effects was finally chosen for this analysis.
The regression results of the spatial Durbin model with spatial fixed effects are shown in Table 7. Among them, the variable of the digital economy level (DE) passed the significance test, and the estimated coefficients were 0.1868 and 0.0700, indicating that an improvement in the digital economy level will have a positive impact on green innovation in the region; at the same time, it will have a positive, promotional effect on the neighboring cities.

4.2.3. Decomposition of Effects in the Spatial Durbin Model

Due to the existence of complex interactions between neighboring cities, in order to analyze the spatial effects more comprehensively, partial differential processing was performed in order to determine the direct and indirect effects [53]. We decomposed the coefficients of the impact of the digital economy on green innovation into the direct effect, indirect effect, and total effect.
The results of the effect decomposition are shown in Table 8. The direct effect of the digital economy on green innovation is significant at 0.1926, the indirect effect is significant at 0.3121, and the total effect is significant at 0.5046. This indicates that the development of the digital economy in the region not only has a positive, promotional effect on the level of green innovation in the region, but also has a significant spatial spillover effect. If the interactive influence of spatial factors is ignored, the effect of the digital economy in promoting regional green innovation will be underestimated, thus confirming the benefits of using the spatial measurement model.
Among the control variables, the direct effect of the level of economic development is significant and positive, the indirect effect is significant and negative, and the total effect is positive but not significant. This indicates that good economic conditions help to improve the level of green innovation in a region but inhibit the development of neighboring regions. The direct effect of the local financial input level is positive but does not pass the significance test, and the indirect effect and total effect are both significant and negative. The negative impact of the indirect effect outweighs the weak positive impact of the direct effect, which is possibly constrained by inter-regional competition and uncoordinated fiscal input strategies. The direct effect of the level of foreign investment is negative but not significant, and the indirect and total effects are significant and positive and have large coefficients, suggesting that foreign investment in general has a facilitating effect on the development of green innovation in China.

4.3. Heterogeneity Analysis of the Effect of the Digital Economy on Green Innovation

4.3.1. Temporal Comparison of Impact Effects

The development of a region is affected by macro policy and the global environment, among other factors, and different stages of national development have certain impacts on the digital economy and green innovation. The period 2011–2015 was covered by China’s 12th Five-Year Plan, while 2016–2020 was covered by the 13th Five-Year Plan, and 2021 can be regarded as a transitional year for the consolidation and connection of the results of the 13th Five-Year Plan. There are differences in the development goals, tasks, and policy orientations of the different five-year periods. Taking into account the balance of data from different time periods, a comparative study of the periods 2011–2015 and 2016–2021 was performed to determine the changes in the trends, effectively compare the effects of policy implementation, and understand the intrinsic links between the two.
From the results shown in Table 9, it can be seen that the digital economy has consistently made a significant contribution to green innovation. During the 12th Five-Year Plan period, the development of the digital economy in the region had a greater impact on green innovation in neighboring regions, while the estimated coefficient of the impact of the development of the digital economy in the region on green innovation in the region increased to 0.1120. This is greater than the estimated coefficient of the impact on the neighboring regions (0.1066) in the period 2016–2021. Over time, the impact of the region’s digital economy on its green innovation has gradually improved, eventually surpassing the impact on neighboring regions.

4.3.2. Regional Comparison of Impact Effects

China’s territory is vast, and different regions exhibit significant differences in their resource endowment, industrial structure, and institutional conditions; thus, the effect of the digital economy on green innovation and development may exhibit regional heterogeneity. Based on the OLS model, we explored the effect of the digital economy on green innovation in provinces, autonomous regions, and municipalities directly under the central government (hereinafter referred to as provinces). Based on the estimated coefficients and the significance of the province as a unit, the 287 cities were divided into four categories; the spatial distribution is shown in Figure 6. The regression results obtained for the representative provincial cities in the four categories are listed in Table 10.
The first category consists of cities with strong, significant promotion, where the estimated coefficient is significant and positive, and the value is greater than 1. The digital economy significantly improves the level of green innovation, and the enhancement is large. It includes cities in Shanxi, Inner Mongolia, Jilin, Jiangsu, Jiangxi, Shandong, Hubei, Guangdong, Guangxi, Guizhou, Yunnan, and Xinjiang, with a total of 12 provinces.
The second category consists of cities with weakly significant promotion, where the estimated coefficient is significant and positive, and the value is less than 1. The digital economy has a certain promotional effect on the level of green innovation. It includes cities in 12 provinces, namely Hebei, Liaoning, Heilongjiang, Zhejiang, Anhui, Fujian, Henan, Hainan, Sichuan, Shaanxi, Gansu, and Ningxia.
The third category consists of cities with non-significant promotion, where the estimated coefficient is positive but not significant. Although the digital economy has a positive impact on green innovation, the limited sample size may be limited, or the impact may be relatively weak and thus not significant. These areas are Beijing, Tianjin, Shanghai, Hunan, and Qinghai, with a total of five provinces.
The fourth category is the inhibiting category, with negative estimated coefficient values, where the development of the digital economy hinders green innovation. It includes cities in Tibet and Chongqing.
It can be seen that, in general, the digital economy in most provinces of China makes a significant contribution to the level of green innovation, with the first and second categories of cities as the main category. In some cities, the digital economy has an inhibitory effect on green innovation, but the number of these cities is small.

5. Discussion

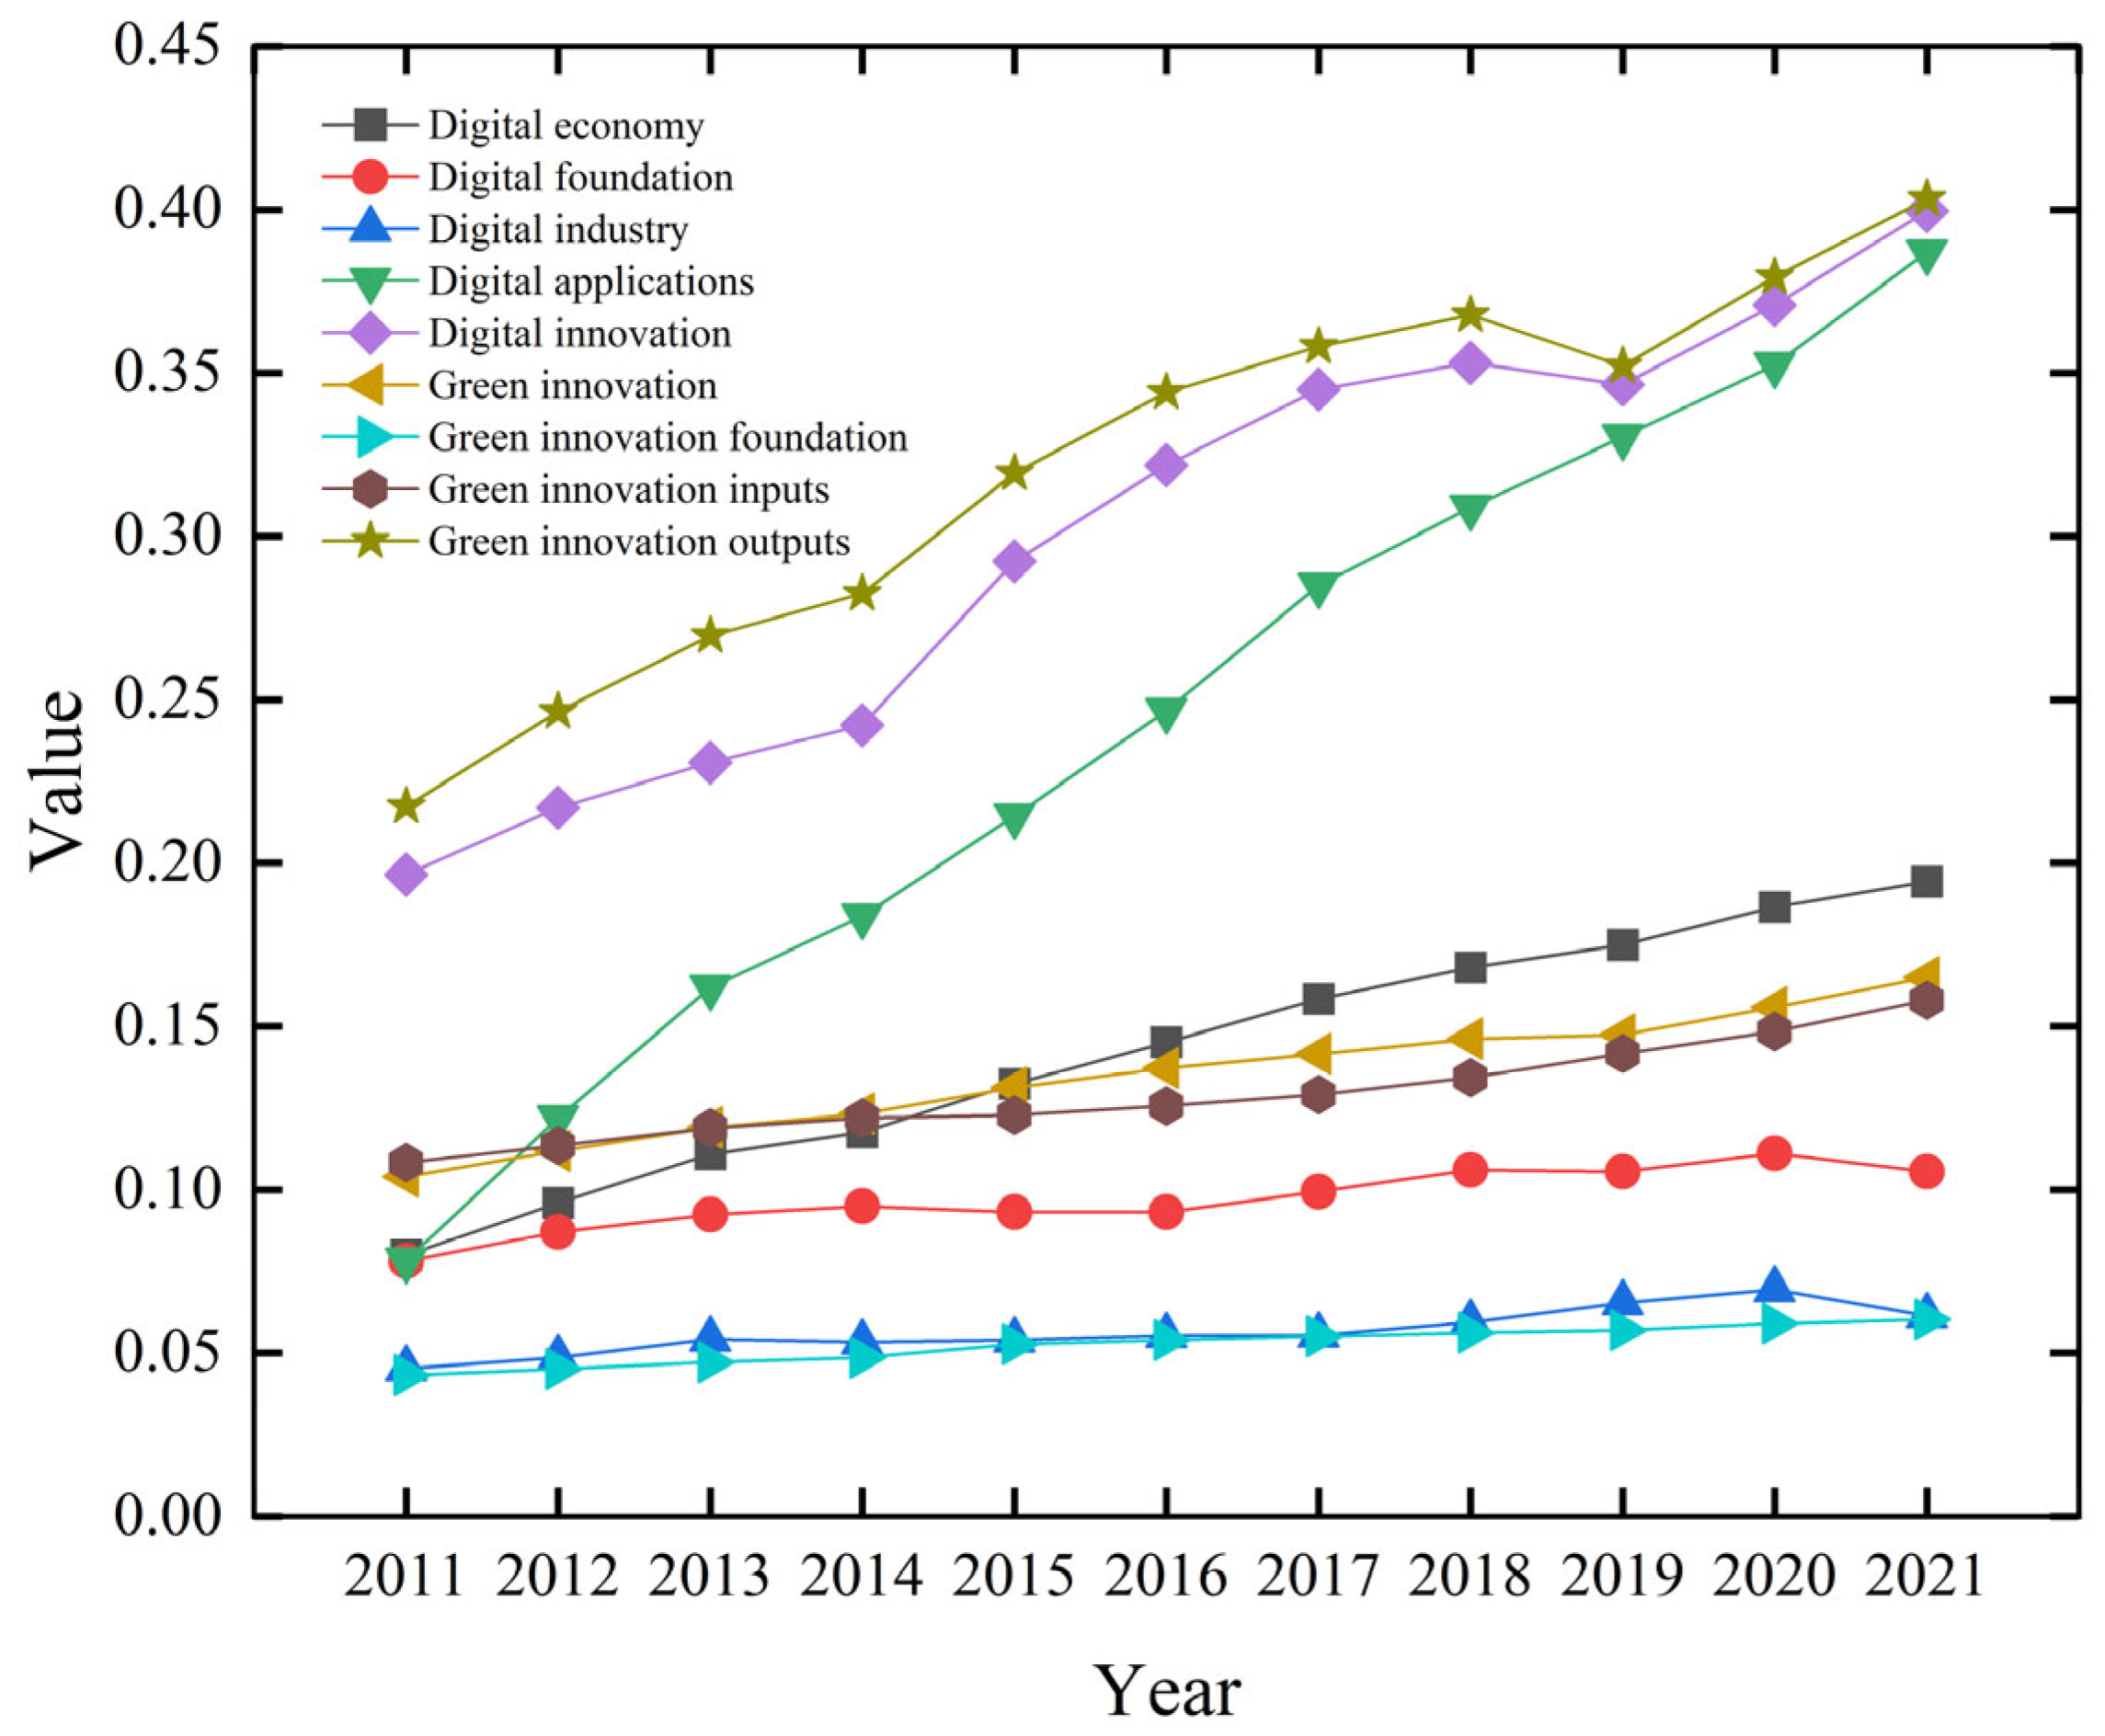
The time change law of China’s digital economy and green innovation shows that, as a whole, both of them showed an upward trend, indicating that China achieved certain development results during this 11-year period, and is expected to maintain the momentum of continuing to rise in the future, but numerically, there is still much room for improvement. In addition, this study innovatively summarizes the pattern of change in the sub-dimensions, which provides a new perspective and direction for academic research and helps us to explore the intrinsic power mechanism of the digital economy and green innovation in depth. From the perspective of the digital economy sub-dimension, the main driving force promoting the level of the digital economy is digital innovation and digital application. On the one hand, China’s overall innovation vitality is strong, and digital innovation occupies an important position in the development of the digital economy, being the key driving force leading the development of the latter. On the other hand, thanks to the continuous improvements in Internet infrastructure and the rapid development of financial technology, as well as the extensive promotion and application of digital inclusive finance, the level of digital application has significantly increased, causing the popularity and depth of application of the digital economy in cities to continue to expand. The slow increase in the level of digital infrastructure and digital industry may be constrained by the gradual saturation of the mobile phone market in urban areas, the limited number of new subscribers, and the relatively small market size of computer services, the software industry, and the telecommunications industry. In terms of the green innovation sub-dimension, the green innovation output is the main driving force raising the level of green innovation, which is a joint result of market demand-driven and technology advancement-led changes. On the one hand, the growing consumer demand for green products and services has prompted companies to increase their investment in patents for green inventions, while, on the other hand, the constant innovation in technological methods has made it possible to create better green products. The increase in investment in green innovation plays a certain role in promoting green innovation, and the increase in the proportion of science and technology expenditure has led to more funds being used in the field of green innovation research and development, while the popularization of tertiary education has cultivated a larger number of potential talents for green innovation and provided talent support. The small increase in the green innovation foundation may be due to the fact that Chinese cities already have sufficient green space, and, given the limited urban land resources, an increase in green space appears to be insignificant in the process of economic development and the construction of other infrastructure. Meanwhile, most cities have already achieved 100% environmentally sound waste disposal, making the overall improvement in this value small.
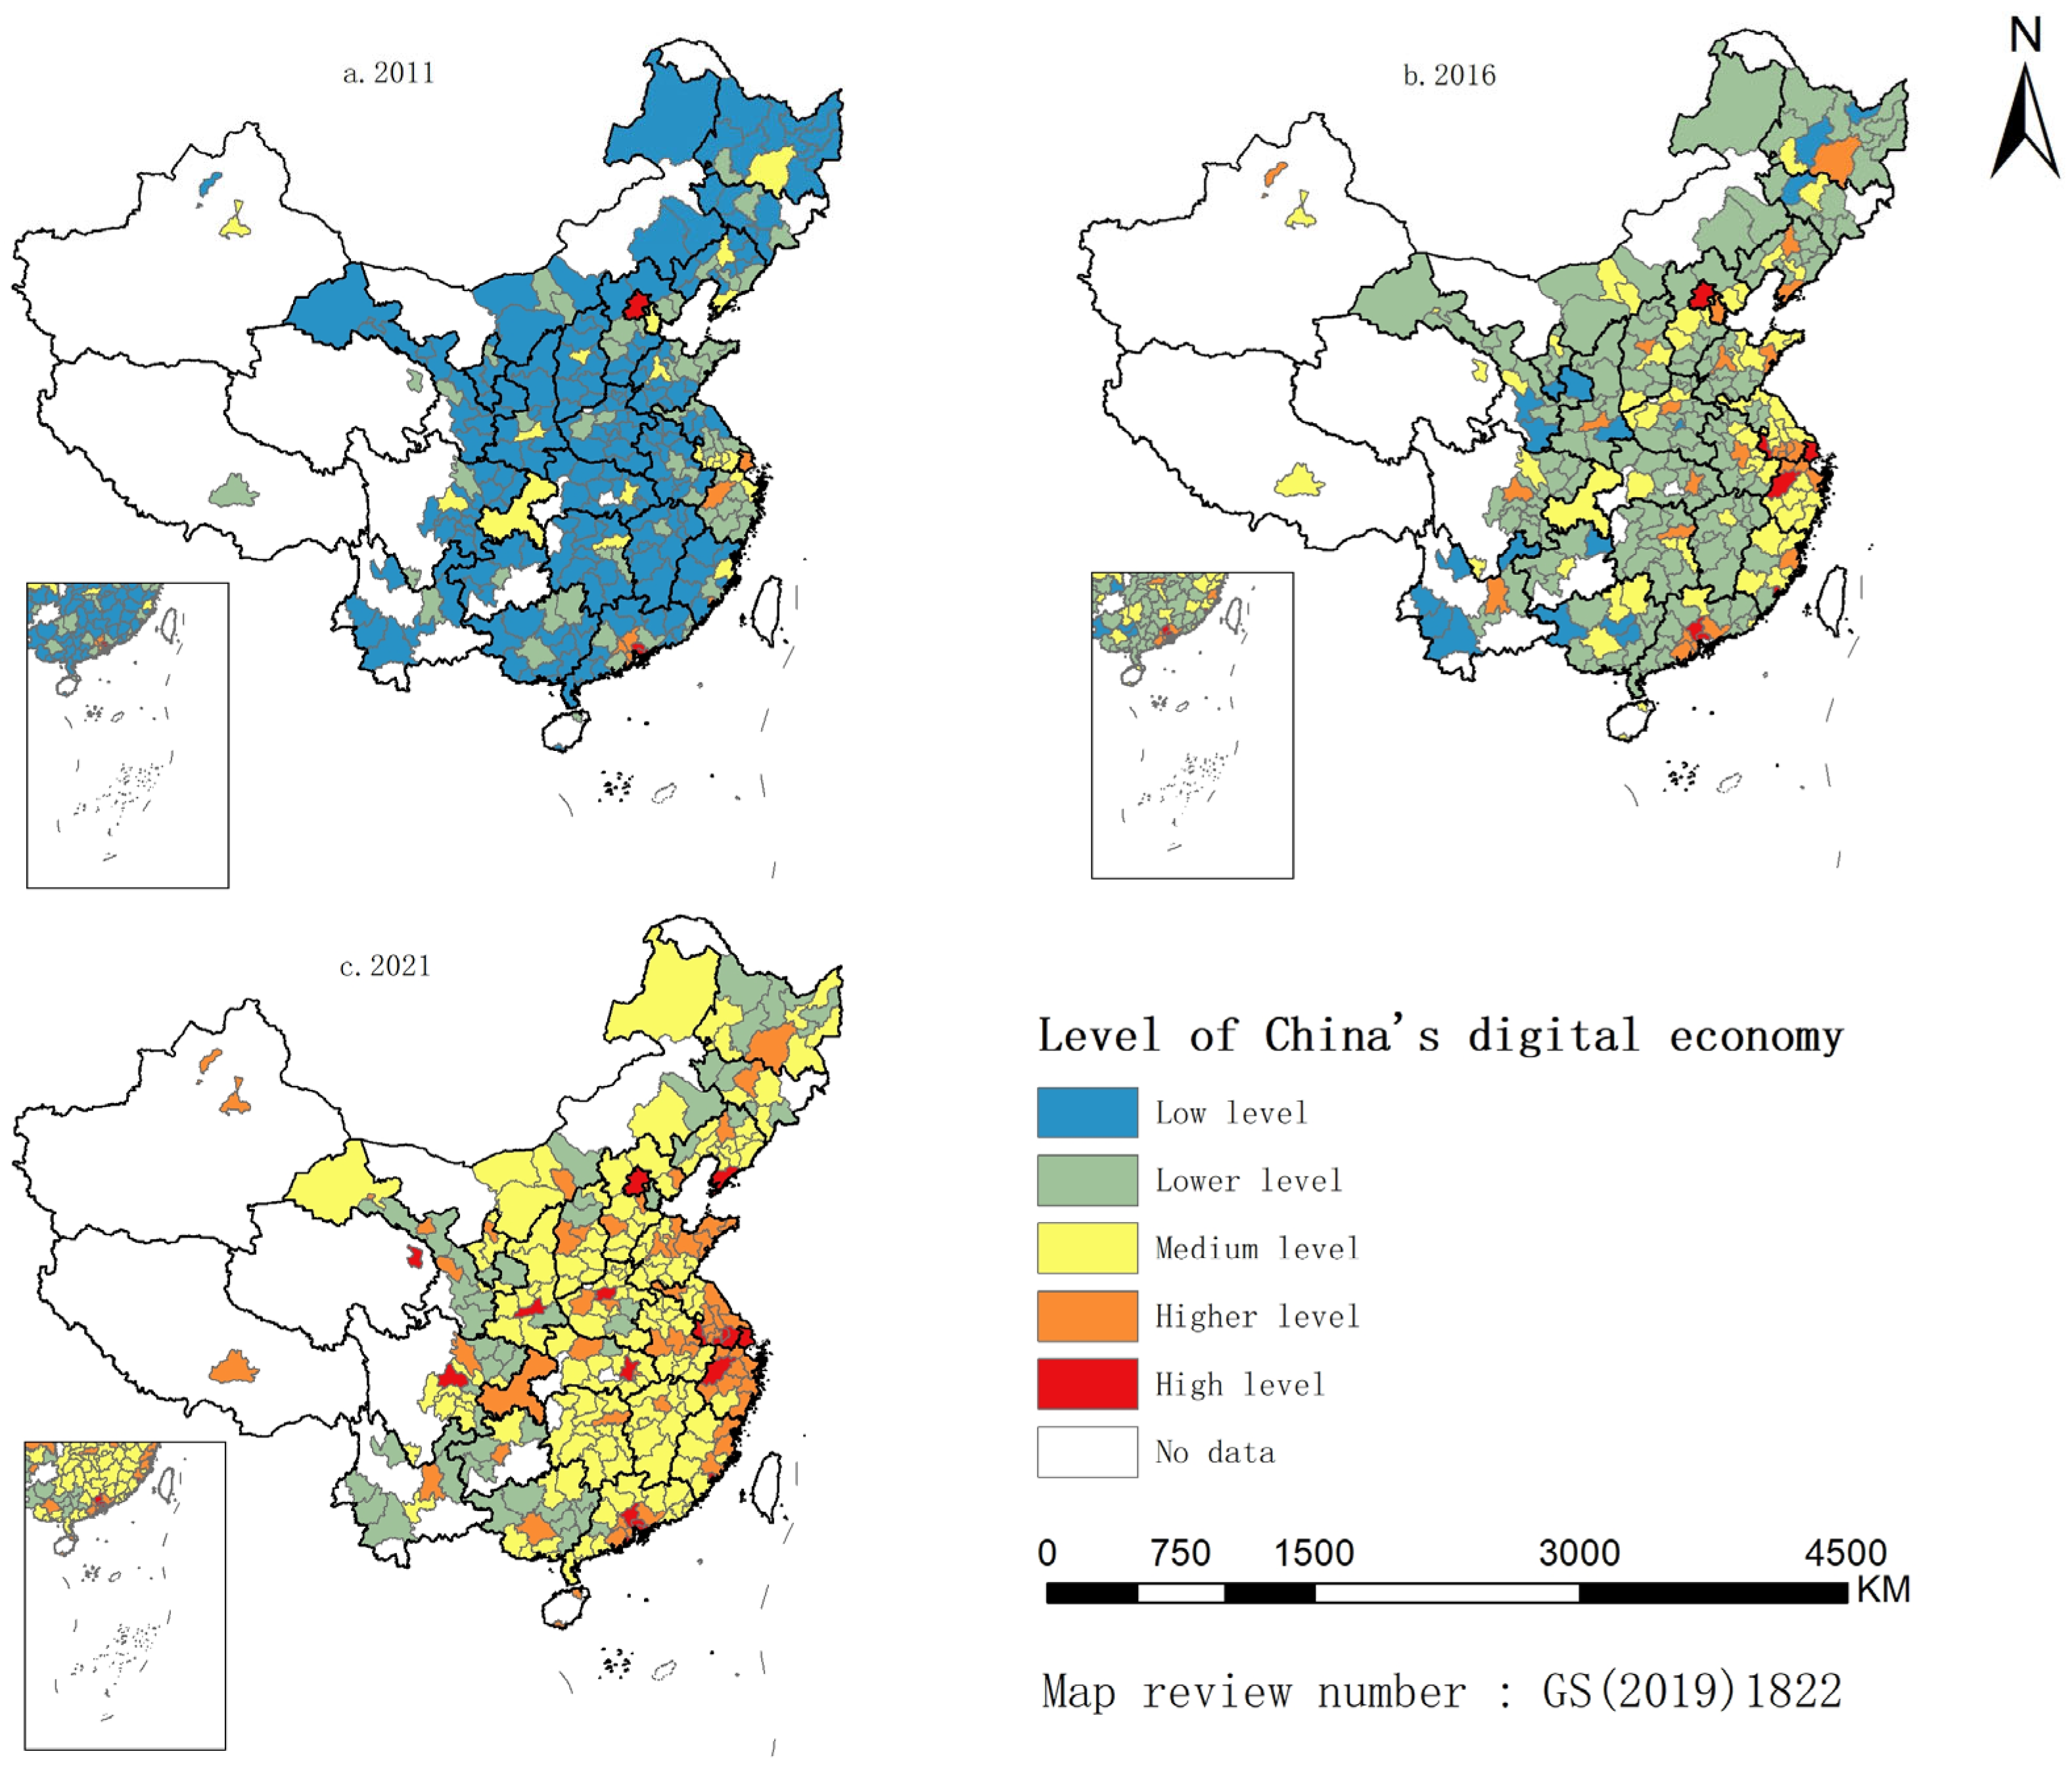
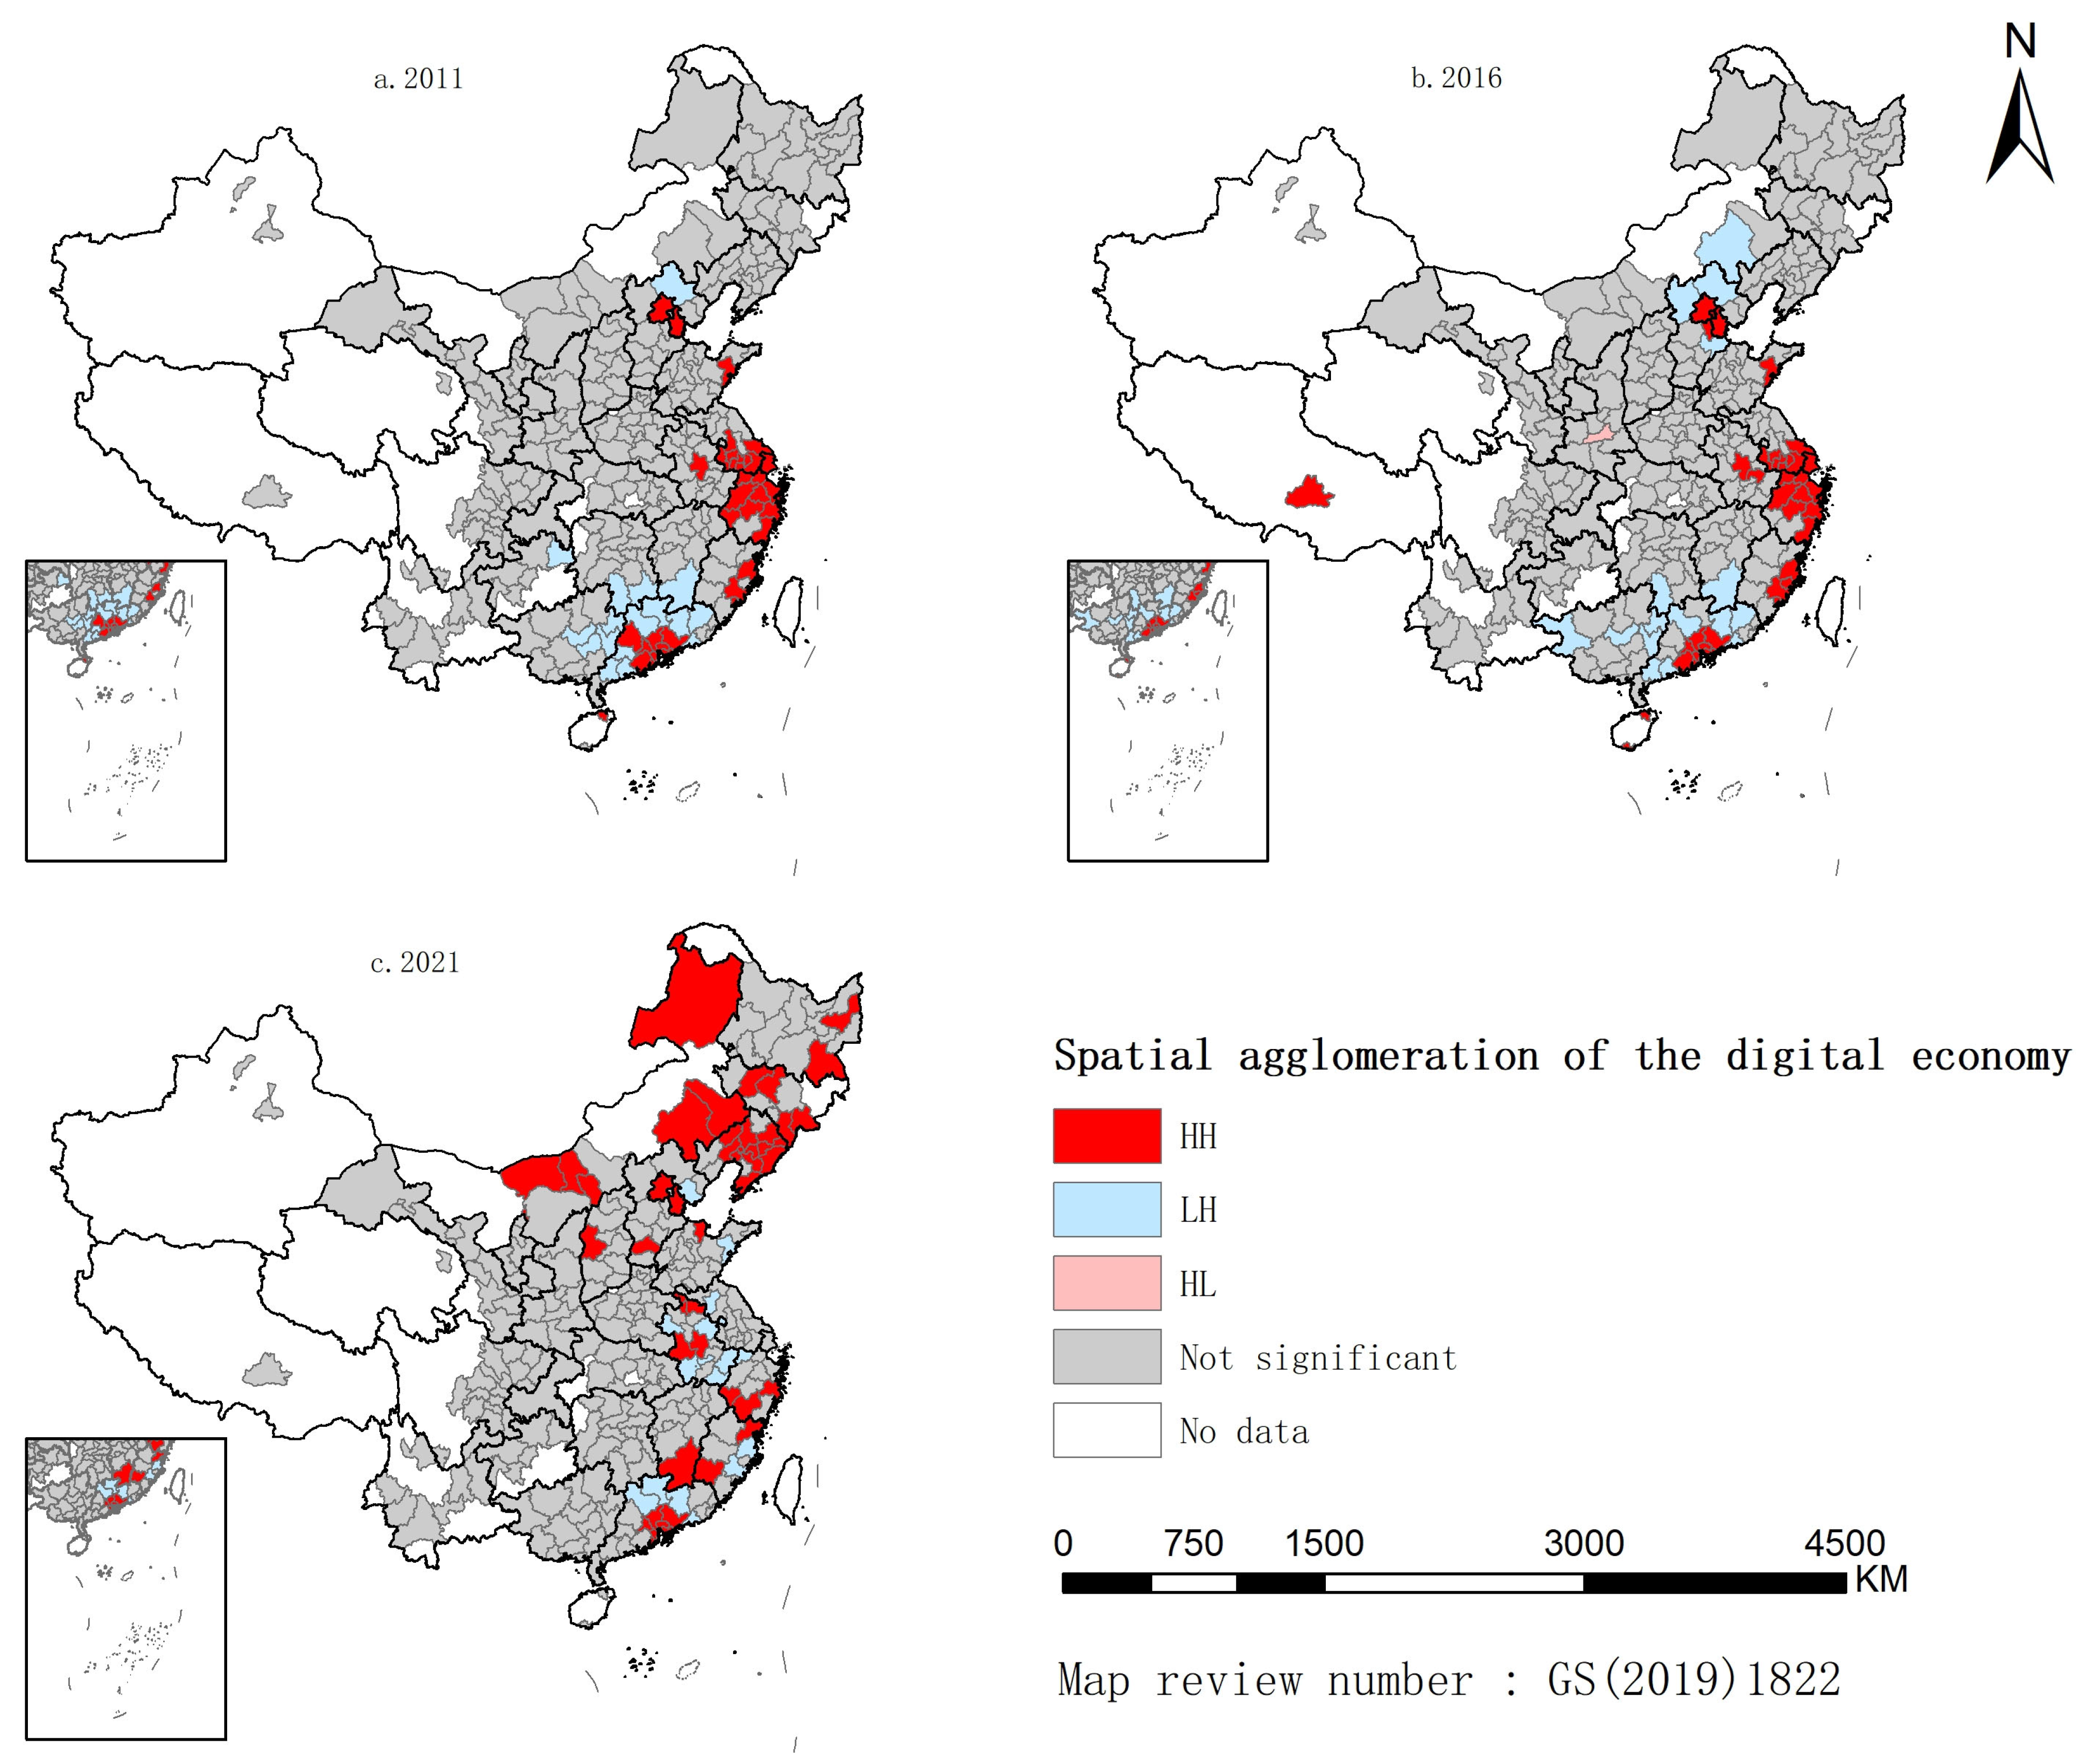
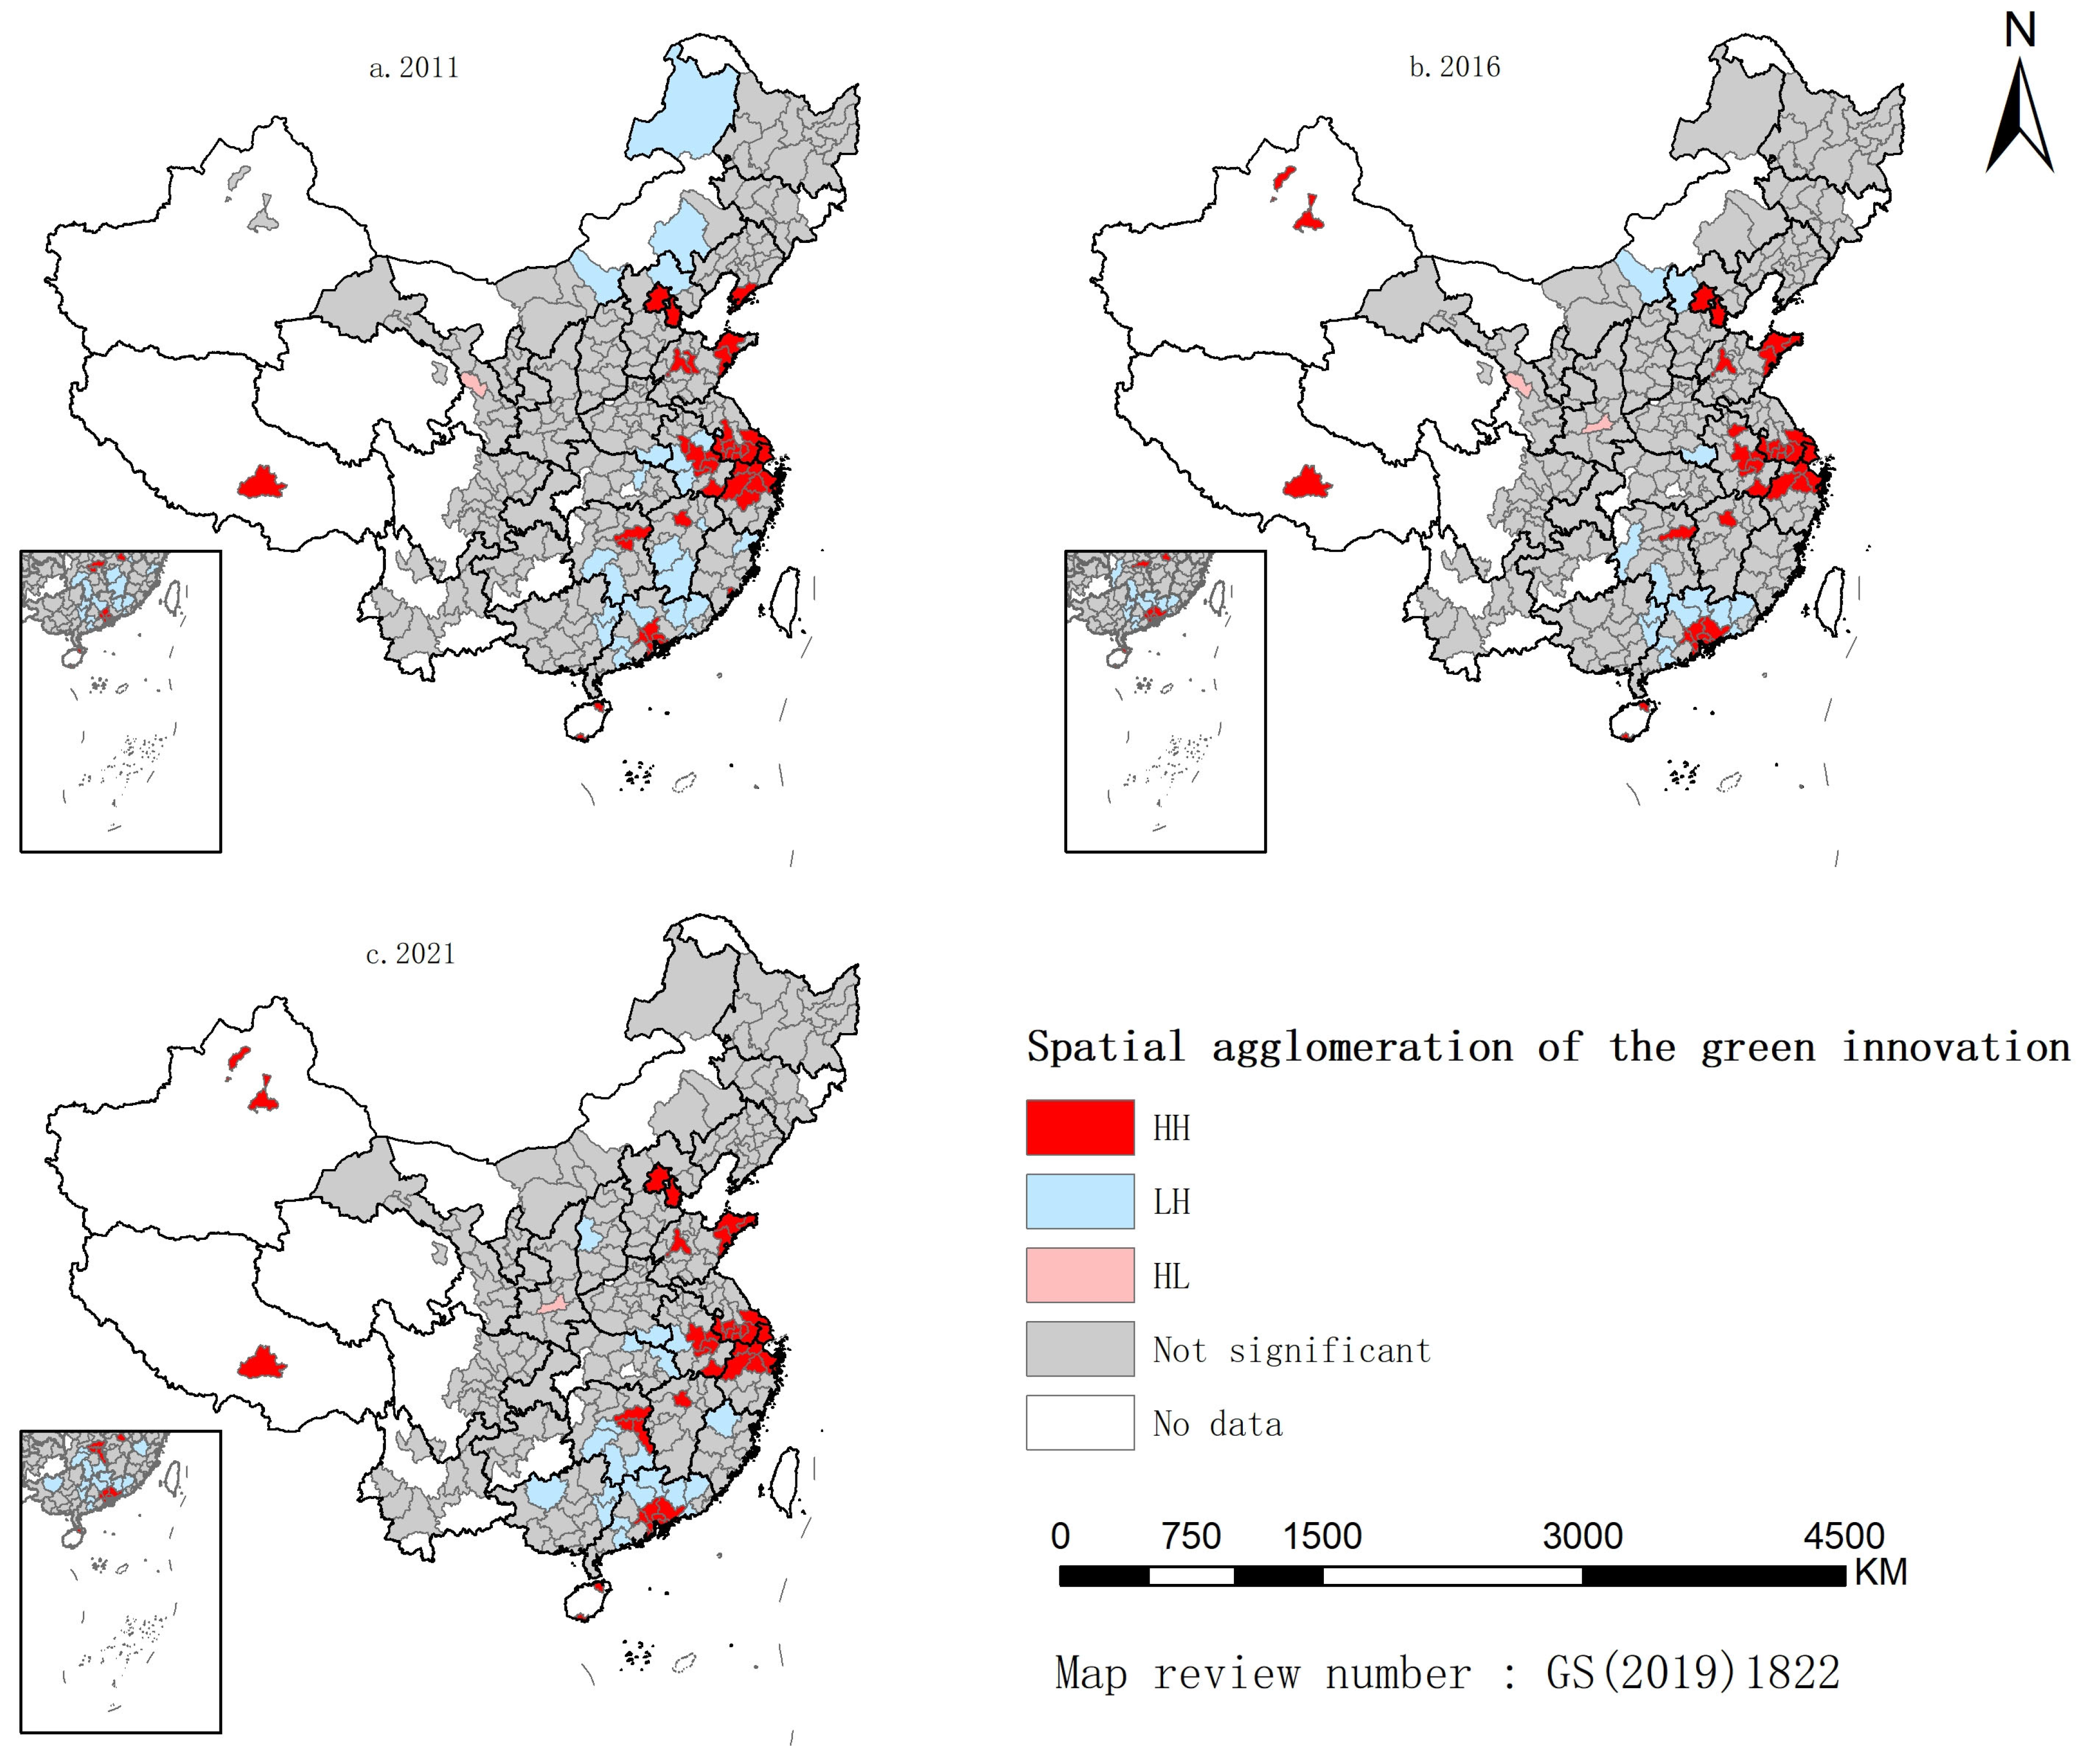
From the perspective of the spatial distribution and agglomeration of the digital economy and green innovation, the cities with a higher digital economy and green innovation levels are mainly concentrated in the eastern coastal region, gradually spreading to the central and western regions. Meanwhile, the developed city clusters, such as the Yangtze River Delta, the Pearl River Delta, and Beijing–Tianjin–Hebei, which have a higher level of economy, industrial synergy, and innovative resources, have improved the depth of the development of the digital economy and green innovation. These three city clusters have consistently occupied the leading position, with outstanding levels of green innovation, in line with the conclusions of existing studies [54]. However, this study also found that the gap between the digital economy and green innovation levels among different cities is narrowing, although overall, it still shows spatial imbalance characteristics. In particular, it can be seen from the LISA map of the digital economy that HH-type cities are no longer concentrated in the southeast coastal area but spread to the north, and the spatial agglomeration pattern has gradually developed from the dominance of the east coast to a more balanced situation, which is closely related to the national strategy of coordinated regional development. The results of the Markov chain show that both China’s digital economy and green innovation show obvious growth inertia and path-dependence characteristics; it is more difficult to achieve cross-level transfer, and a continuous investment in resource elements such as capital, talents, and technology is still required. The level of digital economy and green innovation can be achieved after a period of accumulation. At the same time, the spatial spillover effect of neighboring regions reveals that, in order to improve the digital economy and green innovation, we should not only focus on promoting the development of a single city, but also plan the development of the region as a whole from the perspective of the overall situation, and give full play to the spatial spillover effect, to achieve common progress.
From the results regarding the impact of China’s digital economy on green innovation, it can be seen that the development of the digital economy plays a significant role in promoting green innovation in a given region and its neighboring regions, which is in line with existing work [55]. The digital economy has the advantages of low costs and high mobility, enhances spatial mobility [56], reduces the cost of innovation, enhances the technological innovation of the city [57], and provides a good foundation for the development of green innovation. At the same time, it shortens the spatial distance of information transmission through improved convenience and efficiency [58], enabling the prosperity of one region’s digital economy to influence that of the surrounding areas and driving enhancements in the level of green innovation in neighboring cities. Meanwhile, similar to the findings of existing studies [40], this study found that economic development in the control variables produced negative spatial spillover effects, which may be due to the existence of the “siphon effect”, leading to the concentration of green innovation resources in more developed cities. This negative effect also renders the total effect of economic development on green innovation insignificant. Similarly, interregional competition and uncoordinated financial investment may lead to the loss of development resources in neighboring cities, restricting the level of green innovation. The direct negative effect of foreign investment supports the “pollution paradise” hypothesis [40], but foreign investment will greatly increase the enthusiasm for green innovation in neighboring regions, and its spatial spillover effect will play an important role in overall green innovation.
In addition, the difference in the impact of the digital economy on green innovation between the two phases reflects the impact of the implementation of development policies at different stages [13]. During the 12th Five-Year Plan period, the Government, guided by the concept of green and low-carbon development, has made great efforts to develop a circular economy and promote green and innovative development in many ways. The focus on cultivating and developing the new-generation information technology industry as a strategic emerging industry has promoted the popularization of the Internet and the initial application of information and communications technology, while the construction of digital economic infrastructure has generated technological spillover effects. The “implementation of the overall strategy for regional development” proposed at this stage has led to frequent interregional industrial cooperation and technological exchanges, making it easier for enterprises in neighboring regions to access information and technologies related to green innovation, and promoting innovation in energy-saving and emission-reducing technologies, green product design, and other aspects. During the 13th Five-Year Plan period, the state proposed accelerating the construction of a “Digital China”, accelerating the implementation of the national big data strategy and other major policies, and ensuring the rapid growth of innovation activities [59], providing strong impetus for the development of green innovation. It has been shown that, when government regulation reaches a certain level, it can promote the diffusion of green innovation [60]. In the future, how China can formulate appropriate development strategies, implement effective regulation and supervision, and give full play to the positive effects of the digital economy on green innovation are important issues to be considered. From the perspective of changes in market demand, market demand is positively correlated with the level of green innovation [61]. From the 12th Five-Year Plan period to the 13th Five-Year Plan period, the market demand for green products and services has shown explosive growth [60], and enterprises have increased their technological investment in order to fulfill their social responsibility as well as to enhance the value and competitiveness of their products [62,63], which stimulates improvements in the level of technological innovation. In this process, the digital economy not only provides technical support for green innovation but also plays an important leading role in business models, industrial ecology, and other aspects [64], becoming an important force promoting the development of green innovation.
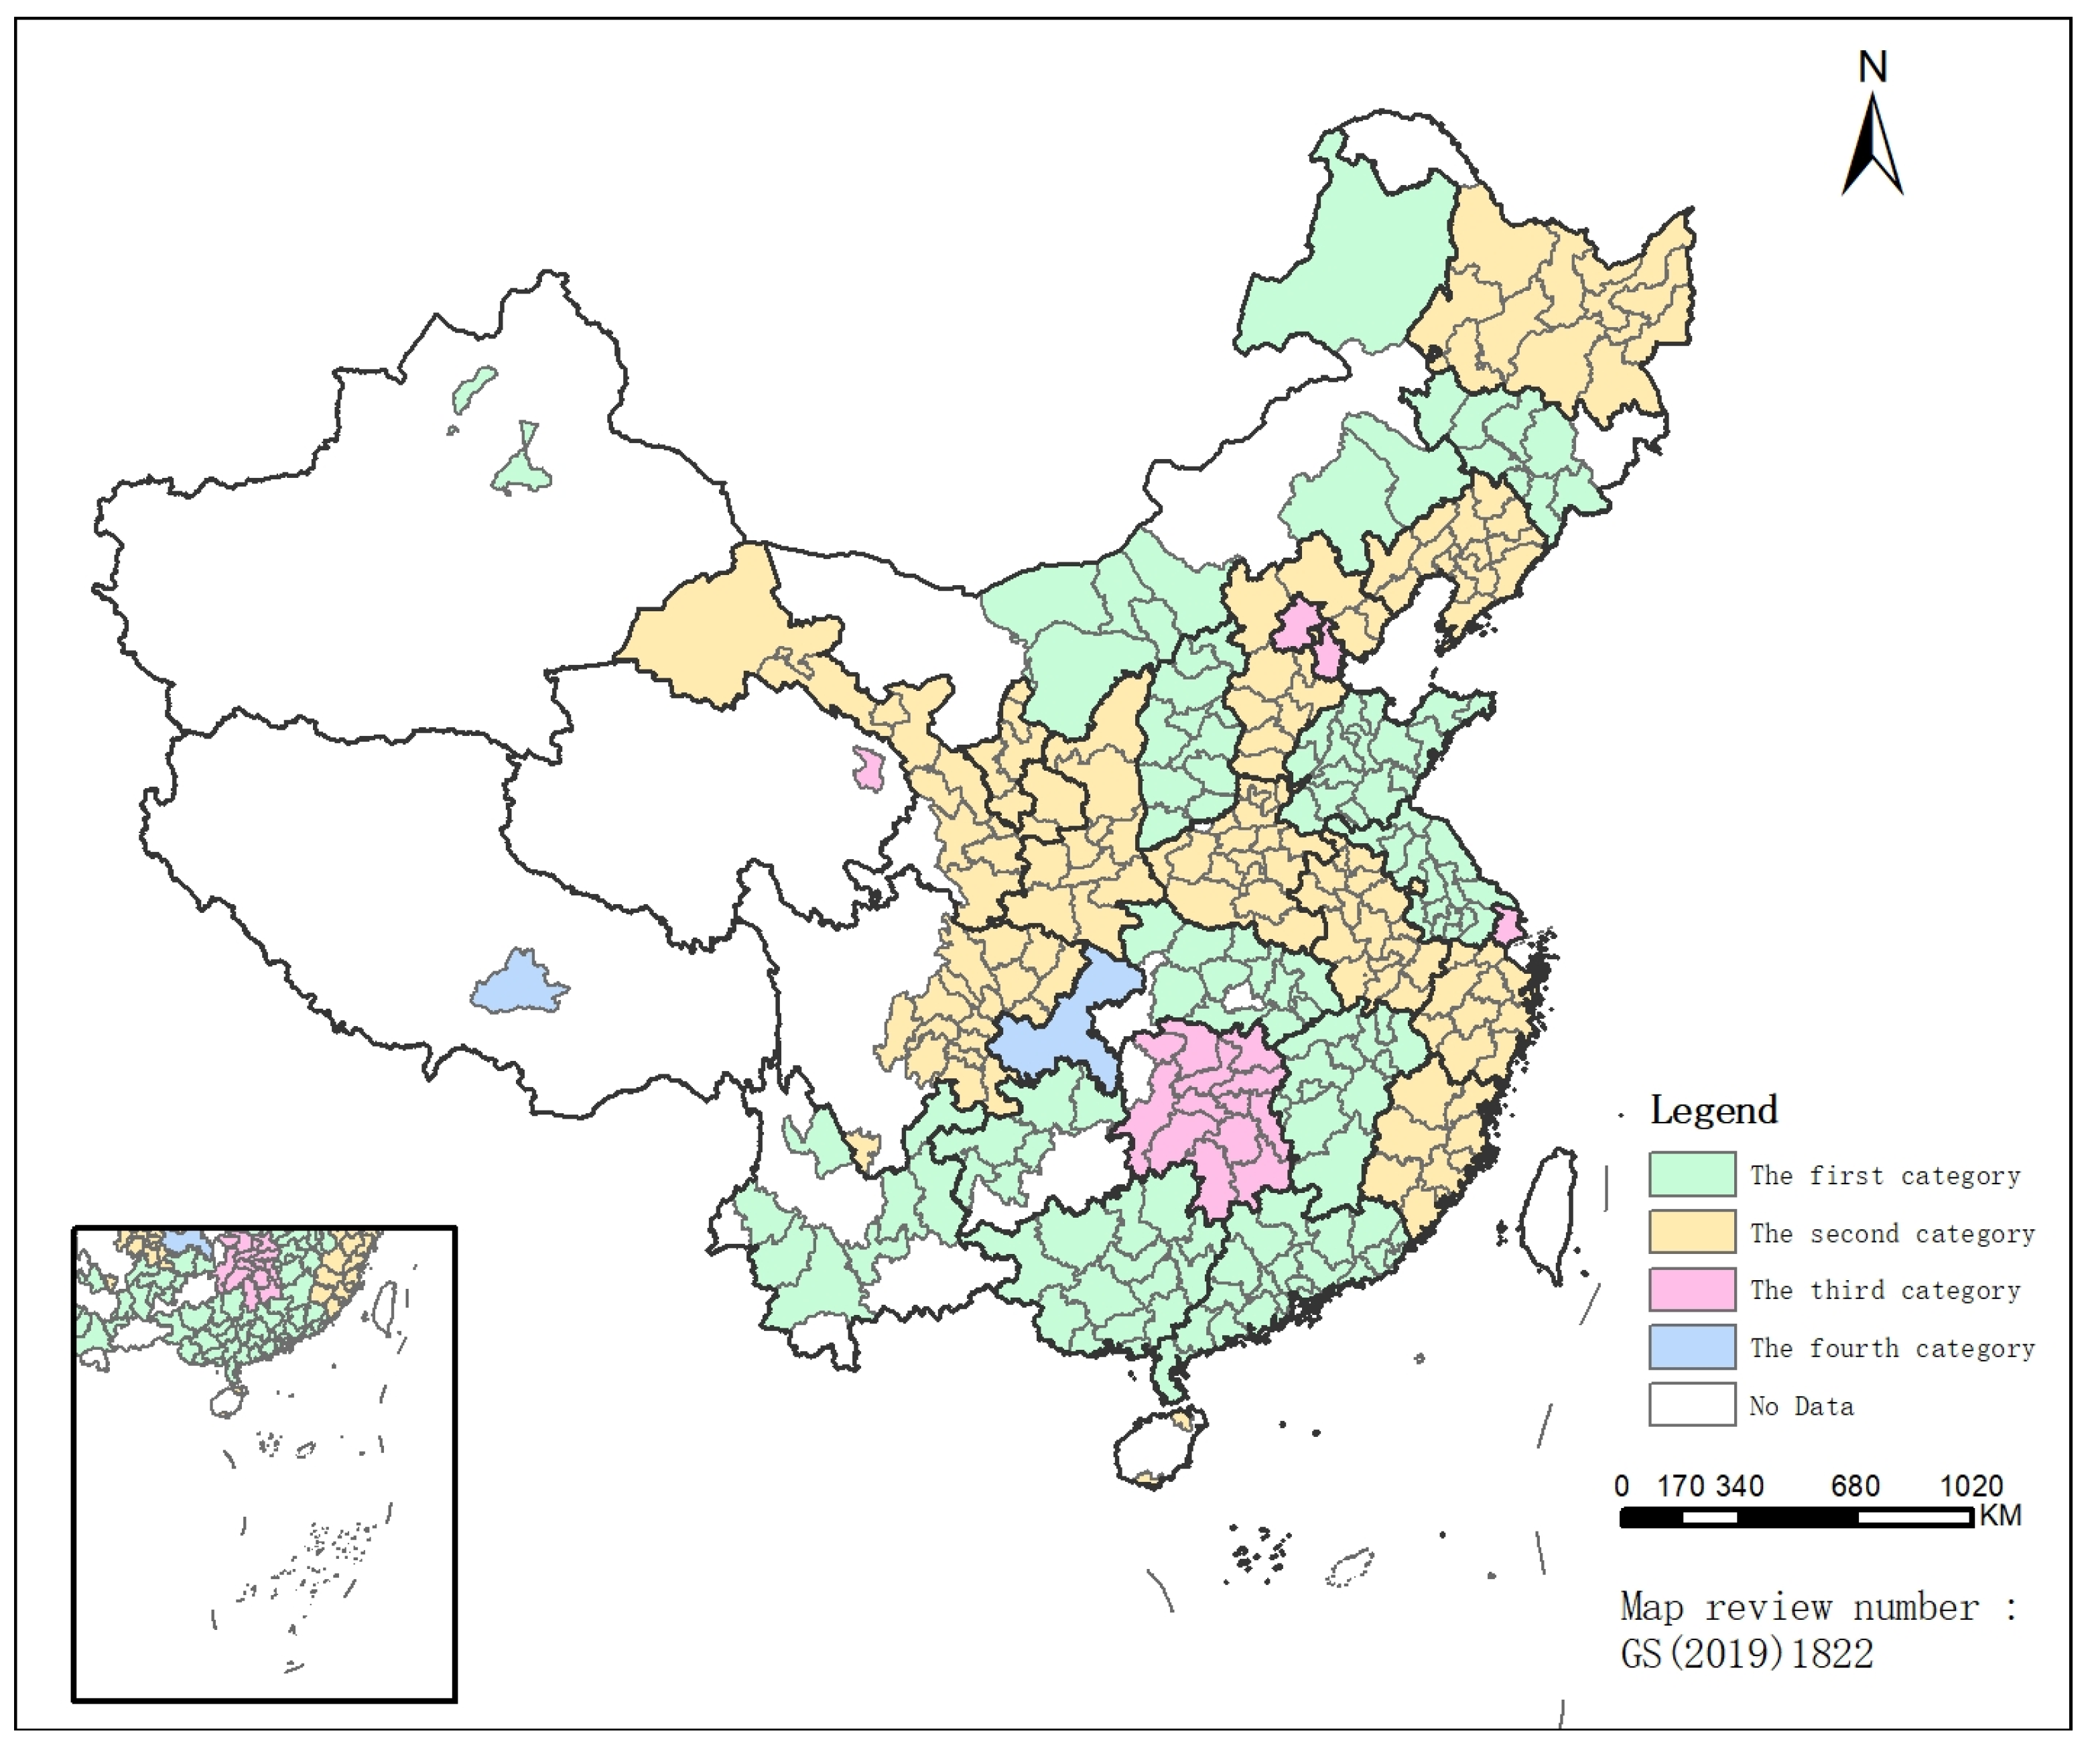
The study of regional heterogeneity classifies Chinese cities into four categories, which is different from the traditional classification based on geographic location and is more in line with the actual situation in China. The majority of Chinese cities currently fall into the first and second categories, where the development of the digital economy has significantly contributed to the level of green innovation. Regarding the third category of cities, the impact of the digital economy on green innovation in Beijing, Tianjin, and Shanghai is not significant. On the one hand, this may be due to the fact that the basic level of green innovation in the municipalities is high, so the marginal contribution of each additional unit of the digital economy to green innovation is relatively small, which leads to insignificant results. On the other hand, this finding may have been due to the limited sample size.
Based on the above conclusions, we propose the following suggestions regarding how to promote the level of China’s digital economy and green innovation and to continuously utilize the “digital dividend” to promote the development of regional green innovation.
(1) Address the shortcomings, exploit the advantages, and continuously improve the digital economy and green innovation. As far as the digital economy is concerned, we should continue to increase our investment in research and development in the context of digital technology innovation, support research into both core and cutting-edge technologies, and promote the sharing and transformation of digital achievements. It is necessary to encourage the digital transformation of enterprises and promote the application and integration of digital technologies in various fields. Regarding green innovation, enterprises should be encouraged to adopt cleaner production technologies and processes to reduce their pollutant emissions. The government should continue to invest in areas such as green technology R&D and green innovation talent training, as well as provide financial support and talent security.
(2) Enhance the promotional effect of the digital economy on green innovation in different regions according to the local conditions and differential development. In the first and second types of cities, the main effects of the digital economy should be exploited to promote industrial digitization and green transformation and create green digital industry clusters. The cities in the third category should increase their investments in the digital economy, build smart factories and green supply chains, encourage the application of digital technology in green industries, and exploit the positive effects of the digital economy. The cities in the fourth category should continue to address their own shortcomings, strengthen their basic research and development, and pursue the penetration and integration of the digital economy into the industry.
(3) Strengthen cooperation, coordinate development, and exploit the driving role of advanced regions. It is necessary to strengthen the collaborative development of industries and regional cooperation and exchange between different cities, form a cross-regional green innovation collaborative development chain, achieve the sharing of resources to complement one another’s advantages, and continuously address the “siphon effect” of economic development. The central financial administration has set up special funds for the digital economy to promote green innovation; it focuses on supporting projects in advanced regions to help other regions, promoting infrastructure sharing and cooperation in green technology research and development among cities, and promoting the implementation and transformation of green invention and patent results.

6. Conclusions

Based on the panel data of 287 cities in China from 2011 to 2021, we quantified the level of the digital economy and green innovation in each city using the entropy value method, and we used spatial autocorrelation and Markov and spatial Markov probability transfer matrices to analyze the change patterns over time, the spatial distribution and agglomeration characteristics, and the spatial evolution of the digital economy and green innovation. We then constructed a spatial Durbin model to empirically analyze the impact of the digital economy on green innovation, and temporal and spatial heterogeneity analyses were carried out. The main conclusions are as follows.
(1) The level of digital economy and green innovation in Chinese cities showed an upward trend during the study period. In terms of sub-dimensions, the rapid development of digital applications and digital innovation is the main driving force for improvements in the digital economy; an increase in green innovation output plays an important role in the development of green innovation.
(2) The digital economy and green innovation in Chinese cities show a spatial pattern of “high in the east and low in the west”, with spatial agglomeration dominated by the HH type and LH type, and the Beijing–Tianjin–Hebei, Yangtze River Delta, and Pearl River Delta city clusters have outstanding levels of development, but the level of development has increased over time.
(3) The change in the digital economy and green innovation types in Chinese cities shows the phenomenon of “club convergence”, and a type transfer basically occurs between neighboring types, which makes it difficult to achieve a jump transfer. The spatial spillover effect affects the probability of type transfer, and neighboring regions with high digital economy levels will have positive spillover effects on this region, while neighboring regions with low green innovation levels will have negative spillover effects on this region.
(4) The digital economy significantly promotes the regional green innovation level, and this effect has spatial spillover effects. Comparing the impacts of different stages, the spatial spillover effect of the digital economy in the 12th Five-Year Plan period was larger, and the direct impact of the digital economy in the 13th Five-Year Plan period was more significant. According to the impact of the digital economy on green innovation, cities can be divided into four types, and most cities in China belong to the first and second types, where the digital economy significantly contributes to the enhancement of the level of green innovation.
This study summarizes the spatial and temporal evolution of the digital economy and green innovation in Chinese cities from a geographical perspective, which facilitates the understanding of the characteristics of different stages of development and expands the relevance of the study. In addition, this study examined the impact of temporal heterogeneity between the 12th and 13th Five-Year Plan phases, and discusses the roles of changes in policy and market demand. Based on the results of this study, the city types were classified, which will be helpful for governments in formulating development strategies according to the actual situations of regional development, and provide reference and policy suggestions for continuous improvements in China’s digital economy and green innovation, as well as for the development of green innovation empowered by the digital economy. However, this study encountered some challenges, which should be addressed in future research. Firstly, due to the limited availability of data, a comprehensive set of individual indicators could not be included in the evaluation index system, and the number of selected control variables was small. Therefore, in the future, it will be necessary to further improve the evaluation index system and consider the impacts of other control factors on green innovation. Secondly, due to the relatively new nature of research into the digital economy, data for some measurement indicators prior to 2011 were lacking, so the research period was relatively short. The relatively long time span required for the effects of digital economy-enabled green innovation to emerge may have impacted this study’s conclusions. Ongoing follow-up research is needed to further clarify the impact of the digital economy on the level of green innovation.

Author Contributions

Conceptualization, C.Z. and X.W.; Data curation, X.W.; Formal analysis, C.Z. and X.W.; Methodology, C.Z. and G.Z.; Resources, C.Z. and X.D.; Software, X.W. and X.D.; Validation, C.Z. and G.Z.; Visualization, X.D.; Writing—original draft preparation, C.Z. and X.W.; Writing—review and editing, C.Z., G.Z. and X.D. All authors have read and agreed to the published version of the manuscript.

Funding

This research was funded by the National Natural Science Foundation of China (No. 42171188).

Data Availability Statement

The data presented in this study are available on request from the corresponding author. The data are designed to be used in other ongoing research and should be protected before official publication.

Acknowledgments

Thanks to all the reviewers and editors.

Conflicts of Interest

The authors declare no conflicts of interest.

References

  1. Wang, C.; Liu, T.; Du, D.; Zhu, Y.; Zheng, Z.; Li, H. Impact of the Digital Economy on the Green Economy: Evidence from China. Sustainability 2024, 16, 9217. [Google Scholar] [CrossRef]
  2. Jin, P.; Mangla, S.K.; Song, M. The power of innovation diffusion: How patent transfer affects urban innovation quality. J. Bus. Res. 2022, 145, 414–425. [Google Scholar] [CrossRef]
  3. Singhal, K.; Feng, Q.; Ganeshan, R.; Sanders, N.R.; Shanthikumar, J.G. Introduction to the Special Issue on Perspectives on Big Data. Prod. Oper. Manag. 2018, 27, 1639–1641. [Google Scholar] [CrossRef]
  4. Xu, Y.; Wang, R.; Zhang, S. Digital Economy, Green Innovation Efficiency, and New Quality Productive Forces: Empirical Evidence from Chinese Provincial Panel Data. Sustainability 2025, 17, 633. [Google Scholar] [CrossRef]
  5. Liang, J.; Qiao, C. The Impact of Digital Trade Development on Regional Green Innovation. Sustainability 2024, 16, 10090. [Google Scholar] [CrossRef]
  6. Yi, G.; Gao, J.; Yuan, W.; Zeng, Y.; Liu, X. Digital Economy, R&D Resource Allocation, and Convergence of Regional Green Economy Efficiency. Sustainability 2025, 17, 384. [Google Scholar] [CrossRef]
  7. Zhang, J.; Lyu, Y.; Li, Y.; Geng, Y. Digital economy: An innovation driving factor for low-carbon development. Environ. Impact Assess. Rev. 2022, 96, 106821. [Google Scholar] [CrossRef]
  8. Xu, L.; Wang, K. Research Review of Digital Economy Connotation and Measurement Index System. Stat. Decis. 2024, 40, 5–11. [Google Scholar]
  9. Beise, M.; Rennings, K. Lead markets and regulation: A framework for analyzing the international diffusion of environmental innovations. Ecol. Econ. 2005, 52, 5–17. [Google Scholar] [CrossRef]
  10. Chen, Y.S.; Lai, S.B.; Wen, C.T. The influence of green innovation performance on corporate advantage in Taiwan. J. Bus. Ethics 2006, 67, 331–339. [Google Scholar] [CrossRef]
  11. Zhu, T.; Li, X.; Wu, H.; Chu, Z. Does the Collaboration of Digitalization Foster Regional Green Development? Sustainability 2023, 15, 14799. [Google Scholar] [CrossRef]
  12. Chen, Y.; Hu, S.; Wu, H. The Digital Economy, Green Technology Innovation, and Agricultural Green Total Factor Productivity. Agriculture 2023, 13, 1961. [Google Scholar] [CrossRef]
  13. Wang, X.; Sun, X.; Zhang, H.; Xue, C. Digital Economy Development and Urban Green Innovation CA-Pability: Based on Panel Data of 274 Prefecture-Level Cities in China. Sustainability 2022, 14, 2921. [Google Scholar] [CrossRef]
  14. Xu, G.; Peng, S.; Li, C.; Chen, X. Synergistic Evolution of China’s Green Economy and Digital Economy Based on LSTM-GM and Grey Absolute Correlation. Sustainability 2023, 15, 14156. [Google Scholar] [CrossRef]
  15. Cao, H.; Shi, B.; Zhao, K. Evaluation on Provincial Green Innovation Capability:Based on Index Screening Model of Collinearity-Coefficient of Variation. Chin. J. Manag. 2016, 13, 1215–1222. [Google Scholar]
  16. Hashimoto, A.; Haneda, S. Measuring the change in R&D efficiency of the Japanese pharmaceutical industry. Res. Policy 2008, 37, 1829–1836. [Google Scholar]
  17. Yin, S.; Zhang, N.; Li, B. Improving the Effectiveness of Multi-Agent Cooperation for Green Manufacturing in China: A Theoretical Framework to Measure the Performance of Green Technology Innovation. Int. J. Environ. Res. Public Health 2020, 17, 3211. [Google Scholar] [CrossRef]
  18. Luo, Q.; Miao, C.; Sun, L.; Meng, X.; Duan, M. Efficiency evaluation of green technology innovation of China’s strategic emerging industries: An empirical analysis based on Malmquist-data envelopment analysis index. J. Clean Prod. 2019, 238, 117782. [Google Scholar] [CrossRef]
  19. Albino, V.; Ardito, L.; Dangelico, R.M.; Messeni Petruzzelli, A. Understanding the development trends of low-carbon energy technologies: A patent analysis. Appl. Energy 2014, 135, 836–854. [Google Scholar] [CrossRef]
  20. Liu, K.; Liu, X.; Wu, Z. Nexus between Corporate Digital Transformation and Green Technological Innovation Performance: The Mediating Role of Optimizing Resource Allocation. Sustainability 2024, 16, 1318. [Google Scholar] [CrossRef]
  21. Jiang, X.; Wang, X.; Ren, J.; Xie, Z. The nexus between digital finance and economic development: Evidence from China. Sustainability 2021, 13, 7289. [Google Scholar] [CrossRef]
  22. Khan, S.; Haneklaus, N. Sustainable economic development across globe: The dynamics between technology, digital trade and economic performance. Technol. Soc. 2023, 72, 102207. [Google Scholar]
  23. Wang, Y.; Liu, J.; Zhao, Z.; Ren, J.; Chen, X. Research on carbon emission reduction effect of China’s regional digital trade under the “double carbon” target—Combination of the regulatory role of industrial agglomeration and carbon emissions trading mechanism. J. Clean Prod. 2023, 405, 137049. [Google Scholar] [CrossRef]
  24. Zhang, X.; Song, X.; Lu, J.; Liu, F. How financial development and digital trade affect ecological sustainability: The role of renewable energy using an advanced panel in G-7 Countries. Renew. Energy 2022, 199, 1005–1015. [Google Scholar] [CrossRef]
  25. Song, Y.; Jiang, Y. How Does the Digital Economy Drive the Optimization and Upgrading of Industrial Structure? The Mediating Effect of Innovation and the Role of Economic Resilience. Sustainability 2024, 16, 1352. [Google Scholar] [CrossRef]
  26. An, J.; He, G.; Ge, S.; Wu, S. The impact of government green subsidies on corporate green innovation. Financ. Res. Lett. 2025, 71. [Google Scholar] [CrossRef]
  27. Zhou, H.; Zheng, M. Foreign direct investment and green innovation in China: An examination of quantile regression. Innov. Green Dev. 2024, 3, 100150. [Google Scholar] [CrossRef]
  28. Chen, M.; Liu, S.; Gao, L. Digital finance, financial flexibility and corporate green innovation. Financ. Res. Lett. 2024, 70, 106313. [Google Scholar] [CrossRef]
  29. Wang, D.; Liang, Y.F.; Dou, W. How does urban industrial structure upgrading affect green productivity? The moderating role of smart city development. Struct. Change Econ. Dyn. 2025, 72, 133–149. [Google Scholar] [CrossRef]
  30. Sun, Q. Three Models of Empowering Enterprises with Green Technology Innovation Efficiency through Digital Economy. Sci. Manag. Res. 2024, 42, 96–105. [Google Scholar]
  31. Hofmann, E.; Sternberg, H.; Chen, H.; Pflaum, A.; Prockl, G. Supply chain management and Industry 4.0: Conducting research in the digital age. Int. J. Phys. Distrib. Logist. Manag. 2019, 49, 945–955. [Google Scholar] [CrossRef]
  32. Wang, B.; Khan, I.; Ge, C.; Naz, H. Digital transformation of enterprises promotes green technology innovation—The regulated mediation model. Technol. Forecast. Soc. Change 2024, 209, 123812. [Google Scholar] [CrossRef]
  33. Zhao, H.; Meng, Y. Coupling coordination measurement and evaluation of urban digital economy and green technology innovation in China. China Soft Sci. 2022, 9, 97–107. [Google Scholar]
  34. Li, G.; Cheng, Y.; Chen, Y.; Zhang, Q. Can the Synergy of Digitalization and Greening Boost Manufacturing Industry Chain Resilience? Evidence from China’s Provincial Panel Data. Sustainability 2024, 16, 9866. [Google Scholar] [CrossRef]
  35. Luo, S.; Yimamu, N.; Li, Y.; Wu, H.; Irfan, M.; Hao, Y. Digitalization and sustainable development: How could digital economy development improve green innovation in China? Bus. Strategy Environ. 2023, 32, 1847–1871. [Google Scholar] [CrossRef]
  36. Zhao, S.; Teng, L.; Arkorful, V.E.; Hu, H. Impacts of digital government on regional eco-innovation: Moderating role of dual environmental regulations. Technol. Forecast. Soc. Change 2023, 196, 122842. [Google Scholar] [CrossRef]
  37. Ghasemaghaei, M.; Calic, G. Assessing the impact of big data on firm innovation performance: Big data is not always better data. J. Bus. Res. 2020, 108, 147–162. [Google Scholar] [CrossRef]
  38. Bai, W.; Hou, J.; Xu, J.; Chen, J. Does Digital Economy Development Successfully Drive the Quality of Green Innovation in China? Pol. J. Environ. Stud. 2023, 32, 2001–2014. [Google Scholar] [CrossRef]
  39. Xu, H.; Wang, J. Digital Economy, Regional Cooperative Innovation and Green Innovation Efficiency: Game Model and Empirical Evidence Based on Regions in China. Sustainability 2024, 16, 5161. [Google Scholar] [CrossRef]
  40. Ye, A.; Zhang, B. Research on the Impact of Digital Economy Development on Urban Green Innovation—Based on Heterogeneity Perspective. J. Ind. Technol. Econ. 2024, 43, 90–98. [Google Scholar]
  41. Fan, D.; Li, M. Digital Economy Development and Green Innovation Efficiency from a Two-Stage Innovation Value Chain Perspective. Sustainability 2024, 16, 4421. [Google Scholar] [CrossRef]
  42. Huang, X.; Zhang, S.P.; Zhang, J.; Yang, K. Research on the impact of digital economy on Regional Green Technology Innovation: Moderating effect of digital talent Aggregation. Environ. Sci. Pollut. Res. 2023, 30, 74409–74425. [Google Scholar] [CrossRef] [PubMed]
  43. Cui, M.; Liu, R. Study on the Coupling Coordination of Digital Economy and Green Innovation:A Case Study of Cities in the Yangtze River Delta Region. East China Econ. Manag. 2024, 38, 25–37. [Google Scholar]
  44. Ge, S.; Zeng, G.; Hu, H.; Cao, X. Evaluation of Green Innovation Ability and Analysis of Spatial Characteristics in the Yangtze River Delta Urban Agglomerations. Resour. Environ. Yangtze Basin 2021, 30, 1–10. [Google Scholar]
  45. Ren, J.; Lai, L.; He, Z.; Chong, Z. Spatio-temporal evolution and influencing factors of green innovation pattern in the Yellow River Basin based on green patents. World Reg. Stud. 2023, 32, 78–92. [Google Scholar]
  46. Lv, D.; Wang, J.; Tang, Q. Has Digital Economy Realized the “Increase of Quantity and Improvement of Quality” of Green Innovation—From the Perspective of Heterogeneous Environmental Concern. J. Shanxi Univ. Financ. Econ. 2023, 45, 55–68. [Google Scholar]
  47. Zhao, T.; Zhang, Z.; Liang, S. Digital Economy, Entrepreneurship, and High-Quality Economic Development: Empirical Evidence from Urban China. J. Manag. World 2020, 36, 65–76. [Google Scholar]
  48. Li, Y. Spatio-temporal evolution characteristics and trend prediction of urban digital technology innovation levels in China. Geogr. Res. 2024, 43, 640–657. [Google Scholar]
  49. Che, L.; Bai, Y.; Zhou, L.; Wang, F.; Ji, X.; Qiao, F. Spatial Pattern and Spillover Effects of Green Developmen Efficiency in China. Sci. Geogr. Sin. 2018, 38, 1788–1798. [Google Scholar]
  50. Ma, H.T.; Wang, K. The effect of urban technological innovation and cooperation on green development: A case study of the three urban agglomerations in the Yangtze River Economic Belt. Geogr. Res. 2022, 41, 3287–3304. [Google Scholar]
  51. Ma, L.; Hong, Y.; Chen, X.; Quan, X. Can Green Innovation and New Urbanization Be Synergistic Development? Empirical Evidence from Yangtze River Delta City Group in China. Sustainability 2022, 14, 5765. [Google Scholar] [CrossRef]
  52. Wang, S.; Gao, S.; Huang, Y.; Shi, C. Spatio-temporal evolution and trend prediction of urban carbon emission performance in China based on super-efficiency SBM model. Acta Geogr. Sin. 2020, 75, 1316–1330. [Google Scholar]
  53. Pace, R.; LeSage, J. A sampling approach to estimate the log determinant used in spatial likelihood problems. J. Geogr. Syst. 2009, 11, 209–225. [Google Scholar] [CrossRef]
  54. Duan, D.; Du, D. Green technology innovation in China city system:Dynamics and determinants. Acta Geogr. Sin. 2022, 77, 3125–3145. [Google Scholar]
  55. Guo, Q.; Ma, X. How Does the Digital Economy Affect Sustainable Urban Development? Empirical Evidence from Chinese Cities. Sustainability 2023, 15, 4098. [Google Scholar] [CrossRef]
  56. Yilmaz, S.; Haynes, K.E.; Dinc, M. Geographic and Network Neighbors: Spillover Effects of Telecommunications Infrastructure. J. Reg. Sci. 2002, 42, 339–360. [Google Scholar] [CrossRef]
  57. Lakhani, K.; Panetta, J. The principles of distributed innovation. In Successful OSS Project Design and Implementation: Requirements, Tools, Social Designs and Reward Structures; Routledge: Abingdon, UK, 2016; pp. 7–26. [Google Scholar]
  58. Zhao, C.; Liu, Z.; Yan, X. Does the Digital Economy Increase Green TFP in Cities? Int. J. Environ. Res. Public Health 2023, 20, 1442. [Google Scholar] [CrossRef]
  59. Zuo, W.; Gu, H.; Zhou, L.; Shen, T. Evolution and Driving Mechanism of the Spatial Pattern of Digital Economy Innovation in China. Econ. Geogr. 2024, 44, 102–112. [Google Scholar]
  60. Wang, M.; Lian, S.; Yin, S.; Dong, H. A Three-Player Game Model for Promoting the Diffusion of Green Technology in Manufacturing Enterprises from the Perspective of Supply and Demand. Mathematics 2020, 8, 1585. [Google Scholar] [CrossRef]
  61. Lin, R.; Tan, K.; Geng, Y. Market demand, green product innovation, and firm performance: Evidence from Vietnam motorcycle industry. J. Clean Prod. 2013, 40, 101–107. [Google Scholar] [CrossRef]
  62. Hao, J.; He, F. Corporate social responsibility (CSR) performance and green innovation: Evidence from China. Financ. Res. Lett. 2022, 48, 102889. [Google Scholar] [CrossRef]
  63. Shahzad, M.; Qu, Y.; Javed, S.A.; Zafar, A.U.; Rehman, S.U. Relation of environment sustainability to CSR and green innovation: A case of Pakistani manufacturing industry. J. Clean Prod. 2020, 253, 119938. [Google Scholar] [CrossRef]
  64. Burinskienė, A.; Grybaitė, V.; Lingaitienė, O. Sharing Economy Development: Empirical Analysis of Technological Factors. Sustainability 2024, 16, 1702. [Google Scholar] [CrossRef]
Figure 1. Time-varying characteristics of China’s digital economy and green innovation, 2011–2021.
Land 14 00633 g001
Figure 2. Spatial distribution of China’s digital economy, 2011–2021.
Land 14 00633 g002
Figure 3. Spatial distribution of China’s green innovation, 2011–2021.
Land 14 00633 g003
Figure 4. LISA chart of China’s digital economy, 2011–2021.
Land 14 00633 g004
Figure 5. LISA chart of China’s green innovation, 2011–2021.
Land 14 00633 g005
Figure 6. Spatial distribution of the four categories of cities.
Land 14 00633 g006
Table 1. China’s digital economy and green innovation evaluation indicator system.
Target LayerCriterion LayerIndicator LayerFormulaUnitWeight
Green innovation (GI)Green innovation
foundation
Green space per capita (positive)Green area/registered resident populationHectare per 10,000 people0.3386
Non-hazardous domestic waste disposal rate (positive)————0.0081
Green innovation inputsPercentage of local government expenditure on science and technology (positive)Science and technology expenditure/public finance expenditure%0.2040
Percentage of university students in general higher education (positive)Students in general higher education/registered residence population%0.2827
Green innovation outputsLogarithmic value of the number of patents granted for green inventions plus one (positive)ln (number of patents granted for green inventions +1)——0.1194
Logarithmic value of the number of patent applications for green inventions plus one (positive)ln (number of patent applications for green inventions +1)——0.0471
Digital economy (DE)Digital foundationCell phone subscribers per 100 population (positive)(Number of mobile phone users at the end of the year/registered resident population) × 100Households per 100 people0.1286
Digital industryPercentage of employees in computer services and software (positive)Number of employees in information transmission, computer services, and software industries/number of employees%0.1630
Telecommunications revenue per capita (positive)Telecommunications revenue/registered resident populationCNY per person0.3234
Digital applicationsChina’s digital inclusive finance index (positive)————0.0728
Internet broadband users per 100 population (positive)(Number of Internet broadband access users/registered resident population) × 100Households per 100 people0.1627
Digital innovationLogarithmic value of the number of invention patents authorized in the digital economy plus one (positive) ln (Number of patents granted for inventions in the digital economy industry +1)——0.1494
Control variablesEconomic development (EL)GDP per capitaGDP/registered resident populationCNY per person——
Level of local financial
input (FI)
Ratio of public revenue to the GDPPublic fiscal revenue/GDP%——
Foreign investment (FD)Ratio of the amount of foreign investment actually used in the year to the GDPActual amount of foreign investment used in the year/GDP%——
Table 2. Markov transfer probability matrix of China’s digital economy types, 2011–2021.
t/t + 112345n
10.6500 0.3500 0.0000 0.0000 0.0000 620
20.0158 0.7930 0.1904 0.0008 0.0000 1203
30.0000 0.0336 0.8450 0.1213 0.0000 684
40.0000 0.0035 0.0461 0.8794 0.0709 282
50.0000 0.0000 0.0000 0.0617 0.9383 81
Table 3. Markov transfer probability matrix of China’s green innovation types, 2011–2021.
t/t + 112345n
10.9737 0.0263 0.0000 0.0000 0.0000 2168
20.0213 0.9296 0.0490 0.0000 0.0000 469
30.0000 0.0289 0.9133 0.0520 0.0058 173
40.0000 0.0000 0.0185 0.9259 0.0556 54
50.0000 0.0000 0.0000 0.5000 0.5000 6
Table 4. Spatial Markov transfer probability matrix of China’s digital economy types, 2011–2021.
Neighborhood Typet/t + 112345n
110.8421 0.1579 0.0000 0.0000 0.0000 76
20.0000 0.8125 0.1875 0.0000 0.0000 16
30.0000 0.1250 0.7500 0.1250 0.0000 8
40.0000 0.0000 0.0000 0.0000 0.0000 0
50.0000 0.0000 0.0000 0.0000 0.0000 0
210.6529 0.3471 0.0000 0.0000 0.0000 484
20.0400 0.8550 0.1050 0.0000 0.0000 400
30.0000 0.0482 0.7590 0.1928 0.0000 83
40.0000 0.0000 0.0323 0.9677 0.0000 31
50.0000 0.0000 0.0000 0.0000 1.0000 3
310.3860 0.6140 0.0000 0.0000 0.0000 57
20.0041 0.7673 0.2272 0.0014 0.0000 735
30.0000 0.0342 0.8753 0.0905 0.0000 409
40.0000 0.0000 0.0526 0.8496 0.0977 133
50.0000 0.0000 0.0000 0.1304 0.8696 23
410.3333 0.6667 0.0000 0.0000 0.0000 3
20.0000 0.6731 0.3269 0.0000 0.0000 52
30.0000 0.0226 0.8249 0.1525 0.0000 177
40.0000 0.0094 0.0472 0.8962 0.0472 106
50.0000 0.0000 0.0000 0.0370 0.9630 27
510.0000 0.0000 0.0000 0.0000 0.0000 0
20.0000 0.0000 0.0000 0.0000 0.0000 0
30.0000 0.0000 0.7143 0.2857 0.0000 7
40.0000 0.0000 0.0000 0.8333 0.1667 12
50.0000 0.0000 0.0000 0.0357 0.9643 28
Table 5. Spatial Markov transfer probability matrix of China’s green innovation types, 2011–2021.
Neighborhood Typet/t + 112345n
110.9870 0.0130 0.0000 0.0000 0.0000 1311
20.0247 0.9136 0.0617 0.0000 0.0000 162
30.0000 0.0000 0.9663 0.0337 0.0000 89
40.0000 0.0000 0.0000 1.0000 0.0000 10
50.0000 0.0000 0.0000 0.0000 0.0000 0
210.9555 0.0445 0.0000 0.0000 0.0000 853
20.0221 0.9375 0.0404 0.0000 0.0000 272
30.0000 0.0526 0.8684 0.0789 0.0000 76
40.0000 0.0000 0.0417 0.9583 0.0000 24
50.0000 0.0000 0.0000 0.0000 0.0000 0
310.5000 0.5000 0.0000 0.0000 0.0000 4
20.0000 0.9688 0.0313 0.0000 0.0000 32
30.0000 0.0000 0.8333 0.0000 0.1667 6
40.0000 0.0000 0.0000 0.8125 0.1875 16
50.0000 0.0000 0.0000 0.4000 0.6000 5
410.0000 0.0000 0.0000 0.0000 0.0000 0
20.0000 0.6667 0.3333 0.0000 0.0000 3
30.0000 0.5000 0.5000 0.0000 0.0000 2
40.0000 0.0000 0.0000 1.0000 0.0000 4
50.0000 0.0000 0.0000 1.0000 0.0000 1
510.0000 0.0000 0.0000 0.0000 0.0000 0
20.0000 0.0000 0.0000 0.0000 0.0000 0
30.0000 0.0000 0.0000 0.0000 0.0000 0
40.0000 0.0000 0.0000 0.0000 0.0000 0
50.0000 0.0000 0.0000 0.0000 0.0000 0
Table 6. Global Moran’s I statistical indicators of China’s digital economy and green innovation, 2011–2021.
YearDigital EconomyGreen Innovation
Moran’s Ip-ValueMoran’s Ip-Value
20110.35290.00000.16940.0000
20120.36100.00000.17410.0000
20130.33520.00000.16670.0000
20140.34840.00000.16020.0000
20150.34360.00000.19560.0000
20160.32230.00000.22130.0000
20170.31240.00000.22330.0000
20180.30270.00000.22300.0000
20190.26220.00000.19950.0000
20200.25520.00000.18790.0000
20210.25810.00000.17230.0000
Table 7. Effect estimation results of the spatial Durbin model.
VariantMainWxSpatialVariance
DE0.1868 *** 10.0700 **
(10.938)(2.442)
EL0.0028 ***−0.0025 ***
(8.827)(−5.554)
FI0.0061−0.0609 ***
(1.121)(−2.746)
FD−0.18111.7951 ***
(−0.968)(3.120)
rho 0.4907 ***
(14.758)
sigma2_e 0.0003 ***
(39.591)
Observations3157315731573157
R-squared0.5720.5720.5720.572
1 *** p < 0.01, ** p < 0.05
Table 8. Effect decomposition results of the spatial Durbin model.
VariantDirect EffectIndirect EffectTotal Effect
DE0.1926 *** 10.3121 ***0.5046 ***
(11.124)(9.174)(15.626)
EL0.0028 ***−0.0021 ***0.0007
(9.039)(−2.791)(0.890)
FI0.0048−0.1128 ***−0.1079 ***
(0.939)(−2.762)(−2.639)
FD−0.13003.2841 ***3.1541 ***
(−0.729)(3.048)(2.938)
1 *** p < 0.01
Table 9. Results of temporal heterogeneity analysis.
Variant2011–20152016–2021
MainWxMainWx
DE0.1060 *** 10.2591 ***0.1120 ***0.1066 ***
(3.997)(5.646)(5.673)(2.618)
EL0.0011 ***−0.0011 ***0.0019 ***−0.0006
(3.455)(−2.985)(3.465)(−0.610)
FI0.0224 ***0.0899 *0.0156−0.0528
(3.423)(1.646)(1.132)(−1.635)
FD0.6262 **0.6921−0.2053−0.5888
(2.072)(0.901)(−1.002)(−0.704)
rho0.1579 *** (2.915)0.4477 *** (9.042)
sigma2_e0.0001 *** (26.778)0.0002 *** (29.245)
Observations1435143514351435
R-squared0.3990.3990.3990.399
1 *** p < 0.01, ** p < 0.05, * p < 0.1.
Table 10. Analysis of regional heterogeneity results.
CategoryFirst CategorySecond CategoryThird CategoryFourth Category
ExampleJiangxiShaanxiBeijingChongqing
DE1.5063 *** 10.5803 ***0.1299−0.0121
(0.1447)(0.0623)(0.1148)(0.1938)
Control variableYesYesYesYes
Constant0.1400 ***0.0990 ***0.3187 ***0.2068 ***
(0.0369)(0.0126)(0.0450)(0.0522)
Observations1211101111
R-squared0.79880.93380.50790.9804
1 *** p < 0.01
Disclaimer/Publisher’s Note: The statements, opinions and data contained in all publications are solely those of the individual author(s) and contributor(s) and not of MDPI and/or the editor(s). MDPI and/or the editor(s) disclaim responsibility for any injury to people or property resulting from any ideas, methods, instructions or products referred to in the content.

