Article

Evaluating Territorial Space Use Efficiency: A Geographic Data Envelopment Model Considering Geospatial Effects

1
School of Public Administration and Policy, Renmin University of China, Beijing 100872, China
2
Digital Government and National Governance Lab, Renmin University of China, Beijing 100872, China
3
China Aero Geophysical Survey and Remote Sensing Center for Natural Resources, China Geological Survey, Beijing 100083, China
4
School of Information Engineering, China University of Geosciences (Beijing), Beijing 100083, China
5
Technology Innovation Center for Territory Spatial Big-Data, Ministry of Natural Resources of the People’s Republic of China, Beijing 100036, China
6
Observation and Research Station of Beijing Fangshan Comprehensive Exploration, Ministry of Natural Resources, Beijing 100083, China
*
Authors to whom correspondence should be addressed.
Land 2025, 14(3), 635; https://doi.org/10.3390/land14030635
Submission received: 21 February 2025 / Revised: 8 March 2025 / Accepted: 15 March 2025 / Published: 17 March 2025
(This article belongs to the Section Land Use, Impact Assessment and Sustainability)

Abstract

:
Accurately evaluating territorial space use efficiency is a prerequisite for promoting the realization of high-quality development. Existing efficiency evaluation models all treat decision making units (DMUs) as independent individuals, ignoring geospatial effects between geographical spaces, which leads to unreliable results. This study proposes a geographic data envelopment analysis (GeoDEA) model, integrating a spatially constrained multivariate clustering model with generalized data envelopment analysis (DEA). The GeoDEA model reconstructs evaluation and reference sets considering spatial adjacency, cluster numbers, and socio-economic indicators and then applies a slack-based measure (SBM) super-efficient formula. It is verified that the efficiency value evaluated using the GeoDEA model is higher than that of the traditional DEA model, but it is also more consistent with cognition and more reliable. This is mainly explained by the fact that the GeoDEA model takes into account the geospatial effect and selects DMUs with relatively close geographic distance and higher levels of development as the reference frontier for efficiency evaluation. The GeoDEA model optimizes the traditional DEA model and avoids the problem that the efficiency of DMU is underestimated when the geographical background and development mode of DMU are very different from the reference frontier. It enhances the reliability of the evaluation of territorial space use efficiency.

1. Introduction

Territorial space use refers to the process of protecting, developing, transforming, and using the basic elements of territorial space by human beings with the help of tools, science and technology, bioengineering, and other means [1,2]. The aim is to obtain the resources and materials needed for human survival and production. At present, there are a number of thorny problems and challenges in the territorial space use of all countries, such as small plot ratios of construction land, a large amount of unused land, the fragmentation of rural space, etc. [3,4]. The existence of these problems seriously affects the sustainable development of territorial space [5]. Therefore, the improvement of territorial space use efficiency has become a hot issue for management departments and researchers in various countries.
Territorial space use efficiency is a measure of the relationship between various resource inputs and the resulting benefits within the scope of territorial space. This definition is the product of a deep and comprehensive understanding of the space in which humankind lives. Researchers have tried to explore and research territorial space use efficiency from different directions, such as evaluation models, evaluation scales, and analysis perspectives, in order to help efficiency improvement [4,6,7,8,9,10]. Realizing accurate evaluation of territorial space use efficiency is the prerequisite and foundation for relevant research and efficiency improvement. Based on a meta-analysis of the research literature, data envelopment analysis (DEA) series models are the most frequently used in the evaluation of territorial space use efficiency [9]. The DEA series of models originated in operations and management science [11]. It is mainly used to evaluate the relative efficiency of decision making units (DMUs) under multiple input and multiple output conditions [12].
With socio-economic development and the integration of disciplines, the definition and implementation process of “territorial space use” began to gradually emphasize spatial attributes [1,2]. From the perspective of geographic principles, this spatial attribute can be explained by geospatial effects [13,14,15,16]. Therefore, when evaluating territory space use efficiency, we have to pay attention to the impacts caused by geospatial effects in addition to considering the social, economic, and ecological meanings included in the use process [9]. However, as far as we know, there are very few evaluation models that consider the impact of geospatial effects on the evaluation of territorial space use efficiency. This leads to a lack of scientific validity of efficiency evaluation results, which is also not conducive to efficiency improvement.
The goal of the present study is to construct an efficiency evaluation model based on full consideration of geospatial effects. On the one hand, the aim is to accurately evaluate territorial space use efficiency. On the other hand, it is also to provide a reliable model for accurate efficiency evaluation of special DMUs characterized by geospatial effects.
The rest of the paper is structured as follows. First, the next section provides a review of the existing literature on the evolution of efficiency evaluation models, the principles of the DEA model, and its limitations. Next, the third section describes the process of constructing a geographic data envelopment analysis (GeoDEA) model. In the fourth section, we implement the validation of the GeoDEA model. In the sections that follow, we then discuss the rationality of the GeoDEA model and future trends in efficiency evaluation models. Finally, in the concluding section, we summarize the major conclusions and discuss the innovativeness of the models constructed in this study.

2. Literature Review

2.1. Evolution of the Efficiency Evaluation Models

We attempt to categorize evaluation models into three main groups based on the differentiation of indicator systems: models based on a single indicator, comprehensive models based on multiple indicators, and models based on input–output indicators.
The evaluation model relying solely on a single indicator serves as the most fundamental, straightforward, and generalized model for assessing efficiency [17,18]. The “land consumption rate population growth rate” proposed in SDG 11.3.1 is a widely recognized single indicator assessment method [19]. The indicator is calculated as follows: the land consumption rate is obtained by calculating the natural logarithm of the ratio of the built-up area of the city in the current year to that in the base year (with the constant e as the base) and dividing it by the time interval (in years) [20]. Similarly, the population growth rate is obtained by calculating the natural logarithm of the ratio of the urban population in the current year to that in the base year, divided by the same time interval [21]. The final indicator value is the ratio of the land consumption rate to the population growth rate [20,21].
The comprehensive evaluation models based on multiple indicators are mainly based on mathematical theory, which has the advantages of being integrative, widely applicable, and comparable [9,22]. Some commonly used comprehensive evaluation models include entropy weighting, the analytic hierarchy process (AHP), principal component analysis, fuzzy data synthesis, cluster analysis, discriminant analysis, the technique for order preference by similarity to an ideal solution (TOPSIS), and the material element model [9,23,24,25,26,27].
The evaluation model based on input–output indicators is mainly constructed and designed based on the foundation of economics, operations research, and mathematical theories. It is mainly divided into two categories: parametric and nonparametric models [28,29,30]. The main parametric evaluation models are the Cobb–Douglas production function (C-D) and the stochastic frontier analysis (SFA) model. This kind of model takes into account the effect of stochastic factors on efficiency measures. However, the production function also needs to be designed in advance, which makes it more subjective [6,31]. Furthermore, the parametric model is not easy to use in studies with multiple output requirements. In contrast, nonparametric evaluation models, represented by the DEA family of models, have advantages in terms of objectivity and the need for multiple outputs [11,12]. They demonstrate significant advantages in terms of objectivity and handling multi-output requirements. The literature on efficiency evaluation using the DEA series of models occupies about 45% of the research on territorial space use efficiency evaluation [9].

2.2. Principles and Development of the DEA Model

The DEA model is a nonparametric method based on linear programming for evaluating the relative efficiency of DUMs with multiple inputs and multiple output indicators [11]. It measures the efficiency level of each DMU with respect to this frontier by constructing a “production frontier” defined by the input and output data of all DMUs [32]. On this frontier, each point represents an “optimal” DMU that maximizes the output for a given input or minimizes the input for a given output [12]. The efficiency of each DMU can be evaluated by comparing its distance to the frontier. Among them, DMUs located on the production frontier are considered to be fully efficient. The DMUs located below the production frontier are assigned an efficiency value according to their degree of deviation, thus identifying inefficient DMUs and their potential directions for improvement [11,12,32]. In addition, the DEA model does not need to establish production functions to estimate parameters, avoiding the random error caused by estimating parameters [5]. Therefore, it also makes the evaluation of efficiency values more objective [28]. Down to the subject area, the DEA model is a cross-cutting model based on input–output theory, integrating several disciplines, such as economics, management, and operations research [33,34]. After more than 40 years of development and evolution, it has grown into a large family of DEA models. It consists mainly of the slack-based measure (SBM) model, the undesired output SBM model, the generalized DEA model, and the Malmquist production index model. Among them, the emergence of generalized DEA models has greatly broadened the scope of application of DEA models. The generalized DEA model not only retains all of the properties of the traditional DEA method [35]. It can also be evaluated based on any reference set. In other words, the generalized DEA model not only focuses on the optimal DMUs but also allows decision makers to compare and analyze the general units, poor units, or specific units as reference objects according to the actual needs [36]. This flexibility gives the generalized DEA model wider application scenarios and higher practical value when dealing with multi-objective decision making problems [37].

2.3. Limitations of the DEA Model Applied to the Evaluation of Territorial Space Use Efficiency

However, the DEA family of models is also not applicable to the efficiency evaluation of all types of DMUs. It was originally designed based on the assumption that DMUs are treated as independent individuals, and it was used to evaluate the efficiency of mutually independent individuals, such as banks, hospitals, and schools [38,39]. Afterwards, the input–output theory and the DEA series of models were migrated to be applied to the study of evaluating territorial space use efficiency through the efforts of interdisciplinary researchers. While this migration has promoted research progress, it has also exposed several problems.
From the perspective of theoretical foundation, input–output theory is an equilibrium theory in the field of economics aiming to explore the inner laws of economic relations [40,41]. The theory assumes that the economic system is closed and ignores the flow of factors in the spatial dimension. At the same time, it is difficult to describe the nonlinear relation in space accurately [42]. Furthermore, the operation mechanism of the DEA model is more mathematical and managerial. It is difficult for mathematics and management to express the correlation and nonlinear relationship in spatial dimensions [43]. However, territorial space has a typical geographical space attribute, and the spatial elements affect and interact with each other, showing a complex multi-threaded relationship [44]. Therefore, it is difficult to rely on economics, mathematics, and management to effectively support the evaluation process of territorial space use efficiency, and the special influence of the geospatial effect must be considered [14,16]. The geospatial effect can be understood as the influence on the results of geographic analysis due to the geographic characteristics, spatial location distribution, and derived spatial configurations of the elements in geospatial space [13]. Currently, researchers have summarized four types of geospatial effects. They are the spatial heterogeneity effect, the spatial proximity effect, the distance decay effect, and the spatial scale effect [13,15]. From the perspective of the geospatial effect, the limitation of the traditional DEA model in the spatial dimension is obvious. For example, the traditional DEA model assumes that all DMUs share the same production frontier, while spatial heterogeneity leads to different regions that may have different production frontiers [45]. The influence of geographical distance on factor flow usually presents a nonlinear attenuation law, which is inconsistent with the linear assumption of the traditional DEA model [46]. In addition, the influence of the geospatial effect on efficiency evaluation results has been supported by empirical studies. For example, studies have shown that there are significant differences in technical efficiency across geographical regions, which are mainly due to spatial heterogeneity [47]. Ma et al. proved that the spatial proximity effect can affect efficiency evaluation, and the research results of Beijing–Tianjin–Hebei and the Yangtze River Delta showed that use efficiency was significantly related to the size of urban agglomerations and surrounding conditions [48].
In summary, it is very necessary to reconstruct the DEA model under the premise of considering the geospatial effect so as to make it more applicable to the evaluation of territorial space use efficiency.

3. GeoDEA Model Construction

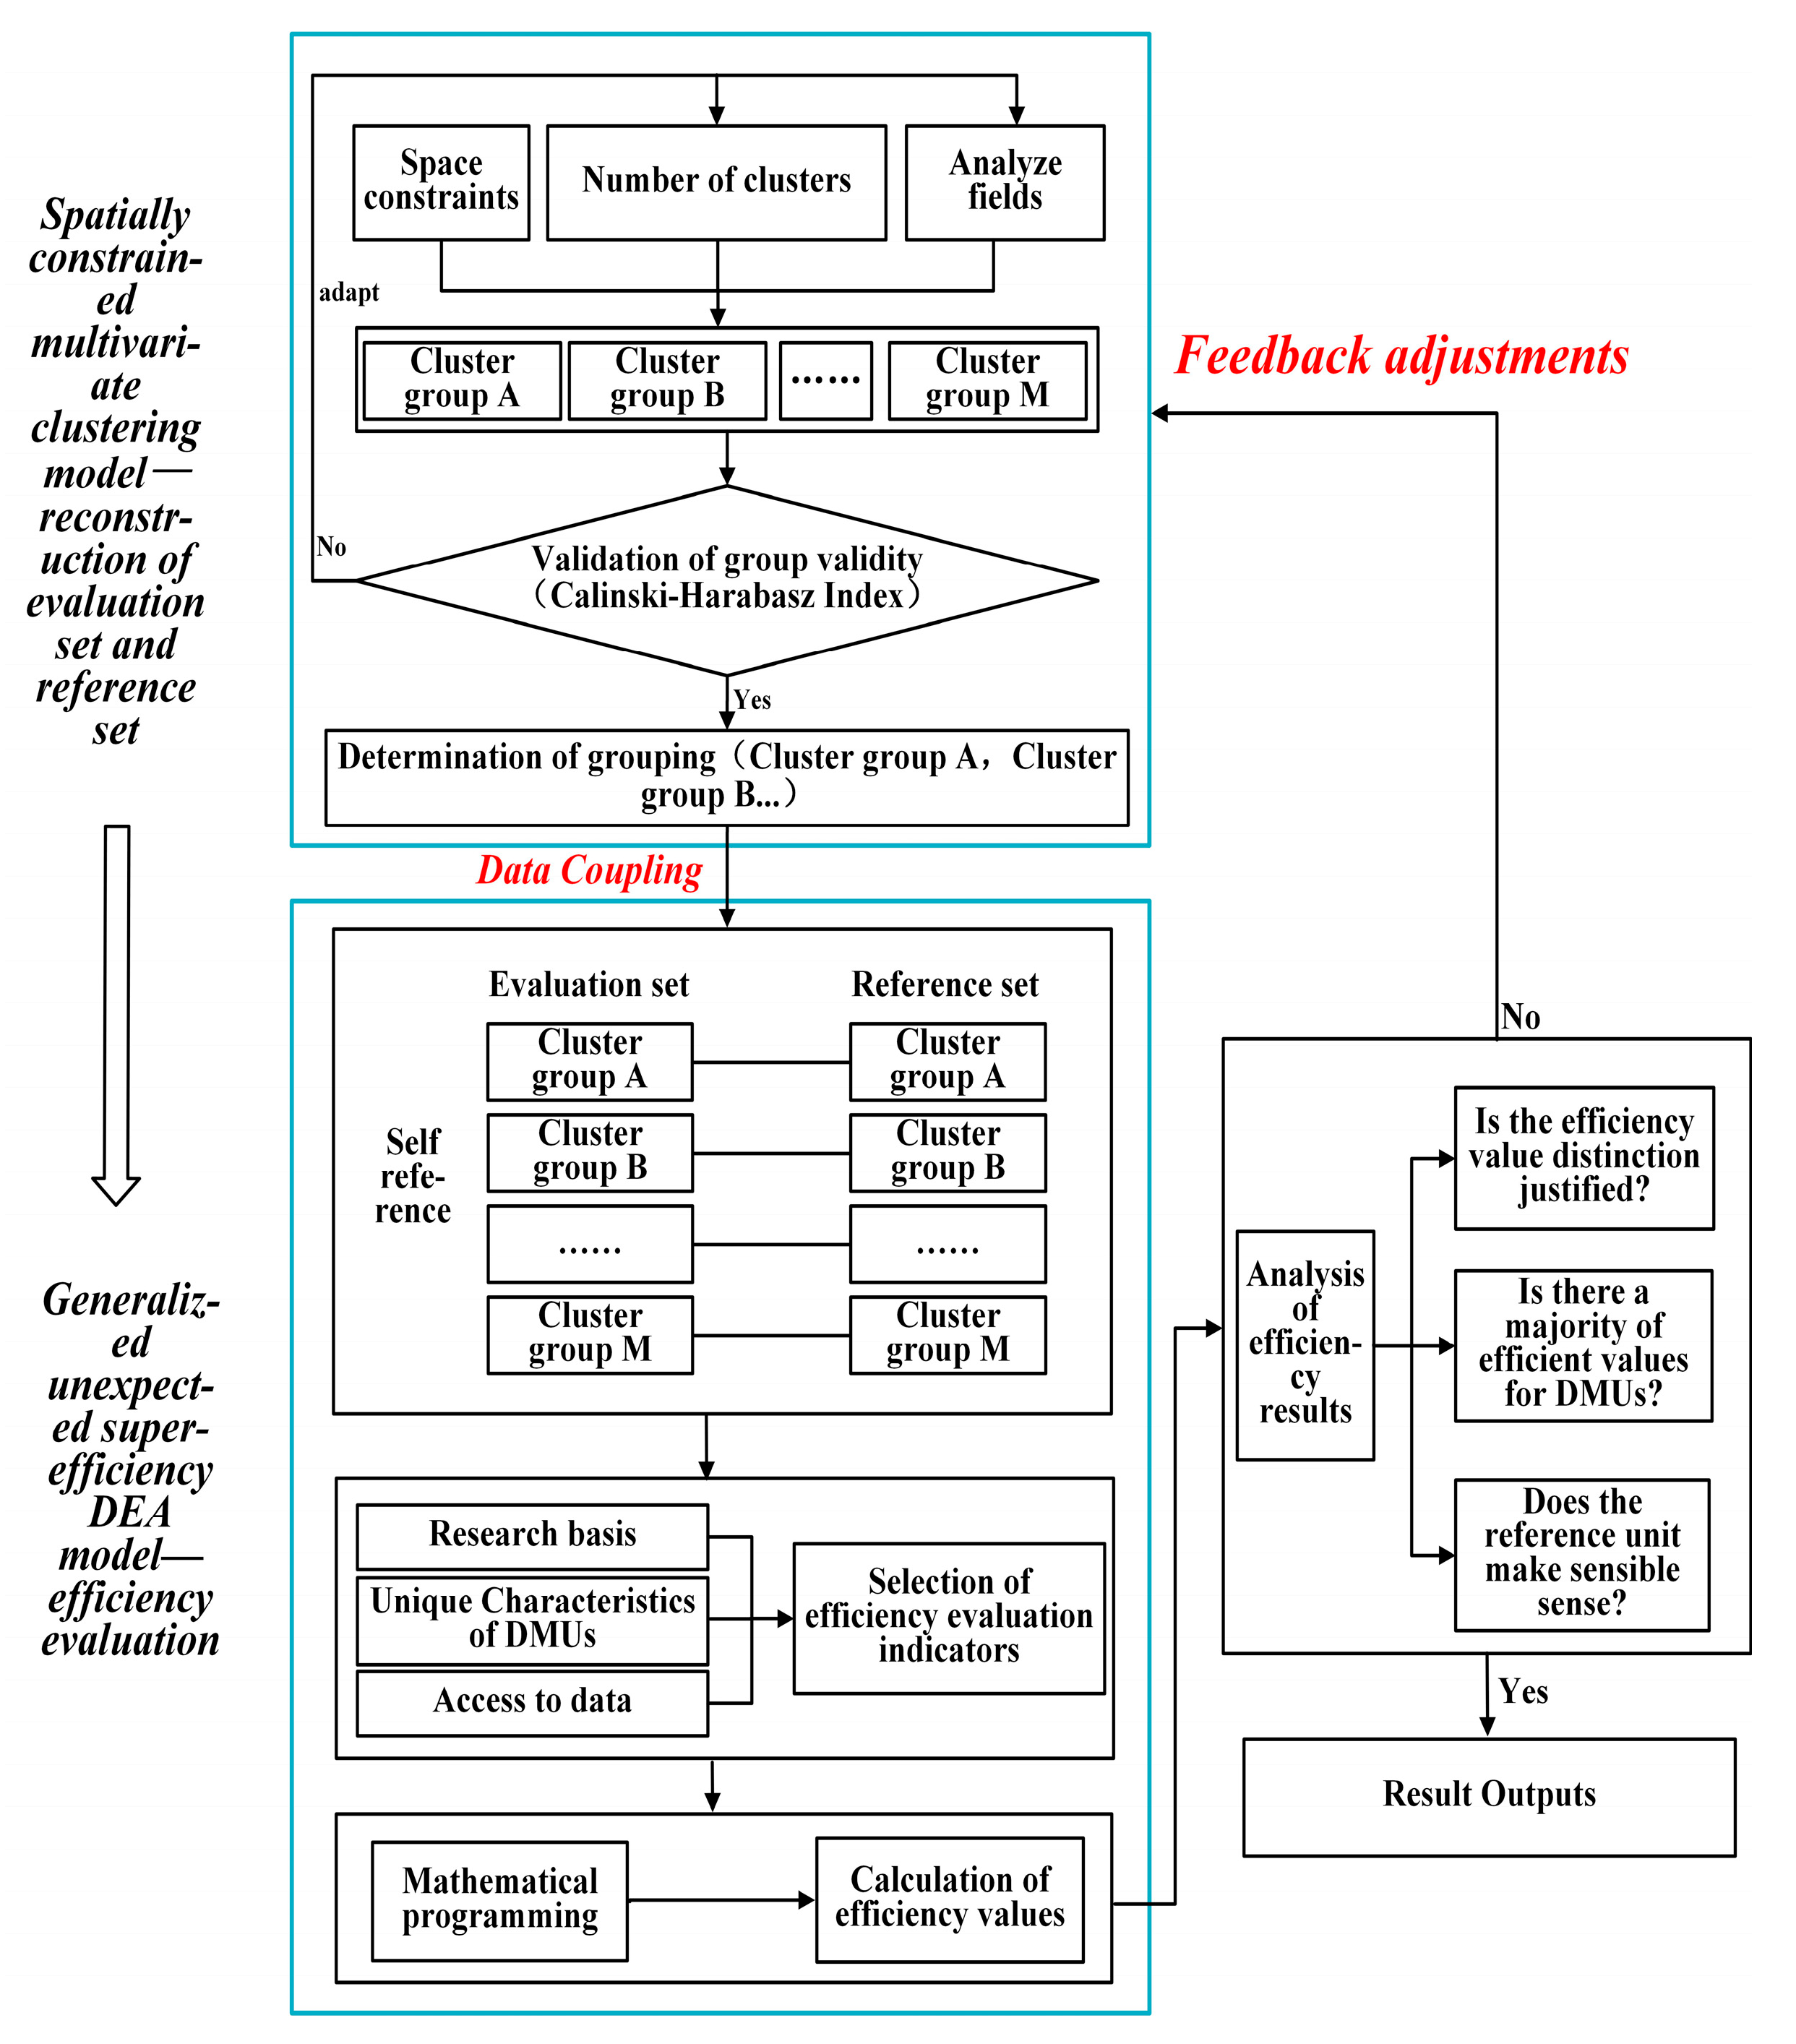
3.1. Coupling and Operational Mechanisms of the GeoDEA Model

In the process of discussing the evaluation of territorial space use efficiency, it is realized that there are significant differences between territorial space. This difference is not only reflected in geographical location and natural resources but also profoundly affects the regional economic development model and the efficiency level. If the DEA model is used directly to evaluate territorial space use efficiency, it will inevitably lead to all evaluation objects sharing the same reference frontier. This is seriously inconsistent with the inherent spatial difference characteristics of territorial space. Therefore, it is necessary to divide territorial space with similar development levels into homogeneous subsets through a scientific spatial grouping method. Grouping not only improves the comparability of the units within the group but also ensures the rationality of the reference front. As far as clustering methods are concerned, the spatially constrained multivariate clustering model can consider geographical continuity to ensure spatial adjacency of the clustering results. It allows for setting fields according to key factors to improve the pertinence of clustering. The number of cluster groups can also be adjusted to ensure that the number of territorial spaces of each group meets the efficiency calculation requirements. Therefore, the GeoDEA model is constructed by coupling the spatially constrained multivariate clustering model with the generalized DEA model. The coupling mechanism can be de-scribed from the two perspectives of “data coupling” and “feedback adjustment” (Figure 1).
(1) Data coupling mechanism. This means that there is a calling relationship between two models. The transfer is the data value obtained from the run of the former model, which can be understood as the value transfer in high-level language [49]. This coupling mechanism is characterized by a relatively simple coupling relationship between the models and greater independence from each other. Models interact with each other to a lesser extent. The coupling is relatively low [50]. It is a model coupling method that is more favored by researchers. In this study, it refers to passing the data values generated by the spatially constrained multivariate clustering model to the generalized DEA model (Figure 1). Thus, the coupling of the two models is realized to construct the GeoDEA model. Specifically, the former model clusters and groups DMUs under the guidance of space constraints, number of clusters, and analyzed fields. The evaluation set and the reference set consisting of DMUs that are very similar both in geography and socio-economics are reconstructed. It needs to be clear that the reference set is the set of DMUs used for comparison, which provides a standard against which the efficiency of other DMUs can be measured. The evaluation set is the set of DMUs being evaluated. Then, the reconstructed evaluation set and the reference set are transferred to the generalized DEA model. The data transmitted by the former model provide the basic support for the proper operation of the latter model. The latter achieves efficiency evaluation by selecting appropriate group reference methods and model parameters.
(2) Feedback adjustment mechanism. This means that there is a feedback relationship of data results between the two models [51,52]. Specifically, the feasibility and accuracy of the latter model can be clearly assessed by analyzing the outputs of the former model [53,54]. Then, it provides targeted guidance on the data or methodology of the latter model. At the same time, the output results of the latter model can also indirectly verify the reliability of the output results of the former model [55,56]. The former model is adjusted and optimized according to the validation results. In this study, this feedback adjustment mechanism is reflected as follows. The rationality and reliability of the spatially constrained multivariate clustering model are indirectly verified by analyzing the efficiency evaluation results of the generalized DEA model. This feedback provides a guiding direction for the subsequent adjustment of the spatially constrained multivariate clustering model. Specifically, the evaluation results are analyzed in terms of dimensions like efficiency values and reference units (Figure 1). The rationality and accuracy of the efficiency evaluation results are fully assessed. Then, the rationality and reliability of the spatially constrained multivariate clustering model for the reconstruction of the evaluation set and the reference set are indirectly verified. If the analysis reveals that the efficiency values measured using the generalized DEA model are inaccurate or unreliable, then the parameters of the spatially constrained multivariate clustering model can be targeted to adjust the evaluation set and the reference set appropriately for reconfiguration.

3.2. GeoDEA Model Parameterization

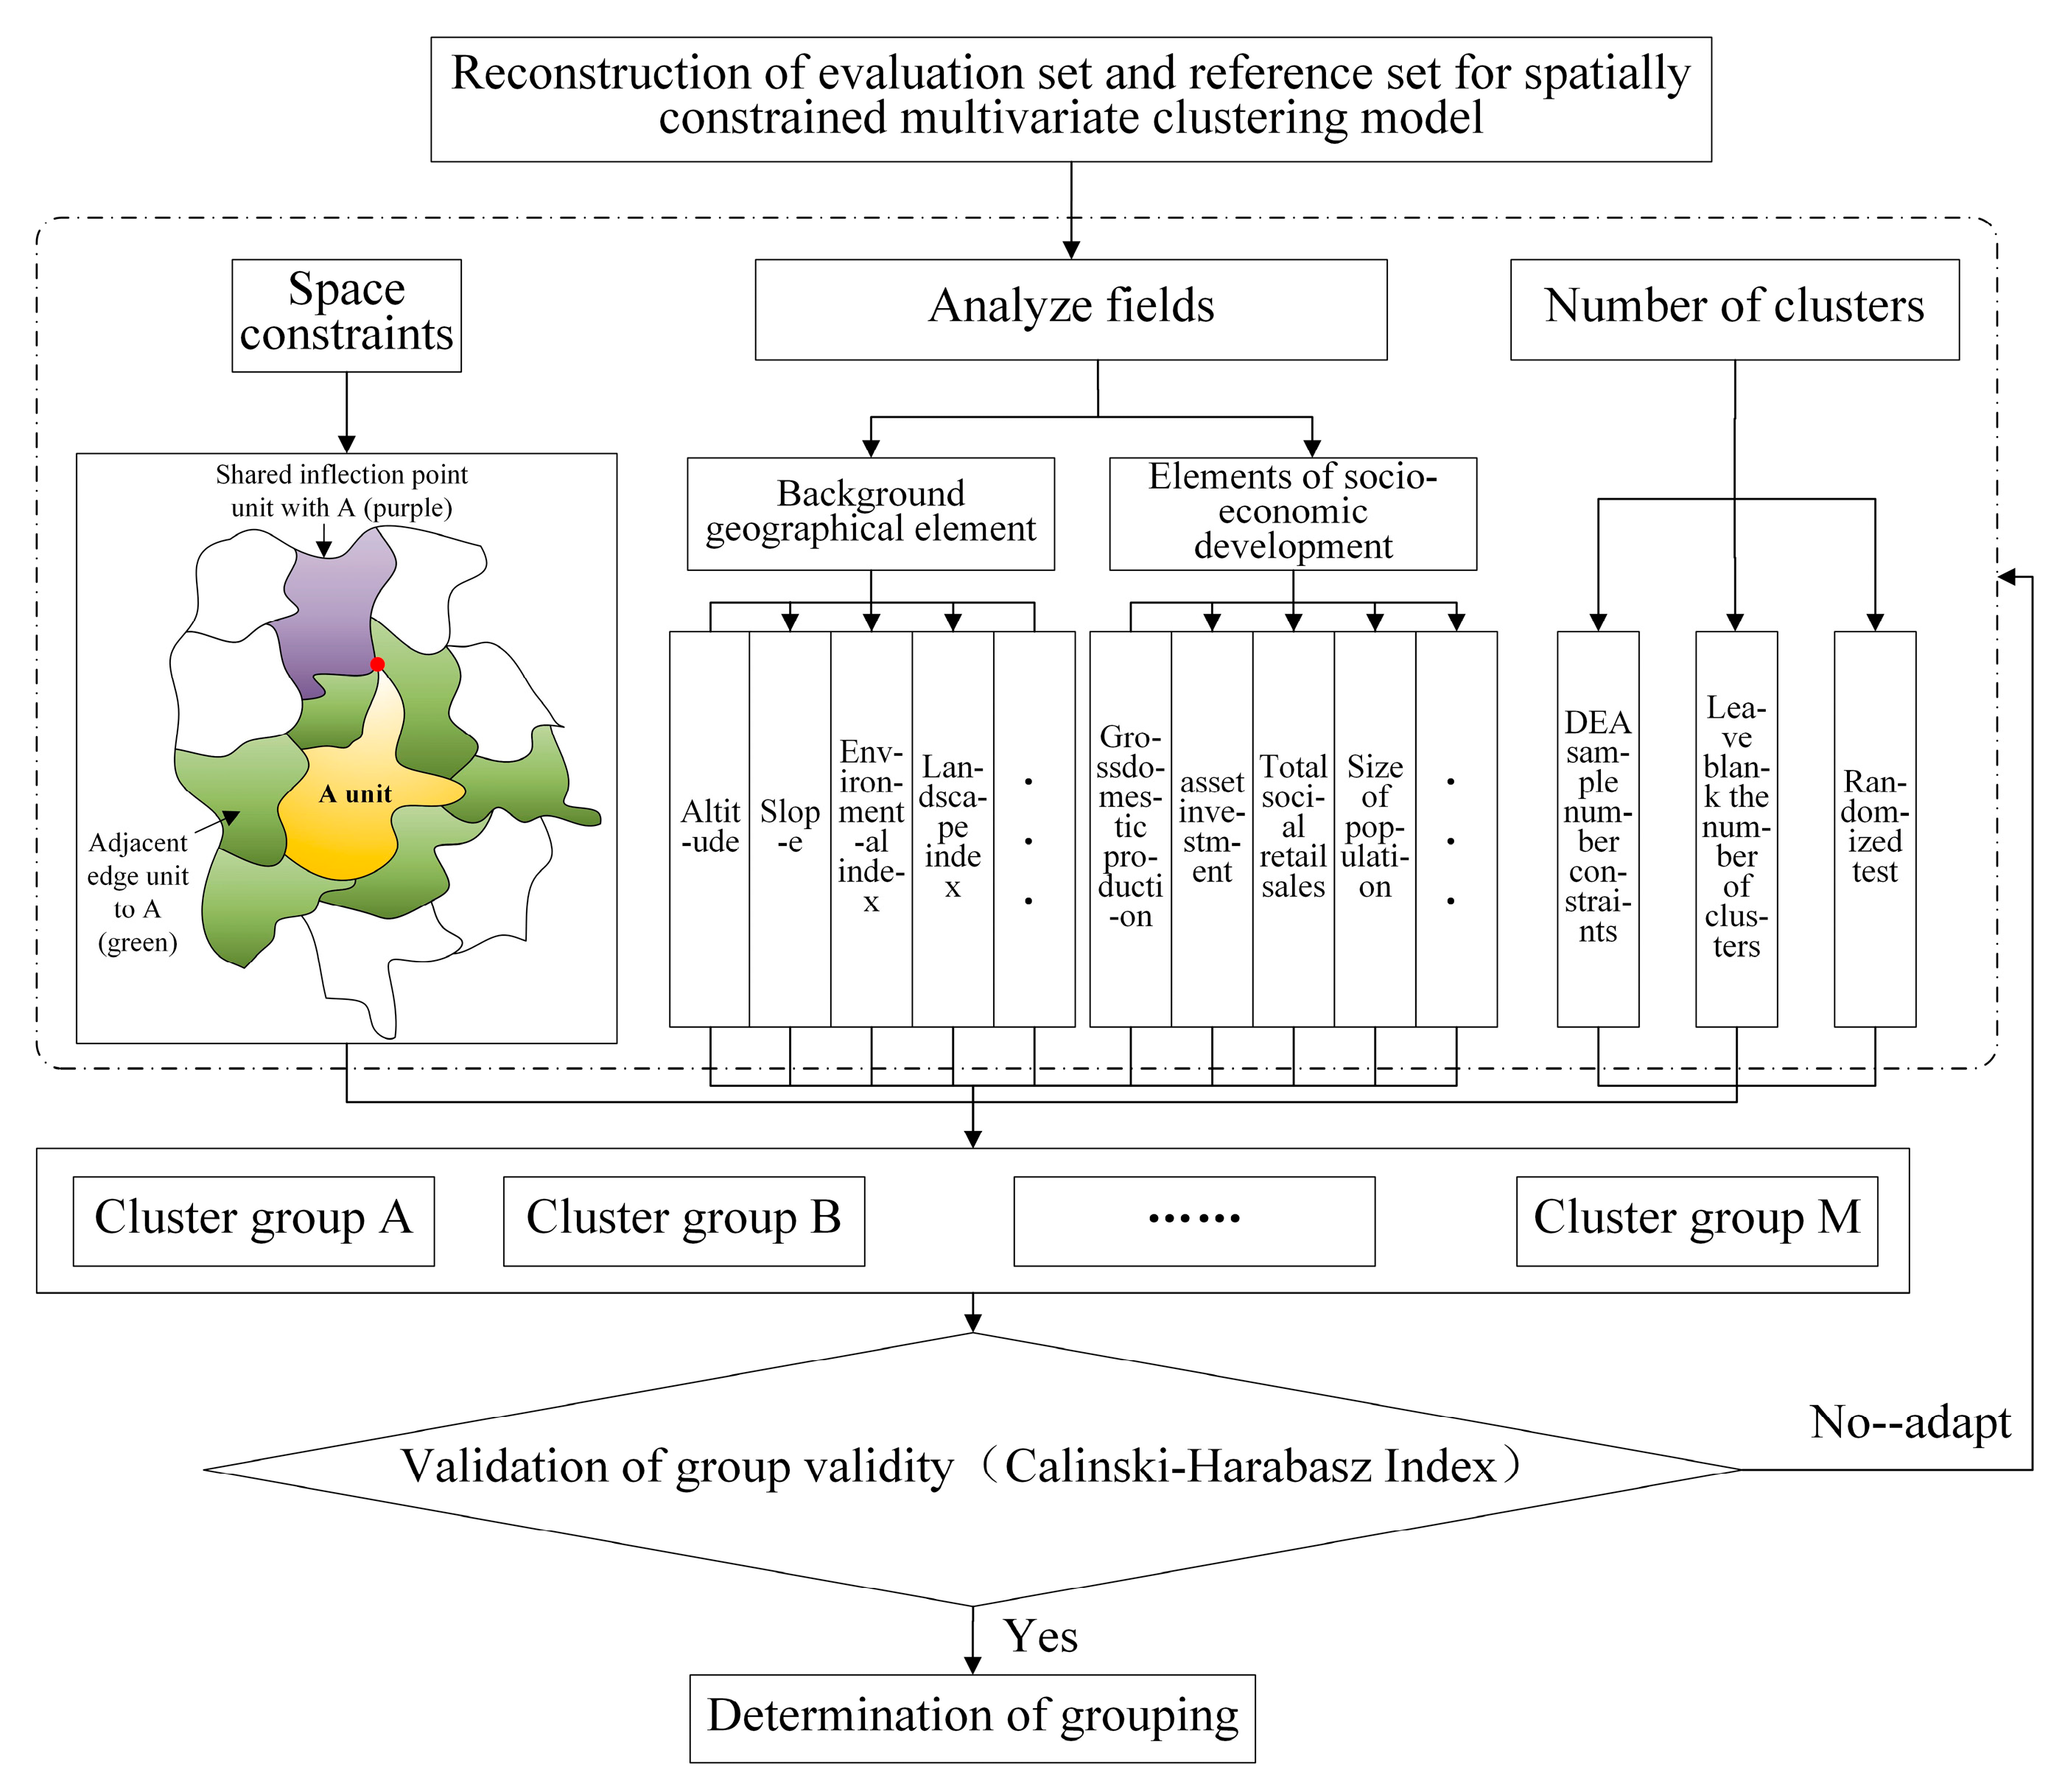
3.2.1. Spatially Constrained Multivariate Clustering Model Parameterization

The spatially constrained multivariate clustering model is a geographic processing technique that combines spatial statistics and multivariate data analysis [57]. The model can cluster multivariate data with spatial distribution characteristics. In the process of clustering, the multivariate attribute feature similarity of data is considered. Spatial proximity is also introduced as a constraint to ensure the spatial continuity and consistency of the clustering results [58]. Through these comprehensive considerations, the spatially constrained multivariate clustering model can reveal the spatial distribution law and pattern of data more accurately. In this study, the model is applied to the grouping of DMUs. The three core contents of spatial constraints, number of clusters, and analysis fields are mainly considered during the model’s operation (Figure 2).
(1) Space constraints. This serves to ensure that all elements in the same cluster are spatially adjacent. There are four main types of spatial constraints: neighboring edges only, neighboring edge corners, pruned Delaunay triangulation, and spatial weight files. The model applies to geographic space (e.g., territorial space), which is a continuous surface element. Therefore, the study considers only spatial constraints and does not consider the influence of temporal states for the time being. In addition, the development of transportation networks has led to greater socio-economic linkages between the surface elements of both share-a-point and share-a-side. For the above reasons, the neighboring edge corner spatial constraint type is eventually chosen to realize the clustering of the DMUs.
(2) Number of clusters. The manner in which the number of clusters is determined needs to be considered in the context of a specific study. This study determines the optimal number of clusters by combining a priori knowledge, the number of clusters left blank, and experimentation. This approach fully takes into account the similarity of DMUs within the same cluster, as well as the differences among them across different clusters. It also satisfies the requirements of the DEA model for the number of DMUs, which together determine the optimal clustering results.
(3) Analyze fields. This is the basis for solving for similarity and dissimilarity within elements. This research takes into account two key factors affecting the geospatial effects in the selection of the analytical fields. The first is the background geographic factors, including the digital elevation model (DEM), the slope, the production–living–ecological space score, the environmental index, the landscape index, etc. The second is the socio-economic development factors, including input of fixed assets, economic output, total social retail sales, population, and infrastructure profile. These two factors are used together as analyzed fields to achieve spatial clustering.

3.2.2. Generalized DEA Model Parameterization

This study takes full account of the basic connotations and contexts of territorial space use, as well as the existence of undesirable outputs. In order to avoid a situation where most of the DMUs are efficient, which is not conducive to ranking and analyzing the efficiency values, the study ultimately chose the SBM super-efficiency model, which considers undesirable outputs for the solution of the generalized DEA model. The mathematical planning equation is shown below [59,60]:
m i n ρ = 1 + 1 m i = 1 m s i / x i k 1 1 q 1 + q 2 ( r = 1 q 1 s r + / y r k + t = 1 q 2 s t b / b r k   ) s . t . j = 1 , j k n x i j λ j s i x i k j = 1 , j k n y r j λ j + s r + y r k j = 1 , j k n b t j λ j s t b b t k 1 1 q 1 + q 2 ( r = 1 q 1 s r + / y r k + t = 1 q 2 s t b / b r k   ) > 0 λ , s , s + 0 i = 1,2 , , m ; r = 1,2 , , q ; j = 1,2 , , n ( j k )
The production possibility set is composed of decision units other than decision unit k, as follows:
x , y | x j = 1 , j k n x i j λ j , y j = 1 , j k n y r j λ j
where the added constraint 1 1 q 1 + q 2 ( r = 1 q 1 s r + / y r k + t = 1 q 2 s t b / b r k ) > 0 can be removed in the linear transformation. The i represents the types of input factors, and there are m types; r represents the types of output factors, and there are q types; q 1 denotes desirable output variables, and q 2 denotes undesirable output variables; j represents the decision unit, and there are n kinds; k represents the unit being measured at the moment; λ represents the linear combination coefficient of the decision unit; s i is the input slack variable; s r + is the desired output slack variable; and s t b is the undesired output slack variable.
In addition, the return to scale parameter is chosen to be unchanged and the orientation parameter is chosen to be unoriented. The participation method is chosen to be self-benchmarking.

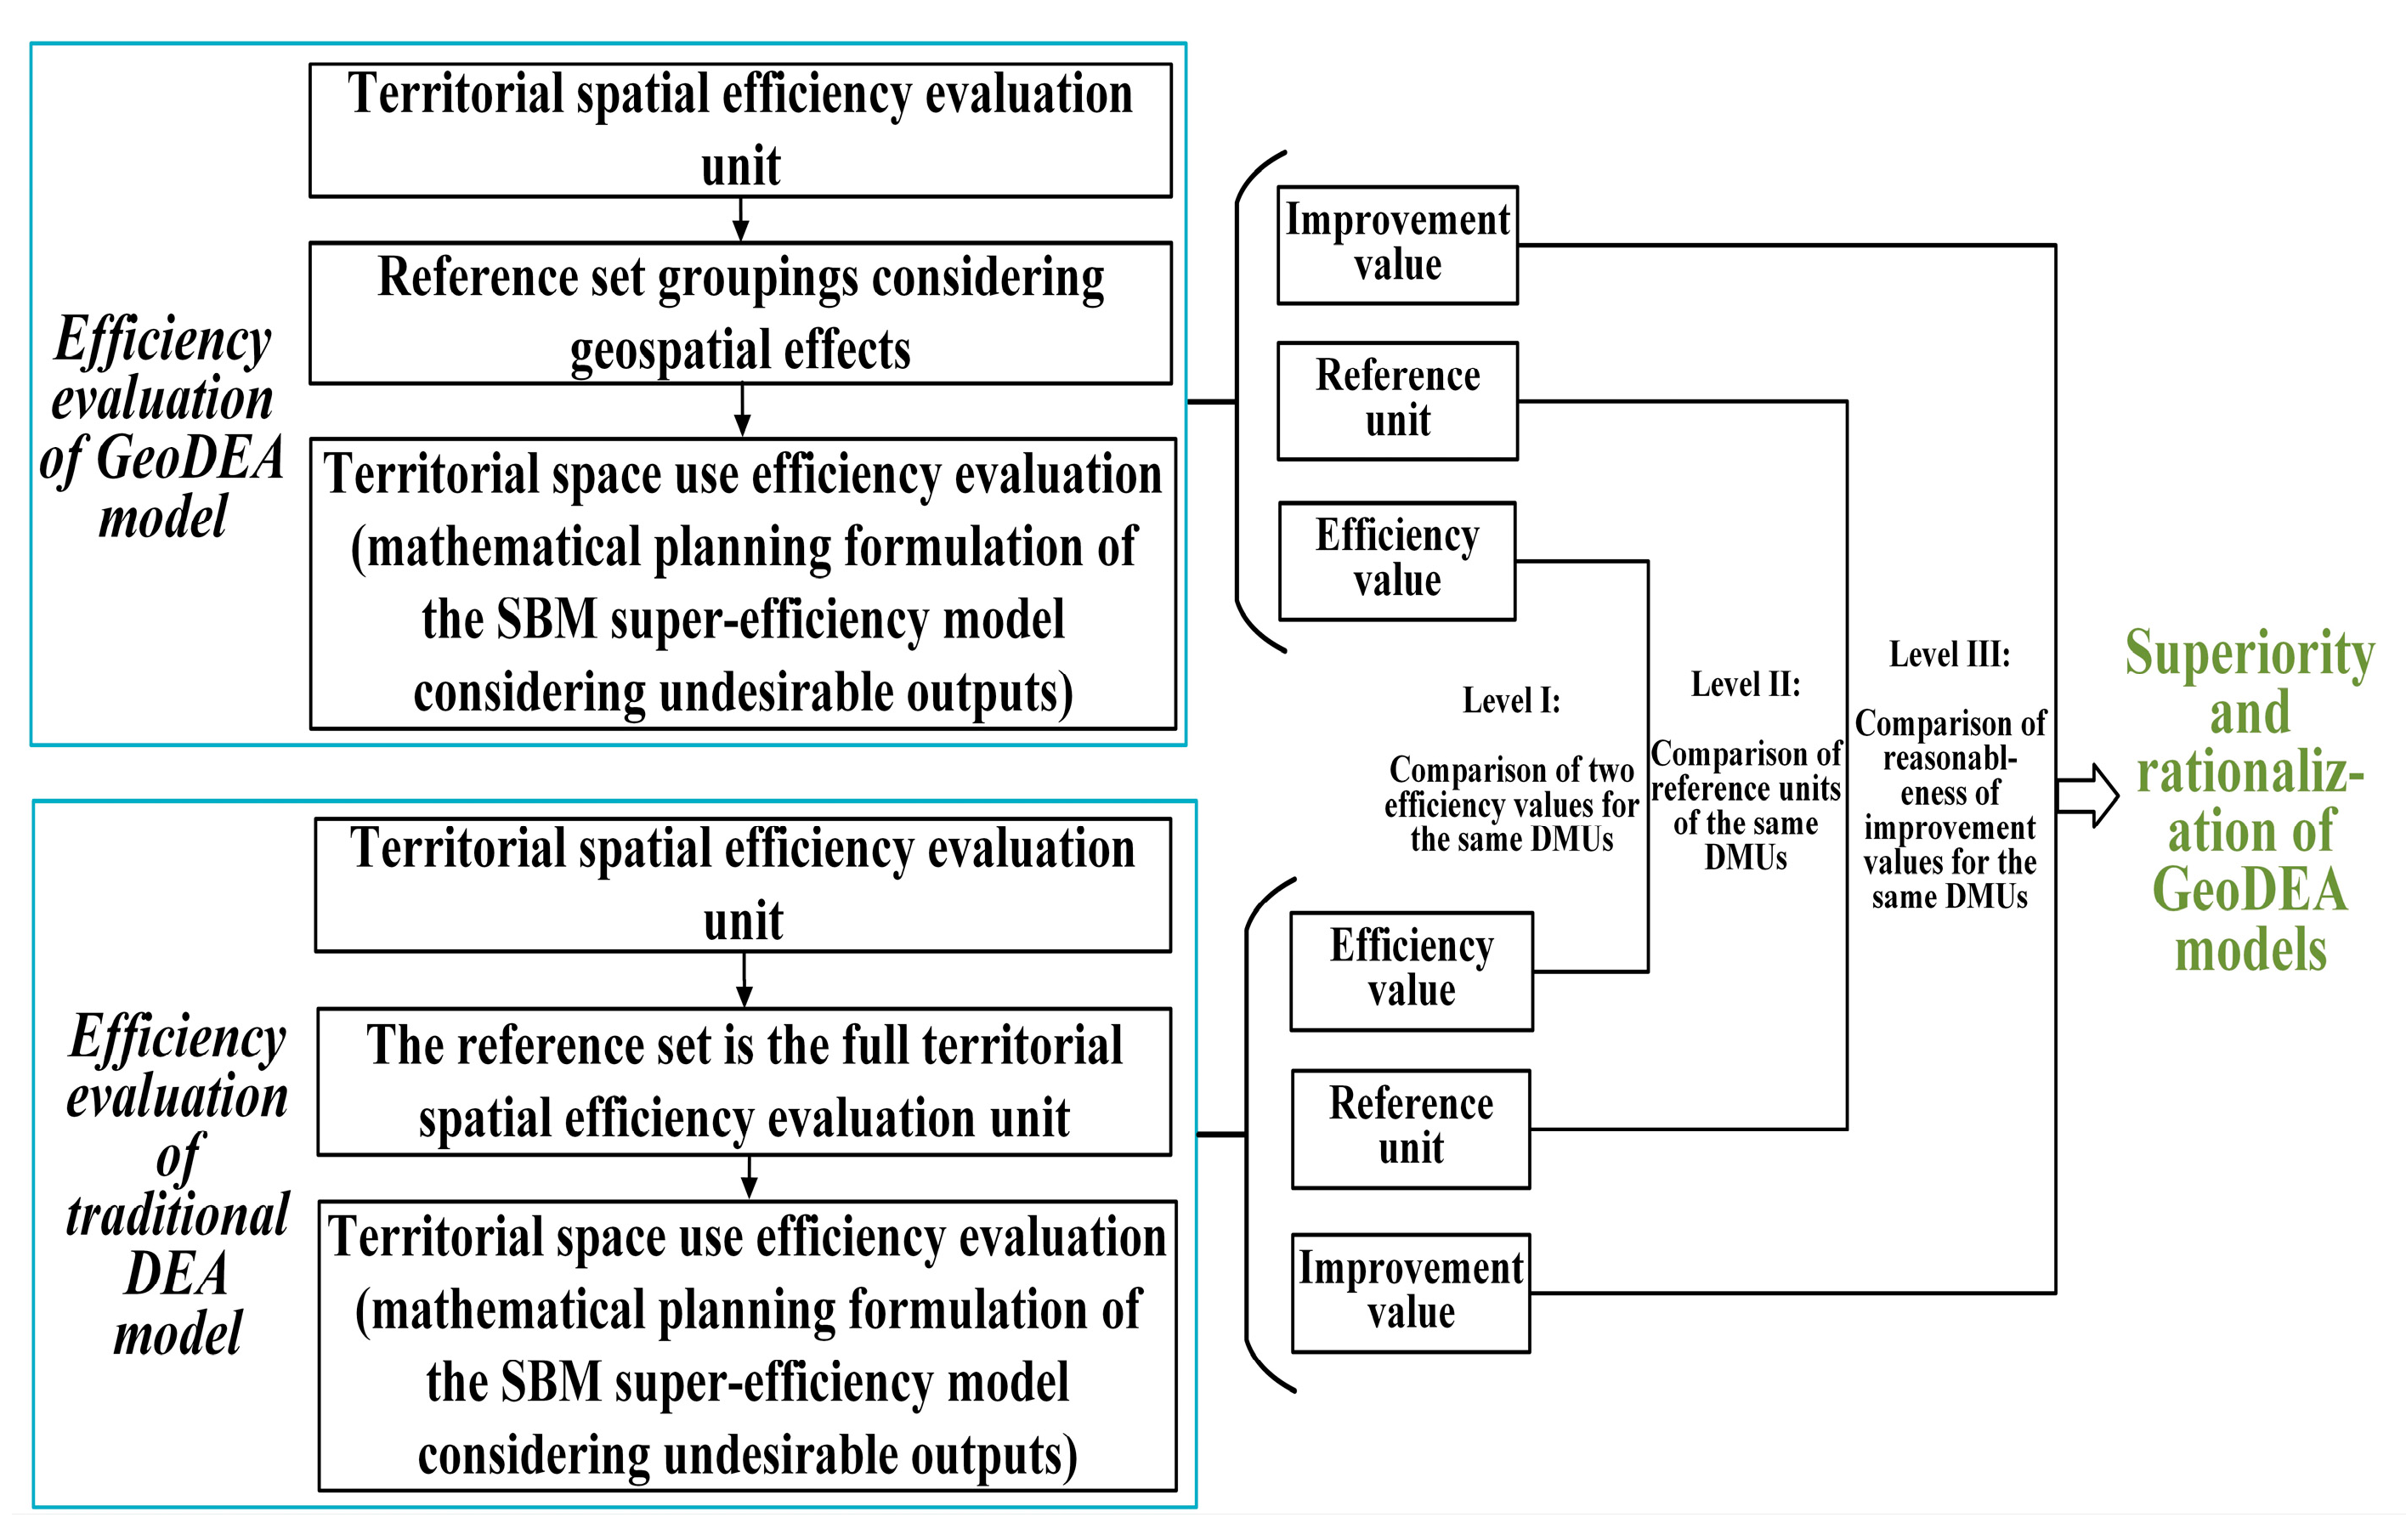
3.3. GeoDEA Model Validation

The major difference between the GeoDEA model and the traditional DEA series of models is whether or not to consider the influence of geospatial effects on efficiency evaluation. This is specifically reflected in the model’s treatment of DMUs. The traditional DEA model usually runs without considering the variability among DMUs caused by geographic factors, i.e., they do not perform classification or grouping processing for DMUs. All DMUs play the dual role of a reference set and an evaluation set at the same time. Such comprehensive inclusion affects the construction of the frontier surface, which in turn has an impact on the evaluation of the efficiency value. In contrast, the GeoDEA model’s running process carries out finer classification and processing of DMUs by considering geographic features, such as spatial heterogeneity and distance attenuation. To verify the feasibility and robustness of the GeoDEA model, this study compares it with a representative traditional DEA model (the SBM super-efficiency model considering undesirable outputs) (Figure 3). The study focuses on a detailed validation analysis in three dimensions: efficiency value, reference unit, and non-radial nulls.

4. Model Validation Results

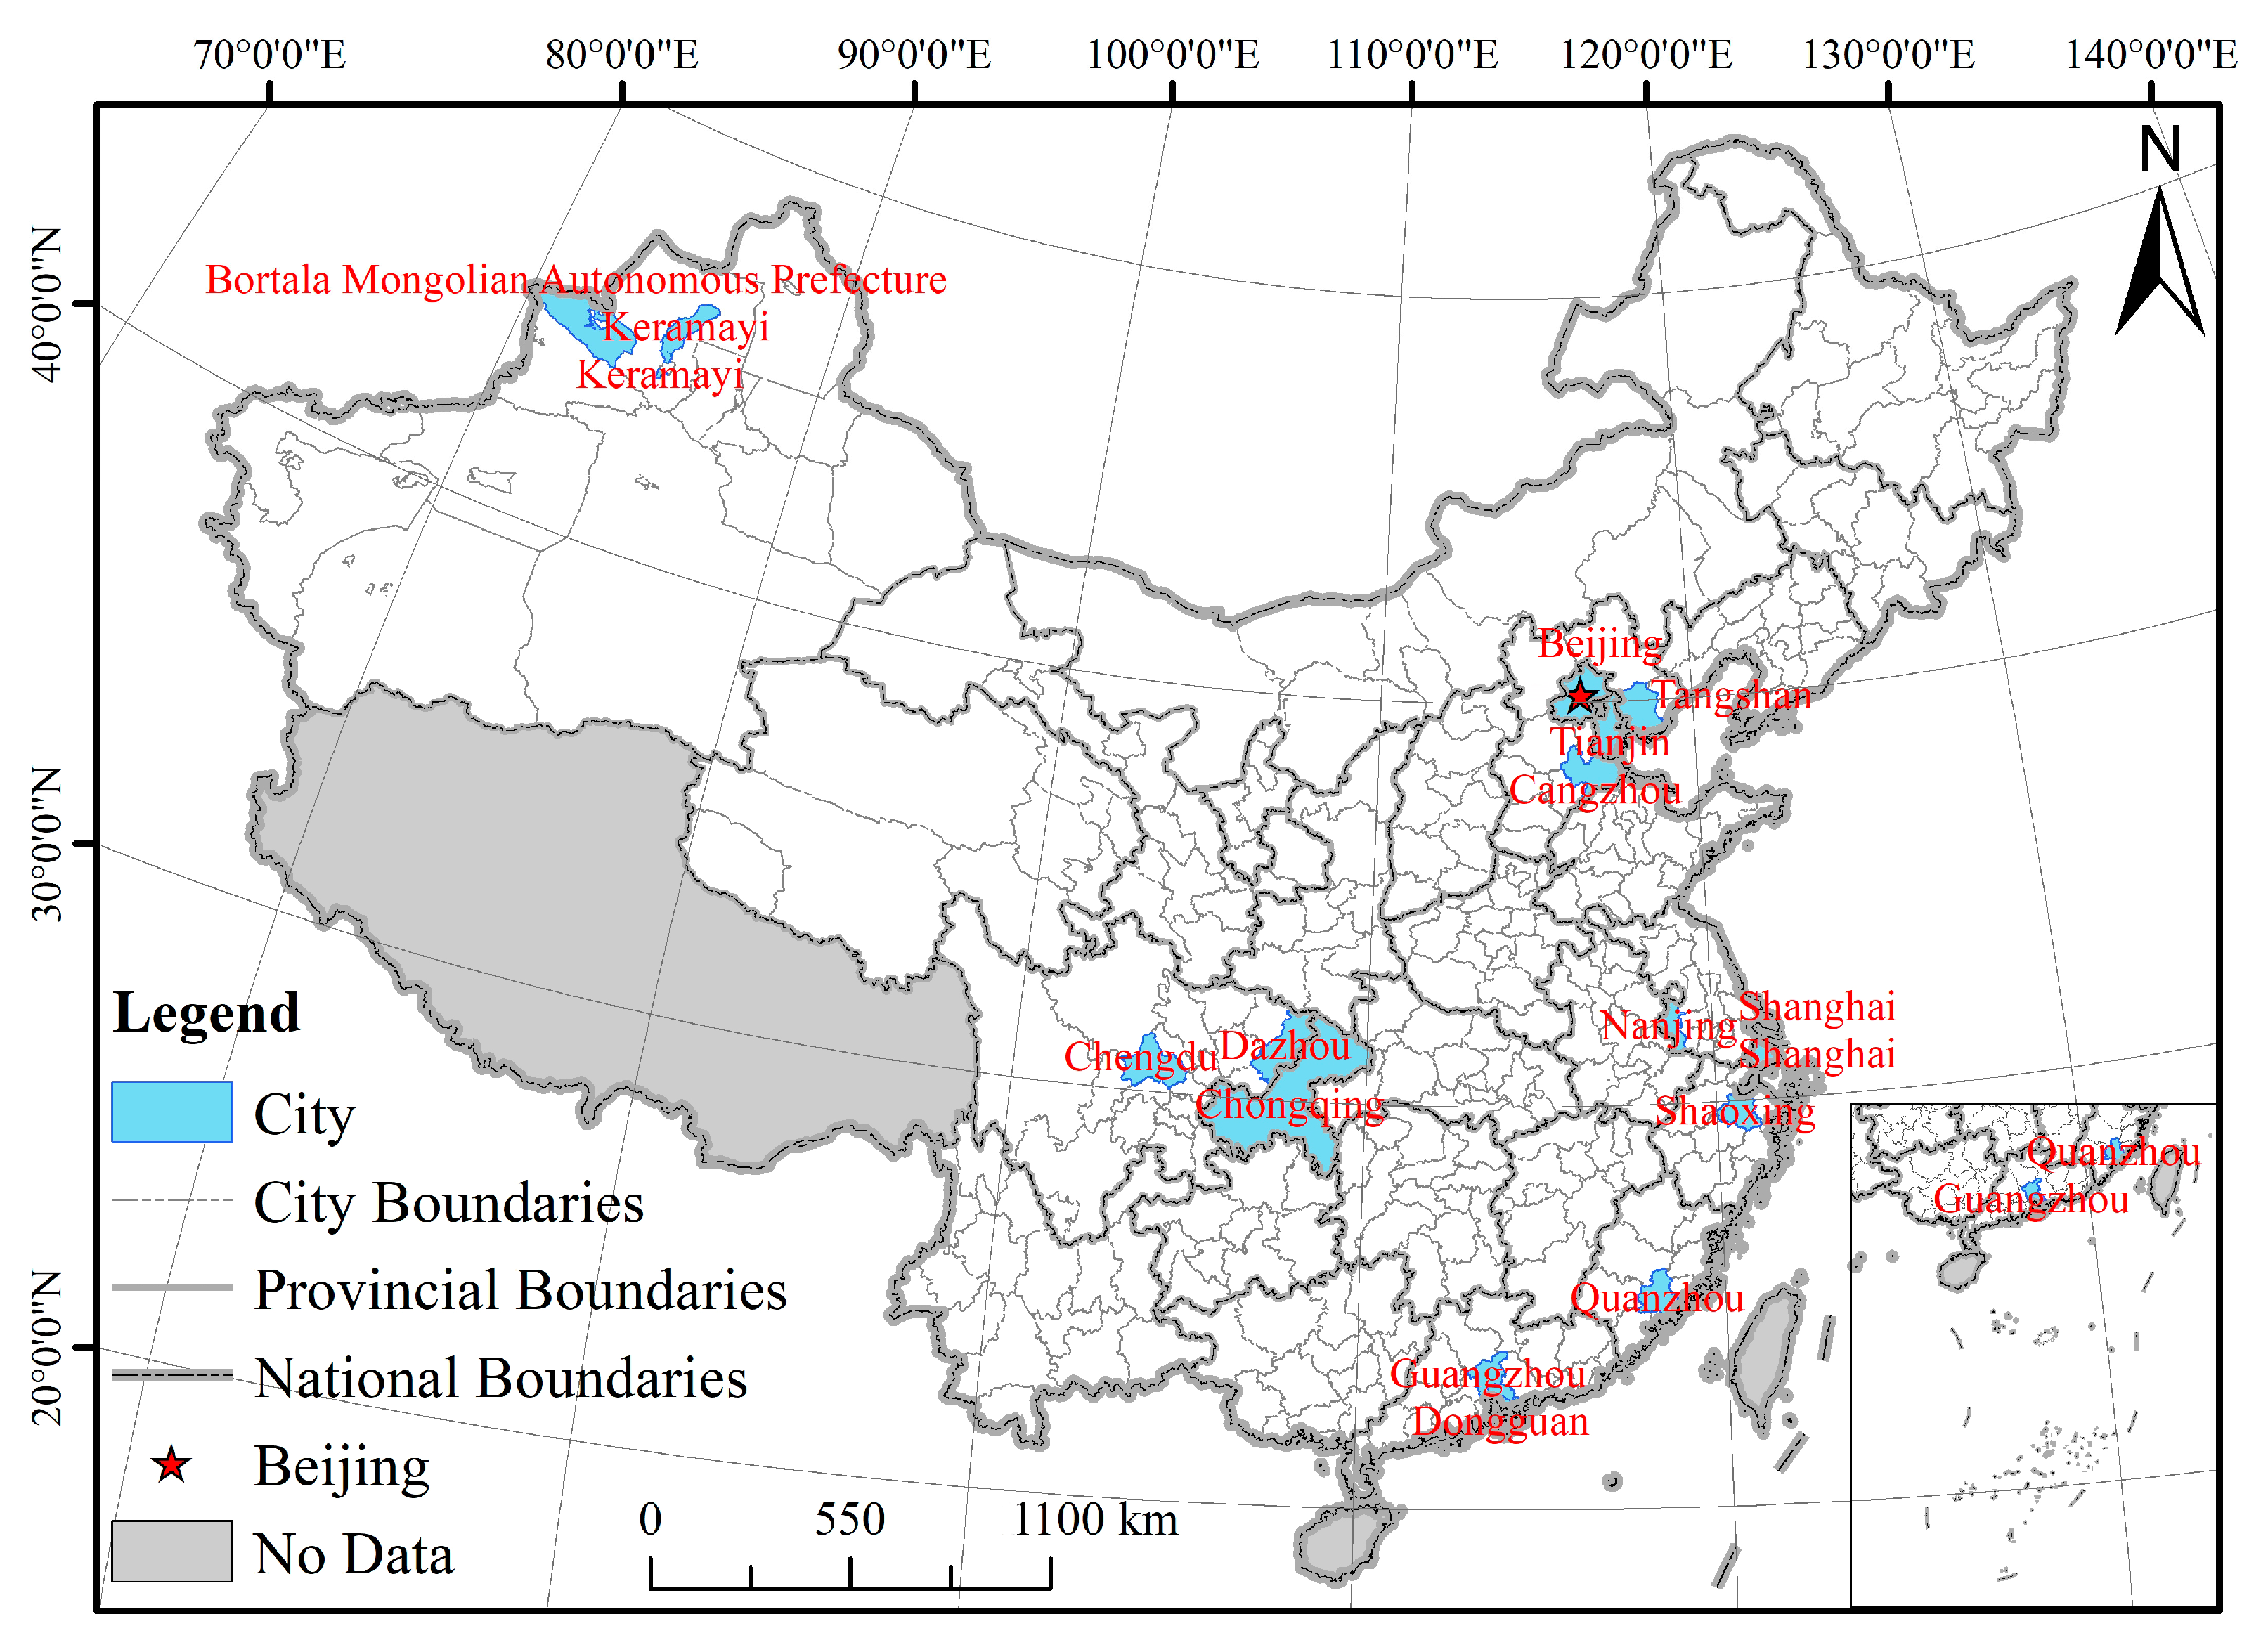
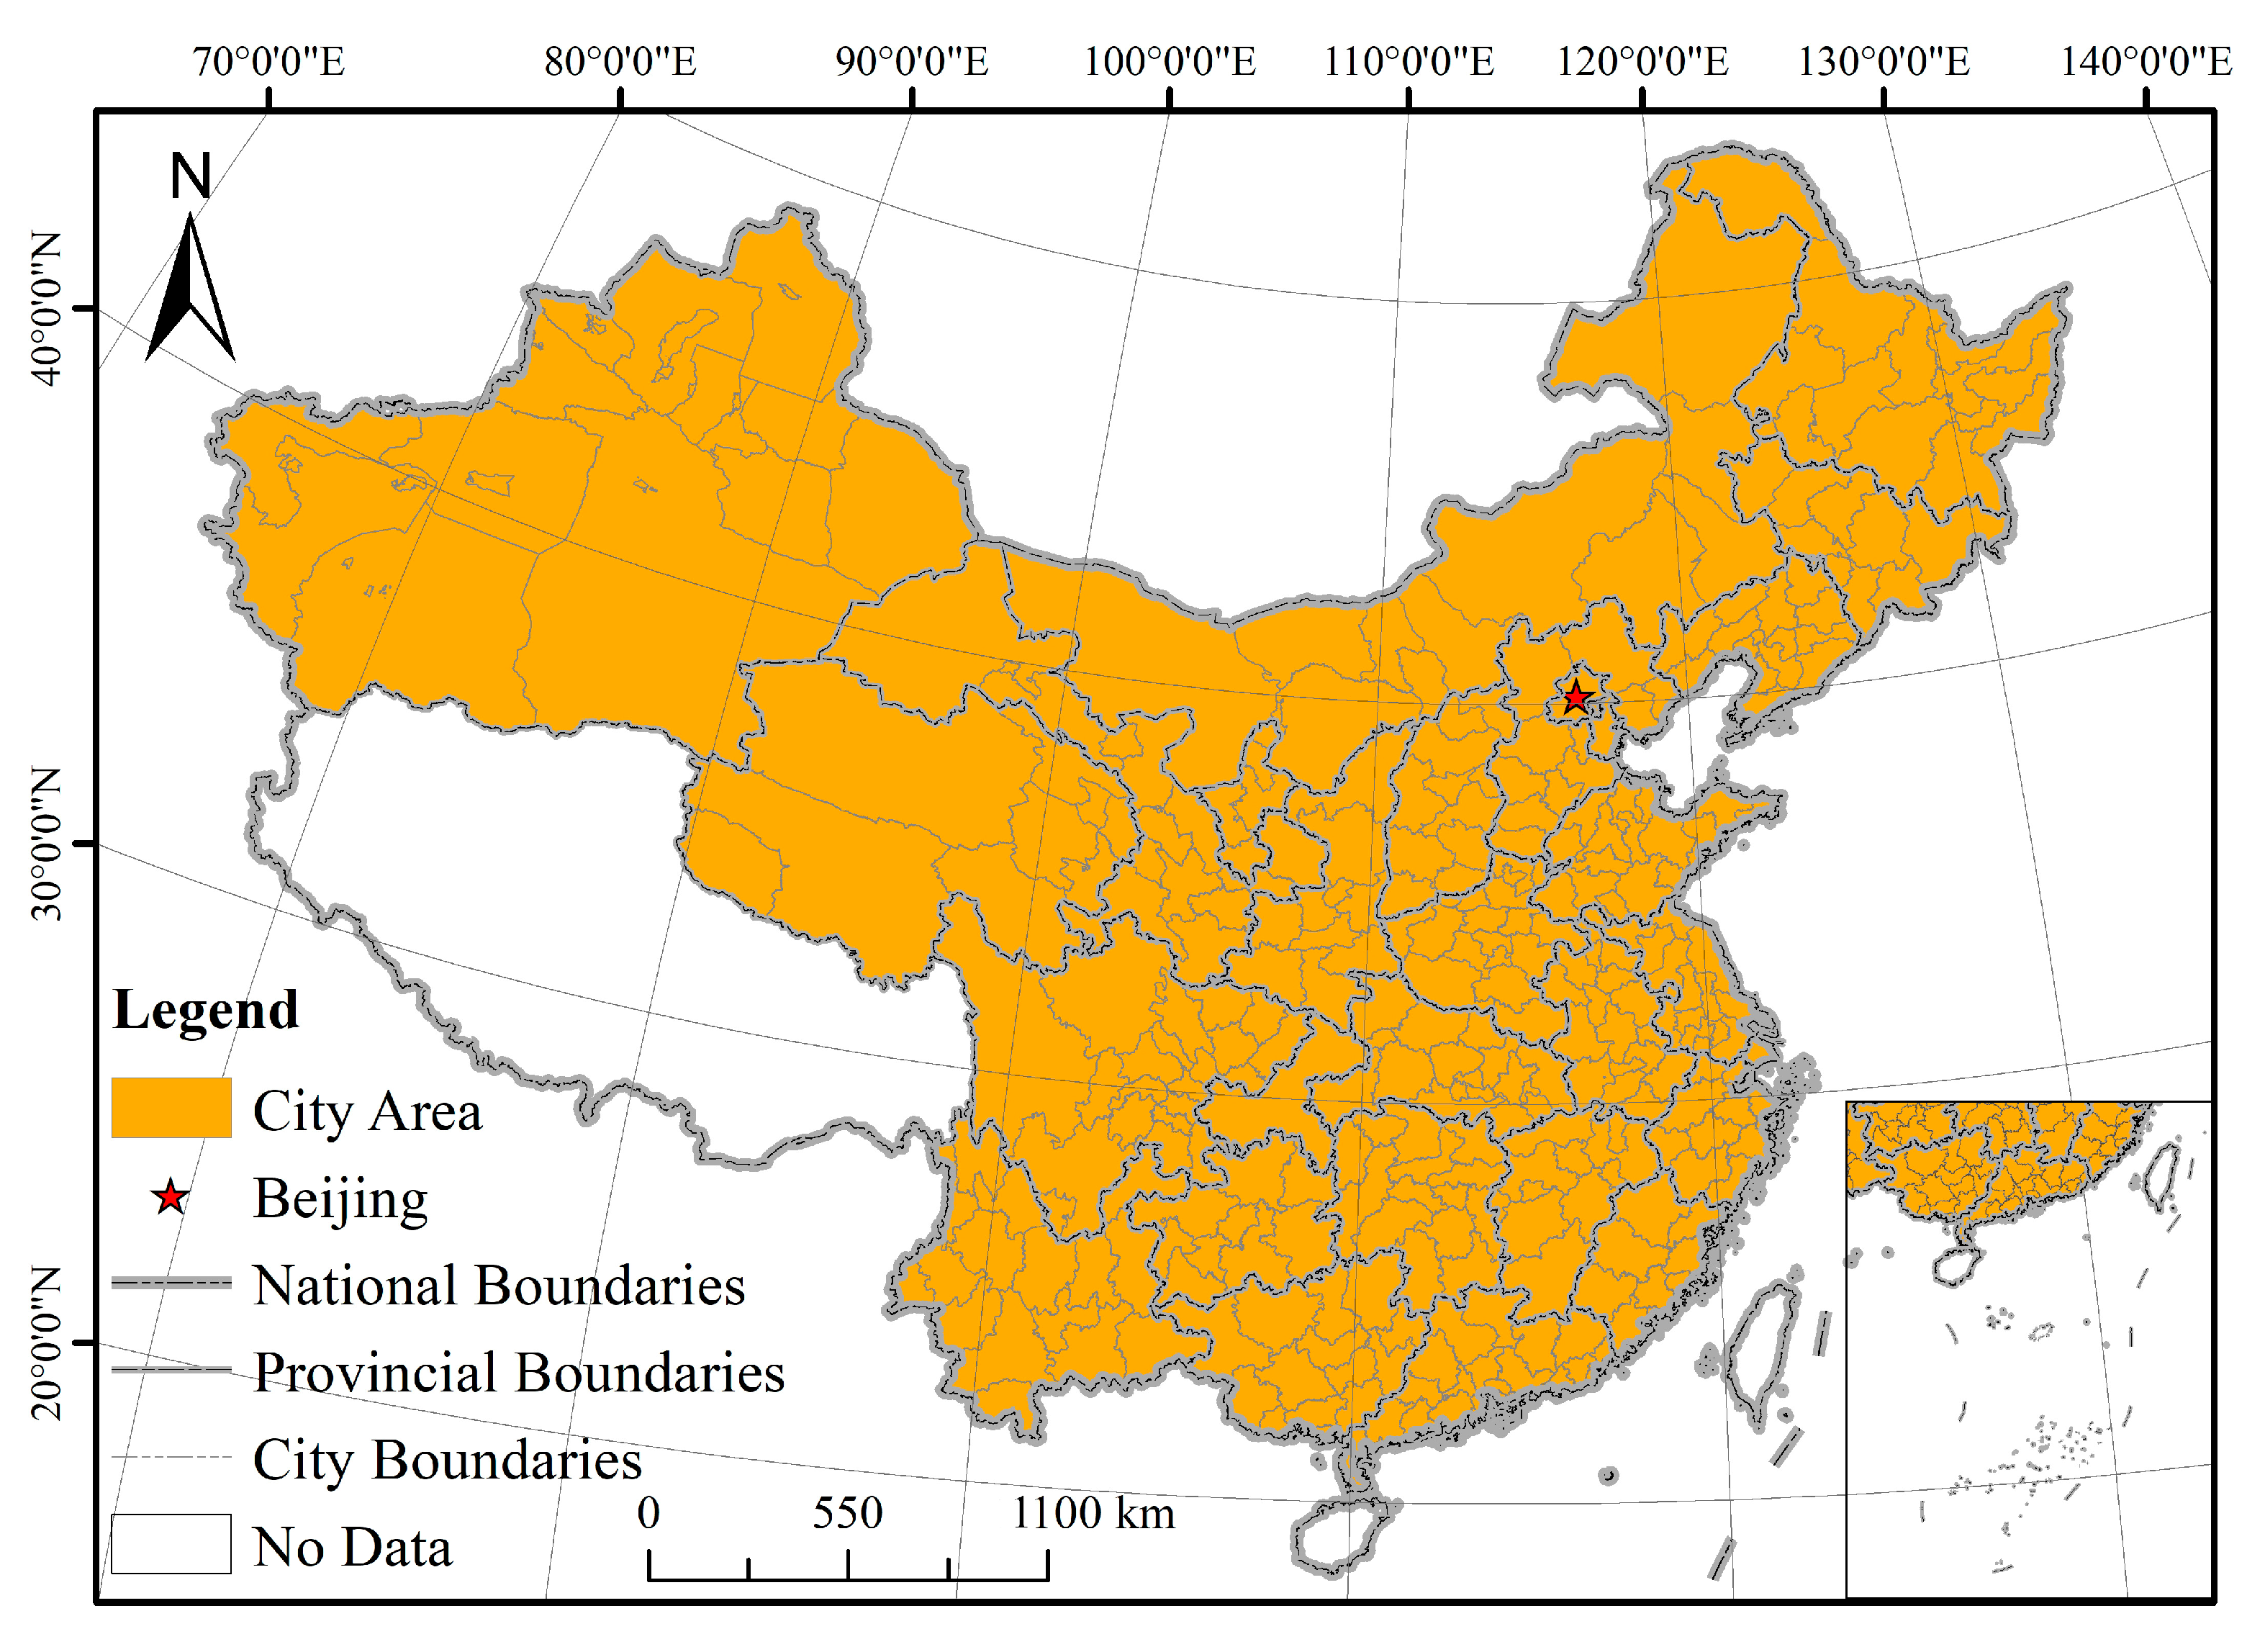
4.1. Study Area and Data

In this study, 340 cities in China were used as the study area to validate the GeoDEA model, taking into account the availability of data and the feasibility of the study (Figure 4). The study area covers almost the whole mainland of China, including municipalities directly under the central government, sub-provincial cities, and municipal cities. These cities are under the unified administration of the state. Therefore, a unified standard is followed in the relevant data investigation, sorting, filling, etc., to ensure the standardization and comparability of data. The selected cities are of different sizes and levels of development to ensure the diversity of the territorial space. This diversity can not only fully reflect the spatial heterogeneity of territorial space use efficiency but also verify the rationality of the GeoDEA model’s “clustering before evaluating efficiency” method. In addition, the data availability of selected cities is high, which can meet the requirements of model input. Some cities, such as those in Tibet, were not fully included in the analysis due to data limitations. However, on the whole, the data of selected cities cover a wide range and are of high quality, which can support the scientific reliability of the research. For the rare data missing, the study uses standardized methods and interpolation techniques to fill in and ensure the consistency of data.
We employed multi-source data for the study. (1) Land use remote sensing monitoring data were obtained from the Resource and Environmental Science Data Platform (https://www.resdc.cn/ (accessed on 10 February 2024)). These are mainly used to extract data on indicators like the area of various land types, green infrastructure, the landscape index, etc. (2) Remote sensing image data are mainly based on the Google Earth Engine (GEE) platform to realize the extraction of the full range of remote sensing index data. (3) The Statistical Yearbook comes from the National Statistical Office and focuses on data for social, economic, resource, and other indicators. (4) Study-derived data were obtained from the published literature and mainly used to calculate eco-indicator data, among other things. In order to ensure the consistency of the data’s time points, this study collected data and followed up with a time cross-section of 2020.
Based on the accumulation of previous research and the research results of others, this study divides the territorial space into three types of space (production space, living space, and ecological space) [3,10,31]. The evaluation indexes of territorial space use efficiency are shown in Table A1.

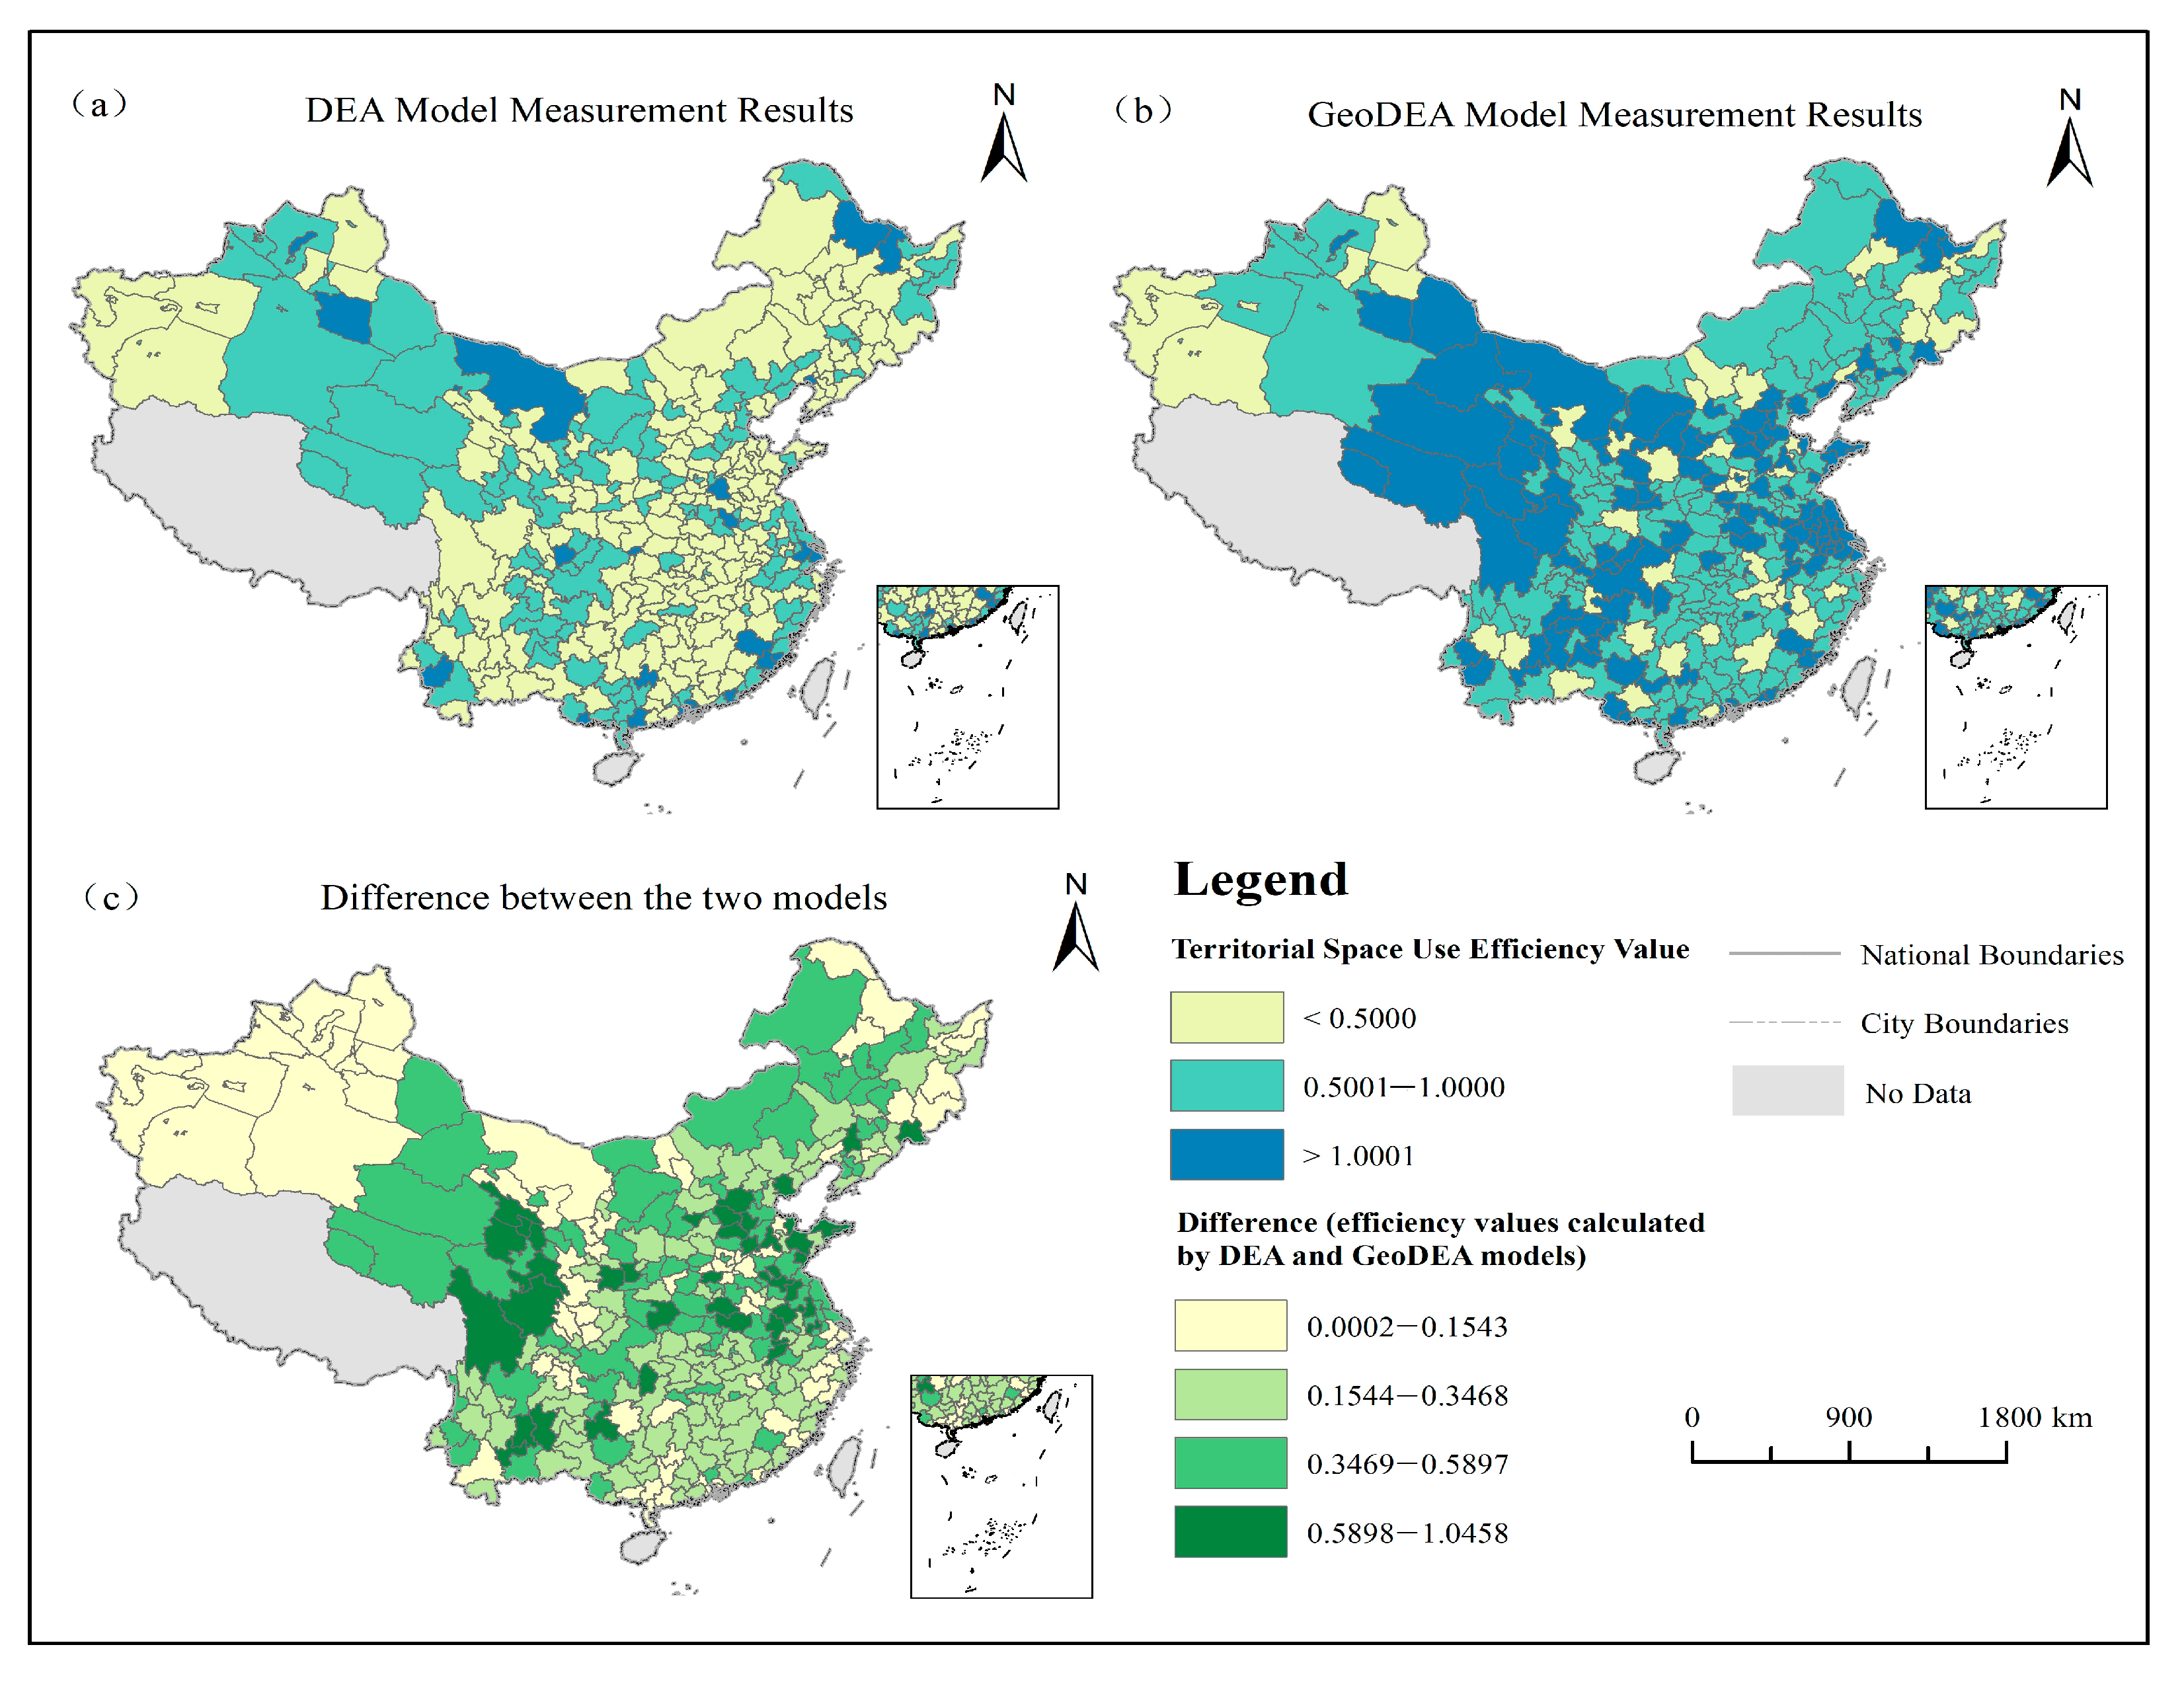
4.2. Differences in the Evaluation Results of the Two Models

This study evaluates the production space, living space, and ecological space use efficiency and total territorial space use efficiency of 340 cities in 2020 using the traditional DEA model and the GeoDEA model. According to data collection and evaluation index construction (Table A1), production space, living space, and ecological space use efficiency were directly evaluated using the model. The total territorial space use efficiency was calculated based on the weighted sum of production space, living space, and ecological space use efficiency, as shown in Formula (3). The weight is determined based on the entropy weight method. Firstly, production space, living space, and ecological space use efficiency in 340 cities is normalized, and then the weight is calculated according to Formulas (4)–(6) [61]. Production space, living space, and ecological space utilization efficiency are weighted at 0.4431, 0.4272, and 0.1297, respectively.
E = j n E j W j
p i j = r i j i = 1 m r i j
    e j = 1 ln m i = 1 m p i j × ln p i j
  W j = ( 1 e j ) j = 1 n ( 1 e j )
where E is the total territorial space use efficiency; E j refers to production space, living space, and ecological space use efficiency; W j is the entropy weight of the j space; n represents the total number of space types, which is 3; r i j is the standardization result of space ( j ) of object ( i ); p i j is the proportion of space ( j ) of object ( i ); m is the total number of objects, which is 340; and e j is the entropy value of the j space.
After comparative analysis, there is a significant difference between the GeoDEA model and the traditional DEA model in evaluating the territorial space use efficiency of 340 cities. The efficiency values evaluated using the traditional DEA model are relatively low. The range of efficiency values is mainly concentrated in <0.5000 and 0.5001–1.0000, which are mainly distributed in the northeast, central, and southern parts of the study area (Figure 5a). The range of efficiency values evaluated using the GeoDEA model is concentrated in 0.5001–1.0000 and >1.0001 (Figure 5b). This result is significantly different from the results of the traditional DEA model, and it is positive (Figure 5c). Cities with larger differences in territorial space use efficiency are mainly located in north China and southwest China (Figure 5c).

4.3. Match Between the Results of Efficiency Evaluations and the Actual State of Development

The study area contains a total of 340 cities, which is a large number. Considering the length of the article and the redundancy of the analysis, megalopolises and metropolises that are among the top in terms of society, economy, and population are selected for this study. The results of the GeoDEA model and the traditional DEA model are analyzed quantitatively and qualitatively. There are seven megalopolises and 14 metropolises included in the study area.
Analyzed from a qualitative perspective, the megalopolis is at the forefront of the country in a number of areas, including economic development, the human environment, scientific and technological progress, and ecological and environmental governance. They play an important leadership and demonstrative role. In light of the excellent performance of such cities on multiple dimensions, it can be surmised that they have a high probability of being at a moderately efficient level in terms of territorial space use efficiency. From a quantitative perspective, the differences between the efficiency evaluation results of the two models in Shanghai, Beijing, and Shenzhen are relatively small (Figure 6 and Table A2). The efficiency values of both model measures are around one, which is a moderately efficient level. The results are consistent with the qualitative understanding, which also confirms the validity and reasonableness of the GeoDEA model to some extent. However, in the case of living space use efficiency in Guangzhou, Chengdu, and Tianjin and production space use efficiency in Chongqing, the results of the two models differ significantly (Figure 6). The traditional DEA model evaluates the production space utilization efficiency of Chongqing at 0.1388 and the living space use efficiency of Guangzhou, Chengdu, and Tianjin at 0.0029, 0.0010, and 0.0002, respectively (Table A2). All of these efficiency values are at super inefficient levels and clearly do not fit the qualitative perception of these cities. In contrast, the efficiency results evaluated using the GeoDEA model are more reasonable. The evaluation result of this model for production space use efficiency in Chongqing is 1.0457. The evaluation results of living space use efficiency in Guangzhou, Chengdu, and Tianjin are 1.0027, 1.0264, and 0.5892, respectively (Table A2). The results are more in line with the qualitative perception of these cities.
The fourteen metropolises also have a certain leading and driving role in regional development. As such, the probability is that the territorial space use efficiency of these cities should be at the level of medium efficiency. Based on further analysis from a quantitative perspective, the difference between the results of the two models for Foshan, Nanjing, Harbin, and Dongguan is less than 0.45 (Figure 7 and Table A3). For production space use efficiency in Hangzhou and ecological space use efficiency in Foshan, the evaluation results of the two models are completely consistent. This further confirms the reliability and accuracy of the GeoDEA model in efficiency evaluation. However, the results of the traditional DEA model for evaluating living space use efficiency in Hangzhou, Jinan, Changsha, Zhengzhou, and Kunming were 0.0019, 0.0035, 0.0087, 0.0003, and 0.0092, respectively (Table A3). The ecological space use efficiency of Qingdao and Dalian is 0.1541 and 0.1465. All of these results are at the ultra-low efficiency level, which is clearly not in line with the qualitative perception of these cities. In contrast, the evaluation results of the GeoDEA model are more reasonable. The GeoDEA model evaluates the living space use efficiency of Hangzhou, Jinan, Changsha, Zhengzhou, and Kunming as 0.6293, 1.1213, 1.0143, 1.1093, and 1.0205, respectively (Table A3). The ecological space use efficiency of Qingdao and Dalian is 1.0793 and 1.0008, respectively (Table A3). These results prove that these cities are in an effective state of territorial space use efficiency. This is more in line with the qualitative view of these cities.

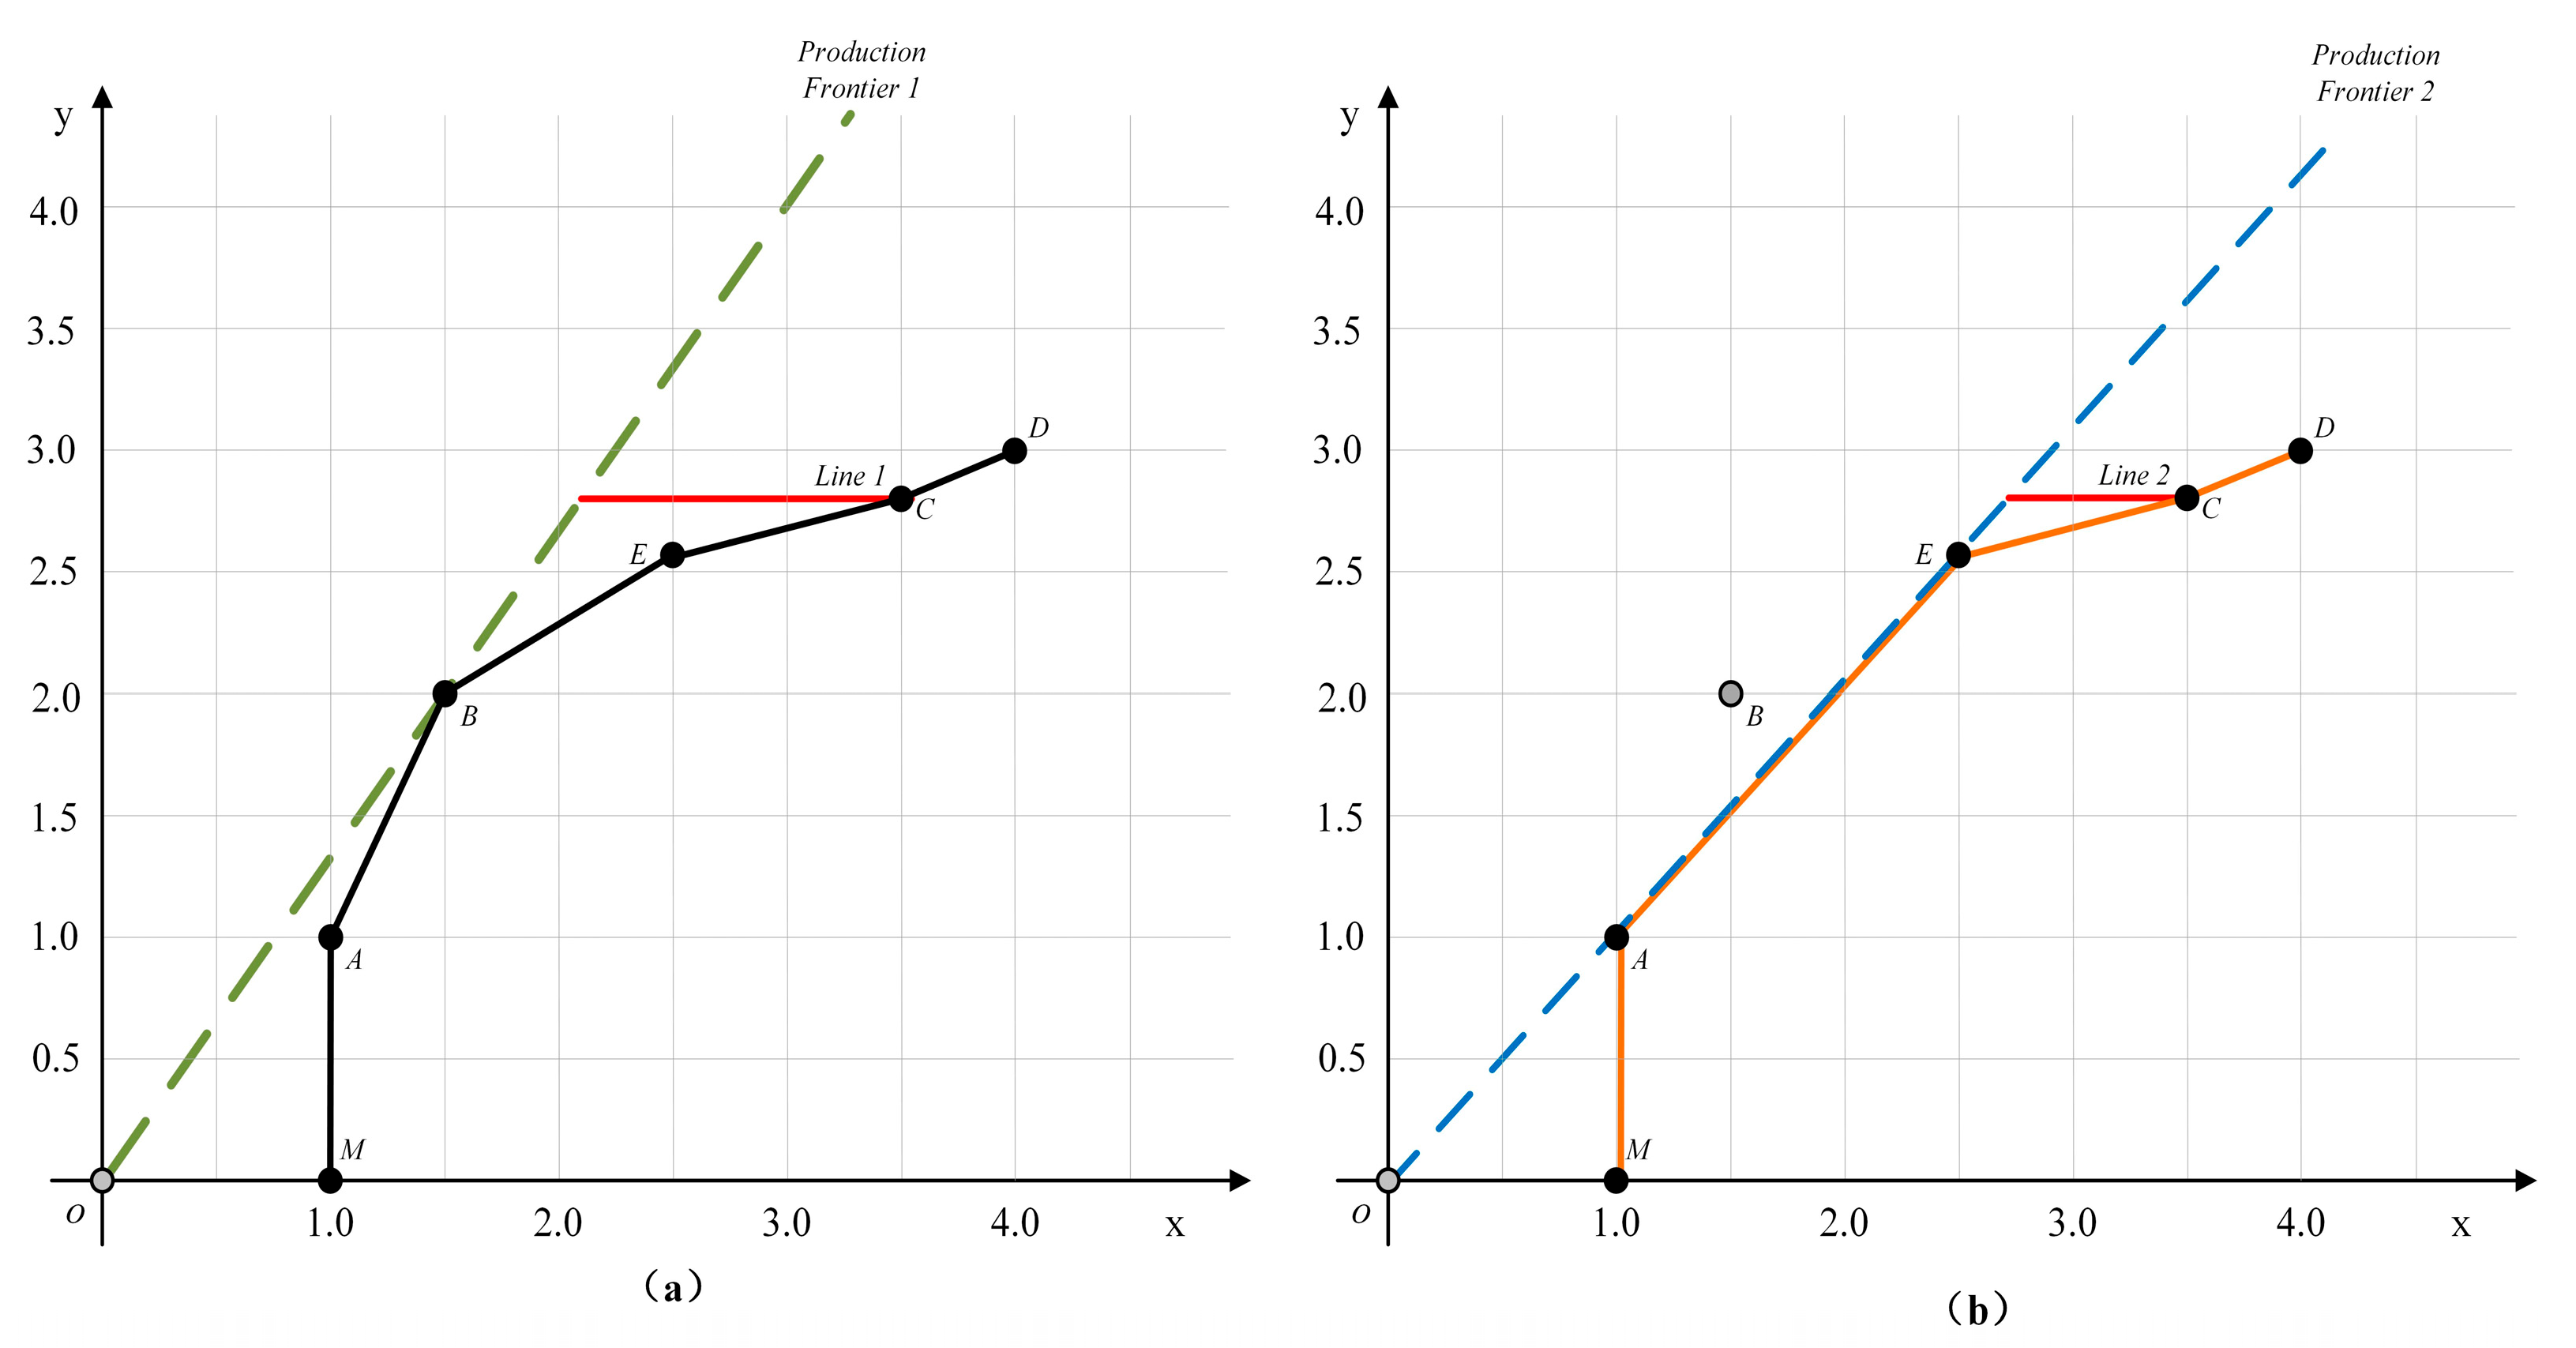
4.4. Rationalization of Reference Frontiers

As in Section 4.3, the module still focuses on the analysis of territorial space use efficiency in megalopolises and metropolises and explores the rationality of the reference frontier of the GeoDEA model. In conjunction with Section 4.3, the evaluation results of certain types of space use efficiency in selected cities are used to argument the reasonableness of the reference frontier.
For megalopolises, the results of living space use efficiency of Guangzhou, Chengdu, and Tianjin were selected for analysis, as shown in Table 1. The traditional DEA models include the Bortala Mongol Autonomous Prefecture in the reference frontier when evaluating living space use efficiency in Guangzhou, Chengdu, and Tianjin. Obviously, the reference to and comparison of the Bortala Mongol Autonomous Prefecture as an excellent unit lacks rationality and practical guidance. First, the three megalopolises are geographically distant from the Bortala Mongol Autonomous Prefecture, with significant differences in topography, geomorphology, and climatic conditions (Figure A1). Secondly, the megalopolises are all characterized by their large population size, developed economies, and strong scientific and technological innovation capabilities, which have led to their rapid socio-economic development. In contrast, the Bortala Mongol Autonomous Prefecture has a small population and a slowly increasing pace of economic development and urbanization. Third, the traditional DEA model outputs large non-radial nulls. It is clear that such a result deviates from common sense and basic knowledge, considering the actual state of development and the scale of resources invested in these cities. Comparing the results of the GeoDEA model, the cities on the reference frontier are geographically similar to the measured cities, and their economic development patterns and stages are also more similar. Therefore, it is more reasonable to choose them as reference objects. In addition, the results of the GeoDEA model show that the output non-radial nulls of the three megacities are smaller. Megalopolises are at the forefront of the country’s development patterns and stages. Their economic and industrial development has been relatively mature. Therefore, it is more reasonable that their output non-radial ineffectiveness is smaller.
The study selects the production space use efficiency of Wuhan, the living space use efficiency of Jinan, and the ecological space use efficiency of Shenyang to analyze in detail the reference frontier of metropolis efficiency evaluation, as shown in Table 2. It is worth noting that the results of the relevant reference frontier data for other metropolis subsets are consistent with the above. Because of space issues, we will not elaborate on each one. For the production space use efficiency of Wuhan, the reference frontier obtained from the traditional DEA model contains Chengdu, Luohe, Qingdao, Shenzhen, and Zhoushan. Wuhan, as a heavy industrial base in China, is also actively developing high-tech emerging technology industries. It is a metropolis integrating traditional and emerging industries. However, Chengdu focuses on modern services, manufacturing, and agriculture as its main economic pillars. Luohe mainly develops light industry. Qingdao relies mainly on the private and export economy. Shenzhen is mainly dependent on the export economy. Zhoushan, on the other hand, relies on fisheries, ports, and tourism as its main economic pillars. As a result, the development patterns and economic pillars of all cities on the reference frontier differ significantly from those of Wuhan. The reference frontier obtained from the GeoDEA model contains Hefei, Shanghai, Wuxi, Xuzhou, and Zhenjiang. Analyzed from the perspective of geographic location, all of the cities, except Xuzhou, are cities with a high level of development within the scope of the Yangtze River Economic Belt. There is a certain similarity with Wuhan. In addition, the economic pillars of Xuzhou are mainly heavy and light industries, and it is the center city of the Huaihai Economic Circle. It has some similarities with Wuhan’s economic development and regional status. To summarize, the GeoDEA model has a more scientific and reasonable reference frontier in measuring production space use efficiency in Wuhan.
For the living space use efficiency of Jinan, the reference frontier obtained from the traditional DEA model includes Beijing, the Bortala Mongol Autonomous Prefecture, Qingdao, Quanzhou, Shaoxing, and Urumqi. Among them, the Bortala Mongol Autonomous Prefecture and Urumqi have a temperate, continental, arid climate (Table 2). Quanzhou and Shaoxing have a subtropical, maritime, monsoon climate and a subtropical monsoon climate, respectively. However, Jinan has a temperate monsoon climate. There are differences in the habits, ways, and status of the public in different climates. Therefore, from the perspective of climatic conditions, Jinan and the cities on the reference frontier are more differentiated. The reference frontier obtained using the GeoDEA model includes Beijing, Langfang, and Tangshan. These three cities and Jinan all belong to the same climate type. They are geographically close and have similar habits, ways, and states of living. Thus, the reference frontier of the GeoDEA model for evaluating living space use efficiency in Jinan is more reasonable and scientific.
For the ecological space use efficiency of Shenyang, the reference frontier obtained from the traditional DEA model includes Baise, the Bortala Mongol Autonomous Prefecture, Hegang, Huaian, Huaibei, and Yangzhou (Table 2). Among them, the Bortala Autonomous Prefecture belongs to the northwestern cities, and Huaian, Huaibei, and Yangzhou belong to the southern cities. The ecological background environment and climatic conditions of these cities are all significantly different from those of Shenyang. They are also geographically distant from each other. The reference frontier obtained using the GeoDEA model includes Hegang, Jinzhou, Panjin, and Tianjin. With the exception of Tianjin, the other three cities all belong to the same Liaoning Province as Shenyang. Their ecological background state and climatic conditions are more similar and have greater references. It can be seen that the reference frontier of the GeoDEA model in measuring the ecological space use efficiency of Shenyang is more reasonable and scientific.
The rationality of reference frontiers is the core reason for the significant difference between GeoDEA and the traditional DEA model in the evaluation results of territorial space use efficiency in the same city. The traditional DEA model uses the common frontier of all DMUs for efficiency evaluation. Such frontiers are usually static and standardized, failing to fully account for heterogeneity across cities. Therefore, in some cities, their efficiency might be underestimated or overestimated when compared with cutting-edge standards that do not match their actual development environment. This phenomenon can be verified based on the output non-radial null (Table 1andTable 2). The output non-radial null value of the traditional DEA model is large, which indicates that the redundancy is high and that territorial space use efficiency is significantly underestimated. In contrast, the GeoDEA model classifies cities with similar development status into clusters for efficiency measurement. This significantly improves the rationality of the reference frontiers, thus achieving a more accurate assessment of territorial space use efficiency.

5. Discussion

5.1. Importance of Choosing the Appropriate Reference Set

The selection of an appropriate reference set is crucial to ensure the accuracy of the relative efficiency evaluation results [35,37,39]. There are significant differences in the geographical environment, natural endowments, and economic development status among all DMUs. The traditional DEA model takes all DMUs as the reference set. After complex planning calculation, some cities with lower development levels may be located on the reference front, so the efficiency of cities with higher development levels is underestimated. Conversely, it may also lead to some cities with higher development levels being located on the reference front, so the efficiency of cities with lower development levels is overestimated. Such unreasonable frontier construction can significantly reduce the accuracy of the efficiency measure. The GeoDEA model classifies DMUs by geography, natural endowments, and level of economic development to ensure that the state of DMUs within the same group is relatively consistent. This method effectively avoids the problem that the gap between the city on the reference front and the city being evaluated is too large. Thus, the accuracy and reliability of efficiency evaluation results are significantly improved [32,62]. As shown in Figure 8, if the reference set contains all DMUs (M, A, B, E, C, and D), then only DMU B is effective on the production frontier (Figure 8a). If the reference set contains DMUs M, A, E, C, and D, then both DMU A and DMU E are effective (Figure 8b). DMU C is ineffective in both reference sets. However, its input inefficiency is significantly different, with Line 2 being significantly smaller than Line 1. When DMUs M, A, E, C, and D are considered as the reference set, DMU C is not benchmarked against the optimal DMU B when its efficiency is measured. In this case, DMU C has less ineffective inputs and a larger relative efficiency value (Figure 8b). It also indicates that when benchmarking DMUs that are much better than itself, it may lead to obtaining low efficiency values. As in the model validation of this study, the traditional DEA model evaluates low territorial space use efficiency. In addition, DMU B is the best of all DMUs, but it may have insurmountable advantages over other DMUs in certain aspects. As a result, even if the DMU is in an ineffective state for the benchmarked DMU B, it may be efficient in its own dependent background environment. Therefore, when evaluating efficiency, it is necessary to choose the appropriate reference set according to the actual situation of the DMUs. The GeoDEA model is precisely designed with full consideration of the efficiency evaluation of such special DMUs with geospatial effects. The model will measure all DMUs participating in the efficiency evaluation according to relevant indicators and parameters in order to realize reasonable grouping. In turn, it determines the appropriate frontier surface in the efficiency evaluation process. Finally, the relative efficiency of DMUs and reasonable improvement values are determined.

5.2. Rationalization of the GeoDEA Model

In the framework of the construction and application of traditional DEA models, there are two core premises [11,12,34]. For one, it is assumed that individual DMUs are independent of each other in the efficiency evaluation process [11,63]. That is, there is no direct interaction or dependency between them [32]. Second, the model considers only the optimally performing DMUs as components of the efficiency frontier without introducing suboptimal solutions or a predefined standard line as a reference [34,63]. Together, these two premises form the theoretical cornerstone of the model. They are essential to ensure the validity and explanatory power of the model.
For specific DMUs with geospatial effects, it is not possible to adequately benchmark the two core assumptions of traditional DEA models [9]. First of all, such DMUs (e.g., territorial space) are uniquely characterized by geospatial effects, such as the spatial heterogeneity effect and the spatial scale effect. That distinguishes it from other types of decision making units, such as businesses, schools, hospitals, students, and employees. Specifically, spatial heterogeneity stems from the non-uniform distribution of the geographic background and natural resources, which significantly affects production and living and ecological activities [64]. This heterogeneity is reflected in many dimensions, like topography, precipitation, temperature, and resource distribution. It drives the similarity of the underlying geography between territorial spaces in close proximity. It also affects communication and interaction between territorial spaces to some extent. Ultimately, it profoundly shapes the distribution pattern of the territorial space. As well, the spatial scale effect can be interpreted as the formation of geospatial blocks characterized by patches through the clustering, radiation, and coordination of socio-economic activities [65]. These zones, such as urban agglomerations and economic belts, have enhanced the interdependence between territorial spaces and optimized the structure of space use. As a result, its unique geospatial effects have led to a variety of relationships among territorial spaces, including interdependence, mutual influence, and mutual support. Individuals are no longer uninvolved and independent. Furthermore, when studying the efficiency of DMUs with geospatial effects (e.g., territorial space), DMUs are more inclined to focus on those that are a certain distance away from them, have similar geographic background conditions, have better socio-economic development, and have a higher level of use efficiency. Instead, it is benchmarked against the optimal DMUs. It can be seen that it is crucial to choose a suitable benchmark unit. Therefore, there is some irrationality in directly applying the traditional DEA model to the efficiency study of DMUs with geospatial effects (e.g., territorial space).
In view of the above in-depth analysis of special DMUs (e.g., territorial space), this study relies on the spatially constrained multivariate clustering model to realize the reconstruction of the evaluation set and the reference set. The three conditions of spatial constraints and socio-economic and sample size constraints are considered comprehensively to realize the clustering of the territorial space. This clustering grouping fully takes into account the similarity of the spatial background geographic states of similar territories, as well as their socio-economic dependencies and interactions. The GeoDEA model was further validated by evaluating territorial space use efficiency. This model ensures similarity and comparability between the territorial space on the reference frontier and the measured territorial space in terms of geographic location, environmental conditions, social development, and economic progress. It ensures that the results of territorial space use efficiency evaluated using the GeoDEA model are more reliable. The feasibility of benchmarking the reference frontier for efficiency improvement is also guaranteed. It avoids the errors in efficiency values caused by large differences in geography, inconsistent stages of socio-economic development, and different policy orientations. It increases the feasibility of benchmarking suitable excellent units for efficiency improvement.

5.3. Limitations and Future Development of the Model

GeoDEA model is a cross-innovation combining various disciplines, such as geography, operations research, economics, and mathematics. However, the application validation and promotion of the model are still challenging at present. First, GeoDEA models also need to be validated with multi-perspective and multi-scale examples. Due to the problem of data acquisition and workload, this study only focuses on the territorial space use efficiency of 340 cities in China. The application and validation of the model are also realized only at the municipal scale. However, territorial space is a complex space with multiple scales and levels. Therefore, in the future, the model can be extended and applied to different scales, such as city cluster, city circle, province, county, and raster. The multi-scale and multi-level evaluation of territorial space use efficiency is further realized to verify the usability and robustness of the GeoDEA model. In addition, the comparative analysis with other spatial efficiency models (such as the spatial stochastic frontier analysis model, the spatial network DEA model, etc.) is also one of the focuses of future research. By comparing the GeoDEA model with other models, the advantages and applicability of the GeoDEA model can be evaluated more comprehensively, and room for improvement in different scenarios can be explored. On the other hand, the integration and commercialization of the model’s code are still in process. Currently, the understanding, the operation, and the model are still cumbersome. A more professional background and a priori knowledge are required if one wants to obtain perfect results using the GeoDEA model. Therefore, the model is not yet user-friendly enough for non-specialists. In the future, the model needs to move towards simplicity and integration. We plan to deep-couple the model or make it an easy-to-use toolkit so that it can be easily applied by researchers and government departments.

5.4. Suggestions for Improving Territorial Space Use Efficiency Based on Geospatial Effects

According to Figure 5, the spatial distribution of territorial space use efficiency at the city level in China does not show significant clustering characteristics. Municipalities with high, medium, and low efficiency coexist in each region. This precisely reflects the diversified pattern of urban development in China. Under similar geological, environmental, cultural, and policy backgrounds, there are significant differences in urban development, with both prosperous and lagging cases. In the face of this phenomenon, it is crucial to improve the efficiency of relatively lagging cities. In this regard, it is important to learn from the development experiences of neighboring cities that are geologically, environmentally, culturally, and policy-wise similar and more efficient. For example, successful experiences in production patterns, quality of life, and ecological environment construction are worth widely publicizing and practicing as an effective way to improve efficiency.

6. Conclusions

In this study, a GeoDEA model is constructed by coupling a spatially constrained multivariate clustering model with a generalized DEA model. The GeoDEA model reconstructs the evaluation set and the reference set on the basis of considering the geospatial effects among the DMUs (e.g., territorial space). The reference set and the evaluation set are both part of all of the evaluated DMUs, which is a kind of inclusion relationship. The reconfiguration also rationalizes the excellent units on the reference frontier. We have conducted model validation tests using 340 cities in China as case zones. The results show that the evaluation results of the GeoDEA model are more accurate and reliable than those of the traditional DEA model from the perspectives of matching of quantitative and qualitative results and the rationality of the reference frontier. The GeoDEA model shows high credibility and stability in evaluating territorial space use efficiency, which improves the accuracy of efficiency evaluation. Furthermore, research using the model we constructed found that the territorial space use efficiency at the city scale in China presents a diversified spatial pattern, and the spatial clustering feature is not obvious.
The impact of geospatial effects on efficiency is indeed a multidimensional and complex topic that involves the interaction of economic, social, and environmental dimensions. It involves many aspects, such as transportation cost, information circulation speed, labor market allocation, environmental carrying capacity, and policy intervention. Therefore, it requires us to analyze and consider territorial space use efficiency from multiple perspectives when evaluating it. The construction of the GeoDEA model in this study is a new attempt. It is also an initial exploration of the influence of geospatial effects on efficiency. In the future, we will continue to conduct in-depth research and application of the GeoDEA model. It will not only deepen our understanding of the relationship between geospatial effects and efficiency but also provide more scientific and precise support for policymaking, regional development planning, and sustainable development strategies.

Author Contributions

Conceptualization, Y.M. and Z.Z.; methodology, Y.M., M.Z., and X.Z. (Xinqi Zheng); validation, X.W., X.Z. (Xiaoyuan Zhang), and F.X.; formal analysis, X.W. and F.X.; investigation, Z.Z. and X.Z. (Xiaoyuan Zhang); resources, L.L.; data curation, Z.Z. and X.W.; writing—original draft preparation, M.Z. and Y.M.; writing—review and editing, Y.M. and M.Z.; visualization, L.L.; supervision, F.G. and J.W.; funding acquisition, X.Z. (Xinqi Zheng), L.L., and M.Z. All authors have read and agreed to the published version of the manuscript.

Funding

This research was funded by the National Natural Science Foundation of China (grant number: 42201471); the Beijing Social Science Foundation (grant number: 2022YJC264); the National Natural Science Foundation of China (grant number: 72033005); “Deep-time Digital Earth” Science and Technology Leading Talents Team Funds for the Central Universities for the Frontiers Science Center for Deep-time Digital Earth, China University of Geosciences (Beijing) (Fundamental Research Funds for the Central Universities; grant number: 2652023001); the Third Xinjiang Scientific Expedition of the Key Research and Development Program by the Ministry of Science and Technology of the People’s Republic of China (grant number: 2022xjkk1104); and the remote sensing survey and monitoring of island reefs in key areas of the South and East China Seas (research projects of the China Geological Survey, grant number: DD20230407).

Data Availability Statement

The data that support the findings of this study are available upon request from the corresponding author. The data are not publicly available due to privacy or ethical restrictions.

Conflicts of Interest

The authors declare no conflicts of interest.

Appendix A

Table A1. Indicator system for measuring production–living–ecological space use efficiency.
Type of SpaceInput/Output IndicatorsSpecific Indicators
Production SpaceInput indicatorsCultivated land area, built-up area, average number of urban non-private workers on the job, investment in fixed assets, total gas supply (gas, natural gas), and landscape pattern index
Output indicatorsGross regional product (GDP), GDP growth rate, share of secondary sector in GDP, patch multiplicity density, Shannon diversity, and industrial particulate emissions
Living SpaceInput indicatorsCore area of green infrastructure, number of practicing physicians, number of general secondary schools, number of full-time teachers in general higher education, number of cultural venues, expenditure on science and technology funds, total household liquid petroleum gas supply
Output indicatorsGross regional product per capita, total retail sales of consumer goods, natural growth rate, Shannon diversity index, domestic wastewater output, and core area of green infrastructure per capita
Ecological SpaceInput indicatorsGreen coverage of built-up areas, branching area and perforation area, total population, and total energy consumption
Output indicatorsGreen space per capita, ecological service value, Shannon’s uniformity index, dryness index, heat index, and separation index
Notes: At the landscape level, Shannon diversity is equal to the sum of the area ratios of each patch type after multiplying the natural logarithm of its value and taking the negative of the sum. Patch multiplicity density is the number of patches per unit area. The landscape pattern index is a measure of the complexity of the shape by calculating how much the shape of a patch in a region deviates from a circle or square of the same area. Shannon’s uniformity index equals the Shannon diversity index divided by the maximum possible diversity of a given landscape’s abundance. In this study, patch types are raster data patches of production space, living space, and ecological space. In addition, definitions, such as branch, perforation, and core, are definitions used in studies related to green infrastructure [66].
Table A2. Comparison of the results of the traditional DEA model and the GeoDEA model in the evaluation of territorial space use efficiency of seven megalopolises.
CityEfficiency TypeEvaluation Results of Traditional DEA ModelEvaluation Results of GeoDEA ModelDifference
ShanghaiProductive space use efficiency1.02811.13570.1076
Living space use efficiency1.03101.23360.2026
Ecological space use efficiency1.02131.07360.0523
Territorial space use total efficiency1.02841.16940.1410
BeijingProductive space use efficiency1.03041.13960.1092
Living space use efficiency1.08721.35280.2656
Ecological space use efficiency0.20070.32280.1221
Territorial space use total efficiency0.94711.12470.1776
ShenzhenProductive space use efficiency1.25761.26200.0044
Living space use efficiency1.38501.69450.3095
Ecological space use efficiency1.18931.33750.1482
Territorial space use total efficiency1.30321.45660.1534
ChongqingProductive space use efficiency0.13881.04570.9069
Living space use efficiency1.05441.13590.0815
Ecological space use efficiency0.80671.10260.2959
Territorial space use total efficiency0.61651.09160.4751
GuangzhouProductive space use efficiency1.00311.00800.0049
Living space use efficiency0.00291.00270.9998
Ecological space use efficiency0.73970.76950.0298
Territorial space use total efficiency0.54170.97480.4331
ChengduProductive space use efficiency1.16421.16450.0003
Living space use efficiency0.00101.02641.0254
Ecological space use efficiency0.69100.77260.0816
Territorial space use total efficiency0.60591.05470.4488
TianjinProductive space use efficiency1.00121.11980.1186
Living space use efficiency0.00020.58920.5890
Ecological space use efficiency1.02541.20480.1794
Territorial space use total efficiency0.57670.90410.3274
Table A3. Comparison of the results of the traditional DEA model and the GeoDEA model in the evaluation of territorial space use efficiency of fourteen metropolises.
CityEfficiency TypeEvaluation Results of Traditional DEA ModelEvaluation Results of GeoDEA ModelDifference
WuhanProductive space use efficiency0.39021.02720.6370
Living space use efficiency0.00060.10550.1049
Ecological space use efficiency0.69380.79500.1012
Territorial space use total efficiency0.26310.60330.3402
Xi’anProductive space use efficiency0.39611.11930.7232
Living space use efficiency1.00191.20130.1994
Ecological space use efficiency1.03771.42240.3847
Territorial space use total efficiency0.73811.19360.4555
HangzhouProductive space use efficiency1.08431.08430.0000
Living space use efficiency0.00190.62930.6274
Ecological space use efficiency0.85530.90710.0518
Territorial space use total efficiency0.59220.86690.2747
FoshanProductive space use efficiency1.00601.03950.0335
Living space use efficiency0.00030.07590.0756
Ecological space use efficiency1.00241.00240.0000
Territorial space use total efficiency0.57590.62300.0471
NanjingProductive space use efficiency0.56481.00610.4413
Living space use efficiency1.04361.13440.0908
Ecological space use efficiency1.00211.00660.0045
Territorial space use total efficiency0.82611.06100.2349
ShenyangProductive space use efficiency0.43951.03050.5910
Living space use efficiency0.00191.09931.0974
Ecological space use efficiency0.48310.68610.2030
Territorial space use total efficiency0.25821.01520.7570
QingdaoProductive space use efficiency1.01531.06510.0498
Living space use efficiency1.04761.23920.1916
Ecological space use efficiency0.15411.07930.9252
Territorial space use total efficiency0.91741.14130.2239
JinanProductive space use efficiency0.42071.04760.6269
Living space use efficiency0.00351.12131.1178
Ecological space use efficiency0.67850.88210.2036
Territorial space use total efficiency0.27591.05760.7817
ChangshaProductive space use efficiency1.02851.04910.0206
Living space use efficiency0.00871.01431.0056
Ecological space use efficiency0.62940.65330.0239
Territorial space use total efficiency0.54110.98290.4418
HarbinProductive space use efficiency0.11650.25570.1392
Living space use efficiency0.01550.23440.2189
Ecological space use efficiency0.94050.94990.0094
Territorial space use total efficiency0.18020.33660.1564
ZhengzhouProductive space use efficiency0.44941.07270.6233
Living space use efficiency0.00031.10931.1090
Ecological space use efficiency0.74561.04750.3019
Territorial space use total efficiency0.29601.08510.7891
KunmingProductive space use efficiency0.24981.06790.8181
Living space use efficiency0.00921.02051.0113
Ecological space use efficiency0.50061.00850.5079
Territorial space use total efficiency0.17951.04000.8605
DalianProductive space use efficiency1.02661.07680.0502
Living space use efficiency0.00120.13170.1305
Ecological space use efficiency0.14651.00080.8543
Territorial space use total efficiency0.47440.66320.1888
DongguanProductive space use efficiency1.09271.11420.0215
Living space use efficiency1.12771.15050.0228
Ecological space use efficiency1.04861.11360.0650
Territorial space use total efficiency1.10191.12970.0278

Appendix B

Figure A1. Spatial distribution of megalopolises and reference cities.
Land 14 00635 g0a1

References

  1. Hu, Q.; Shen, W.; Zhang, Z. How does urbanisation affect the evolution of territorial space composite function? Appl. Geogr. 2023, 155, 102976. [Google Scholar] [CrossRef]
  2. Peng, J.; Xu, D.; Xu, Z.; Tang, H.; Jiang, H.; Dong, J.; Liu, Y. Ten key issues for ecological restoration of territorial space. Natl. Sci. Rev. 2024, 11, nwae176. [Google Scholar] [CrossRef] [PubMed]
  3. Fu, J.; Bu, Z.; Jiang, D.; Lin, G.; Li, X. Sustainable land use diagnosis based on the perspective of production–living–ecological spaces in China. Land Use Policy 2022, 122, 106386. [Google Scholar] [CrossRef]
  4. O’Driscoll, C.; Crowley, F.; Doran, J.; McCarthy, N. Land-use mixing in Irish cities: Implications for sustainable development. Land Use Policy 2023, 128, 106615. [Google Scholar] [CrossRef]
  5. Zhang, H.; Song, Y.; Zhang, M.; Duan, Y. Land use efficiency and energy transition in Chinese cities: A cluster-frontier super-efficiency SBM-based analytical approach. Energy 2024, 304, 132049. [Google Scholar] [CrossRef]
  6. Ferreira, M.D.P.; Féres, J.G. Farm size and Land use efficiency in the Brazilian Amazon. Land Use Policy 2020, 99, 104901. [Google Scholar] [CrossRef]
  7. Koroso, N.H.; Lengoiboni, M.; Zevenbergen, J.A. Urbanization and urban land use efficiency: Evidence from regional and Addis Ababa satellite cities, Ethiopia. Habitat Int. 2021, 117, 102437. [Google Scholar] [CrossRef]
  8. Koroso, N.H.; Zevenbergen, J.A.; Lengoiboni, M. Urban land use efficiency in Ethiopia: An assessment of urban land use sustainability in Addis Ababa. Land Use Policy 2020, 99, 105081. [Google Scholar] [CrossRef]
  9. Ma, Y.; Zheng, M.; Zheng, X.; Huang, Y.; Xu, F.; Wang, X.; Liu, J.; Lv, Y.; Liu, W. Land Use Efficiency Assessment under Sustainable Development Goals: A Systematic Review. Land 2023, 12, 894. [Google Scholar] [CrossRef]
  10. Yu, J.; Zhou, K.; Yang, S. Land use efficiency and influencing factors of urban agglomerations in China. Land Use Policy 2019, 88, 104143. [Google Scholar] [CrossRef]
  11. Seipord, L.M. Data Envelopment Analysis The Evolution of the State of the Art (1978–1995). J. Product. Anal. 1996, 7, 99–137. [Google Scholar] [CrossRef]
  12. Liu, J.S.; Lu, L.Y.Y.; Lu, W.-M.; Lin, B.J.Y. Data envelopment analysis 1978–2010: A citation-based literature survey. Omega 2013, 41, 3–15. [Google Scholar] [CrossRef]
  13. Liu, Y.; Wang, K.; Xing, X.; Guo, H.; Zhang, W.; Luo, Q. On spatial effects in geographical analysis. Acta Geogr. Sin. 2023, 78, 517–531. [Google Scholar]
  14. Yu, H.C.; Fotheringham, A.S.; Li, Z.Q.; Oshan, T.; Kang, W.; Wolf, L.J. Inference in Multiscale Geographically Weighted Regression. Geogr. Anal. 2020, 52, 87–106. [Google Scholar] [CrossRef]
  15. Wang, X.; Liu, Y.; Zhang, J. Geo-Spatial Cognition:An Overview. Geogr. Geo-Inf. Sci. 2005, 21, 1–10. [Google Scholar]
  16. Fotheringham, A.S.; Yang, W.B.; Kang, W. Multiscale Geographically Weighted Regression (MGWR). Ann. Am. Assoc. Geogr. 2017, 107, 1247–1265. [Google Scholar] [CrossRef]
  17. Meng, Y.; Zhang, F.-R.; An, P.-L.; Dong, M.-L.; Wang, Z.-Y.; Zhao, T. Industrial land-use efficiency and planning in Shunyi, Beijing. Landsc. Urban Plan. 2008, 85, 40–48. [Google Scholar] [CrossRef]
  18. Chen, W.; Shen, Y.; Wang, Y.; Wu, Q. The effect of industrial relocation on industrial land use efficiency in China: A spatial econometrics approach. J. Clean. Prod. 2018, 205, 525–535. [Google Scholar] [CrossRef]
  19. Melchiorri, M.; Pesaresi, M.; Florczyk, A.J.; Corbane, C.; Kemper, T. Principles and Applications of the Global Human Settlement Layer as Baseline for the Land Use Efficiency Indicator—SDG 11.3.1. ISPRS Int. J. Geo-Inf. 2019, 8, 96. [Google Scholar] [CrossRef]
  20. Wang, Y.; Huang, C.; Feng, Y.; Gu, J. Evaluation of the Coordinated Relationship between Land Consumption Rate and Population Growth Rate in the Pearl River Delta based on the 2030 Sustainable Development Goals. Remote Sens. Technol. Appl. 2021, 36, 1168–1177. [Google Scholar]
  21. Holobâcă, I.-H.; Benedek, J.; Ursu, C.-D.; Alexe, M.; Temerdek-Ivan, K. Ratio of Land Consumption Rate to Population Growth Rate in the Major Metropolitan Areas of Romania. Remote Sens. 2022, 14, 6016. [Google Scholar] [CrossRef]
  22. Masini, E.; Tomao, A.; Barbati, A.; Corona, P.; Serra, P.; Salvati, L. Urban Growth, Land-use Efficiency and Local Socioeconomic Context: A Comparative Analysis of 417 Metropolitan Regions in Europe. Environ. Manag. 2018, 63, 322–337. [Google Scholar] [CrossRef] [PubMed]
  23. Liu, J.; Jin, X.; Xu, W.; Gu, Z.; Yang, X.; Ren, J.; Fan, Y.; Zhou, Y. A new framework of land use efficiency for the coordination among food, economy and ecology in regional development. Sci. Total Environ. 2020, 710, 135670. [Google Scholar] [CrossRef] [PubMed]
  24. Li, Q.; Wang, Y.; Chen, W.; Li, M.; Fang, X. Does improvement of industrial land use efficiency reduce PM2.5 pollution? Evidence from a spatiotemporal analysis of China. Ecol. Indic. 2021, 132, 108333. [Google Scholar] [CrossRef]
  25. Li, J.; Zhu, Y.; Liu, J.; Zhang, C.; Sang, X.; Zhong, Q. Parcel-level evaluation of urban land use efficiency based on multisource spatiotemporal data: A case study of Ningbo City, China. Trans. GIS 2021, 25, 2766–2790. [Google Scholar] [CrossRef]
  26. Wang, Y.; Liu, Y.; Zhou, G.; Ma, Z.; Sun, H.; Fu, H. Coordinated Relationship between Compactness and Land-Use Efficiency in Shrinking Cities: A Case Study of Northeast China. Land 2022, 11, 366. [Google Scholar] [CrossRef]
  27. Lu, S.; Wang, H. Market-oriented reform and land use efficiency: Evidence from a regression discontinuity design. Land Use Policy 2022, 115, 106006. [Google Scholar] [CrossRef]
  28. Zhang, X.; Jie, X.; Ning, S.; Wang, K.; Li, X. Coupling and coordinated development of urban land use economic efficiency and green manufacturing systems in the Chengdu-Chongqing Economic Circle. Sustain. Cities Soc. 2022, 85, 104012. [Google Scholar] [CrossRef]
  29. Song, Y.; Yeung, G.; Zhu, D.; Xu, Y.; Zhang, L. Efficiency of urban land use in China’s resource-based cities, 2000–2018. Land Use Policy 2022, 115, 106009. [Google Scholar] [CrossRef]
  30. Wang, K.; Li, G.; Liu, H. Does natural resources supervision improve construction land use efficiency: Evidence from China. J. Environ. Manag. 2021, 297, 113317. [Google Scholar] [CrossRef]
  31. Liu, S.-C.; Lin, Y.-B.; Ye, Y.-M.; Xiao, W. Spatial-temporal characteristics of industrial land use efficiency in provincial China based on a stochastic frontier production function approach. J. Clean. Prod. 2021, 295, 126432. [Google Scholar] [CrossRef]
  32. Emrouznejad, A.; Yang, G.L. A survey and analysis of the first 40 years of scholarly literature in DEA: 1978–2016. Socio-Econ. Plan. Sci. 2018, 61, 4–8. [Google Scholar] [CrossRef]
  33. Camanho, A.S.; Silva, M.C.; Piran, F.S.; Lacerda, D.P. A literature review of economic efficiency assessments using Data Envelopment Analysis. Eur. J. Oper. Res. 2023, 315, 1–18. [Google Scholar] [CrossRef]
  34. Kao, C. Network data envelopment analysis: A review. Eur. J. Oper. Res. 2014, 239, 1–16. [Google Scholar] [CrossRef]
  35. Wu, J.L.; Xie, W.X.; Sheng, Y.H. A Generalized Dea Model with Imprecise Data. J. Ind. Manag. Optim. 2024, 20, 2617–2639. [Google Scholar] [CrossRef]
  36. Zhou, Z.; Zhao, L.; Lui, S.; Ma, C. A generalized fuzzy DEA/AR performance assessment model. Math. Comput. Model. 2012, 55, 2117–2128. [Google Scholar] [CrossRef]
  37. Ma, S.Y.; Ma, Z.X.; Ji, R.M.T. Research on the Energy Consumption Efficiency Based on Generalized DEA Method with Cluster Analysis. In Proceedings of the 2nd International Conference on Energy and Environmental Protection (ICEEP 2013), Guilin, China, 19–21 April 2013; pp. 921–924. [Google Scholar]
  38. Azadi, M.; Jafarian, M.; Saen, R.F.; Mirhedayatian, S.M. A new fuzzy DEA model for evaluation of efficiency and effectiveness of suppliers in sustainable supply chain management context. Comput. Oper. Res. 2015, 54, 274–285. [Google Scholar] [CrossRef]
  39. Cook, W.D.; Tone, K.; Zhu, J. Data envelopment analysis: Prior to choosing a model. Omega 2014, 44, 1–4. [Google Scholar] [CrossRef]
  40. Zhang, Q.M.; Ning, L.X. The existence of equilibrium solution of the nonlinear dynamic input-output stochastic model. In Proceedings of the 4th World Congress on Intelligent Control and Automation, Shanghai, China, 10–14 June 2002; pp. 2236–2239. [Google Scholar]
  41. Su, B.; Ang, B.W. Multiplicative decomposition of aggregate carbon intensity change using input-output analysis. Appl. Energ. 2015, 154, 13–20. [Google Scholar] [CrossRef]
  42. Hubacek, K.; van den Bergh, J.C.J.M. Changing concepts of ‘land’ in economic theory: From single to multi-disciplinary approaches. Energ. Econ. 2006, 56, 5–27. [Google Scholar] [CrossRef]
  43. Xie, Y.; Eftelioglu, E.; Ali, R.; Tang, X.; Li, Y.; Doshi, R.; Shekhar, S. Transdisciplinary Foundations of Geospatial Data Science. ISPRS Int. J. Geo-Inf. 2017, 6, 395. [Google Scholar] [CrossRef]
  44. Dong, Y.; Jin, G.; Deng, X. Optimization of territorial space layout in China. J. Geogr. Sci. 2024, 34, 1719–1738. [Google Scholar] [CrossRef]
  45. Lee, S.K.; Mogi, G.; Hui, K.S. A fuzzy analytic hierarchy process (AHP)/data envelopment analysis (DEA) hybrid model for efficiently allocating energy R&D resources: In the case of energy technologies against high oil prices. Renew. Sust. Energ. Rev. 2013, 21, 347–355. [Google Scholar]
  46. Lessani, M.N.; Li, Z. SGWR: Similarity and geographically weighted regression. Int. J. Geogr. Inf. Sci. 2024, 38, 1232–1255. [Google Scholar] [CrossRef]
  47. Liu, J.; Wei, D.; Tian, Y.; Li, Q. Evolution and policy effect assessment for the spatial heterogeneity pattern of regional energy efficiency in China. Energ. Effic. 2021, 14, 83. [Google Scholar] [CrossRef]
  48. Ma, J.; Li, W.; Wang, Z.; He, L.; Han, L. Measuring Multi-Faceted Land Use Efficiency of Large-Scale Urban Agglomerations under Multi-Scale Drivers: Evidence from China. Land 2022, 11, 91. [Google Scholar] [CrossRef]
  49. Huang, Y.G.; Cao, L.B.; Zhang, J.; Pan, L.; Liu, Y.Y. Exploring Feature Coupling and Model Coupling for Image Source Identification. IEEE Trans. Inf. Forensics Secur. 2018, 13, 3108–3121. [Google Scholar] [CrossRef]
  50. Chin, Y.P.; Song, W.Y.; Islam, M.M.; Bates, D.W.; Zhou, L.; Li, Y.C. Sequential coupling of dry and wet COVID-19 screening to reduce the number of quarantined individuals. Comput. Meth. Prog. Bio 2022, 218, 106715. [Google Scholar]
  51. Karandikar, J.; Saleeby, K.; Feldhausen, T.; Kurfess, T.; Schmitz, T.; Smith, S. Evaluation of automated stability testing in machining through closed-loop control and Bayesian machine learning. Mech. Syst. Signal Process. 2022, 181, 109531. [Google Scholar] [CrossRef]
  52. Kannan, N.; Yeh, C.Y.C.; Chou, C.Y.; Chan, T.W. A Machine Learning Approach to Estimating Student Mastery by Predicting Feedback Request and Solving Time in Online Learning System. In Proceedings of the 29th International Conference on Computers in Education (ICCE), Electr Network, Virtual, 22–26 November 2021; pp. 241–250. [Google Scholar]
  53. Liao, M.Y.; Zhu, K.G.; Wang, G.S. Can human-machine feedback in a smart learning environment enhance learners’ learning performance? A meta-analysis. Front. Psychol. 2024, 14, 1288503. [Google Scholar] [CrossRef]
  54. Tandra, A.; Sakti, S.; Nakamura, S. Machine Speech Chain. IEEE/ACM Trans. Audio Speech Lang. Process. 2020, 28, 976–989. [Google Scholar] [CrossRef]
  55. Zha, Q.B.; Dong, Y.C.; Zhang, H.J.; Chiclana, F.; Herrera-Viedma, E. A Personalized Feedback Mechanism Based on Bounded Confidence Learning to Support Consensus Reaching in Group Decision Making. IEEE Trans. Syst. Man Cybern. Syst. 2021, 51, 3900–3910. [Google Scholar] [CrossRef]
  56. Wu, J.; Dai, L.F.; Chiclana, F.; Fujita, H.; Herrera-Viedma, E. A minimum adjustment cost feedback mechanism based consensus model for group decision making under social network with distributed linguistic trust. Inform. Fusion 2018, 41, 232–242. [Google Scholar] [CrossRef]
  57. Sisman, S.; Aydinoglu, A.C. Improving performance of mass real estate valuation through application of the dataset optimization and Spatially Constrained Multivariate Clustering Analysis. Land Use Policy 2022, 119, 106167. [Google Scholar] [CrossRef]
  58. Chen, L.R.; Guan, Q.F.; Xiong, Y.H.; Liang, J.Y.; Wang, Y.; Xu, Y.Q. A Spatially Constrained Multi-Autoencoder approach for multivariate geochemical anomaly recognition. Comput. Geosci. 2019, 125, 43–54. [Google Scholar] [CrossRef]
  59. Lee, H.S. An integrated model for SBM and Super-SBM DEA models. J. Oper. Res. Soc. 2021, 72, 1174–1182. [Google Scholar] [CrossRef]
  60. Li, H.; Shi, J.F. Energy efficiency analysis on Chinese industrial sectors: An improved Super-SBM model with undesirable outputs. J. Clean. Prod. 2014, 65, 97–107. [Google Scholar] [CrossRef]
  61. Zhao, D.; Li, C.; Wang, Q.; Yuan, J. Comprehensive evaluation of national electric power development based on cloud model and entropy method and TOPSIS: A case study in 11 countries. J. Clean. Prod. 2020, 277, 123190. [Google Scholar] [CrossRef]
  62. Kohl, S.; Schoenfelder, J.; Fügener, A.; Brunner, J.O. The use of Data Envelopment Analysis (DEA) in healthcare with a focus on hospitals. Health Care Manag. Sci. 2019, 22, 245–286. [Google Scholar] [CrossRef]
  63. Sueyoshi, T.; Yuan, Y.; Goto, M. A literature study for DEA applied to energy and environment. Energ. Econ. 2017, 62, 104–124. [Google Scholar] [CrossRef]
  64. Xu, P.P.; Huang, H.L. Modeling crash spatial heterogeneity: Random parameter versus geographically weighting. Accident. Anal. Prev. 2015, 75, 16–25. [Google Scholar] [CrossRef] [PubMed]
  65. Yang, X.D.; Li, H.L.; Zhang, J.Y.; Niu, S.Y.; Miao, M.M. Urban economic resilience within the Yangtze River Delta urban agglomeration: Exploring spatially correlated network and spatial heterogeneity. Sustain. Cities Soc. 2024, 103, 105270. [Google Scholar] [CrossRef]
  66. Ma, Y.; Zheng, X.Q.; Liu, M.L.; Liu, D.Y.; Ai, G.; Chen, X.Y. Spatio-temporal evolution characteristics analysis and optimization prediction of urban green infrastructure: A case study of Beijing, China. Sci. Rep. 2022, 12, 10702. [Google Scholar] [CrossRef] [PubMed]
Figure 1. Coupling and operational mechanisms of GeoDEA model.
Land 14 00635 g001
Figure 2. Evaluation set and reference set reconstruction based on spatially constrained multivariate clustering model.
Land 14 00635 g002
Figure 3. Comparative dimensions of GeoDEA model and traditional DEA model.
Land 14 00635 g003
Figure 4. Study area.
Land 14 00635 g004
Figure 5. Evaluation results and difference between DEA model and GeoDEA model of territorial space use efficiency.
Land 14 00635 g005
Figure 6. Difference value between the GeoDEA model and the traditional DEA model for evaluating territorial spatial use efficiency (megalopolis). (Notes: PS Use Efficiency: production space use efficiency; LS Use Efficiency: living space use efficiency; ES Use Efficiency: ecological space use efficiency).
Land 14 00635 g006
Figure 7. Difference value between the GeoDEA model and the traditional DEA model for evaluating territorial spatial use efficiency (metropolis). (Notes: Figure (a) contains difference value for seven metropolis: Jinan, Changsha, Harbin, Zhengzhou, Kunming, Dalian, Dongguan; Figure (b) contains difference value for seven metropolis: Wuhan, Xi’an, Hangzhou, Foshan, Nanjing, Shenyang, Qingdao; PS Use Efficiency: production space use efficiency; LS Use Efficiency: living space use efficiency; ES Use Efficiency: ecological space use efficiency).
Land 14 00635 g007
Figure 8. Schematic illustration of the different efficiencies of the same DMUs in different reference sets (Notes: M, A, B, E, C, and D represent different DMUs; Figure (a) represents the efficiency results when the reference set contains A, B, C, D, E and M; Figure (b) represents the efficiency results when the reference set contains A, C, D, E and M).
Land 14 00635 g008
Table 1. Comparison of efficiency measure reference frontier of the same decision unit under two different models (living space use efficiency in megalopolises).
Decision UnitDEA ModelLiving Space Use EfficiencyOutput Non-Radial NullReference Frontier
GuangzhouTraditional DEA model0.0029339.0343Bortala Mongolian Autonomous Prefecture (0.0594); Quanzhou (0.4126); Shanghai (0.1557); Shaoxing (0.0010); Shenzhen (0.4344); Chongqing (0.0689)
GeoDEA model1.0027−0.0027Dongguan (0.3918); Quanzhou (0.4517); Shenzhen (0.6019)
ChengduTraditional DEA model0.00101028.4464Bortala Mongol Autonomous Prefecture (0.3731); Nanjing (0.2110); Shanghai (0.1108); Chongqing (0.4084)
GeoDEA model1.0264−0.0258Dazhou (0.4715); Keramayi (0.1497); Chongqing (0.5200)
TianjinTraditional DEA model0.00024495.3649Bortala Mongol Autonomous Prefecture (0.8501); Shanghai (0.1832); Shaoxing (0.0329); Shenzhen (0.0626)
GeoDEA model0.58920.6972Beijing (0.1947); Cangzhou (0.8369); Tangshan (0.2896)
Table 2. Comparison of efficiency measure reference frontier of the same decision unit under two different models.
Decision UnitType of SpaceDEA ModelEfficiency ValueOutput Non-Radial NullReference Frontier
WuhanProduction space use efficiencyTraditional DEA model0.3902 1.5626 Chengdu (0.3200); Luohe (0.6121); Qingdao (0.1127); Shenzhen (0.2511); Zhoushan (0.4215)
GeoDEA model1.0272 −0.0265 Hefei (0.2457); Shanghai (0.1542); Wuxi (0.0678); Xuzhou (0.0539); Zhenjiang (0.8211)
JinanLiving space use efficiencyTraditional DEA model0.0035 280.8307 Beijing (0.0016); Bortala Mongol Autonomous Prefecture (0.0881); Qingdao (0.6862); Quanzhou (0.1270); Shaoxing (0.0412); Urumqi (0.1072)
GeoDEA model1.1213 −0.1082 Beijing (0.06889); Langfang (0.7631); Tangshan (0.3460)
ShenyangEcological space use efficiencyTraditional DEA model0.4831 1.0698 Baise (0.0843); Bortala Mongol Autonomous Prefecture (0.0001); Hegang (0.2089); Huaian (0.1640); Huaibei (0.3931); Yangzhou (0.0876)
GeoDEA model0.6861 0.4574 Hegang (0.2800); Jinzhou (0.0161); Panjin (0.1434); Tianjin (0.3480)
Disclaimer/Publisher’s Note: The statements, opinions and data contained in all publications are solely those of the individual author(s) and contributor(s) and not of MDPI and/or the editor(s). MDPI and/or the editor(s) disclaim responsibility for any injury to people or property resulting from any ideas, methods, instructions or products referred to in the content.

