Article

The Impact of New Urbanization on Urban Land Green Use Efficiency in the Middle and Lower Yellow River, China: An Analysis Based on Spatial Correlation Networks

1
School of Land Engineering, Chang’an University, Xi’an 710054, China
2
Shaanxi Key Laboratory of Land Consolidation, Xi’an 710054, China
*
Author to whom correspondence should be addressed.
Land 2025, 14(3), 625; https://doi.org/10.3390/land14030625
Submission received: 3 February 2025 / Revised: 8 March 2025 / Accepted: 14 March 2025 / Published: 15 March 2025

Abstract

:
Rapid urbanization has posed serious challenges to urban land use, especially in the green and efficient use of land. However, existing research rarely combines new urbanization with urban land green use efficiency (ULGUE), despite its significant importance for promoting regional sustainable development. To fill this gap, this study focused on 60 cities in the middle and lower Yellow River (MLYR) and integrated various methods such as undesired output super-efficiency SBM model, modified gravity model, centrality indexes, random forest, and geographically and temporally weighted regression model. The purpose of this study is to reveal the impact of multi-dimensional new urbanization and its spatial correlation network on ULGUE and the results revealed the following: (1) From 2001 to 2021, ULGUE and multi-dimensional new urbanization levels in the MLYR exhibited a significant upward trend and obvious regional differences. (2) There was a new urbanization spatial correlation network between cities in the MLYR, which was dense in the east and sparse in the west, and the balance of the network was gradually strengthened. Betweenness centrality and degree centrality improved, while closeness centrality declined. (3) The comprehensive system of multi-dimensional new urbanization and its spatial correlation exerted a complex influence on ULGUE. Ecological urbanization showed the strongest positive correlation with ULGUE. In contrast, social urbanization exhibited a relatively prominent negative correlation. This study provides policy recommendations for promoting the balanced development of new urbanization in the MLYR and improving the quality, efficiency, and sustainability of development in the Yellow River Basin, China.

1. Introduction

New urbanization is a people-centered process that simultaneously advances economic, social, and ecological aspects [1], aiming for urban–rural integration, resource efficiency, harmonious development, and ecological livability [2]. It involves the spatial reorganization of population and economic activities and has far-reaching significance for sustainable development between different regions and between urban and rural areas [3]. This process is usually accompanied by the expansion, development, structural optimization, and functional transformation of land resources [4]. However, due to the limited area of urban land, there will be a contradiction between people and land in the process of urbanization [5]. How to rationally plan urban development, promote new urbanization in an orderly manner, improve land use efficiency, and reduce the negative ecological environment effects has become an inevitable requirement for promoting regional coordination and high-quality development [6,7].
In recent years, the research on the relationship between urbanization and land use has gradually become a hotspot [8]. Scholars have carried out a lot of research on the impact of urbanization on land-intensive use [9], land multi-functional use [10], land use intensity [11], and the feedback effect of land use on urbanization [12]. These studies provide an important theoretical basis and practical guidance for optimizing the process of urbanization and improving land use efficiency. With the continuous advancement of urbanization and the strengthening of land resource management, as well as people’s attention to ecological civilization, the greenness and sustainability of land use in the process of new urbanization have received more and more attention [13].
Urban land green use efficiency (ULGUE) is based on traditional land use efficiency; considering the negative effects of land use on the environment; and achieving the greatest economic, social, and ecological benefits [14]. It is a comprehensive evaluation standard of land use effect in line with the current concept of ecological civilization, which can better reflect the rationality of land use structure [15]. In the process of new urbanization, the intensive and efficient use of land is the key factor to promote economic and social development and ULGUE is directly related to the quality and sustainability of new urbanization [16]. Therefore, the relationship between new urbanization and ULGUE is a topic worthy of discussion, although there are fewer studies that combine them now. In addition, urbanization in different regions does not develop independently but is influenced by and interacts with surrounding regions, forming spatial correlation networks [17]. Existing research has shown that the formation and development of urban spatial correlation are linked to regional carbon emission intensity [18], human wellbeing [19], and ecosystem services [20] through mechanisms such as spatial spillover effects. However, studies on the coupling between spatial correlation networks and land use efficiency remain relatively scarce.
The contradiction between people and land in the process of new urbanization development requires the improvement of land use efficiency, and the improvement of land use efficiency also helps to promote the improvement of urbanization level [21]. Both share the ultimate goal of achieving high-quality regional development [22]. This paper aims to systematically integrate new urbanization and ULGUE through multidisciplinary methods and models. By exploring the impact of new urbanization and its spatial correlation networks on ULGUE, this study will provide significant insights into promoting the coordination of regional human-land systems.
Ecological protection and high-quality development of the Yellow River Basin is China’s major strategic task [23]. The middle and lower Yellow River (MLYR) is the area with the most intensive land, the highest urbanization rate, the most concentrated population, and the most intensive industries in the Yellow River Basin [24]. This study takes the 60 cities in the MLYR as the research object, and aims to (1) calculate ULGUE based on input, expected output, and undesired output; (2) assess the level of new urbanization in the five dimensions of population, economy, society, ecology, and integrated urban and rural development, and analyze the spatial and temporal evolution pattern of its spatial correlation network; (3) analyze the influence of multi-dimensional new urbanization and its spatial correlation network on ULGUE. The findings can promote the balanced development of new urbanization in the MLYR, enhance regional collaboration, alleviate human-land conflicts, improve land use efficiency, and contribute to the high-quality development of the Yellow River Basin.

2. Materials and Methods
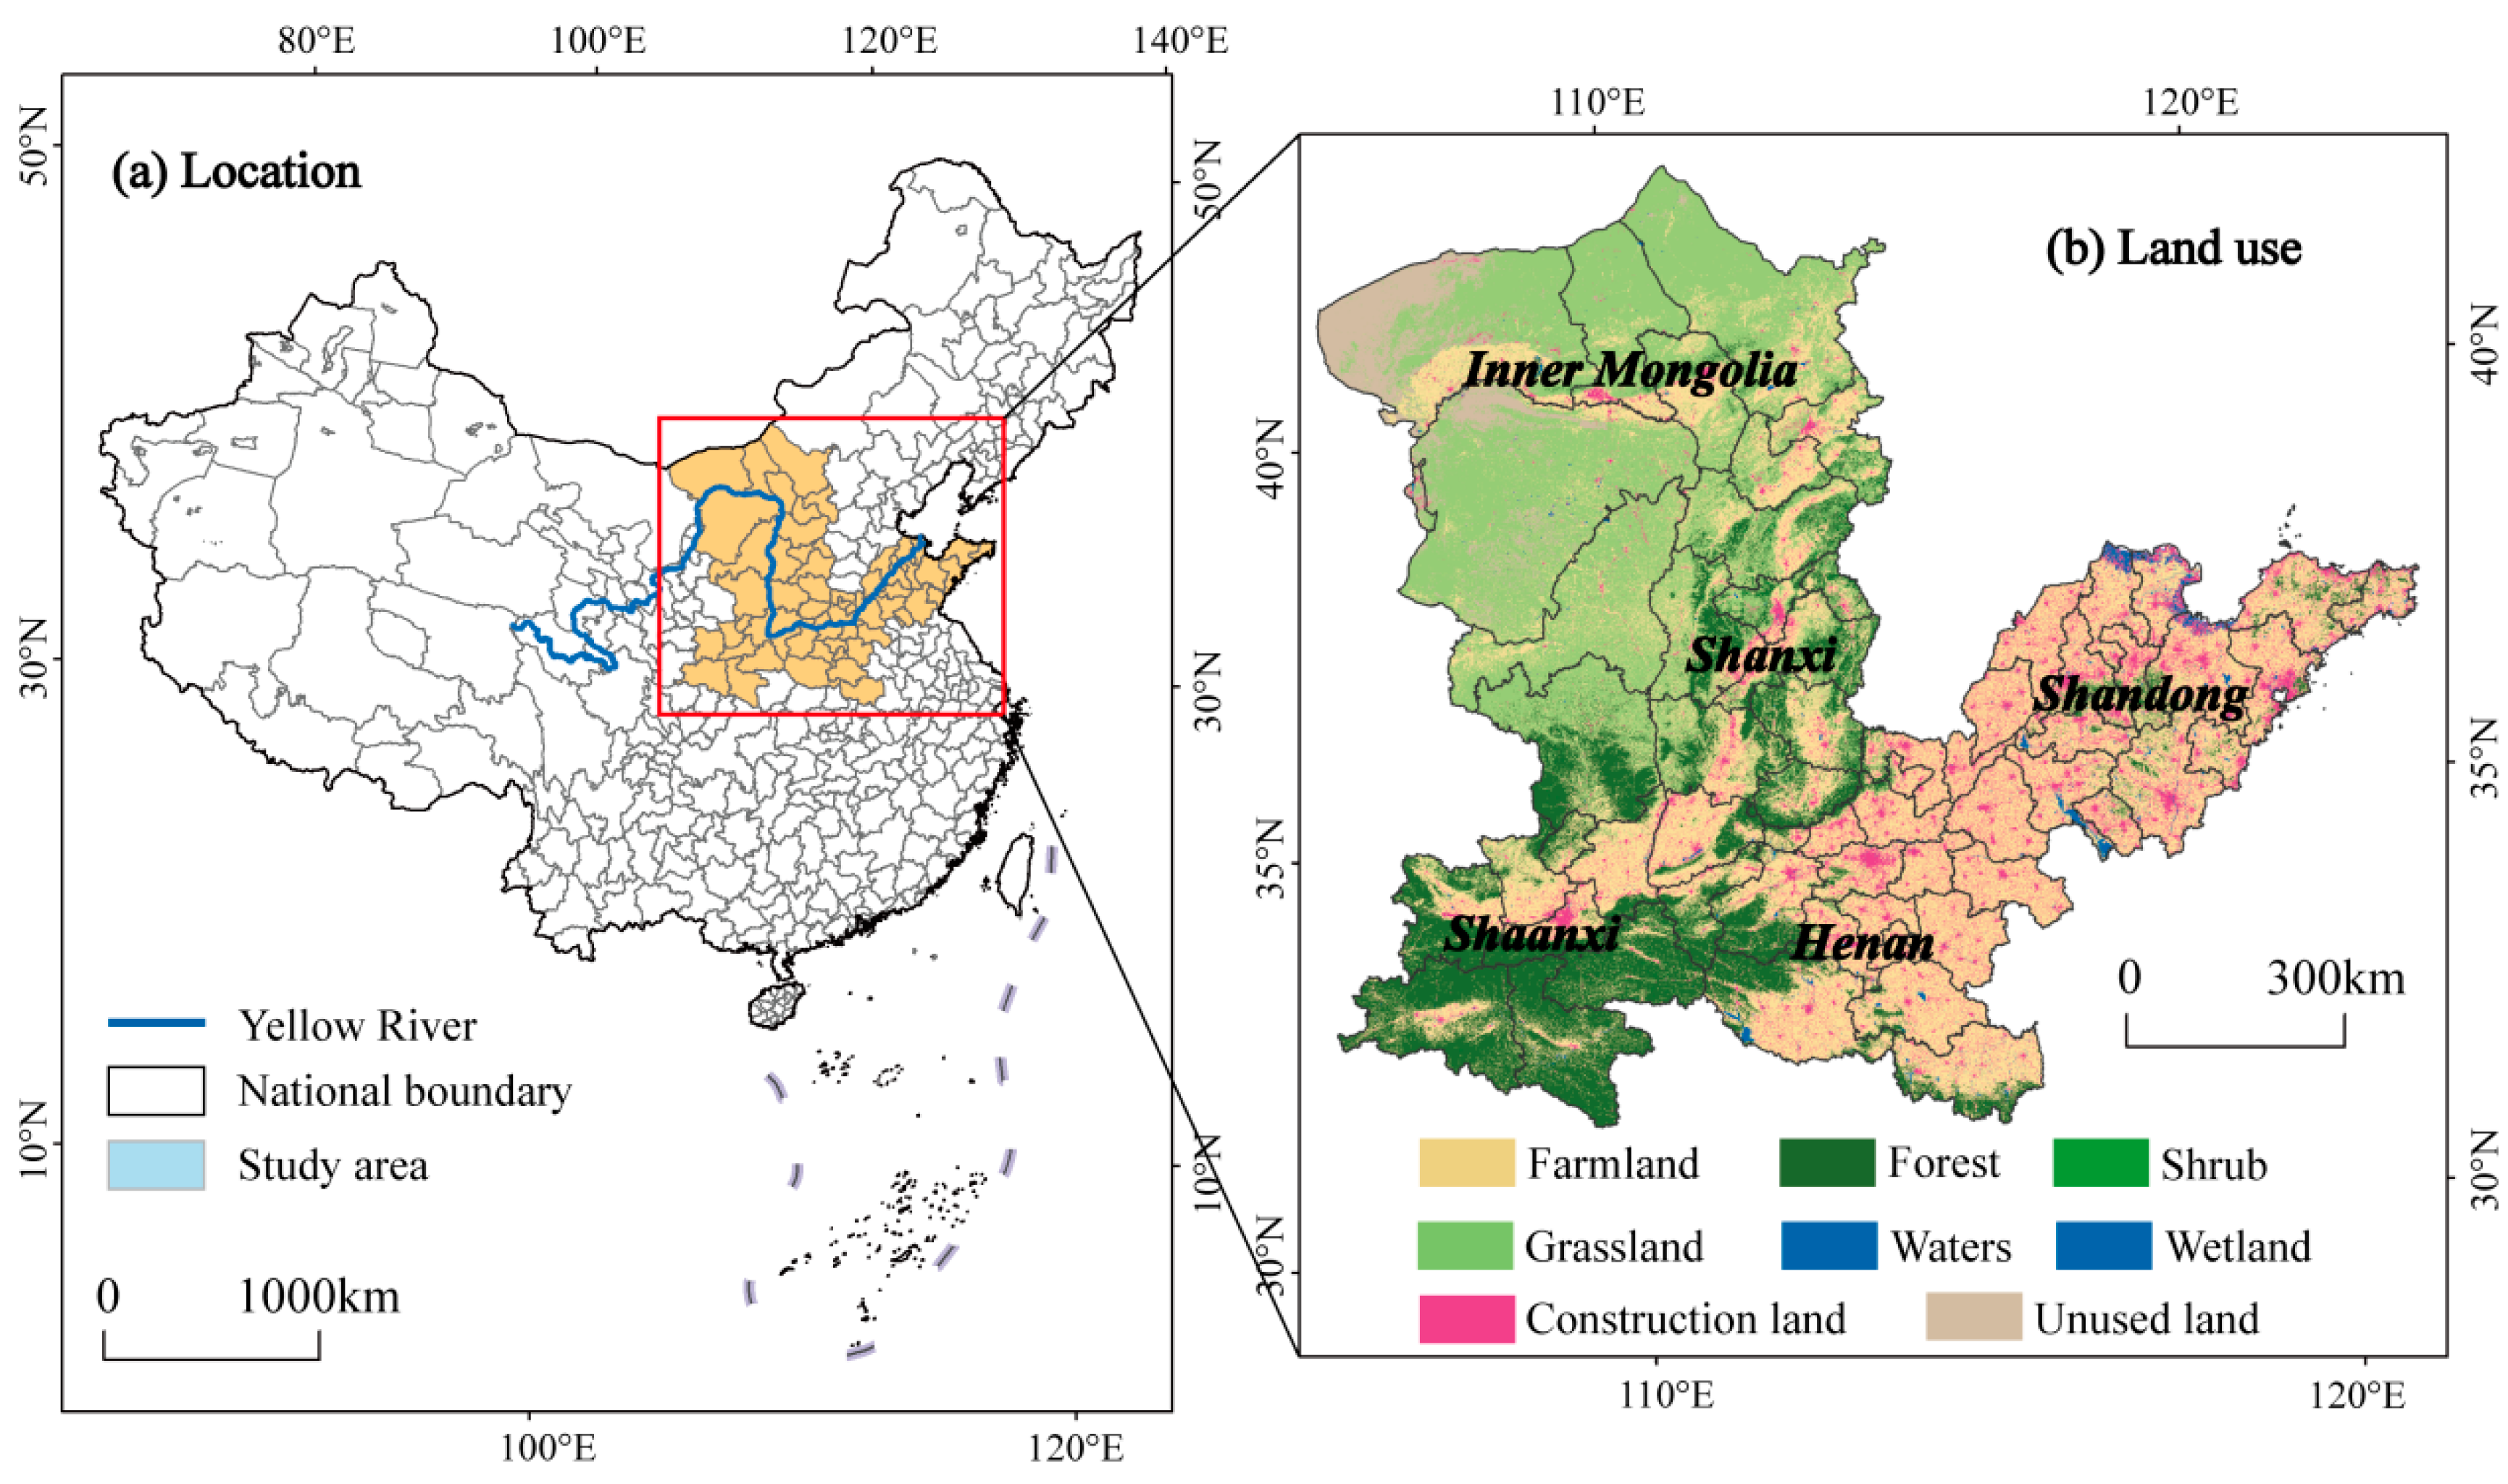
2.1. Study Area

The MLYR refers to the river section below Hekou Town, Inner Mongolia, with a total length of 1992.40 km, including five provinces: Inner Mongolia, Shaanxi, Shanxi, Henan, and Shandong. Considering that the eastern cities of Inner Mongolia are mainly spatially associated with Northeast China and less associated with the Yellow River Basin, the study area is identified as the remaining 60 cities (Figure 1a). The east–west length of the study area is about 1617 km, the north–south span is 1321 km, and the total area is 937,900 km2, accounting for about 9.77% of the total area of China.
The terrain of the MLYR is high in the northwest and low in the southeast, including the Loess Plateau, Inner Mongolia Plateau, Taihang Mountains, Lvliang Mountains, and large plains located in Shandong and Henan. The farmland, grassland, forest, and construction land account for a large proportion, accounting for 38.63%, 29.66%, 18.61%, and 8.09%, respectively (Figure 1b). The MLYR is an important agricultural area and an industrial and energy power base in China, and it has significant advantages in geographical location and socio-economic characteristics. With the ecological protection and high-quality development of the Yellow River Basin rising to a national strategy, MLYR is actively formulating corresponding development strategies to promote regional development efficiency, quality, and sustainability [25].

2.2. Data Sources and Processing

The data used in this study were mainly derived from the China Statistical Yearbook, China Urban Statistical Yearbook, China Urban and Rural Construction Statistical Yearbook, China Environmental Statistical Yearbook, and the statistical yearbooks of Inner Mongolia, Shaanxi, Shanxi, Henan, and Shandong, covering the period from 2001 to 2021. The vector file of the administrative region boundary came from the Resource and Environment Science and Data Center, Chinese Academy of Sciences (https://www.resdc.cn/), accessed on 21 November 2024.
For missing data, linear interpolation was used to estimate missing values for consecutive years, while trend extrapolation based on time series was applied to fill gaps in non-consecutive years, ensuring data completeness and continuity. Additionally, the 3-sigma rule was applied to identify outliers and the Winsorization method was used to replace extreme values with the upper and lower limits of the data distribution.

2.3. Research Framework and Methods

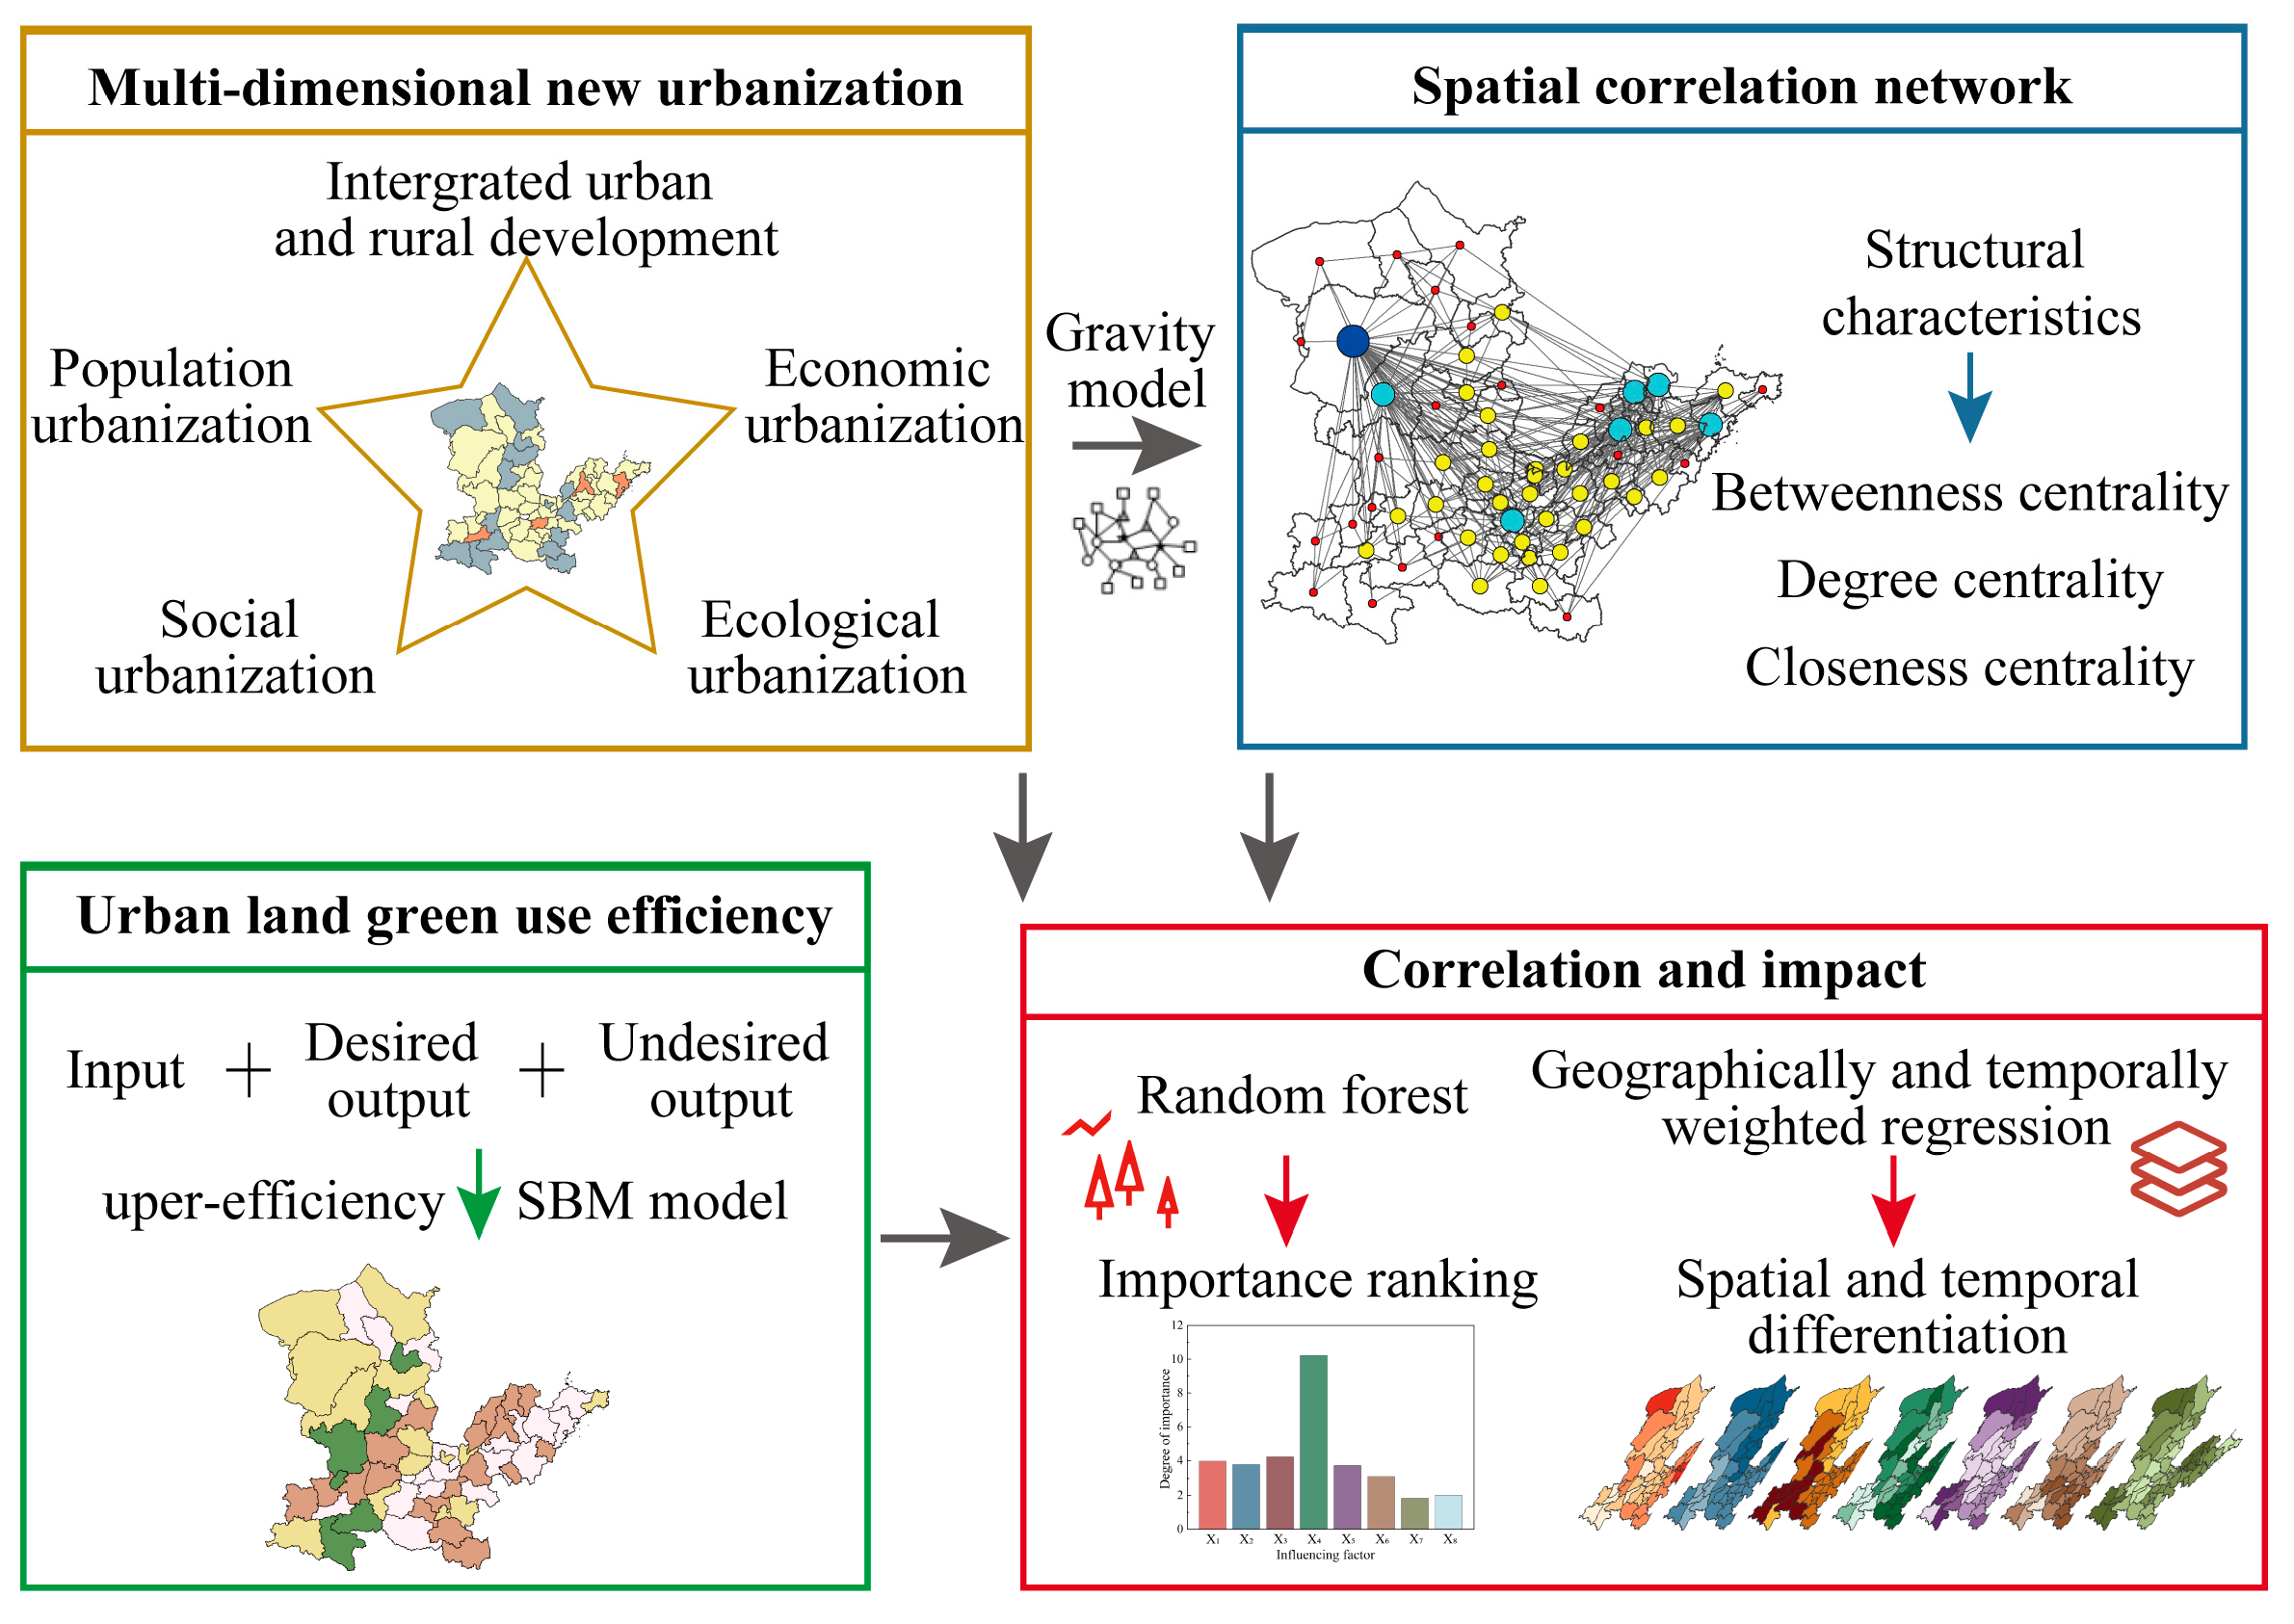
2.3.1. Research Framework

The research framework is shown in Figure 2. Firstly, the undesired output super-efficiency SBM model and the entropy weight method were employed to assess ULGUE and the new urbanization level in the MLYR, respectively. Subsequently, spatial correlation networks were constructed utilizing the gravity model, and the characteristics of the network were analyzed in conjunction with various centrality metrics. Following this, the impact of new urbanization on ULGUE was examined through the application of the random forest algorithm and the geographically and temporally weighted regression (GTWR) model, culminating in the proposal of pertinent recommendations.

2.3.2. Assessment of ULGUE

Considering that land use is a complex system, the undesired output super-efficiency SBM model was used to measure the ULGUE in the MLYR. Compared to the traditional Data Envelopment Analysis (DEA) model, this model takes into account slack variables and can effectively handle both desired and undesired outputs, making it more suitable for measuring efficiency under ecological and environmental constraints [26]. In terms of input, indicators were mainly selected from the three perspectives of land, capital, and labor. The input of these three elements is crucial for the quality and efficiency of regional development; in terms of desired output, it mainly includes three dimensions: economic, social, and ecological. The output value of secondary and tertiary industries, employee wages, and green coverage rate can, respectively, reflect these three aspects; in terms of undesired output, it is mainly characterized by the negative effect of the ecological environment, with the most direct manifestation being the emission of various pollutants (Table 1). The calculation formulas are as follows:
min ρ = 1 m i = 1 m x ¯ x i k 1 r 1 + r 2 ( s = 1 r 1 y d ¯ y s k d + q = 1 r 2 y u ¯ y q k u )
x ¯ j = 1 , k n ( x i j λ j ) ; y d ¯ j = 1 , k n ( y s j d λ j ) y d ¯ j = 1 , k n ( y q j d λ j ) ; x ¯ x k y d ¯ y k d ; y u ¯ y k u λ j 0 , i = 1 , 2 , , m ; j = 1 , 2 , , n ; s = 1 , 2 , , r 1 ; q = 1 , 2 , , r 2 ;
where   ρ is the ULGUE of each city; n is the number of decision units; m is the number of input factors; r 1 and r 2 are the number of desired outputs and undesired outputs, respectively; i, s, and q are the elements in the input, desired output, and undesired output, respectively; x is the input indicator; x i k is the element in the input matrix of the decision unit k; y d is the desired indicator; y s k d is the element in the desired matrix of the decision unit k; y u is the undesired indicator; y q k u is the element in the undesired matrix of the decision unit k; and λ j is the weight vector.

2.3.3. Measurement of New Urbanization

New urbanization refers to a high-quality urbanization model that achieves integrated urban–rural development by optimizing economic structures, improving the ecological environment, and promoting social equity during the process of population urbanization [1]. Therefore, it can be understood as a complex system, including population, environment, public services, economy, social governance, and other aspects, which needs to be evaluated from a comprehensive perspective. Therefore, referring to relevant research [27,28,29,30], this study constructed the index system according to the principles of objectivity, representativeness, and data comprehensiveness. From the five dimensions of population urbanization, economic urbanization, social urbanization, ecological urbanization, and integrated urban and rural development, 16 indicators were selected.
Specifically, the three indicators in the population urbanization dimension directly reflect urbanization progress, population concentration, and labor employment structure, capturing the core characteristics of urbanization. The four indicators in the economic urbanization dimension measure economic development level, industrial structure, residents’ income, and infrastructure investment, reflecting the economic driving force of urbanization. The four indicators in the social urbanization dimension comprehensively reflect the social benefits of urbanization from the perspectives of education, healthcare, consumption, and infrastructure. The three indicators in the ecological urbanization dimension reflect the coordination between urbanization and ecological protection by focusing on increasing green spaces and reducing pollution. The two indicators in the integrated urban and rural development dimension assess the development gap between urban and rural areas by comparing the income and consumption levels of urban and rural residents.
The entropy weight method was used to calculate the index weight. This method can calculate the weight according to the situation of the index itself and effectively avoid the deviation caused by subjective weighting. The calculation formula is as follows:
y i j = x i j min x 1 j , x 2 j , , x n j max x 1 j , x 2 j , , x n j min x 1 j , x 2 j , , x n j + 0.0001 ,   x i j   i s   p o s i t i v e
y i j = max x 1 j , x 2 j , , x n j x i j max x 1 j , x 2 j , , x n j min x 1 j , x 2 j , , x n j + 0.0001 ,   x i j   is   negative
P i j = y i j i = 1 n y i j
e j = k i n P i j ln P i j , k = 1 ln n ( k > 0 )
W j = 1 e j j = 1 m 1 e j
F i = j = 1 m W j · y i j
where i is the city number; i = 1 , 2 , , n ; j is the index number; j = 1 , 2 , , m ; x i j is the original value of the index j of element i ; y i j is the standardized value of the index j of unit i ; P i j is the characteristic proportion of unit i index j ; e j is the information entropy value of index j ; and W j is the weight of the index j . The weight results of each index are shown in Table 2. F i is the new urbanization level of unit i .

2.3.4. Spatial Correlation Network Analysis

The gravity model modified by per capita GDP was used to construct the spatial correlation network of new urbanization. This method can balance the influence of economic distance and geographical distance on the intensity of spatial interaction. This adjustment ensured that cities with higher per capita GDP could still have a strong impact on spatial interaction even in the case of longer geographical distances. Therefore, the modified gravity model not only considered geographical proximity but also integrated economic proximity, which provided a more comprehensive measure for the spatial correlation of new urbanization [31]. The calculation formula is as follows:
F i j = k i j × U i × U j D i j / g i g j 2 ,   k i j = U i U i + U j
where F i j is the degree of spatial correlation between city i and city j; k i j is the gravity coefficient; U i and U j are the new urbanization level of city i and city j; D i j is the geospatial distance between city i and city j; and g i and g j are the per capita GDP of city i and city j, respectively.
Then, the structural characteristics of each city unit in the network were characterized by indexes such as betweenness centrality, degree centrality, and closeness centrality. Betweenness centrality assesses the “bridge” role of a city in the new urbanization network. For instance, if a city is a key transfer point for transfer and cooperation between multiple urban agglomerations, it has a high betweenness centrality, playing a crucial role in coordinating urban development [32]. Degree centrality can represent the connection between a city and other cities in the spatial correlation network. A higher degree centrality indicates a stronger direct connectivity in the urban network, which is conducive to the flow of people, resources, and information. These cities are more likely to benefit from economies of scale and agglomeration effects, driving regional economic growth. Closeness centrality reflects the degree to which a city is independent and not controlled by other cities. In the network, a city with high closeness centrality acts as a central actor, being able to efficiently access resources and opportunities without relying heavily on intermediaries, and playing a crucial role in promoting the overall operation and development of the network [33].
C R B = 2 j = 1 N k = 1 N b j k ( i ) / ( N 2 3 N + 2 )
b j k ( i ) = g j k ( i ) / g j k
C R D = n / ( N 1 )
C A P = j = 1 n d i j / ( N 1 )
where C R B , C R D , and C A P are the betweenness centrality, degree centrality, and closeness centrality, respectively; N is the total number of nodes in the new urbanization spatial association network; g j k ( i ) is the number of shortcuts through city i and connecting city j and city k; g j k is the total number of shortcuts between city j and city k; b j k ( i ) is the probability that city i is located on the shortcut between city j and city k; n is the number of other cities connected to a city in the spatial association network; and d i j is the shortcut distance between city i and city j.

2.3.5. Influencing Factors Analysis

The effects of new urbanization and its spatial correlation network on ULGUE were judged by random forest [34] and the GTWR model [35]. By randomly selecting samples and classifying and integrating them, random forest can rank the importance of each subsystem of new urbanization and its spatial correlation characteristics on the impact of ULGUE. Compared to traditional regression models or structural equation modeling (SEM), random forest can flexibly handle multidimensional and nonlinear data. Although this method cannot directly test causal relationships, it can provide a ranking of the importance of each factor’s impact on ULGUE, which can serve as a foundation for subsequent spatial analysis [36]. The hyperparameters were tuned using grid search combined with five-fold cross-validation, including the number of trees (n_estimators), maximum depth (max_depth), and minimum samples per leaf (min_samples_leaf), to ensure the robustness of the model.
There are numerous models capable of further analyzing spatial heterogeneity. In this study, we employed the Ordinary Least Squares (OLS) model, the Geographically Weighted Regression (GWR) model, and the GTWR model for computation and comparison [37]. The results (Table 3) demonstrated that the GTWR model exhibited a higher R2 value, indicating stronger explanatory power; a smaller residual sum of squares, suggesting reduced prediction error; and a lower AIC value, reflecting superior fitting performance.
Therefore, this study utilized the GTWR model to analyze the spatiotemporal heterogeneity of the impacts of various influencing factors on ULGUE. In the application of this model, the optimal bandwidth was determined by minimizing the Akaike Information Criterion (AIC). This method automatically adjusts the bandwidth based on the local characteristics of the data, ensuring that the model achieves good fitting performance across different regions. Additionally, the statistical significance of the regression coefficients was tested. If p < 0.05, the impact of the factor on ULGUE is considered statistically significant [38]. The calculation formula is as follows:
Y i = β 0 u i , v i , t i + k = 1 p ( β k u i , v i , t i X i k ) + ε i
where Y i is ULGUE; X is the new urbanization subsystem and its spatial correlation network characteristics; i is the sample area; u , v , and t are the longitude, latitude, and time of the sample area, respectively; β 0 u i , v i , t i is the intercept; β k ( u i , v i , t i ) is the regression coefficient of the influence of the driving factor k on ULGUE; k   is the serial number of the influencing factors; and p is the number of influencing factors.

3. Results

3.1. ULGUE in the MLYR

ULGUE was divided into four categories by the quartile method: low efficiency, lower efficiency, higher efficiency, and high efficiency. From the perspective of space (Figure 3a), ULGUE in the middle reaches was higher than that in the lower reaches.
The low-efficiency and lower-efficiency cities were mainly distributed in Henan Province and Shandong Province, as well as the Guanzhong Plain, showing a banded distribution along the Yellow River. The high-efficiency and higher-efficiency cities were mainly concentrated in the southern and northern parts of Shaanxi Province and the western part of the Inner Mongolia Autonomous Region. From the perspective of time (Figure 3b), ULGUE in the MLYR showed an overall upward trend, with the average value rising from 0.5128 in 2001 to 0.8561 in 2021. From 2001 to 2021, the number of low-efficiency and lower-efficiency cities decreased from 44 to 11, and the number of high-efficiency and higher-efficiency cities increased from 16 to 49. The years 2005, 2008, and 2015 were the ones with obvious changes in ULGUE, so this will be the time node division stage later.

3.2. Multi-Dimensional New Urbanization Level in the MLYR

From 2001 to 2021, the new urbanization level in the MLYR showed an overall growth trend, from 0.1015 to 0.3979, an increase of 292.02%, with an average annual growth rate of 5.50% (Figure 4). The multi-year average showed that the proportion of lower-level cities was relatively large, accounting for 68.33%, followed by low-level cities, accounting for 25.00%. There were only four high and higher cities, namely Xi’an, Zhengzhou, Jinan, and Qingdao, indicating that the new urbanization level in the MLYR has great potential for development. The higher-level and lower-level cities showed clustering characteristics in space, while the high-level cities showed sporadic distribution characteristics, and the new urbanization level in most cities was constantly improving. This promotion showed a certain diffusion effect, starting from the growth of provincial capital cities and sub-central cities in each province, and spreading to the geographically adjacent cities. In 2021, low-level cities disappeared, mainly transformed into lower and higher-level cities. The number of lower-level cities increased by 20, higher-level cities increased by 35, and high-level cities increased by 5.
The level of each dimensional new urbanization in the MLYR showed an increasing trend, and the growth rate from high to low is economic urbanization, social urbanization, population urbanization, ecological urbanization, and integrated urban and rural development (Figure 5). In 2001 and 2005, the proportion of high-level cities with population urbanization was the highest, which was 26.73% and 34.45%, respectively, indicating that population urbanization played the most significant role in this stage. In 2008, 2015, and 2021, the proportion of high-level cities with economic urbanization was the highest, which was 26.50%, 41.31%, and 43.14%, respectively. It showed that since 2008, the supporting role of the economy in the new urbanization development of the MLYR was the most obvious. From the perspective of space, the distribution of new urbanization in different dimensions was uneven, and the high-level cities were basically located in the provincial capital and its sub-central cities. The spatial distribution of social urbanization and economic urbanization showed a certain similarity, population urbanization and integrated urban and rural development showed regional complementarity in space, and ecological urbanization showed a spatial pattern of high in the east and low in the west.

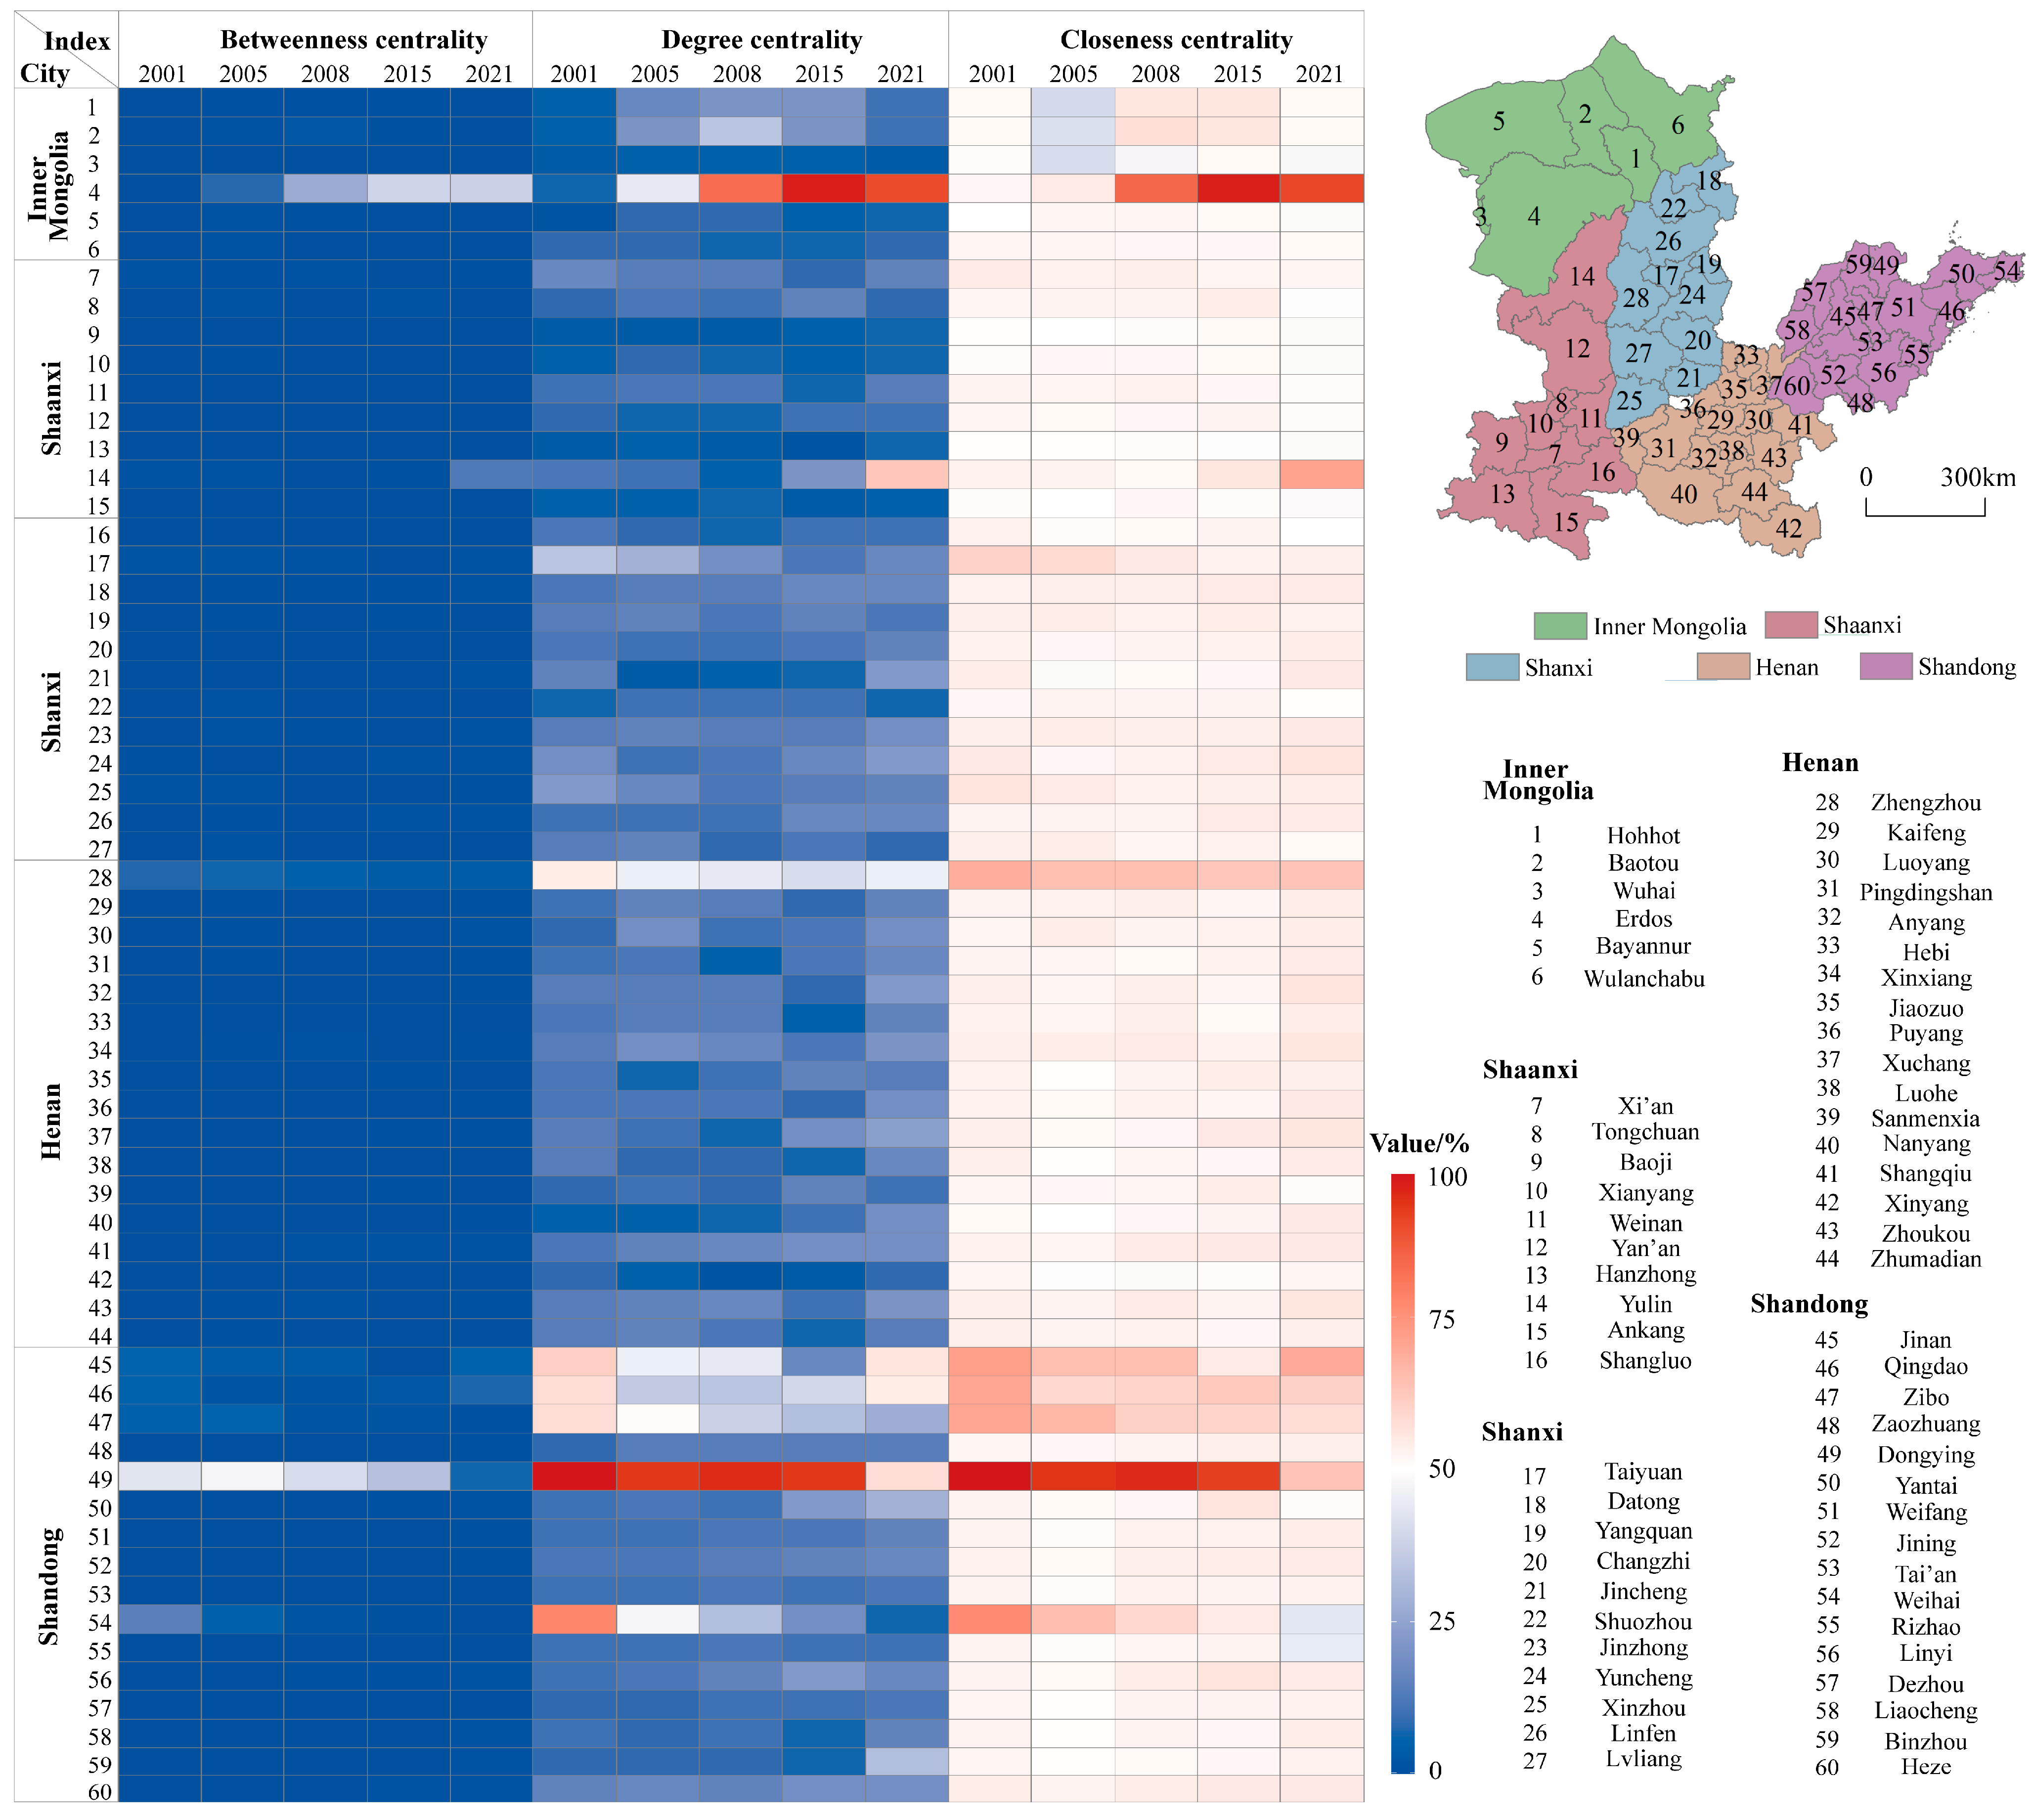
3.3. Spatial Correlation Network of New Urbanization in MLYR

The results of the modified gravity model showed that the new urbanization in the MLYR has broken through the geographical space constraints, forming a relatively complex and balanced spatial correlation network, which was not isolated cities (Figure 6). The correlation number of node cities in the network was tested by the global Moran’s I index. The results showed that the global Moran’s I index was between 0.2169 and 0.2990, the z score was greater than 1.96, and the p-value was less than 0.05, indicating that it always presented the characteristics of agglomeration distribution. Over time, the global Moran’s I index showed a fluctuating downward trend, indicating that the spatial agglomeration characteristics had weakened.
In 2001, the spatial correlation network showed a spatial pattern of dense in the east and sparse in the west. The network density of the eastern cities was large, and the spatial connection with the surrounding cities in terms of population, society, and economy was obvious. In 2005, the overall spatial correlation network was still dense in the east and sparse in the west, but the network density in the western cities increased. In 2008, the overall network density decreased, but the spatial balance increased. Ordos City rose to the core position of the spatial correlation network, and Baotou City also rose to the secondary core position. In 2015, the balance of the spatial correlation network was further strengthened, and the secondary core cities were reduced, leaving only Qingdao, Zibo, and Zhengzhou. In 2021, the spatial distribution of the spatial correlation network was more uniform, showing the multi-core characteristic. On the whole, the area with dense network connection gradually shifted from east to west, from Shandong Province as the core of aggregation to the double-intensive area of Shandong Province and Ordos City. The effective connection lines of most cities in Henan and Shanxi Province also increased, indicating that the balance of the spatial correlation network has been further enhanced. However, the effective correlation lines in the west were always less. This was because these cities have a greater correlation with cities in northwestern China, but a weaker correlation with the MLYR.
Three parameters of betweenness centrality, degree centrality, and closeness centrality were used to further describe the role of each city in the spatial correlation network (Figure 7). The average betweenness centrality showed an increasing trend, from 1.4456 in 2001 to 1.4807 in 2021, an increase of 2.43%, indicating that the moderating effect of each city on its surrounding cities was enhanced. The betweenness centrality was mostly high in the east, while mostly low in the west. The average degree centrality also showed an increasing trend, from 16.44 to 19.27, an increase of 17.21%, indicating that the links between cities were gradually increasing, and the status of most cities in the spatial correlation network was steadily increasing. On the contrary, the average closeness centrality gradually decreased from 55.15 to 54.42, a decrease of 1.32%. The role of Shandong Province was the most obvious, and the advantages of its new urbanization development were gradually decreasing compared with other cities. Overall, these changes of centrality may be attributed to two main reasons. First, the relative development speed of central cities, such as those in Shandong Province, had slowed down, leading to a gradual dilution of their influence and a consequent decline in their closeness centrality. Second, the continuous improvement in urbanization levels of cities like Ordos and Zhengzhou contributed to a more balanced network structure [39].

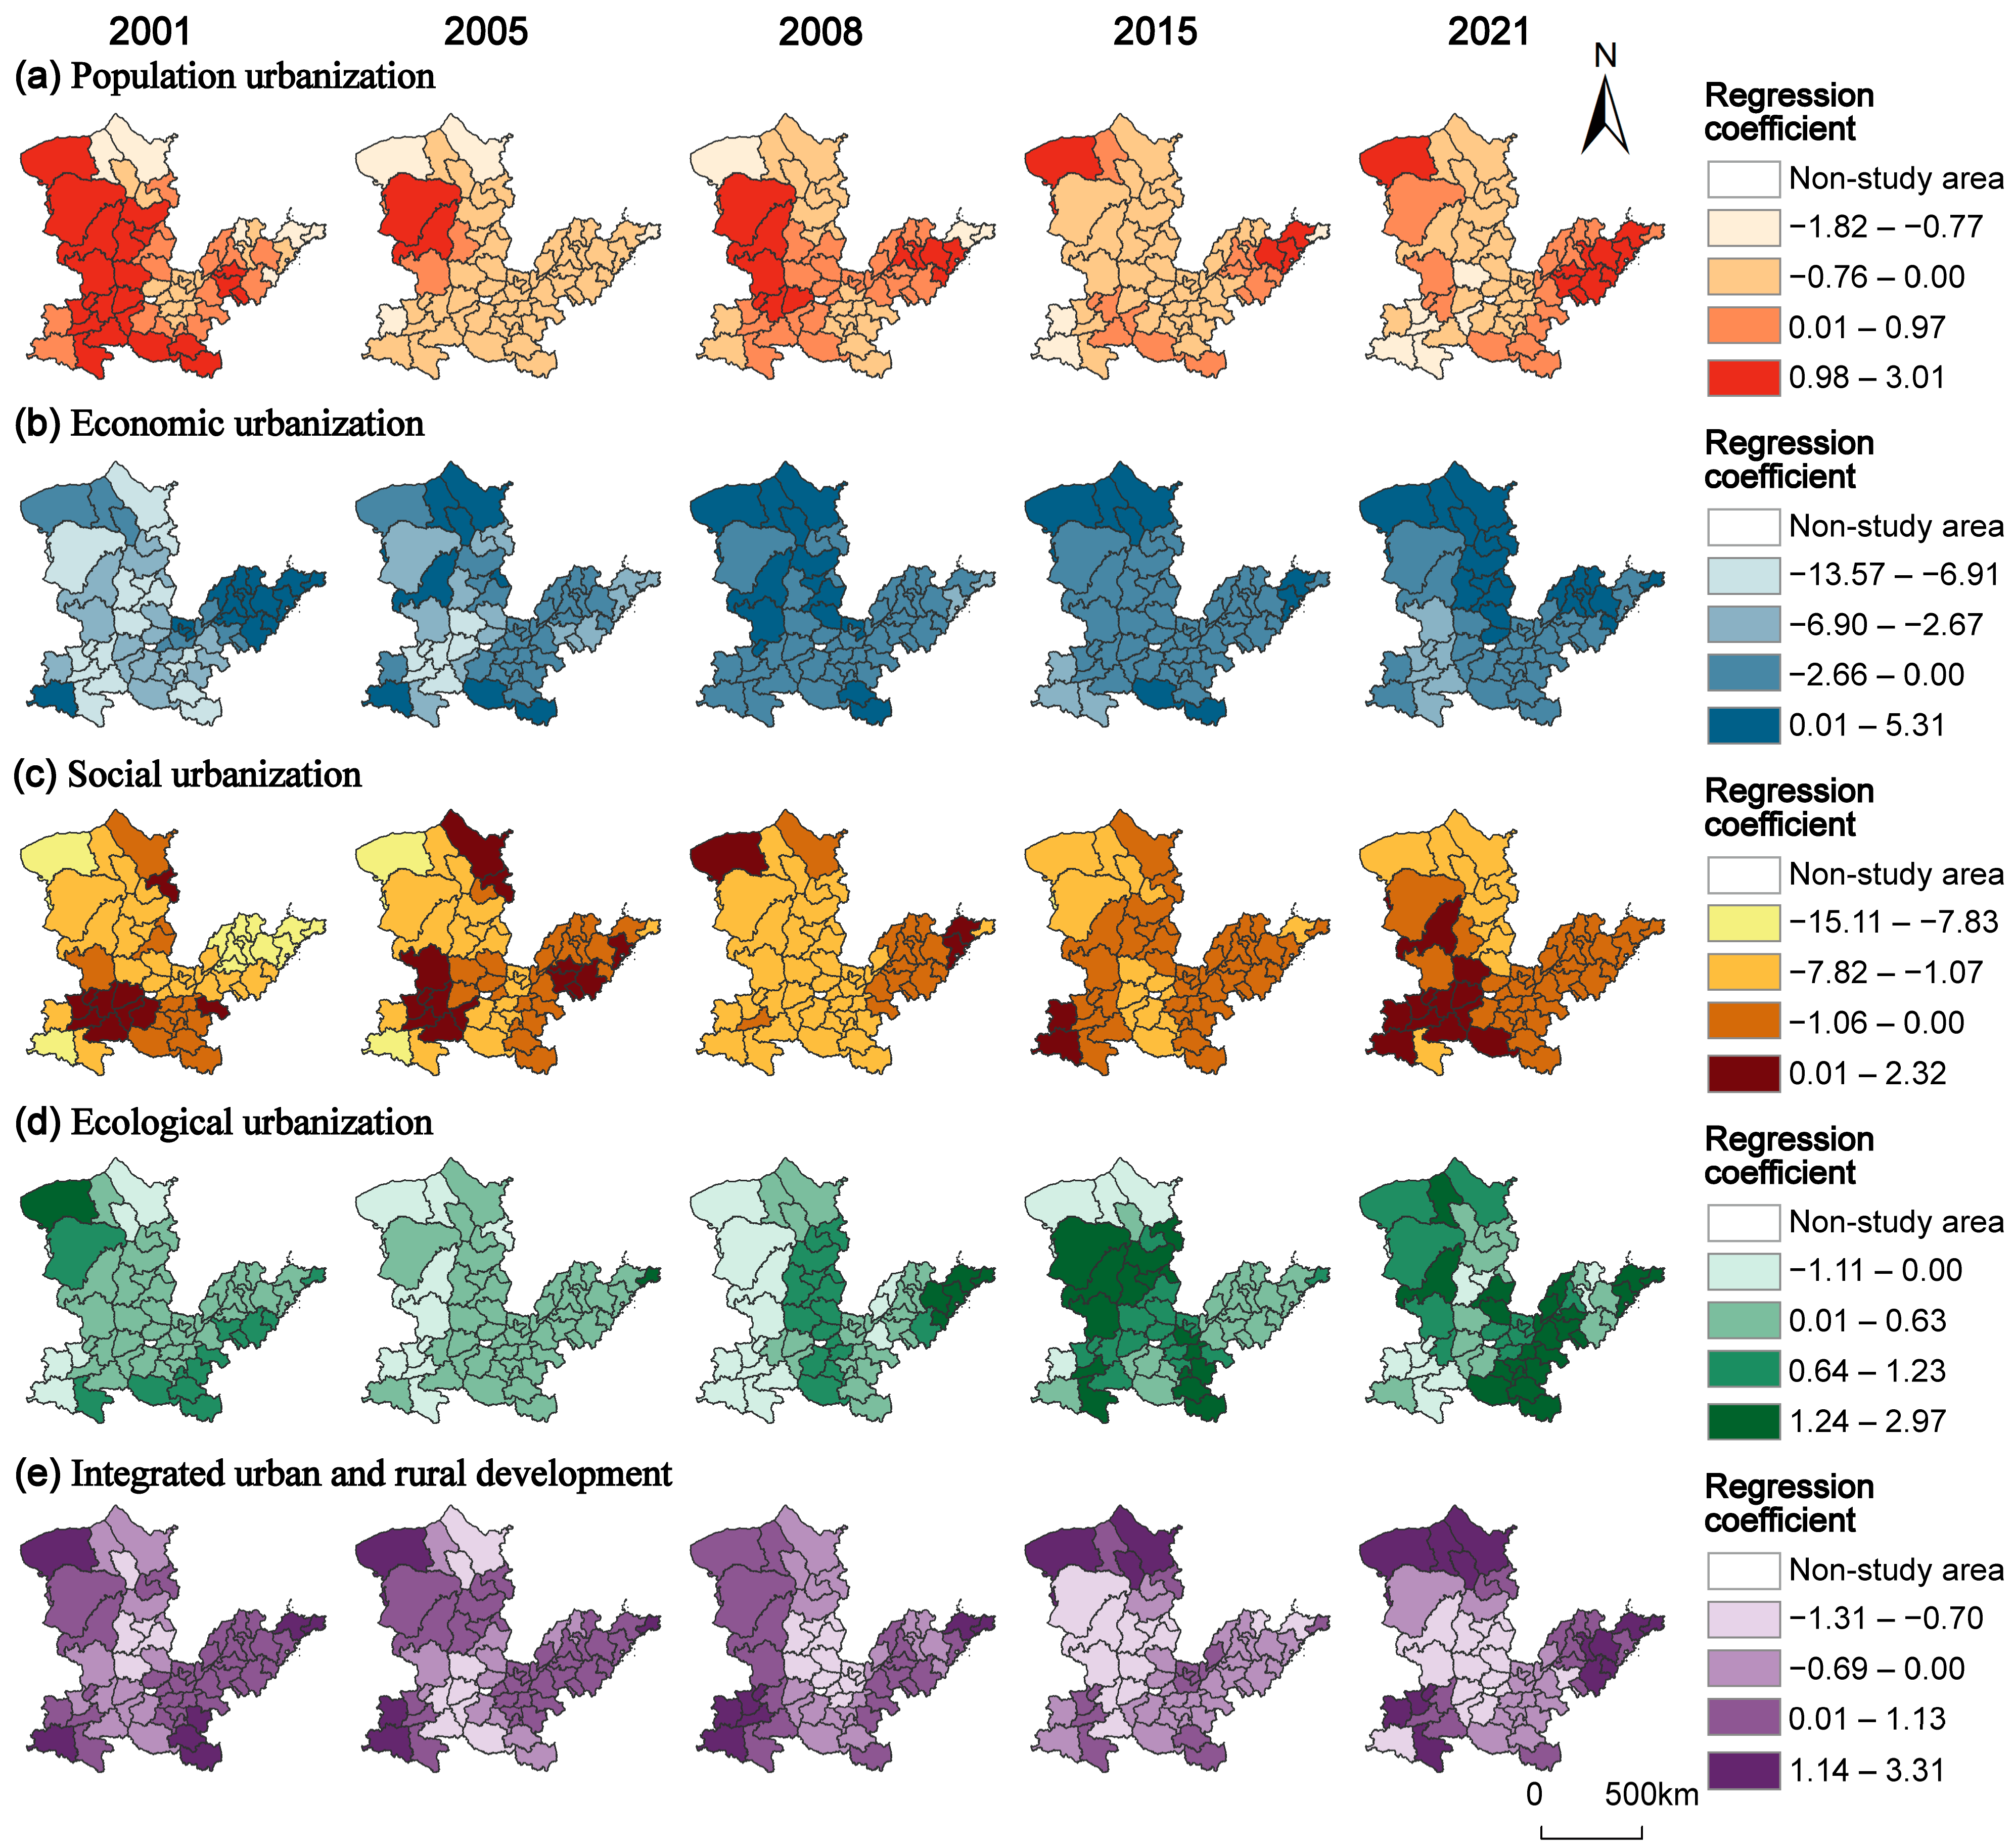
3.4. Impact of Multi-Dimensional New Urbanization on ULGUE in MLYR

The importance of the factors of new urbanization and its spatial correlation network characteristics on the ULGUE in the MLYR was ranked by random forest. The results were validated using the unbiased estimation of the Out-of-Bag (OOB) error rate and permutation tests, indicating that the importance rankings were statistically significant and not due to random chance [40]. The importance from large to small was ecological urbanization, social urbanization, population urbanization, economic urbanization, integrated urban and rural development, betweenness centrality, closeness centrality, and degree centrality. The importance of ecological urbanization to ULGUE was the highest, mainly because ULGUE was an indicator after balancing the negative effects of the ecological environment in the process of land use, which was closely related to the essence of ecological urbanization [26]. In the second place was social urbanization. The improvement of population educational and medical conditions, infrastructure, and social welfare can improve ULGUE, but as the marginal effect decreases [41], more input does not necessarily bring more output, so it can also lead to input redundancy and reduce ULGUE. In the third place was population urbanization. Population agglomeration often means rich labor resources and more productivity, which plays a certain role in ULGUE, but at the same time, the expansion of urban built-up areas will also have a negative impact [42].
The GTWR model was further used to analyze the spatial and temporal differences of the impact. Before using this model, a significance test was conducted. The results showed that all variables except closeness centrality passed the significance test at the 95% confidence interval. Therefore, closeness centrality was excluded from the subsequent analysis. The results showed that population urbanization, ecological urbanization, and integrated urban–rural development were positively correlated with ULGUE, while economic urbanization and social urbanization were negatively correlated with ULGUE.
Specifically (Figure 8), the average regression coefficient of population urbanization to ULGUE was 0.2384, but its positive correlation gradually weakened over time. The average value was reduced from 0.5506 to 0.1660, a decrease of 69.85%. This suggested that the increasing agglomeration of the urban population is becoming less positively correlated with ULGUE. Spatially, the areas showing positive correlation gradually shifted from east to west, with the positive correlation in the middle reach weakening and that in the lower reach strengthening. The eastern regions, with more advanced urbanization, may have reached a saturation point in population agglomeration benefits, while the western regions are still in the process of catching up, leading to a stronger positive correlation. The average regression coefficient of economic urbanization to ULGUE was −2.4248, and its negative correlation decreased over time, from −9.7553 to −2.4248. This may reflect the transition of economic development in the middle and lower reaches of the Yellow River from extensive land use to a more refined approach, with increasing emphasis on quality and efficiency. Spatially, the negative correlation in the middle reach was significant and expanding. This may be due to the relatively slower pace of industrial restructuring in the middle reach compared to the lower reach, resulting in a less sustainable economic development model. The average regression coefficient of social urbanization to ULGUE was −1.4781. This negative correlation was gradually weakening, and the average value was reduced from −3.1768 to −0.0325. Spatially, the negative correlation was more pronounced in Inner Mongolia. This might be related to the region’s unique socio-economic conditions, such as its reliance on resource-based industries. The average regression coefficient of ecological urbanization to ULGUE was 0.5442, and its positive correlation became increasingly significant, from 0.2448 to 1.1950. Spatially, ecological urbanization showed a positive correlation with ULGUE in most cities in the study area, accounting for an average of 74.33%. This trend aligns with the increasing emphasis on green development and environmental protection policies in recent years, which have enhanced the positive impact of ecological urbanization on ULGUE. The positive correlation between integrated urban and rural development and ULGUE was relatively weak, with an average coefficient of 0.0207. Spatially, the number of cities positively affected decreased, particularly in northern Shaanxi and Shanxi. These regions are located in mountainous and hilly areas, where rural infrastructure and public services face significant challenges.

3.5. Impact of New Urbanization Spatial Correlation Network on ULGUE in MLYR

On the whole, betweenness centrality showed a positive correlation with ULGUE, while degree centrality mainly showed a negative correlation (Figure 9). The average regression coefficient of betweenness centrality to ULGUE was 1.7815, and its positive correlation expanded over time, with the most significant changes observed in Henan. This may be attributed to its strategic location as a transportation hub in the MLYR, which enhances its role in resource and information flow, thereby strengthening its positive impact on ULGUE. The average regression coefficient of degree centrality to ULGUE is −0.3844. The enhanced centrality of individual cities may hinder the balanced allocation of resources in the spatial correlation network, resulting in a negative correlation with ULGUE. Spatially, the promotion correlation of Inner Mongolia, southern Shaanxi, and Shandong was obvious, which was contrary to the overall situation. The resource-based economy of Inner Mongolia, the ecological economy of southern Shaanxi, and the advanced industrial base of Shandong may have created localized development patterns that diverge from the overall trend.

4. Discussion

4.1. Influence Mechanism and Regional Comparison

In this study, new urbanization was divided into five dimensions of population urbanization, economic urbanization, social urbanization, ecological urbanization, and integrated urban and rural development. The subsystems of the five dimensions of new urbanization interact with each other and work together to form a comprehensive system to impact ULGUE, and these effects are usually both positive and negative [16]. Population urbanization optimizes resource allocation and promotes consumption upgrading, but it may increase urban pressure and lead to waste of resources. Economic urbanization promotes industrial agglomeration and structural optimization and increases land output, but industrial development may aggravate the ecological burden. Social urbanization improves infrastructure and public services but may lead to disorderly urban expansion and reduce ecological benefits. Ecological urbanization reflects urban ecological land and pollutant treatment. Ecological development can reduce undesired output, but resource-based cities may reduce ULGUE due to unreasonable industrial structure and limited ecological land. Integrated urban and rural development can balance the differences between urban and rural and promote the rational allocation of production means, but it may also lead to disorderly expansion and increased land-carrying pressure.
The spatial correlation network is the correlation formed by the flow of production factors and regional cooperation, which is the spatial embodiment of the correlation between cities [43]. The impact of the spatial correlation network of new urbanization on ULGUE is essentially that each city plays a network role and improves the overall resource allocation efficiency, so as to maximize the comprehensive benefits and minimize the negative effects of the ecological environment [44]. Since the 21st century, in order to reduce production costs and achieve the common needs of complementary resources, cities with different geographical spaces and different resource endowments actively seek the exchange and cooperation of production factors, forming an increasingly close correlation network [45]. Under the continuous advocacy of regional collaborative governance and coordinated development, the cooperative governance mechanism between cities has been further strengthened, forming a benign interaction between cities and strengthening the spatial correlation network [46]. It not only promotes cooperation and coordinated development between cities but also provides strong support for improving the efficiency of regional resource allocation [47].
The findings of this study highlight the importance of balancing economic, social, and ecological dimensions in new urbanization to promote sustainable land use. The spatial correlation network analysis underscores the need for coordinated governance among cities to enhance regional development. These insights are particularly relevant for policymakers in the MLYR region, where rapid urbanization and ecological challenges coexist. At the same time, it should be noted that the MLYR shows significant differences in ULGUE and urbanization patterns compared with other rapidly urbanizing regions in China, such as the Yangtze River Delta (YRD) and the Pearl River Delta (PRD). As the regions with the highest level of economic development in China, YRD and PRD have a high level of economic urbanization and industrial agglomeration, but they also face greater ecological pressure due to high population density and intensive industrial activities. In contrast, the MLYR has abundant natural resources and relatively low population density and has greater potential for ecological urbanization and urban–rural integration development. However, the MLYR lags behind YRD and PRD in terms of economic urbanization and infrastructure development, which limits its overall ULGUE [24]. In addition, the spatial correlation network density of the MLYR is low and the balance is poor, while the inter-city cooperation and resource flow in YRD and PRD are more intensive and efficient. These differences require the MLYR to formulate targeted policies to coordinate ecological protection and high-quality development to cope with the bottlenecks and challenges of its own development.

4.2. Policy Recommendations

It was found that new urbanization in the MLYR was unbalanced, and the impact on ULGUE also had spatial and temporal heterogeneity. According to the characteristics of different regions, the following suggestions are put forward: (1) Optimizing land use structure and spatial planning. Middle reach should focus on optimizing the land use structure by reducing inefficient and redundant construction land. Encourage intensive and economical land use through land reclamation and redevelopment [48]. For example, transform abandoned industrial sites into ecological parks or commercial complexes. Lower reach should strengthen land space planning, reasonably control the scale of urban construction land, and avoid disorderly expansion. Implement transit-oriented development (TOD) models, arranging residential, commercial, and public service facilities around public transportation hubs to improve land use efficiency [49]. (2) Strengthening inter-city collaborative governance and cooperation. Leverage the bridging role of cities with high betweenness centrality by enhancing their internal functions and external connectivity. For example, improve inter-city transportation links through the construction of high-speed railways and smart logistics networks [50]. For marginal cities, prioritize improving transportation infrastructure to promote balanced regional development [51]. Establish cross-regional ecological compensation mechanisms to foster cooperation in environmental protection and resource utilization. (3) Enhancing public services and ecological civilization construction. The government should increase investment in public services such as education, healthcare, and transportation, particularly in rural and underdeveloped areas [52]. Promote the construction of green infrastructure and the adoption of energy-saving and emission-reduction technologies, such as solar and wind energy [53].

4.3. Limitations and Prospects

This study systematically analyzed the impact of new urbanization and its spatial correlation network characteristics on ULGUE in cities in the MLYR, but there are still the following deficiencies. (1) The spatial correlation network only considered cities within the MLYR but did not consider the correlation between these cities and other external regions. In fact, the surrounding areas such as the upper reaches of the Yellow River, the Beijing–Tianjin–Hebei urban agglomeration, and the northeast old industrial base may also be associated with cities in the MLYR [54]. In the future, the regional scope can be appropriately expanded to avoid external interference in the surrounding areas, or refined to the county level for more microscopic research. (2) Important environmental negative effects such as CO2 and PM2.5 were not considered in the calculation of ULGUE. CO₂ emissions are a major contributor to climate change [55], and PM2.5 levels are closely associated with air quality and public health [56]. Future research should explore methodologies to incorporate these environmental factors into the ULGUE framework. (3) The role of institutional and governance factors was not fully addressed. Land use efficiency is significantly influenced by local government policies, regulatory frameworks, and planning strategies [57]. For instance, local land use policies, environmental regulations, and urban planning decisions can either promote or hinder sustainable land use practices. Future research should explore how these institutional factors interact with urbanization processes to influence ULGUE, providing a more holistic understanding of the drivers and barriers to sustainable urban development.

5. Conclusions

The rapid urbanization process poses challenges to the green and efficient use of land, while cross-regional linkages between cities also significantly impact land use efficiency. However, research that integrates multi-dimensional urbanization and its spatial correlation network with ULGUE remains relatively scarce. In this study, the undesired output super-efficiency SBM model and entropy weight method were used to measure ULGUE and the multi-dimensional new urbanization level of MLYR. The modified gravity model and centrality indexes were introduced to analyze the spatial correlation network characteristics of new urbanization. The effects of multi-dimensional new urbanization and its spatial correlation network on ULGUE were analyzed by random forest and GTWR model. Through the study of these systems integration, the following conclusions can be drawn: (1) From 2001 to 2021, ULGUE in the MLYR showed an overall upward trend, with the most obvious changes in 2005, 2008, and 2015. The new urbanization level in each dimension was also on the rise, and the growth rate from high to low was economic urbanization, social urbanization, population urbanization, ecological urbanization, and integrated urban and rural development. (2) There was a new urbanization spatial correlation network between cities in the MLYR, and there was no isolated city. The network presented a spatial pattern of dense in the east and sparse in the west, and gradually formed a double-center dense area, and the network balance was increasing. The betweenness centrality and degree centrality improved, and the closeness centrality declined. (3) Population urbanization, ecological urbanization, integrated urban and rural development, and betweenness centrality showed a promoting correlation in ULGUE. The correlation of different factors on ULGUE had spatial and temporal heterogeneity. (4) The comprehensive system composed of multi-dimensional new urbanization, as well as the spatial correlation formed by regional cooperation, had a complex impact on ULGUE. In the future, cities in the MLYR should optimize land use by reducing inefficient construction, control urban expansion through Transit-Oriented Development, and enhance inter-city collaboration by improving transportation and ecological compensation. Strengthening public services and green infrastructure will also further promote balanced, green, and sustainable development.

Author Contributions

Conceptualization, J.A. and X.Y.; methodology, J.A.; software, J.A. and Q.S.; validation, J.A. and X.Y.; resources, X.Y.; data curation, Q.S.; writing—original draft preparation, J.A. and Q.S.; writing—review and editing, J.A.; visualization, J.A. and Q.S.; supervision, X.Y.; funding acquisition, X.Y. All authors have read and agreed to the published version of the manuscript.

Funding

This research was funded by the Innovation Capability Support Program of Shaanxi, China, grant number 2024RS-CXTD-55.

Data Availability Statement

All data used in this study are publicly available and can be accessed through official online platforms. Further inquiries can also be directed to the corresponding author.

Conflicts of Interest

The authors declare no conflicts of interest.

References

  1. Chen, M.X.; Gong, Y.H.; Lu, D.D.; Ye, C. Build a People-Oriented Urbanization: China’s New-Type Urbanization Dream and Anhui Model. Land Use Policy 2019, 80, 1–9. [Google Scholar] [CrossRef]
  2. Lu, Y.H.; Song, W.; Lyu, Q.Q. Assessing the Effects of the New-Type Urbanization Policy on Rural Settlement Evolution Using a Multi-Agent Model. Habitat Int. 2022, 127, 102622. [Google Scholar] [CrossRef]
  3. Chen, M.X.; Ye, C.; Lu, D.D.; Sui, Y.W.; Guo, S.S. Cognition and Construction of the Theoretical Connotations of New Urbanization with Chinese Characteristics. J. Geogr. Sci. 2019, 29, 1681–1698. [Google Scholar] [CrossRef]
  4. Yang, L.Y.; Chen, W.X.; Fang, C.L.; Zeng, J. How Does the Coordinated Development of Population Urbanization and Land Urbanization Affect Residents’ Living Standards? Empirical Evidence from China. Cities 2024, 149, 104922. [Google Scholar] [CrossRef]
  5. Kilkis, S. Urban Emissions and Land Use Efficiency Scenarios Towards Effective Climate Mitigation in Urban Systems. Renew. Sustain. Energy Rev. 2022, 167, 112733. [Google Scholar] [CrossRef]
  6. Keshtkar, M.; Mobarghaee, N.; Sayahnia, R.; Asadolahi, Z. Landscape Ecological Security Response to Urban Growth in Southern Zagros Biome, Iran. Ecol. Indic. 2023, 154, 110577. [Google Scholar] [CrossRef]
  7. Almulhim, A.I.; Cobbinah, P.B. Can Rapid Urbanization Be Sustainable? The Case of Saudi Arabian Cities. Habitat Int. 2023, 139, 102884. [Google Scholar] [CrossRef]
  8. Simkin, R.D.; Seto, K.C.; McDonald, R.; Jetz, W. Biodiversity Impacts and Conservation Implications of Urban Land Expansion Projected to 2050. Proc. Natl. Acad. Sci. USA 2022, 119, e2117297119. [Google Scholar] [CrossRef] [PubMed]
  9. Langemeyer, J.; Madrid-Lopez, C.; Beltran, A.M.; Mendez, G.V. Urban Agriculture? A Necessary Pathway Towards Urban Resilience And Global Sustainability? Landsc. Urban Plan. 2021, 210, 104055. [Google Scholar] [CrossRef]
  10. Xiao, P.N.; Xu, J.; Zhao, C. Conflict Identification and Zoning Optimization of “Production-Living-Ecological” Space. Int. J. Environ. Res. Public Health 2022, 19, 7990. [Google Scholar] [CrossRef]
  11. Chen, W.X.; Zeng, J.; Li, N. Change in Land-Use Structure Due to Urbanisation in China. J. Clean. Prod. 2021, 321, 128986. [Google Scholar] [CrossRef]
  12. Tian, T.; Hao, M.Z.; Zhang, Z.L.; Ran, D. Urbanization in Dynamics: The Influence of Land Quota Trading on Land and Population Urbanization. Land 2024, 13, 163. [Google Scholar] [CrossRef]
  13. Abaidoo, R.; Agyapong, E.K. Environmental Sustainability Risk, Institutional Effectiveness and Urbanization. Energy Environ. 2023, 34, 3055–3079. [Google Scholar] [CrossRef]
  14. Lu, X.H.; Tao, X.Q. Local Government Environmental Attention and Urban Land Green Use Efficiency in China: The Intermediary Role of Industrial Restructuring. Land 2024, 13, 21. [Google Scholar] [CrossRef]
  15. Zhou, Y.X.; Lu, Y. Spatiotemporal Evolution and Determinants of Urban Land Use Efficiency Under Green Development Orientation: Insights from 284 Cities and Eight Economic Zones in China, 2005–2019. Appl. Geogr. 2023, 161, 103117. [Google Scholar] [CrossRef]
  16. Cheng, Z.H.; Li, X.; Zhang, Q. Can New-Type Urbanization Promote the Green Intensive Use of Land? J. Environ. Manag. 2023, 342, 118150. [Google Scholar] [CrossRef]
  17. Kangas, K.; Brown, G.; Kivinen, M.; Tolvanen, A.; Tuulentie, S.; Karhu, J.; Markovaara-Koivisto, M.; Eilu, P.; Tarvainen, O.; Simila, J.; et al. Land Use Synergies and Conflicts Identification in the Framework of Compatibility Analyses and Spatial Assessment of Ecological, Socio-Cultural and Economic Values. J. Environ. Manag. 2022, 316, 115174. [Google Scholar] [CrossRef]
  18. Li, X.Q.; Zheng, Z.J.; Shi, D.Q.; Han, X.F.; Zhao, M.Z. New Urbanization and Carbon Emissions Intensity Reduction: Mechanisms and Spatial Spillover Effects. Sci. Total Environ. 2023, 905, 167172. [Google Scholar] [CrossRef]
  19. Lenzi, C.; Perucca, G. The Nexus Between Innovation and Wellbeing Across the EU Space: What Role for Urbanisation? Urban Stud. 2020, 57, 323–349. [Google Scholar] [CrossRef]
  20. Perry, G.; Gebresenbet, F.; DaPra, M.; Branco, P.; Whibesilassie, W.; Jelacic, M.; Eyob, A.E. Why Urban Ecology Matters in Ethiopia. Front. Ecol. Evol. 2022, 10, 843698. [Google Scholar] [CrossRef]
  21. Dijkstra, L.; Florczyk, A.J.; Freire, S.; Kemper, T.; Melchiorri, M.; Pesaresi, M.; Schiavina, M. Applying the Degree of Urbanisation to the Globe: A new Harmonised Definition Reveals a Different Picture of Global Urbanisation. J. Urban Econ. 2021, 125, 103312. [Google Scholar] [CrossRef]
  22. Estoque, R.C.; Ooba, M.; Togawa, T.; Hijioka, Y.; Murayama, Y. Monitoring Global Land-Use Efficiency in the Context of the UN 2030 Agenda for Sustainable Development. Habitat Int. 2021, 115, 102403. [Google Scholar] [CrossRef]
  23. Li, J.S.; Sun, W.; Li, M.Y.; Meng, L.L. Coupling Coordination Degree of Production, Living and Ecological Spaces and Its Influencing Factors in the Yellow River Basin. J. Clean. Prod. 2021, 298, 126803. [Google Scholar] [CrossRef]
  24. Shao, Y.J.; Liu, Y.S.; Li, Y.H.; Yuan, X.F. Regional Ecosystem Services Relationships and Their Potential Driving Factors in the Yellow River Basin, China. J. Geogr. Sci. 2023, 33, 863–884. [Google Scholar] [CrossRef]
  25. Cui, J.; Zhu, M.S.; Liang, Y.; Qin, G.J.; Li, J.; Liu, Y.H. Land Use/Land Cover Change and Their Driving Factors in the Yellow River Basin of Shandong Province Based on Google Earth Engine from 2000 to 2020. ISPRS Int. J. Geo-Inf. 2022, 11, 163. [Google Scholar] [CrossRef]
  26. Tang, Y.K.; Wang, K.; Ji, X.M.; Xu, H.; Xiao, Y.Q. Assessment and Spatial-Temporal Evolution Analysis of Urban Land Use Efficiency under Green Development Orientation: Case of the Yangtze River Delta Urban Agglomerations. Land 2021, 10, 715. [Google Scholar] [CrossRef]
  27. Wang, S.; Yang, C.Y.; Li, Z.H. Spatio-Temporal Evolution Characteristics and Spatial Interaction Spillover Effects of New-Urbanization and Green Land Utilization Efficiency. Land 2021, 10, 1105. [Google Scholar] [CrossRef]
  28. Yu, B.B. Ecological Effects of New-Type Urbanization in China. Renew. Sustain. Energy Rev. 2021, 135, 110239. [Google Scholar] [CrossRef]
  29. Lin, B.Q.; Zhu, J.P. Impact of China’s New-Type Urbanization on Energy Intensity: A City-Level Analysis. Energy Econ. 2021, 99, 105292. [Google Scholar] [CrossRef]
  30. Zhang, H.; Chen, M.X.; Liang, C. Urbanization of County in China: Spatial Patterns and Influencing Factors. J. Geogr. Sci. 2022, 32, 1241–1260. [Google Scholar] [CrossRef]
  31. Chen, X.L.; Di, Q.B.; Jia, W.H.; Hou, Z.W. Spatial Correlation Network of Pollution and Carbon Emission Reductions Coupled with High-Quality Economic Development in Three Chinese Urban Agglomerations. Sustain. Cities Soc. 2023, 94, 104552. [Google Scholar] [CrossRef]
  32. Daniel, C.B.; Mathew, S.; Saravanan, S. Network Constrained and Classified Spatial Pattern Analysis of Healthcare Facilities and Their Relationship with the Road Structure: A Case Study of Thiruvananthapuram City. Spat. Inf. Res. 2021, 29, 791–805. [Google Scholar] [CrossRef]
  33. Daniel, C.B.; Mathew, S.; Subbarayan, S. GIS-Based Study on the Association Between Road Centrality and Socio-demographic Parameters: A Case Study. J. Geovis. Spat. Anal. 2022, 6, 1. [Google Scholar] [CrossRef]
  34. Patoine, G.; Eisenhauer, N.; Cesarz, S.; Phillips, H.R.P.; Xu, X.F.; Zhang, L.H.; Guerra, C.A. Drivers and Trends of Global Soil Microbial Carbon over Two Decades. Nat. Commun. 2022, 13, 4195. [Google Scholar] [CrossRef]
  35. Tomal, M.; Helbich, M. The Private Rental Housing Market Before and During the COVID-19 Pandemic: A Submarket Analysis in Cracow, Poland. Env. Plan. B-Urban Anal. City Sci. 2022, 49, 1646–1662. [Google Scholar] [CrossRef]
  36. Yang, Y.; Yuan, X.F.; An, J.J.; Su, Q.J.; Chen, B. Drivers of Ecosystem Services and Their Trade-Offs and Synergies in Different Land Use Policy Zones of Shaanxi Province, China. J. Clean. Prod. 2024, 452, 142077. [Google Scholar] [CrossRef]
  37. Njoku, E.A.; Tenenbaum, D.E. Quantitative Assessment of the Relationship Between Land Use/Land Cover (LULC), Topographic Elevation and Land Surface Temperature (LST) in Ilorin, Nigeria. Remote Sens. Appl.-Soc. Environ. 2022, 27, 100780. [Google Scholar] [CrossRef]
  38. Wang, L.Y.; Zhang, S.Y.; Xiong, Q.Q.; Liu, Y.; Liu, Y.F.; Liu, Y.L. Spatiotemporal Dynamics of Cropland Expansion and Its Driving Factors in the Yangtze River Economic Belt: A nuanced Analysis at the County Scale. Land Use Policy 2022, 119, 106168. [Google Scholar] [CrossRef]
  39. Chen, Z.Y.; Huang, B. Achieving Urban Vibrancy Through Effective City Planning: A Spatial and Temporal Perspective. Cities 2024, 152, 105230. [Google Scholar] [CrossRef]
  40. Wu, H.; Lin, A.Q.; Xing, X.D.; Song, D.X.; Li, Y. Identifying Core Driving Factors of Urban Land Use Change from Global Land Cover Products and POI Data Using the Random Forest Method. Int. J. Appl. Earth Obs. Geoinf. 2021, 103, 102475. [Google Scholar] [CrossRef]
  41. Abdulqadir, I.A.; Asongu, S.A. The Asymmetric Effect of Internet Access on Economic Growth in Sub-Saharan Africa. Econ. Anal. Policy 2022, 73, 44–61. [Google Scholar] [CrossRef]
  42. Ahmad, M.; Khan, Z.; Anser, M.K.; Jabeen, G. Do Rural-Urban Migration and Industrial Agglomeration Mitigate the Environmental Degradation Across China’s Regional Development Levels? Sustain. Prod. Consump. 2021, 27, 679–697. [Google Scholar] [CrossRef]
  43. Wei, X.; Chen, B.H. Spatial Association Network Structure of Agricultural Carbon Emission Efficiency in Chinese Cities and Its Driving Factors. Sci. Rep. 2024, 14, 31810. [Google Scholar] [CrossRef] [PubMed]
  44. Chen, Y.; Cai, H.S.; Chen, Y.R. Spatial Correlation and Interaction Effect Intensity between Territorial Spatial Ecological Quality and New Urbanization Level in Nanchang Metropolitan Area, China. Ecol. Indic. 2023, 156, 111163. [Google Scholar] [CrossRef]
  45. Ren, X.Z.; Xiong, R.; Ni, T.H. Spatial Network Characteristics of Carbon Balance in Urban Agglomerations—A Case Study in Beijing-Tianjin-Hebei City Agglomeration. Appl. Geogr. 2024, 169, 103343. [Google Scholar] [CrossRef]
  46. Shikary, C.; Rudra, S. Assessment of Urban-to-Urban Interaction and Its Impact on Urban Development: A Study on a Backward District of Eastern India. Environ. Dev. Sustain. 2024, 26, 16863–16886. [Google Scholar] [CrossRef]
  47. Shi, G.Q.; Liang, B.; Ye, T.T.; Zhou, K.X.; Sun, Z.G. Exploring the Coordinated Development of Smart-City Clusters in China: A Case Study of Jiangsu Province. Land 2024, 13, 308. [Google Scholar] [CrossRef]
  48. Klusácek, P.; Navrátil, J.; Martinát, S.; Krejcí, T.; Golubchikov, O.; Pícha, K.; Skrabal, J.; Osman, R. Planning for the Future of Derelict Farm Premises: From Abandonment to Regeneration? Land Use Policy 2021, 102, 105248. [Google Scholar] [CrossRef]
  49. Tamakloe, R.; Hong, J.; Tak, J. Determinants of Transit-Oriented Development Efficiency Focusing on an Integrated Subway, Bus and Shared-Bicycle System: Application of Simar-Wilson’s Two-Stage Approach. Cities 2021, 108, 102988. [Google Scholar] [CrossRef]
  50. Bag, S.; Telukdarie, A.; Pretorius, J.H.C.; Gupta, S. Industry 4.0 and Supply Chain Sustainability: Framework and Future Research Directions. Benchmarking 2021, 28, 1410–1450. [Google Scholar] [CrossRef]
  51. Kaiser, N.; Barstow, C.K. Rural Transportation Infrastructure in Low- and Middle-Income Countries: A Review of Impacts, Implications, and Interventions. Sustainability 2022, 14, 2149. [Google Scholar] [CrossRef]
  52. Liu, M.H.; Li, Q.; Bai, Y.; Fang, C.L. A Novel Framework to Evaluate Urban-Rural Coordinated Development: A Case Study in Shanxi Province, China. Habitat Int. 2024, 144, 103013. [Google Scholar] [CrossRef]
  53. Reyes-Riveros, R.; Altamirano, A.; De la Barrera, F.; Rozas-Vásquez, D.; Vieli, L.; Meli, P. Linking Public Urban Green Spaces and Human Well-Being: A Systematic Review. Urban For. Urban Green. 2021, 61, 127105. [Google Scholar] [CrossRef]
  54. Zhou, K.; Yin, Y.; Li, H.; Shen, Y.M. Driving Factors and Spatiotemporal Effects of Environmental Stress in Urban Agglomeration: Evidence from the Beijing-Tianjin-Hebei region of China. J. Geogr. Sci. 2021, 31, 91–110. [Google Scholar] [CrossRef]
  55. McKay, D.I.A.; Staal, A.; Abrams, J.F.; Winkelmann, R.; Sakschewski, B.; Loriani, S.; Fetzer, I.; Cornell, S.E.; Rockstrom, J.; Lenton, T.M. Exceeding 1.5 °C Global Warming Could Trigger Multiple Climate Tipping Points. Science 2022, 377, eabn7950. [Google Scholar] [CrossRef]
  56. Stafoggia, M.; Oftedal, B.; Chen, J.; Rodopoulou, S.; Renzi, M.; Atkinson, R.W.; Bauwelinck, M.; Klompmaker, J.O.; Mehta, A.; Vienneau, D.; et al. Long-Term Exposure to Low Ambient Air Pollution Concentrations and Mortality Among 28 Million People: Results from Seven Large European Cohorts Within the ELAPSE Project. Lancet Planet. Health 2022, 6, E9–E18. [Google Scholar] [CrossRef]
  57. Can, A. Housing and Urbanization Policies of Istanbul, Turkey from Central to the Local. Urban Res. Pract. 2022, 15, 454–463. [Google Scholar] [CrossRef]
Figure 1. Location (a), and land use status (b) in the study area.
Land 14 00625 g001
Figure 2. Research framework.
Land 14 00625 g002
Figure 3. Spatial pattern (a) and temporal change (b) of ULGUE in the MLYR.
Land 14 00625 g003
Figure 4. Spatial pattern of new urbanization level in the MLYR in 2001 (a), 2005 (b), 2008 (c), 2015 (d), and 2021 (e).
Land 14 00625 g004
Figure 5. Population urbanization (a), economic urbanization (b), social urbanization (c), ecological urbanization (d), and integrated urban and rural development (e) level in the MLYR.
Land 14 00625 g005
Figure 6. Spatial correlation network of new urbanization in the MLYR in 2001 (a), 2005 (b), 2008 (c), 2015 (d), and 2021 (e). Note: the effective connection line passed the significance test of 95% confidence interval.
Land 14 00625 g006
Figure 7. Structural characteristics of the spatial correlation network of new urbanization in MLYR.
Land 14 00625 g007
Figure 8. Correlation between population urbanization (a), economic urbanization (b), social urbanization (c), ecological urbanization (d), and integrated urban and rural development (e) and ULGUE in the MLYR.
Land 14 00625 g008
Figure 9. Correlation between betweenness centrality (a) and degree centrality (b) and ULGUE in MLYR.
Land 14 00625 g009
Table 1. Undesirable output super-efficiency SBM model index system.
CategoryIndexUnit
InputBuilt-up area CNY/km2
Investment in fixed assets million
Secondary and tertiary industry practitioners
Desired outputAdded value of secondary and tertiary industriesCNY/km2
Average wage of on-the-job workers%
Green coverage rate of built-up area
Undesired outputAverage industrial wastewater discharge t/km2
Average sulfur dioxide emissions t/km2
Average industrial soot emissionst/km2
Table 2. New urbanization evaluation index and its weight.
DimensionalIndexPolarityWeight
Population
urbanization
Proportion of urban population+0.0544
Urban population density+0.0955
Percentage of non-agricultural employment+0.0056
Economic
urbanization
GDP per capita+0.1415
Proportion of the output value of the secondary and tertiary industries to the total output value+0.0095
Per capita disposable income+0.1194
Investment in fixed assets+0.1947
Social
urbanization
Number of full-time teachers in middle schools+0.0115
Number of beds in medical and health institutions+0.0488
Total retail sales of social consumer goods+0.1996
Per capita urban road area+0.0531
Ecological
urbanization
Green coverage rate of built-up area+0.0163
Treatment rate of municipal solid waste+0.0132
Centralized sewage treatment rate+0.0162
Integrated urban and rural developmentRatio of urban and rural per capita disposable income0.0070
Ratio of urban and rural per capita consumption expenditure0.0138
Table 3. Comparative verification of OLS, GWR, and GTWR models.
ModelR2Residual SquaresAIC
OLS0.094129.9775176.3626
GWR0.59857.6015−249.253
GTWR0.73923.3976−490.8383
Disclaimer/Publisher’s Note: The statements, opinions and data contained in all publications are solely those of the individual author(s) and contributor(s) and not of MDPI and/or the editor(s). MDPI and/or the editor(s) disclaim responsibility for any injury to people or property resulting from any ideas, methods, instructions or products referred to in the content.

