Article

Analyzing Dispersion Characteristics of Fine Particulate Matter in High-Density Urban Areas: A Study Using CFD Simulation and Machine Learning

Department of Urban Design and Studies, Chung-Ang University, Seoul 06974, Republic of Korea
*
Author to whom correspondence should be addressed.
Land 2025, 14(3), 632; https://doi.org/10.3390/land14030632
Submission received: 8 February 2025 / Revised: 6 March 2025 / Accepted: 14 March 2025 / Published: 17 March 2025
(This article belongs to the Special Issue Local and Regional Planning for Sustainable Development)

Abstract

:
This study examines how urban morphology, road configurations, and meteorological factors shape fine particulate matter (PM2.5) dispersion in high-density urban environments, addressing a gap in block-level air quality analysis. While previous research has focused on individual street canyons, this study highlights the broader influence of building arrangement and height. Integrating computational fluid dynamics (CFD) simulations with interpretable machine learning (ML) models quantifies PM2.5 concentrations across various urban configurations. CFD simulations were conducted on different road layouts, block height configurations, and aspect ratio (AR) levels. The resulting dataset trained five ML models with Extreme Gradient Boosting (XGBoost), achieving the highest accuracy (91–95%). Findings show that road-specific mitigation strategies must be tailored. In loop-road networks, centrally elevated buildings enhance ventilation, while in grid-road networks, taller perimeter buildings shield inner blocks from arterial emissions. Additionally, this study identifies a threshold effect of AR, where values exceeding 2.5 improve PM2.5 dispersion under high wind velocity. This underscores the need for wind-sensitive designs, including optimized wind corridors and building alignments, particularly in high-density areas. The integration of ML with CFD enhances predictive accuracy, supporting data-driven urban planning strategies to optimize road layouts, zoning regulations, and aerodynamic interventions for improved air quality.

1. Introduction

Fine particulate matter (PM2.5), a major air pollutant, poses severe health risks in urban centers, contributing to respiratory and cardiovascular diseases and premature mortality [1,2,3]. The urban environment, characterized by dense populations and diverse anthropogenic activities, amplifies PM2.5 exposure, necessitating effective urban design strategies to minimize its impact. Urban design interventions that account for pollutant dispersion mechanisms offer a promising pathway toward sustainable urban development.
PM2.5 concentration in cities is influenced by an intricate interplay of factors. Traffic emissions, industrial activities, and human behavior contribute substantially to pollutant levels, while meteorological conditions such as wind velocity, atmospheric pressure, and temperature dictate dispersion patterns [4,5,6,7]. Among these, urban morphology—including the layout of buildings, road networks, and open spaces—plays a pivotal role in shaping microclimate conditions and pollutant dispersion [8,9,10]. Road patterns, building heights, and spatial configurations can create stagnation zones or facilitate pollutant dispersion, emphasizing the critical need to study these factors in depth [11,12].
Various methods have been developed to quantify and model particle concentrations, each with its strengths and limitations. These methods broadly include Computational Fluid Dynamics (CFD) simulations, field measurements, and statistical approaches. CFD is used to model concentration fluctuations from atmospheric releases and employs methods like ENVI-met [13], OpenFOAM [14], and ANSYS Fluent [15,16]. CFD provides a detailed analysis of pollutant transport and dispersion, accounting for complex urban geometries and environmental factors [17]. It serves as a cost-effective virtual tool for policy-making and urban planning by simulating hypothetical scenarios, offering advantages over large-scale wind tunnel experiments. Globally, CFD studies have informed policies to improve urban environments, including traffic systems, and have provided a scientific foundation for urban design guidelines [18,19,20].
Field measurements are crucial for environmental monitoring, providing real-time, location-specific data to validate CFD simulations and predictive models [12,21,22]. They help identify pollution hotspots, track temporal variations, and assess policy impacts [23], but their spatial and temporal limitations necessitate complementary analytical approaches. To address these gaps, statistical methods analyze spatial and temporal particulate matter (PM) trends, using techniques like land-use regression and partial correlation analysis to identify key environmental and socio-economic factors [24,25,26,27]. Machine learning (ML) models, such as Random Forest (RF) and Extreme Gradient Boosting (XGBoost), further enhance predictions by integrating diverse datasets and capturing nonlinear relationships [28,29,30].
Recent advances in CFD simulation and ML models offer a powerful, integrated approach to assess and predict PM2.5 distribution in urban areas [31]. CFD models provide a granular understanding of pollutant dispersion within the flow field, accounting for localized effects of urban morphology and meteorological conditions [32,33]. ML models, on the other hand, efficiently analyze large datasets to identify complex, multifactorial relationships between urban form and pollutant concentration [34,35]. Together, these methodologies address the limitations of traditional approaches, including the computational intensity of numerical simulations, high costs, and static, site-specific constraints of field measurements [36,37]. However, conventional ML models function as black boxes, limiting their interpretability for urban design and policy. Interpretable ML overcomes this challenge by ensuring accurate predictions while uncovering complex, previously unidentified relationships within datasets [38].
Building on these advancements, this study integrates CFD simulation and interpretable ML techniques to quantify the impact of urban morphology on PM2.5 concentrations. It examines key factor interactions in high-density urban areas, analyzing PM2.5 dispersion across road patterns and building configurations under varying meteorological conditions. Beyond academic contributions, these findings offer practical insights for policymakers and urban planners, supporting sustainable development through healthier and more resilient urban environments.

2. Materials and Methods

Figure 1 illustrates the integration of CFD simulations and ML approaches used in this study. Various urban geometry scenarios are created and simulated using ANSYS Fluent, producing particle concentration data for different urban morphology configurations, including road layout, block height, and aspect ratio (AR). These simulation outputs form a dataset that captures the relationships between input factors and particle concentrations. This dataset is then utilized to train ML models, enabling the quantification of the influence of urban morphology and meteorological factors on PM2.5 dispersion.

2.1. CFD Simulation

2.1.1. Mathematical Models

This study used ANSYS Fluent 2023 R2 as the primary computational tool for modeling fluid dynamics and pollutant dispersion in urban environments. ANSYS Fluent, a widely used CFD software provided by ANSYS, Inc. (Canonsburg, PA, USA), is employed in this study to simulate the concentration and dispersion of air pollutants in urban environments. Its robust capabilities allow for intricate modeling of fluid dynamics, thermal transfer, and species dispersion, rendering it appropriate for the analysis of complicated urban microclimates [39]. Moreover, ANSYS Fluent supports customizable boundary conditions and mesh generation, allowing for an accurate depiction of various urban morphology [40]. Our model simulates air turbulence within a fully three-dimensional system, accounting for variations in altitude and the dynamics of vertical vortex formations [41]. The simulation framework is constructed using the Reynolds-averaged Navier–Stokes equations, with the Shear-Stress Transport k-ω (SST k-ω) turbulence model [42]. This model, which combines the advantages of k-ω modeling for near-wall flows and k-ε modeling for free-stream zones, has been validated in previous studies and is particularly suited for complex flow conditions in urban areas [43,44,45]. The turbulent viscosity values were analyzed to assess the impact of ANSYS Fluent’s default viscosity ratio limit of 105. The maximum recorded value of approximately 1, well below the limit, aligns with the SST k-ω model’s near-wall sensitivity.
The passive scalar transport equation simulates the dispersion and concentration of particulates in the air. Equation (1) models the transport of a scalar field representing particulate concentration as follows:
x i ρ u i ϕ Γ ϕ x i = S ϕ
where Γ is the diffusion coefficient for the scalar, and Sϕ is the source term representing emissions of the scalar when only one scalar was set [46]. This equation effectively models the interplay of advection, diffusion, and source dynamics, providing comprehensive insights into pollutants’ behavior under different environmental conditions. This analysis assumes a steady-state flow, neglecting particle interactions, heat effects, and unsteady dynamics, with the particles’ negligible impact on the air attributed to their sufficiently small volume fraction [47]. The simulation achieved convergence after 500 iterations, with residuals below 10−6 for major flow variables, demonstrating numerical stability and ensuring the accuracy of the solution. Furthermore, the turbulent Schmidt number was set to 0.7 to represent the relationship between turbulent viscosity and scalar diffusivity in pollutant dispersion modeling [48,49].

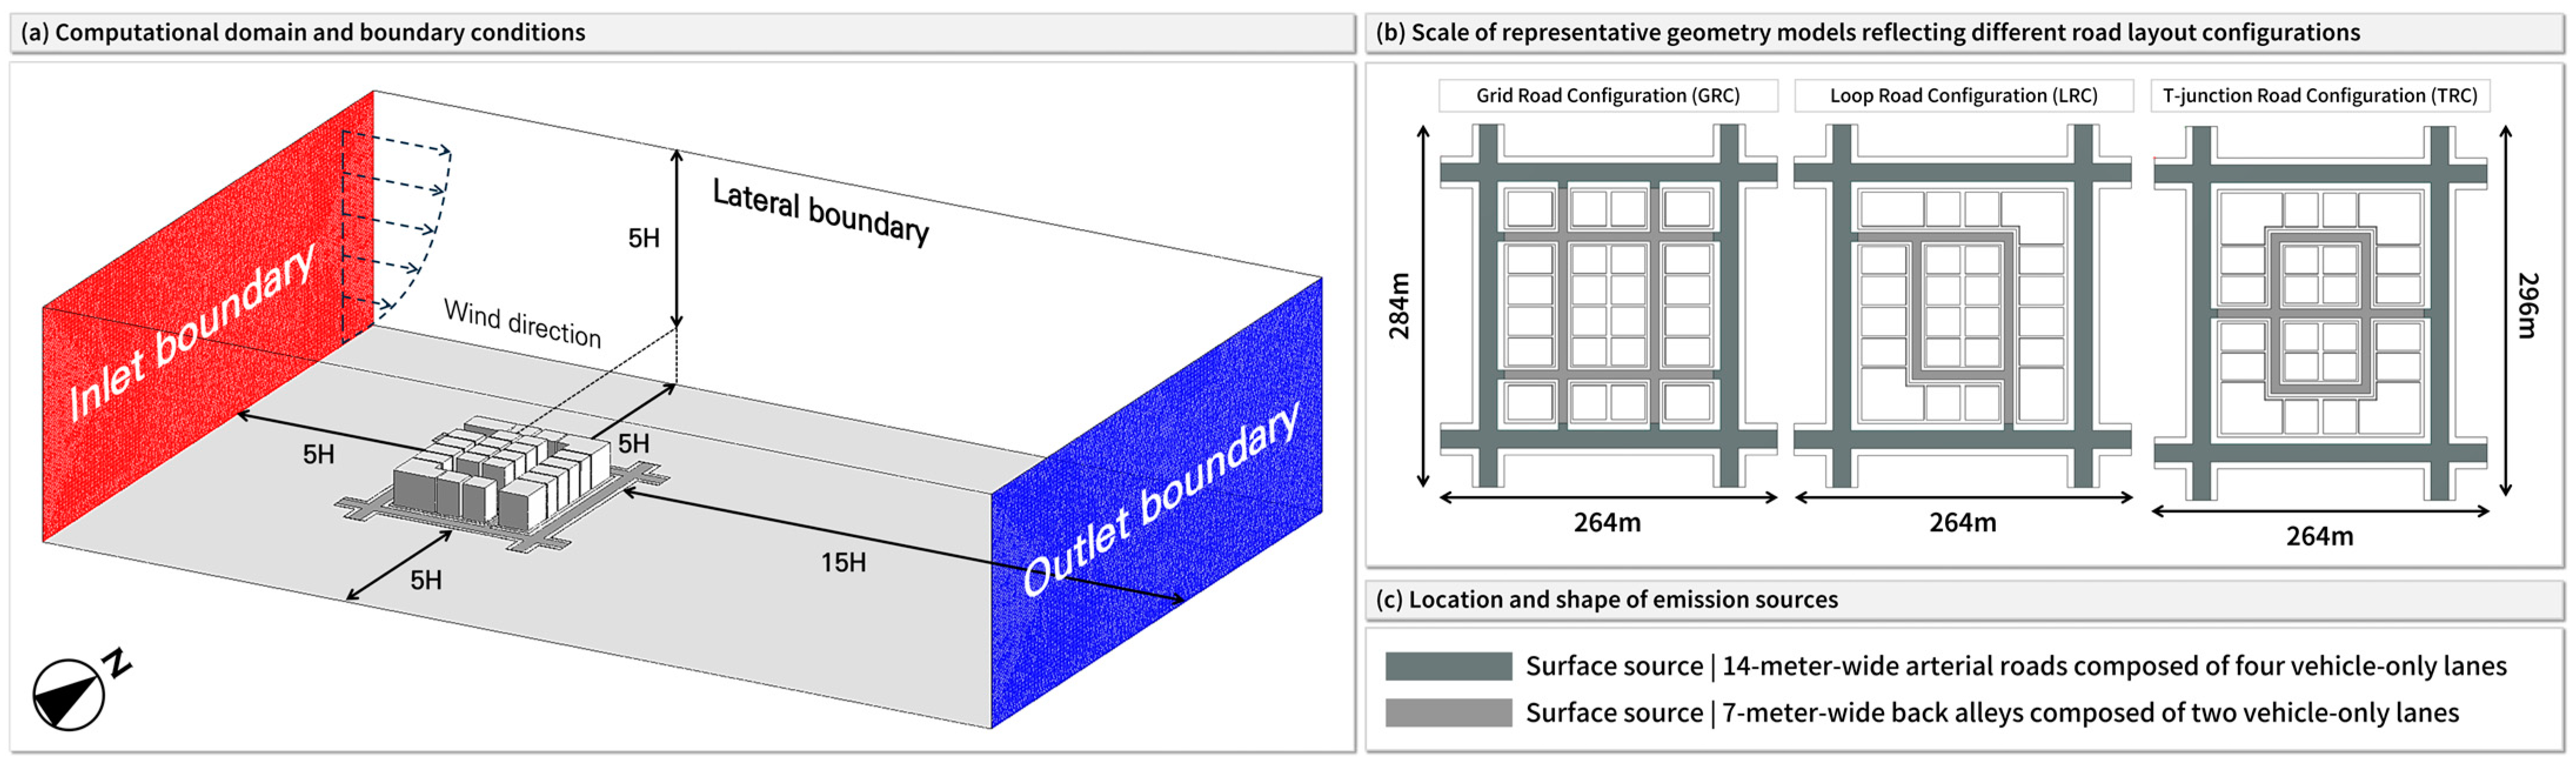
2.1.2. Computational Domains and Meshing

As shown in Figure 2, the geometric model dimensions are estimated to be approximately 284 m in length and 264 m in width. The computational domain was constructed in accordance with the AIJ guidelines [50]. The inlet boundary was positioned 5H away from the geometry, where H is the average height of the entire geometry, whereas the outlet boundary was set 15H away. In accordance with the influence of the prevailing westerlies in South Korea, the velocity-inlet is set to the west wind and the average wind velocity of 2 m/s, considering background airflow at the investigated site. The boundary condition for the outlet was pressure-out, and the boundary conditions of the ground and building surfaces were no-slip walls and isothermal heating conditions. All other boundaries were also placed at a distance of 5H from the geometry. A symmetry boundary condition was applied to the computational domain. This model comprises only fluid regions without any voids, which is crucial for accurately simulating PM2.5 dispersion within the complex geometry of high-density urban environments.
This study assumes that PM was treated as a non-reactive air pollutant to analyze the direct effects of road emissions on dispersion. The emission source is set with a width of 14 m for arterial roads and 7 m for back alleys at the ground to cover the entire roads for vehicles without pedestrian roads. The background concentrations are set to zero to focus on the influence of selected features on traffic-emitted PM concentrations as well [51]. The amount of PM2.5 emitted from the roads was calculated, as referenced in Guo’s study [8], based on traffic flow and the PM emission factor. The total amount of PM2.5 emitted by road vehicles, M, is calculated as follows:
M = N x · E x 3600 · S 1000 = 2.8 e 04   k g / s
here, Nx (h−1) represents the number of vehicles traveling on the road per hour; Ex (g/(km·h)) is the PM2.5 emission per hour, per unit length and per vehicle, and S (km) is the total length of the road. The emitted pollutants are assumed to be fully mixed near the road surface across the entire road length due to vehicle movement, based on the homogeneous emission method [52]. Hourly traffic volumes, heavy-duty vehicle rates, and idling times are based on traffic observation during field measurements in our previous study [53].
The mesh within this computational domain is categorized into two regions: surface and volume. The surface mesh size ranges from a minimum of 0.5 m to a maximum of 5 m. The volume mesh was filled with polyhedral cells, and the maximum cell length was automatically determined by the software, ranging from 6.09 m to 6.54 m. To enhance computational accuracy within the wall boundary layers, 10 layers are applied in succession, and the height of the first layer is set to 0.05 m. This mesh configuration optimizes the balance between simulation accuracy and computational efficiency, thereby improving the temporal efficiency of the simulations.
To further validate the effectiveness of this mesh, a grid independence test was conducted under steady-state conditions using the Grid road-AR1.0-even height configuration geometry scenario. PM2.5 concentration values were compared at the same location across four different mesh resolutions: coarse, medium, fine, and finest (Figure in Appendix A). The total number of cells in the coarse, medium, and fine meshes corresponded to approximately 45%, 60%, and 95% of the total number of cells in the finest mesh, respectively. The finest mesh was selected for the final simulations to ensure reliable results, as it provided the highest resolution for capturing airflow dynamics and pollutant dispersion patterns with greater accuracy.

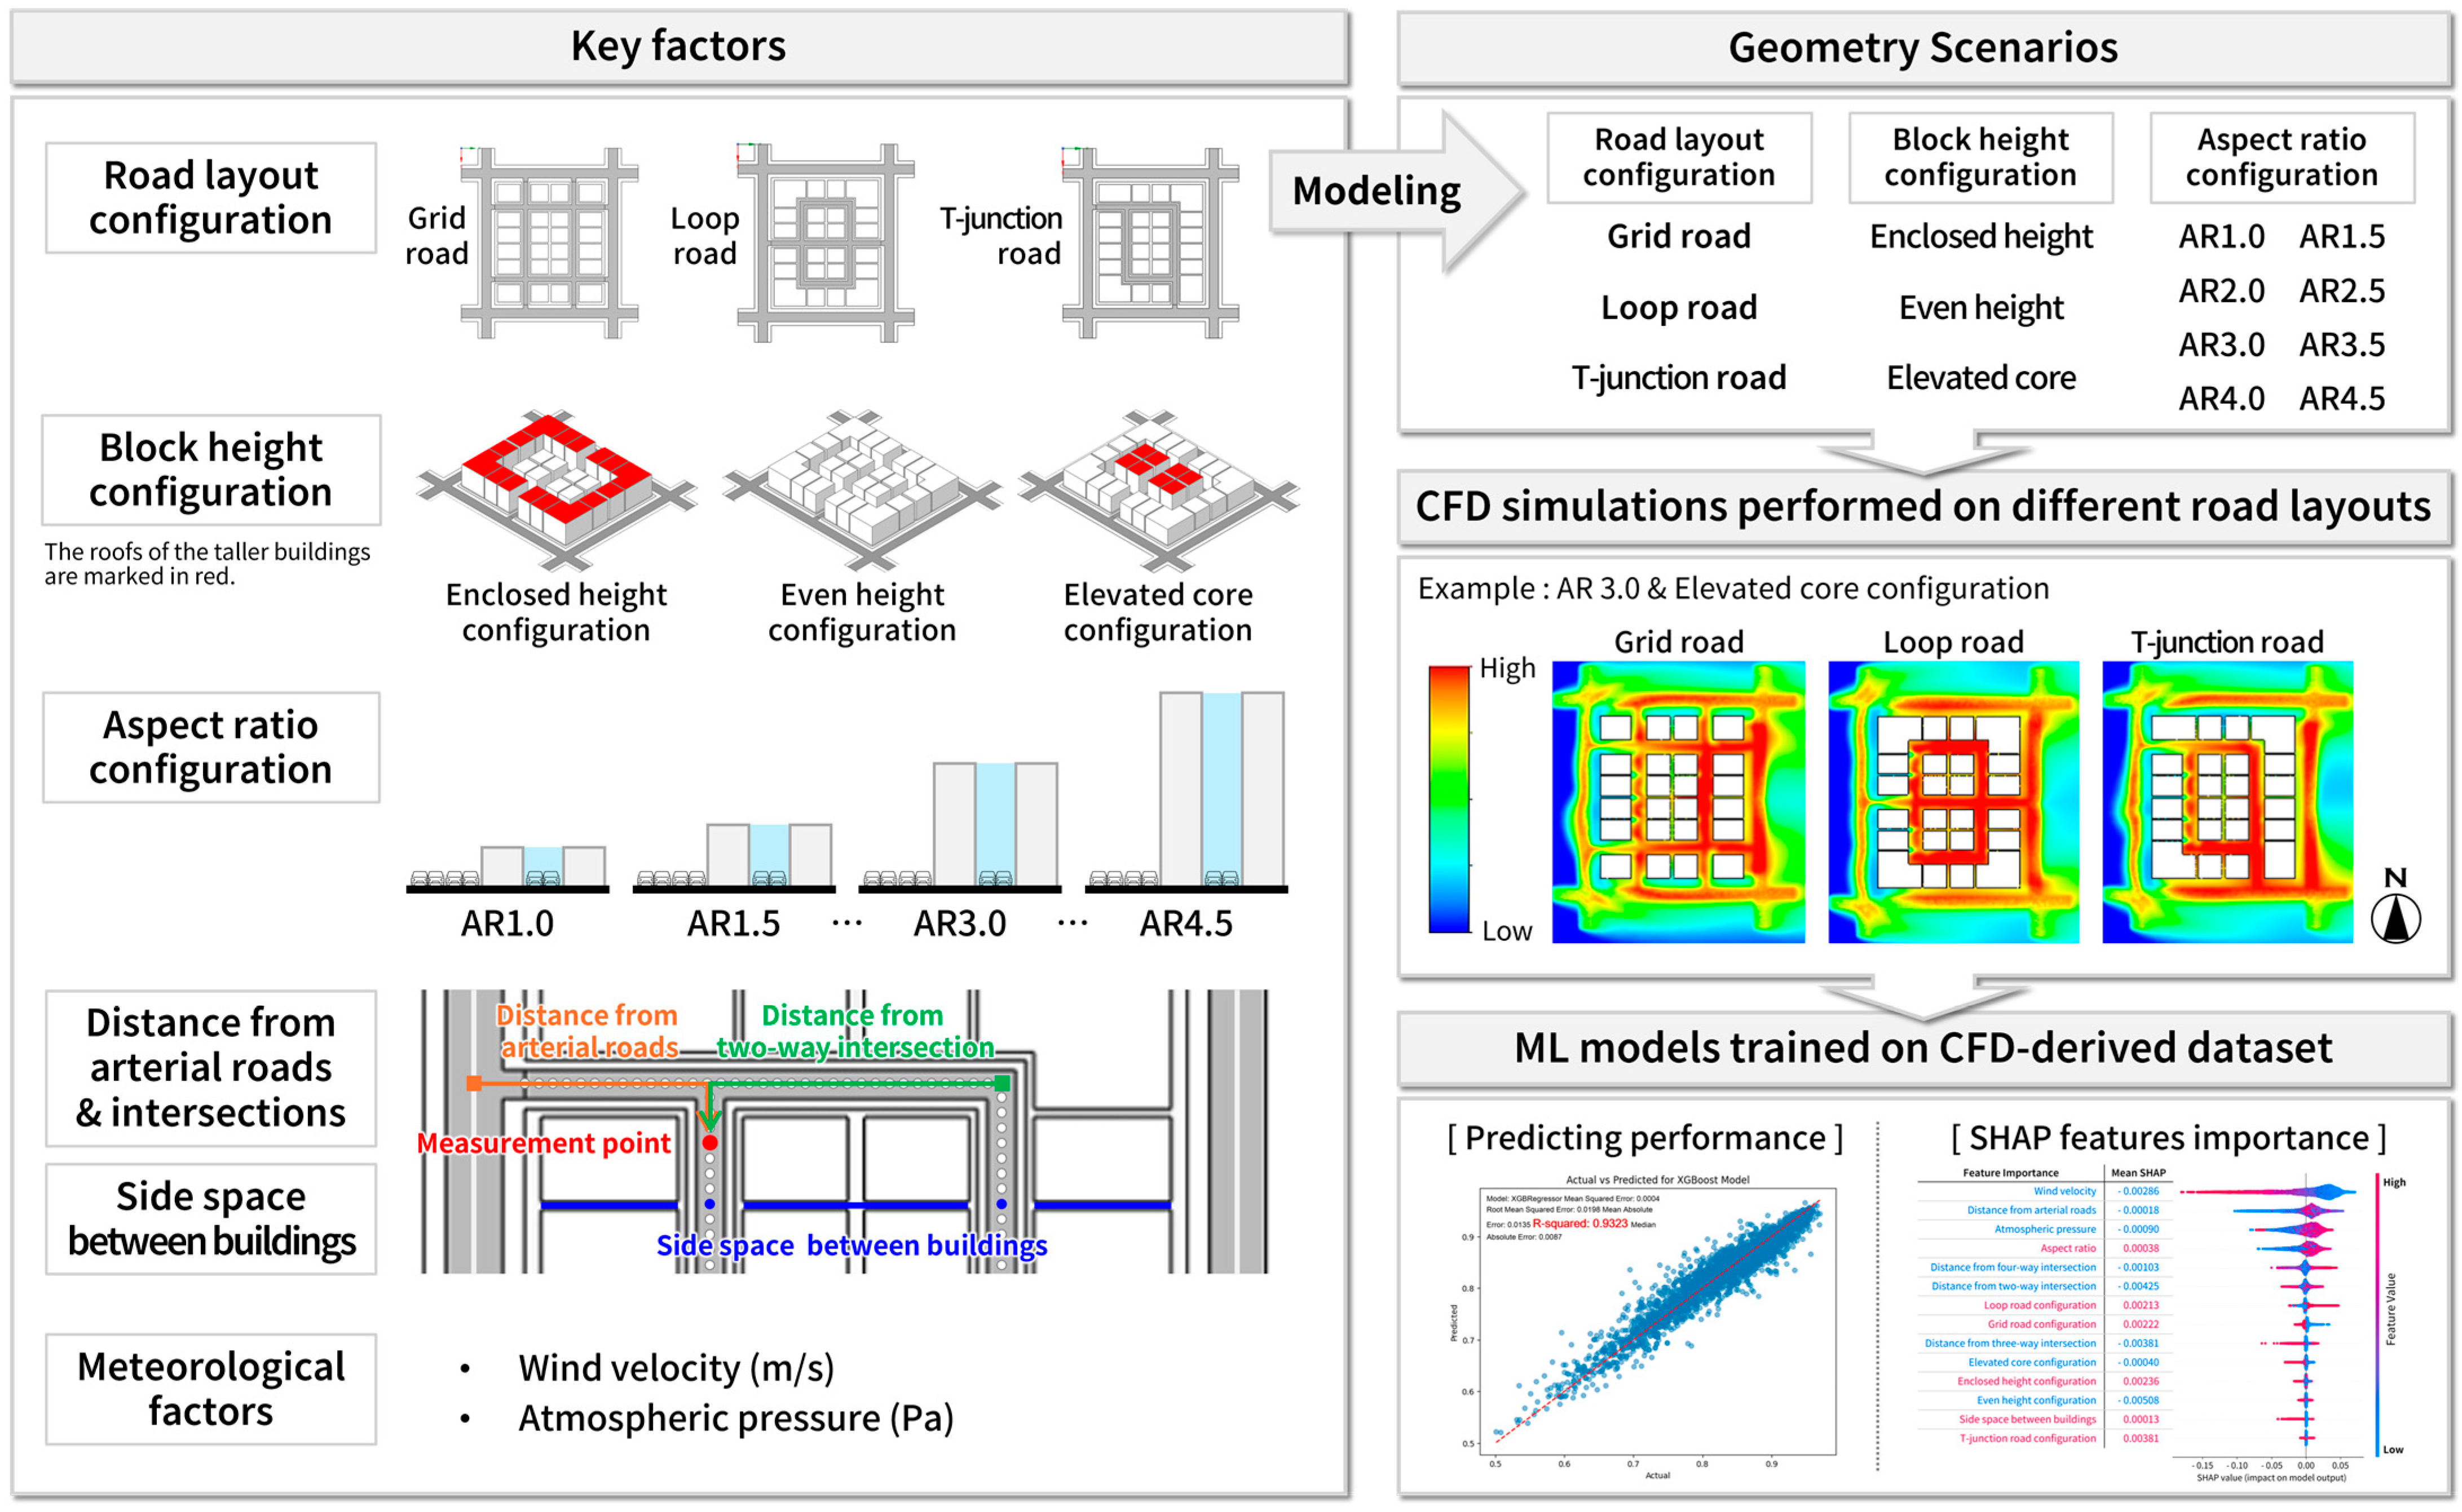
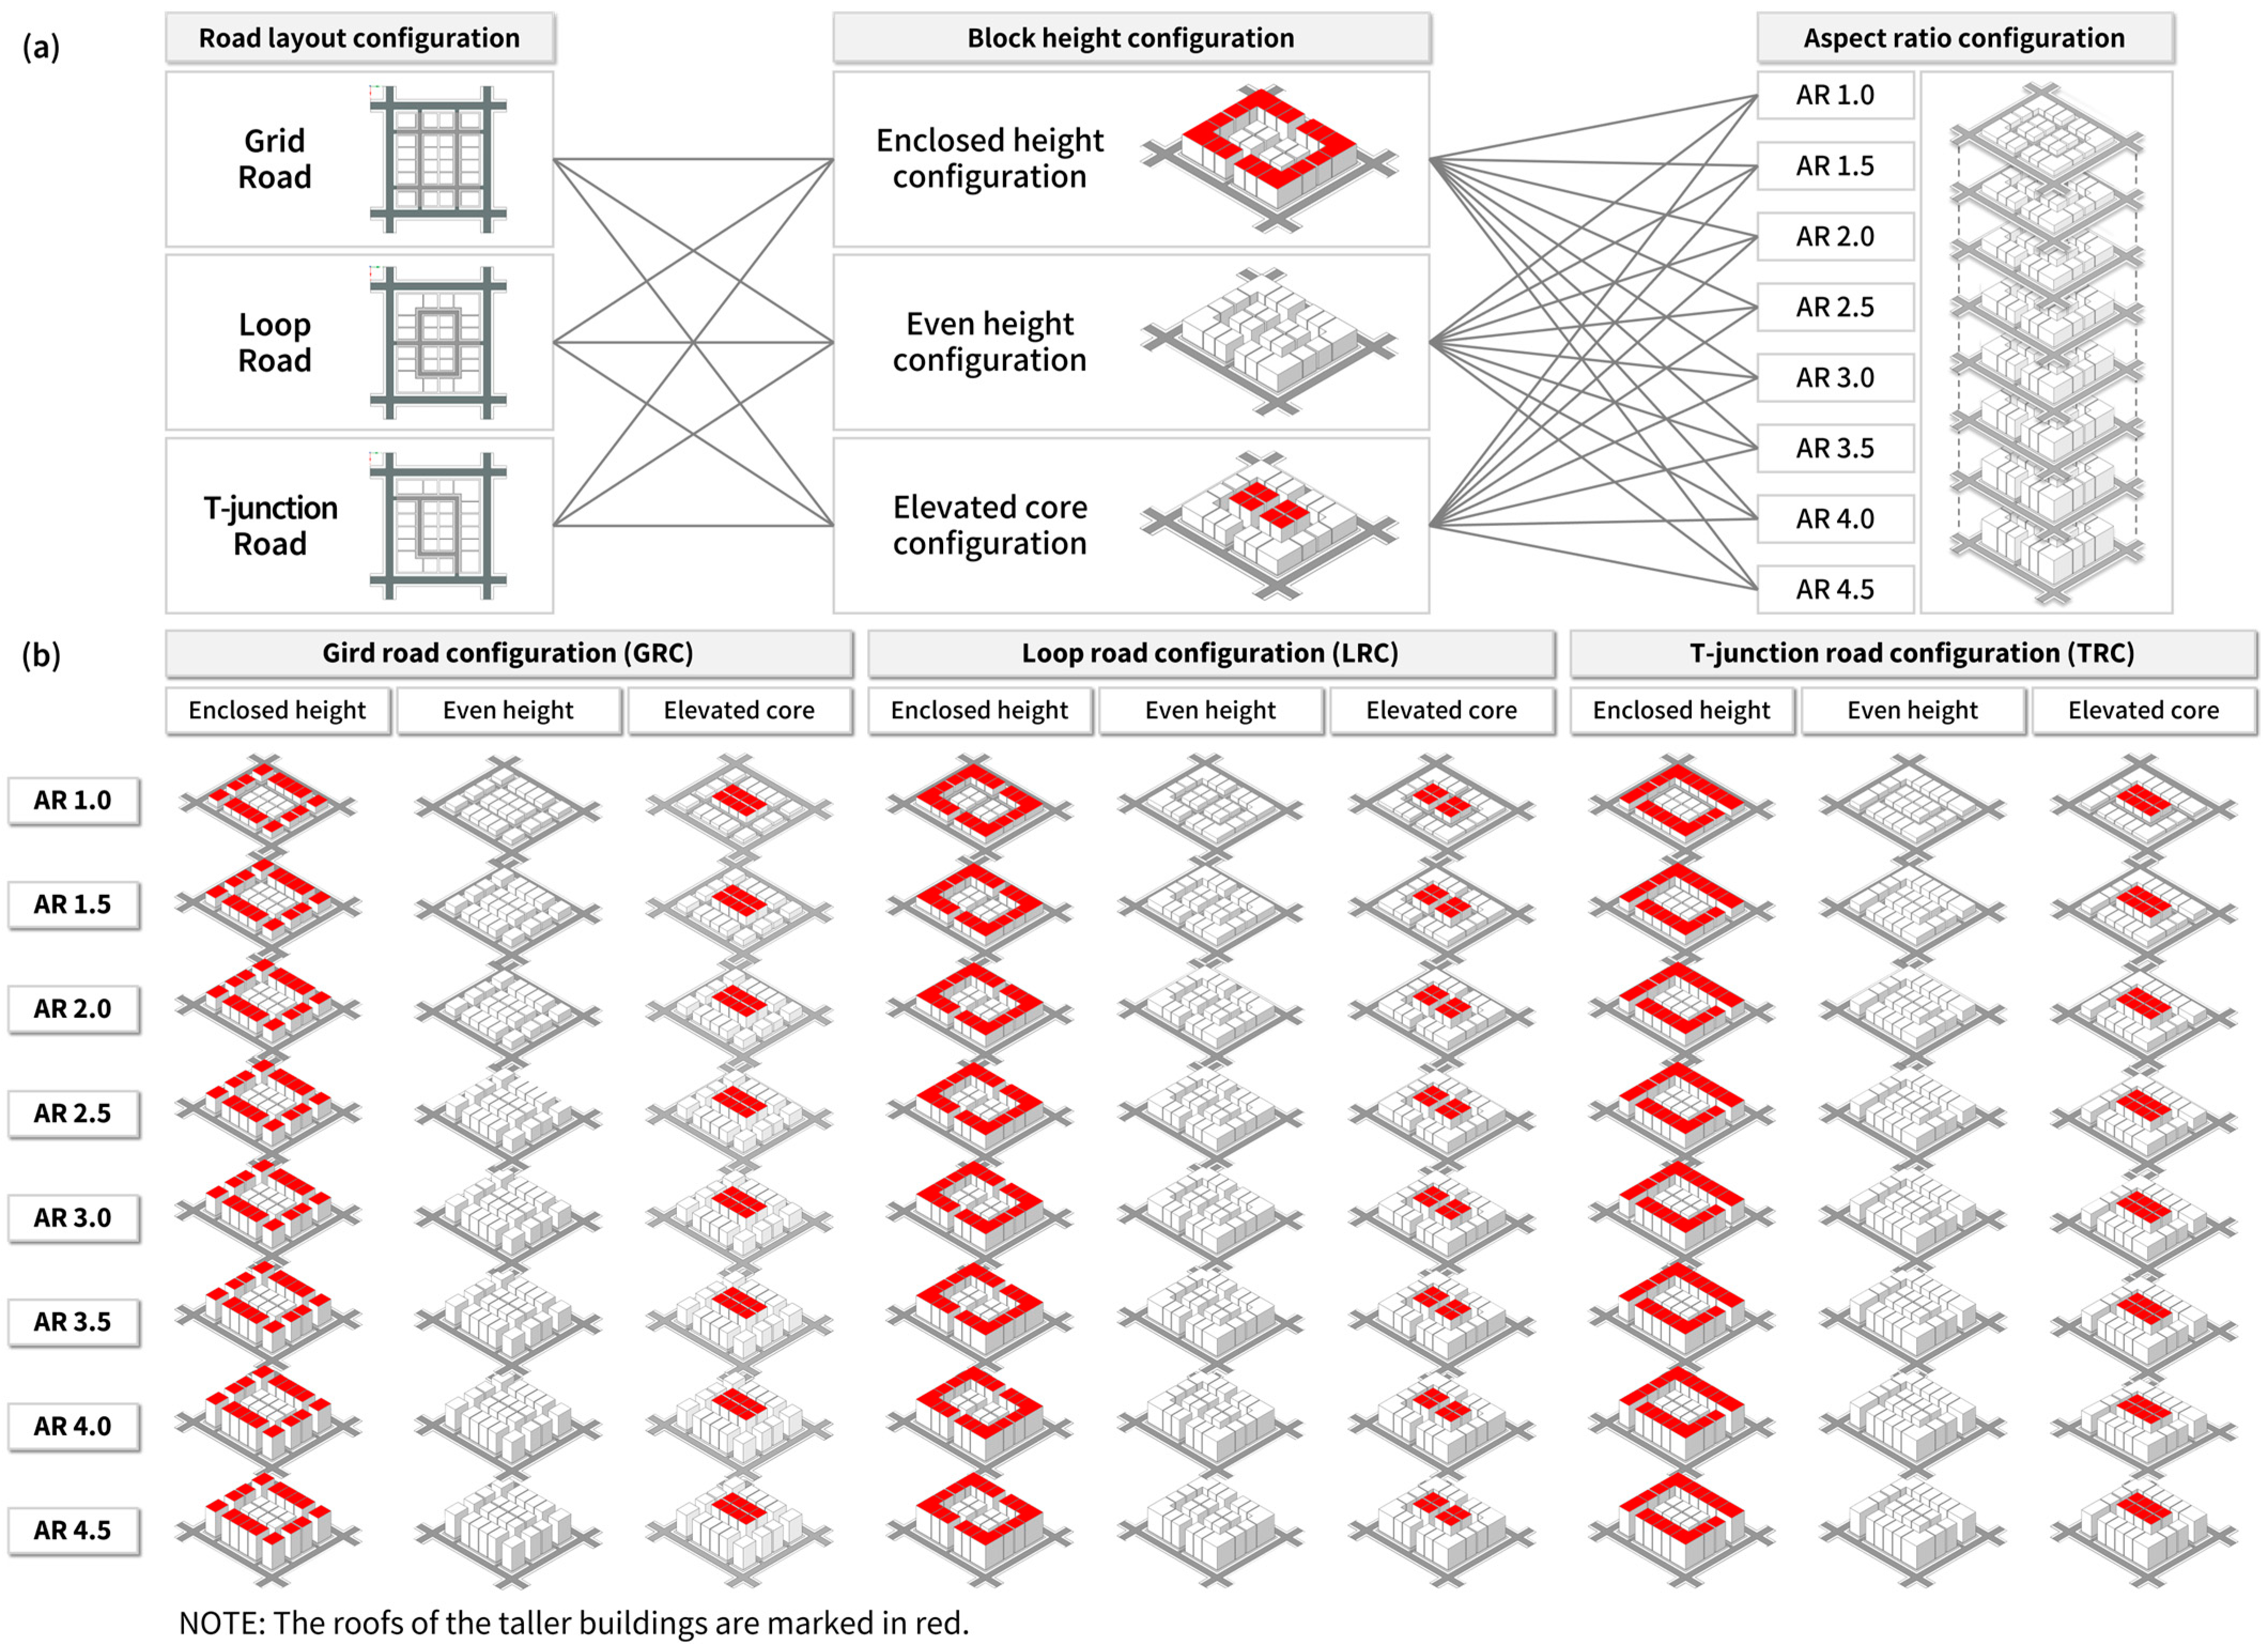
2.1.3. Geometry Scenarios

Our model represents a simplified version of a commercial urban block in Pangyo, one of the new towns located south of Seoul. Commercial blocks in these new towns are typically high-density urban areas located near major transportation hubs characterized by high pedestrian activity and heavy vehicular traffic. Designed to maximize land use and economic activity, these districts serve as key business and commercial centers. In new Korean towns, floor area ratios of commercial blocks typically range from 600% to 700%, with an average building height of approximately 50 m. In this study, each geometric scenario consists of 24 buildings, 25-m-wide arterial roads surrounding the block with four lanes, and 12-m-wide back alleys between buildings with two lanes. Based on the wind speed measured during field observations in October, an average wind speed of 2 m/s was used in this study to simulate pollutant dispersion [53].
In this study, 72 geometric scenarios are generated by combining three road patterns, three block height configurations, and eight AR levels (Figure 3a). First, grid, loop, and T-junction roads are identified as the three representative road patterns for CFD simulation, selected due to their common presence in commercial blocks of new towns in Korea. In this study, three simulation models were developed based on distinct road configurations: Grid Road Configuration (GRC), representing an interconnected network linking arterial roads and back alleys; Loop Road Configuration (LRC), featuring a closed-loop with limited connections to arterial roads; and T-Junction Road Configuration (TRC), defined by three-way intersections connecting to arterial roads. The connectivity between arterial roads and back alleys varies depending on the road configuration, leading to differences in traffic volume. In the Grid Road Layout, where connectivity is high, through traffic tends to be more prevalent. Conversely, in the Loop Road Layout, where connectivity is lower and back alleys are primarily used for parking, traffic volume is relatively lower. This study incorporates these differences by considering the varying amounts of PM2.5 emissions generated by each road configuration.
Second, block height configuration consists of three morphological types: enclosed height configuration, where outer buildings are taller than inner ones; elevated core configuration, where inner buildings are taller than outer ones; and even height configuration, where inner and outer buildings have uniform heights within the block (Figure 3b). The height difference between the inner and outer buildings is 8 m, approximately equivalent to two stories. Third, AR is defined as the ratio of average building height to back alley width. In this study, a 12 m back alley width is used as the standard, while building heights are varied to establish AR values ranging from 1.0 to 4.5 in 0.5 increments, resulting in a total of eight different AR levels applied to the geometry models.

2.2. Integration of CFD and Machine Learning

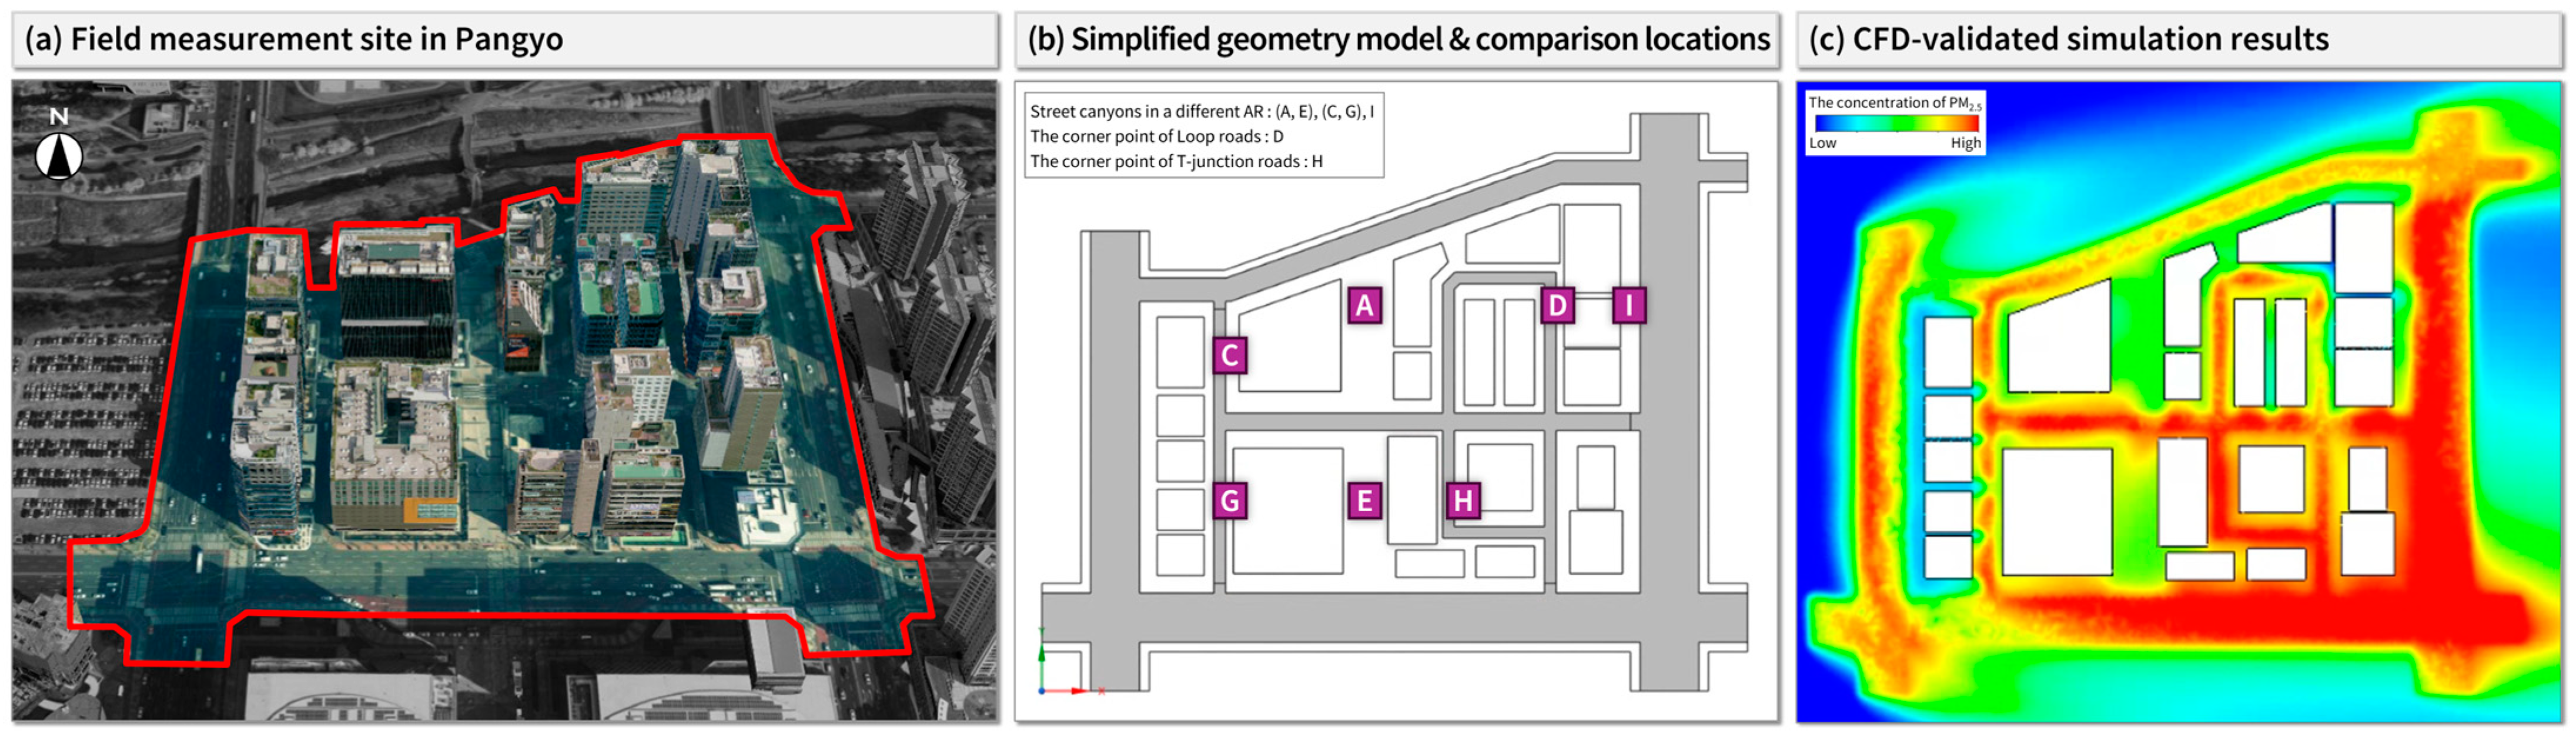
2.2.1. Evaluation of CFD Simulation

This study simulated the flow field and PM2.5 dispersion of the urban block using CFD techniques. The simulation outputs produced a dataset mapping the relationships between input factors and particle concentrations. To account for urban morphology, road layout and block height configurations were incorporated into the geometry scenarios. The CFD results indicate that among the three configurations, loop roads exhibited the highest average PM2.5 concentrations, followed by T-junction roads, while grid roads recorded the lowest levels, demonstrating superior pollutant dispersion capacity (Figure 4a).
The impact of block height configuration on PM2.5 dispersion varies depending on road layout and AR. In a T-junction road layout, blocks with elevated core configuration exhibit the highest average PM2.5 concentrations. However, the effects of enclosed height and even height configurations are inconsistent across different AR values, reflecting the nonlinear influence of AR on PM2.5 concentration (Figure 4b).
In Figure 4c, the box plots depict PM2.5 concentration distributions across different AR and road types, with the central line in each box representing the median PM2.5 value. The median concentration peaks at AR 2.5 across all road types, while values at AR 1 and 4.5 are lower, indicating a nonlinear relationship between aspect ratio and pollutant levels. PM2.5 distribution in GRC exhibits greater variability with a wider spread, whereas LRC and TRC show less variation, particularly at AR 2.5, where pollutant concentrations remain elevated. Similarly, Figure 4d reveals comparable PM2.5 distribution patterns across block configurations, with the highest median concentration at AR 3 and the lowest at AR 1.5.
The simulation model provides a simplified representation of a commercial urban block in Pangyo New Town, where PM2.5 concentrations were previously analyzed through field measurements [53]. This high-density area, characterized by numerous tall buildings and surrounded by four-lane and eight-lane roads, experiences continuous accumulation of traffic-related air pollutants, with peak concentrations reaching up to 50 μg/m³.
To validate the CFD simulation results, we used field measurement data collected over six days in October. The dataset, which included PM2.5 concentrations from seven monitoring points, was used to assess the model’s accuracy (Figure 5). The monthly average PM2.5 concentration recorded at an Automatic Weather Station 1.6 km from the site ranged from approximately 8 to 32 μg/m³, while CFD simulations estimated concentrations between 14 and 34 μg/m³. The validation process involved calculating correlation coefficients between the field measurements and CFD results, yielding R2 values between 0.85 and 0.97. This level of validation aligns with findings from other studies, reinforcing the reliability of the model [54,55,56].

2.2.2. Data Processing for Machine Learning Integration

The CFD simulation dataset was used to train ML models, quantifying the impact of urban morphology and traffic-related factors on PM2.5 dispersion. Point data samples were collected at 2 m intervals along back alleys, with a measurement height of 150 cm, representing the typical respiratory level for pedestrians based on the previous literature [57,58,59]. The number of samples per scenario varies by road configuration, with a total of 20,232 data samples: 348 from GRC, 273 from LRC, and 222 from TRC. Each sample includes meteorological conditions, traffic-related emissions, and urban morphology factors influencing PM2.5 dispersion (Table 1).
To capture the impact of traffic-related emissions, each point data reflect the network distance from the centerline of arterial roads, assuming pedestrians travel along back alley sidewalks. Arterial roads and back alleys were assigned different levels of traffic-related emissions to reflect their varying pollutant contributions. Each road layout features distinct back alley intersections: GRCs have four-way intersections; LRCs include two-way and four-way intersections, and TRCs feature two-way and three-way intersections. Network distance from each intersection type was calculated for every point to account for indirect traffic-related emissions. When multiple intersections influenced a point, all distances were computed, and the closest value was selected for accuracy.
Additional consideration was given to the side space between buildings, a key factor in PM dispersion. Article 242 of the Korean Civil Act mandates a minimum 0.5 m setback from the property line to ensure fire safety. In this study, the side space was set at 2 m. Attributes were assigned to point data at the intersection of aligned side spaces in outer and inner blocks with the back alleys, providing a structured basis for analysis.
Previous studies have established a strong correlation between building morphology and wind velocity, highlighting its critical role in shaping airflow patterns [60,61]. To further explore this relationship, this study extracted wind velocity and atmospheric pressure values from CFD simulation results. In CFD modeling, airflow dynamics are primarily dictated by urban morphology, with particle interactions and turbulence effects excluded to simplify the simulation process and improve computational efficiency.

2.2.3. Machine Learning Training and Hyperparameter Optimization

Processed CFD simulation data were used for ML and deep learning (DL) models to predict PM2.5 concentrations in the study area. Distinct regression techniques were applied and compared: RF, XGBoost, Support Vector Machine (SVM), Artificial Neural Network (ANN), and Convolutional Neural Network (CNN). These models were selected for their effectiveness in predicting continuous outcomes, with the primary objective of accurately modeling PM2.5 concentrations [62,63,64]. To ensure model reliability and mitigate overfitting, the dataset was randomly split into a training set (80%) and a testing set (20%), enabling the models to be trained on a substantial portion of the data while providing an independent evaluation on unseen data [65].
Hyperparameter tuning was conducted to enhance model performance, utilizing Gaussian Process-based optimization combined with 10-fold cross-validation. This approach models the performance of the algorithms as a probabilistic function, efficiently identifying optimal parameter settings [66]. This process minimizes the predefined loss function, resulting in improved predictive accuracy. Details of the hyperparameters, their search space, and the optimal values are summarized in Table 2.

2.2.4. Machine Learning Integrated with SHAP

Interpreting the results of ML models, particularly complex algorithms like XGBoost, remains a major challenge for researchers and practitioners. To address this, Lundberg and Lee introduced SHapley Additive exPlanations (SHAP), a game theory-based method for optimal credit allocation in ML models [67]. For tree-based ensemble models like XGBoost, TreeSHAP enhances computational efficiency and enables feature interaction analysis [68].
In this study, XGBoost outperformed other ML and DL models in analyzing PM2.5 concentrations. TreeSHAP improved interpretability by identifying key features and interactions, with analyses spanning overall trends and specific road typologies (GRC, LRC, and TRC), enabling the identification of the most critical determinants of PM2.5 concentrations. Interaction terms further captured synergies between variables, offering a nuanced understanding of how the built environment influences air quality.
The TreeSHAP equation used for this analysis is expressed as follows:
ϕ i = S N i S ! M S 1 ! M ! f x S i f x S
here, ϕi represents the marginal contribution of feature i to the model’s prediction; fx is the prediction function of the XGBoost regressor, and M denotes the total number of features in the model. S refers to any subset of features excluding the ith feature, and ∣S∣ indicates the size of the subset. By integrating SHAP with XGBoost, this study demonstrates the value of interpretable ML techniques in analyzing urban factors affecting PM2.5, supporting data-driven urban planning and environmental management.

3. Results

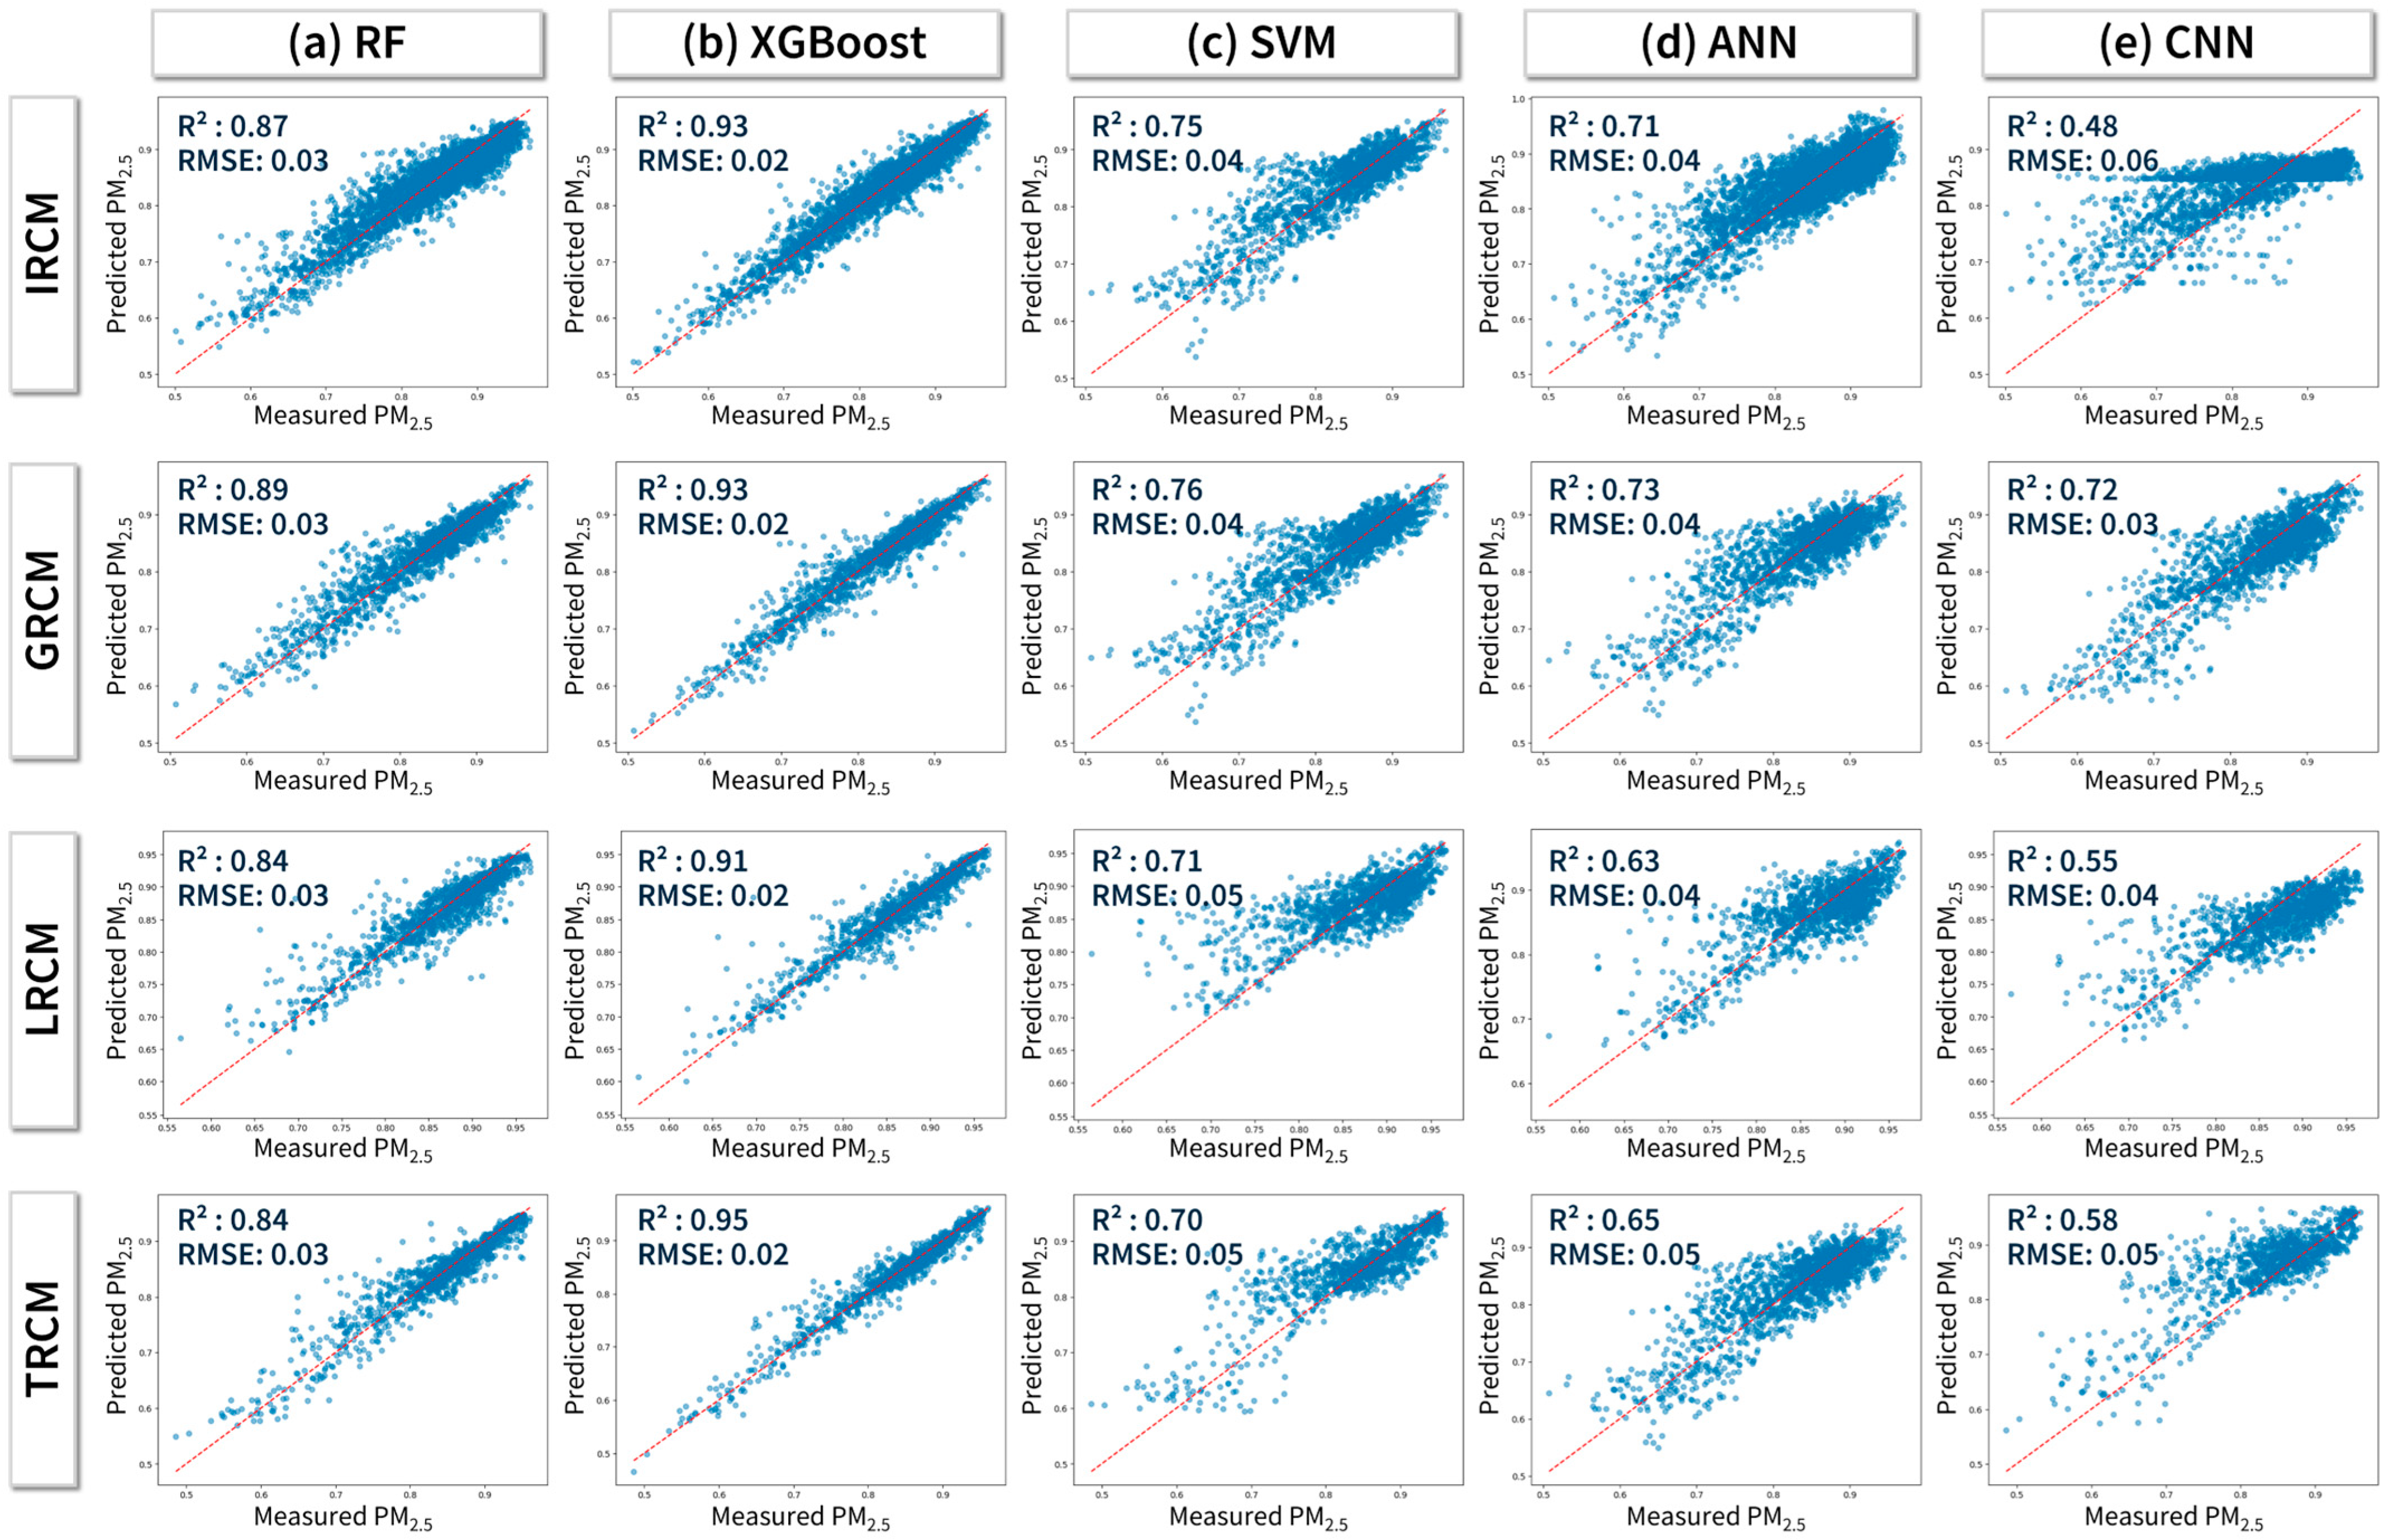
3.1. Model Prediction Accuracy Comparison

This study evaluates the dispersion characteristics of PM based on road configurations, including the Grid Road Configuration Model (GRCM), Loop Road Configuration Model (LRCM), and T-junction Road Configuration Model (TRCM). Additionally, an Integrated Road Configuration Model (IRCM) was developed to encompass all road types, including grid, loop, and T-junction configuration.
Both R2 and RMSE metrics were used to evaluate the predictive performance of the ML models (Table 3). Among these, XGBoost consistently delivered the best results across all geometry models, achieving the highest R2 values (ranging from 0.91 to 0.95) and the lowest RMSE values (0.02). Figure 6 further illustrates this by presenting scatter plots of predicted versus measured PM2.5 concentrations, which clearly demonstrate XGBoost’s strong predictive capability for PM2.5, followed by RF, while SVM, ANN, and CNN performed less effectively. Cross-validation using 10-fold K-fold validation on the same dataset showed consistent results, further confirming the reliability and robustness of the model’s findings (Figure in Appendix B).
Notably, within the XGBoost model, the TRCM geometry achieved the highest R² values, emphasizing its suitability for accurately predicting PM2.5 concentrations. This was followed by GRCM, IRCM, and LRCM. These differences across geometry models underscore the critical role of urban morphology in determining model accuracy, with TRCM emerging as the most predictable geometry.

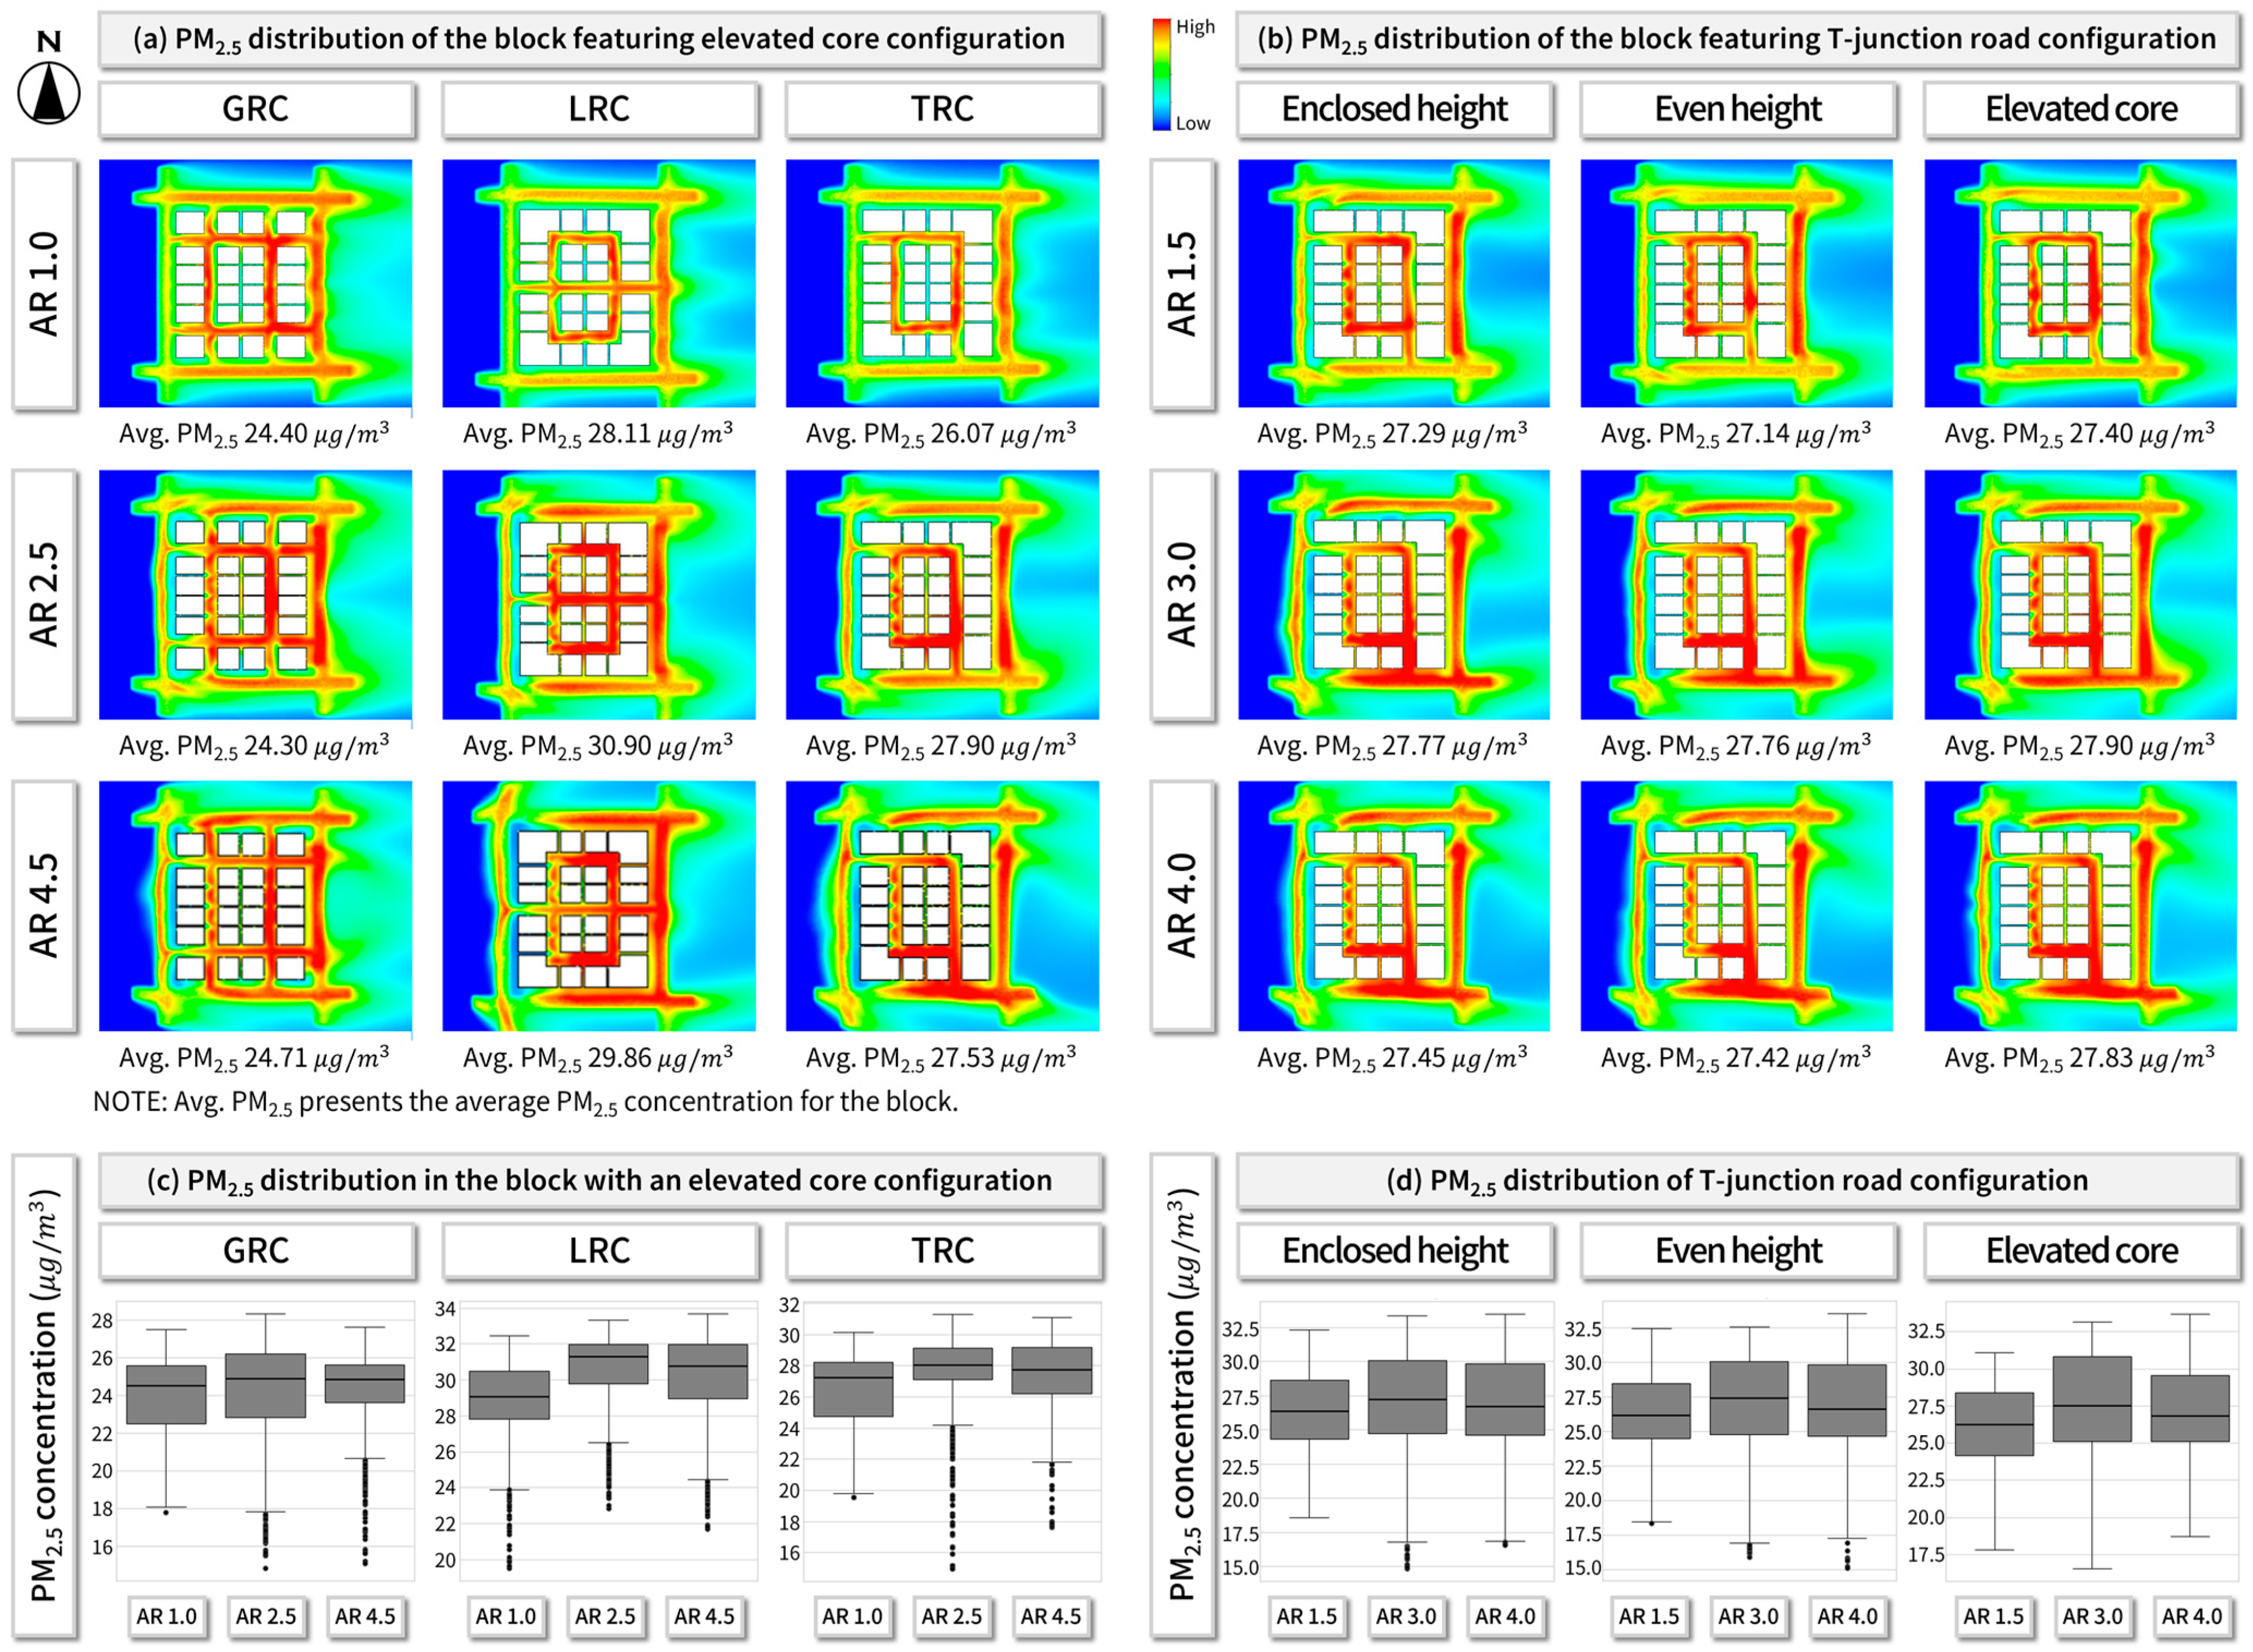
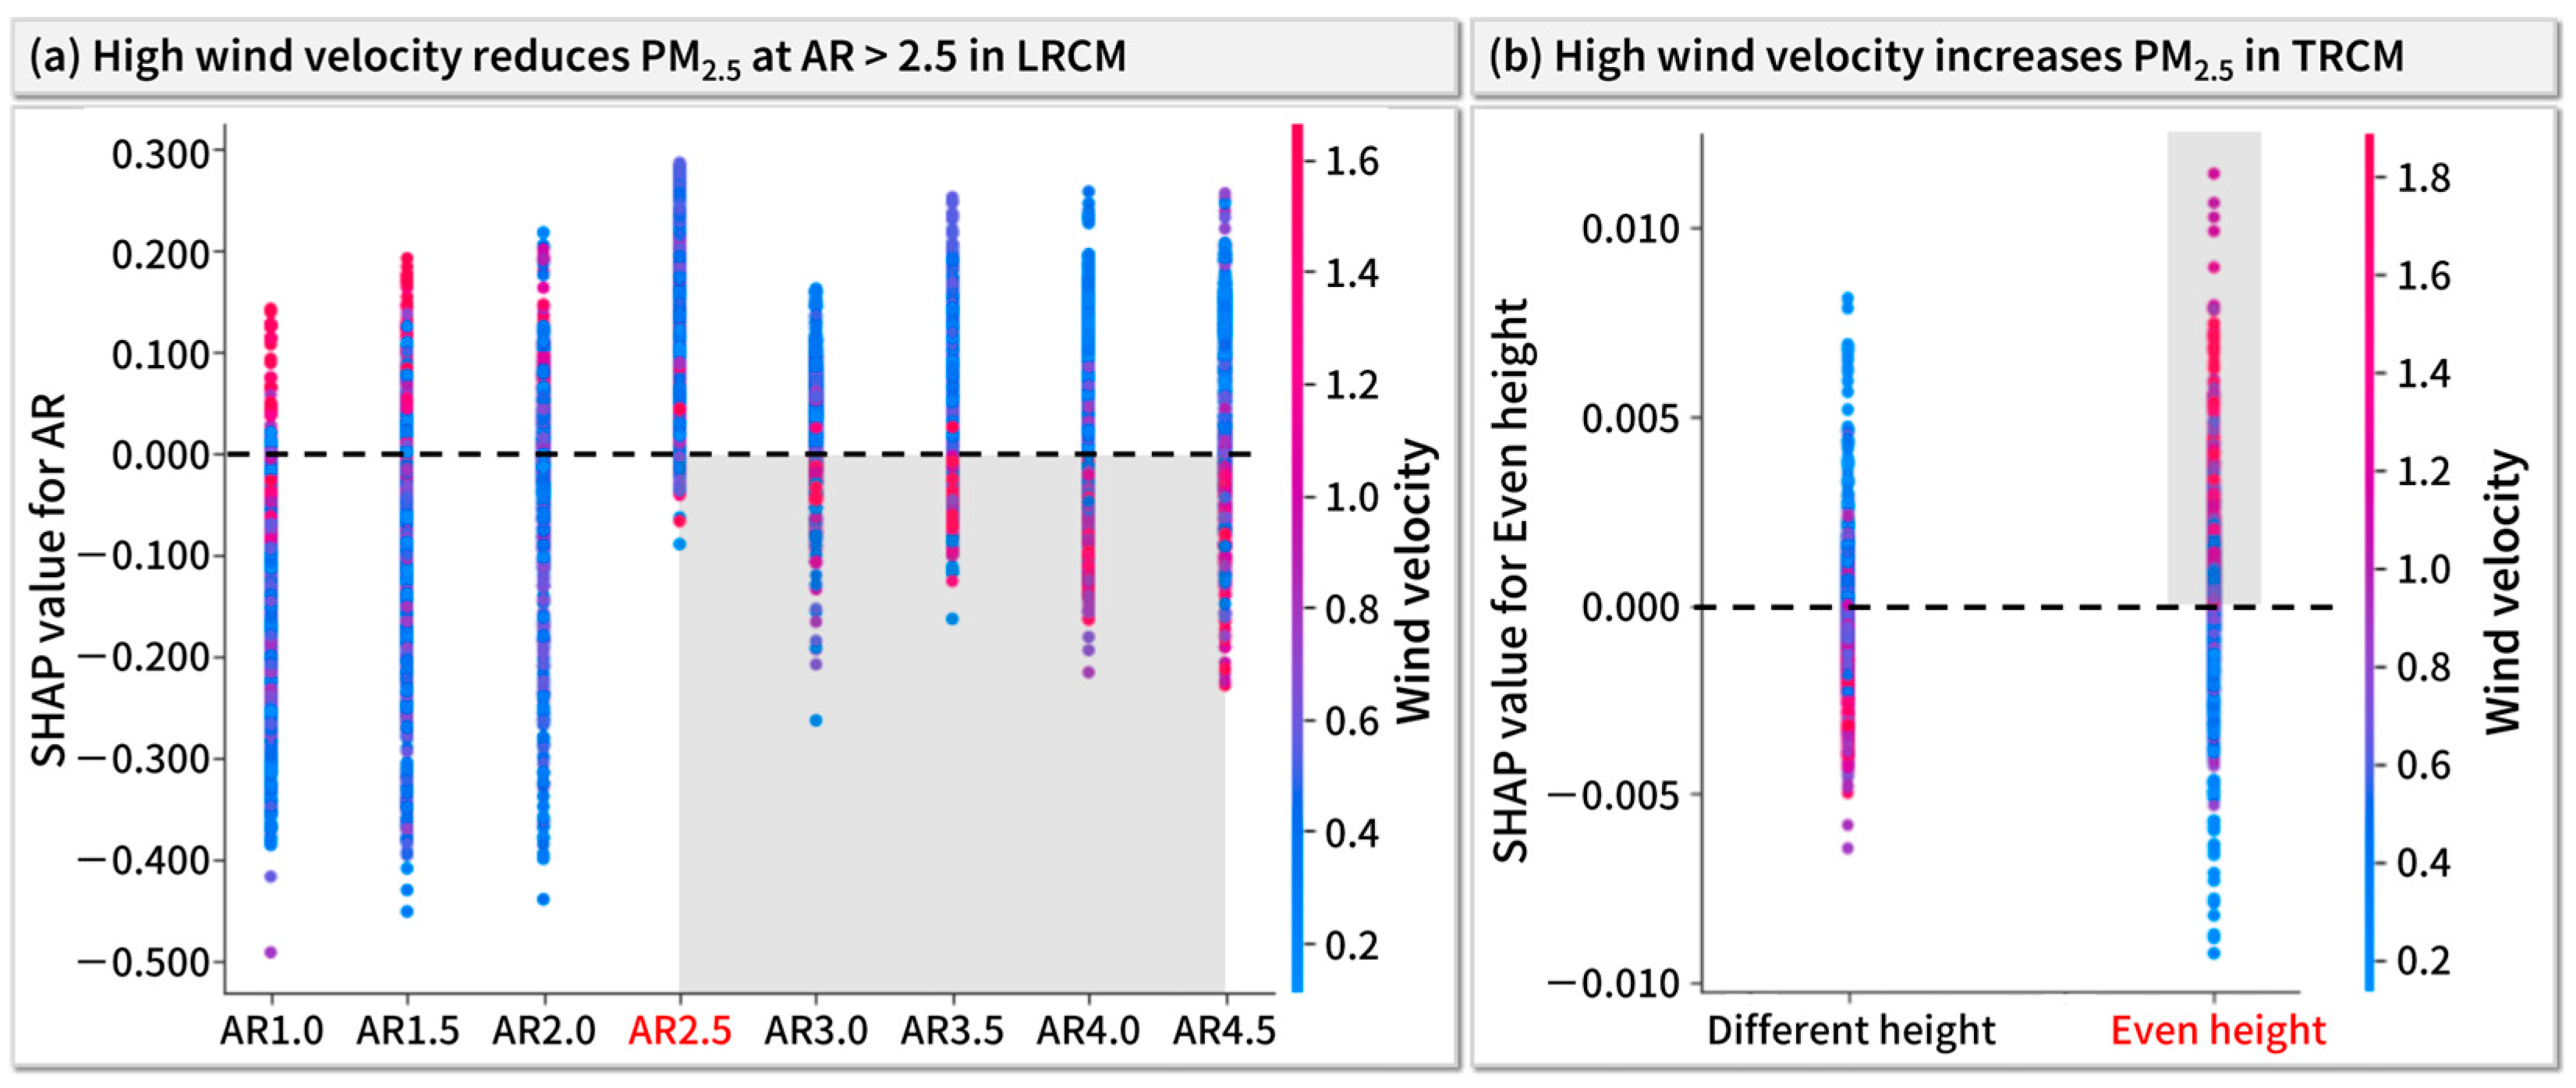
3.2. Factors Affecting Particulate Matter Dispersion in High-Density Urban Blocks

Figure 7 presents the results of the XGB model with SHAP interpretation. The findings indicate that the key factors influencing pollutant dispersion in high-density urban areas are wind velocity, distance from arterial roads, atmospheric pressure, and AR, which consistently ranked as the top four determinants.
In IRCM, which considers all road types, distance from arterial roads was the second most influential factor after wind velocity, followed by atmospheric pressure and AR. The analysis also highlights the significant impact of road type on pollutant concentration levels. Additionally, variables related to the configuration of block height and side-lot spacing influenced PM2.5 levels, though their impact was relatively less significant compared to meteorological conditions and road layout configuration.
Across all road configuration models, meteorological conditions, particularly wind velocity, consistently emerged as the most influential factor. Wind velocity generally exhibited a negative relationship with pollutant concentration, indicating that higher wind speeds contributed to lower PM2.5 levels. Similarly, atmospheric pressure was consistently identified as a significant factor across all models, also showing a negative correlation with pollutant concentration, further highlighting the role of meteorological conditions in pollutant dispersion.
Beyond meteorological factors, the impact of traffic emissions on pollutant concentration was analyzed using the network distance from emission sources, such as arterial roads and major intersections, where high levels of pollutants are typically generated. The results from the GRCM and TRCM show that pollutant concentrations decreased as the distance from arterial roads increased. Similarly, concentrations also declined with greater distance from three- or four-way intersections, suggesting that proximity to arterial roads and major intersections may contribute to pollutant accumulation. However, the LRCM showed the opposite trend, where the enclosed structure of loop roads restricted airflow and dispersion, causing higher pollutant concentrations as the distance from arterial roads increased.
The influence of urban morphology on PM dispersion varies across different road configuration models. In the GRCM, pollutant concentrations were higher in blocks with an elevated core configuration, where inner buildings were taller than outer buildings. In contrast, the LRCM exhibited the opposite trend, with higher pollutant concentrations observed in blocks with an enclosed height configuration, where perimeter buildings were taller than inner buildings.
In addition to block height configurations, side spaces between buildings also affect pollution levels, though their impact varies by model. In the LRCM, side spaces help reduce pollution levels, indicating improved ventilation in the enclosed loop-road environment. However, in the GRCM and TRCM, where grid and T-junction road layouts provide more open connections to arterial roads, side spaces tend to increase pollution levels within the block.
Furthermore, AR—defined as the ratio of average building height to road width—shows a positive relationship with pollutant concentration, indicating that higher AR values are associated with greater pollutant accumulation. Notably, AR plays a particularly significant role in determining pollutant concentration in the TRCM, where road geometry and airflow patterns may exacerbate pollutant retention more than in other models. These findings highlight the complex interplay of urban morphology factors, emphasizing the need for tailored design strategies that account for building height distribution, side spacing, and AR to optimize airflow dynamics and pollutant dispersion across different road configurations.

3.3. Interaction Effects Between Factors on Particulate Matter Concentration

This study also reveals the interaction between urban morphology and meteorological factors influencing PM concentration. While the findings from the GRCM and TRCM consistently show that lower AR values enhance particulate dispersion, the interaction analysis in the LRCM reveals a critical threshold effect. Specifically, when AR exceeds 2.5, high wind velocity counteracts PM2.5 accumulation, leading to lower concentrations despite the increased AR (Figure 8a). A similar interaction effect was observed in the TRCM. Specifically, in a T-junction road network with a uniform building height configuration, high wind velocity led to increased PM2.5 accumulation, resulting in higher pollutant concentrations (Figure 8b). This suggests that uniform building heights in T-junction road layouts may disrupt airflow patterns, leading to localized pollutant trapping under strong wind conditions.

4. Discussion

The findings of this study provide critical insights into how road configurations, building layouts, and urban geometry influence PM2.5 concentrations, contributing to urban planning and air quality management discussions. While previous studies have extensively examined pollutant dispersion within individual street canyons [69,70,71], there has been limited focus on PM2.5 distribution at the block level. This study addresses this gap by taking a holistic approach, demonstrating that the balance of building arrangement and height within a block plays a crucial role in shaping air quality. The findings highlight that in densely built environments, airflow dynamics and pollutant removal mechanisms vary largely based on road network type, underscoring the need for block-scale urban design strategies.
A key finding of the CFD simulation is that road configuration considerably determines PM2.5 concentration and dispersion. Among the road types examined, grid-road networks demonstrate the highest efficiency in pollutant dispersion, followed by T-junction roads, while loop-road networks are the least effective in pollutant removal. The open and interconnected nature of the grid layout enhances airflow, facilitating faster pollutant removal. In contrast, the enclosed structure of loop roads traps pollutants, leading to higher PM2.5 concentrations. These findings emphasize the need to incorporate road configuration strategies into urban planning policies, particularly in high-density areas, to improve air quality. The policy implications of these findings suggest that loop-road networks require interventions that enhance internal ventilation, while grid-road networks should focus on blocking emissions from external sources rather than relying solely on internal pollutant removal.
This study highlights the necessity of tailoring PM2.5 mitigation strategies to specific road configurations through building design interventions. The findings suggest that high-density urban planning should prioritize strategic building arrangements to balance pollutant dispersion and ventilation efficiency. In loop-road networks, a block configuration with taller central buildings can enhance pollutant removal, playing a role as crucial as wind velocity in air circulation. Policy strategies should promote centrally elevated buildings with side spaces functioning as pedestrian passages that connect the interior and exterior of the block, facilitating air exchange and reducing pollutant stagnation in the enclosed loop-road environment. In grid-road networks, the focus shifts from mitigating pollutant accumulation within the canyon to blocking emissions from arterial roads. Increasing perimeter building height while keeping inner buildings lower helps shield inner block areas from traffic emissions originating from arterial roads. Additionally, maintaining a lower AR and minimizing side spaces between buildings further support pollution mitigation in grid-road environments.
This study uncovers the interaction effects between urban morphology factors and meteorological conditions, expanding the understanding of how urban design strategies influence air quality. While existing research has examined the individual impacts of wind velocity and street canyon geometry [72,73], this study demonstrates that their effects are not independent. Instead, the interplay between morphological characteristics and meteorological factors shapes the effectiveness of urban design interventions, emphasizing the need for context-specific approaches to air pollution mitigation. A key finding from the interaction analysis is the threshold effect of AR: when AR exceeds 2.5, high wind velocity helps disperse PM2.5 accumulation, leading to lower pollution levels even in dense urban environments. While higher AR is generally linked to pollutant accumulation due to reduced ventilation [74], it also intensifies turbulence, influencing pollutant transport and dispersion [75]. Turbulent transport enhances vertical mixing, facilitating pollutant exchange between primary recirculation and the outer flow, which helps reduce buildup at pedestrian levels, particularly where strong turbulence disrupts stagnant air pockets [76]. Our findings align with previous field studies highlighting wind velocity as a key factor in PM2.5 dispersion [77,78]. Yin’s study identified a U-shaped relationship between wind speed and PM concentrations, showing that both low and high wind speeds contribute to higher PM levels compared to moderate speeds, underscoring the complexity of wind-PM interactions [77].
This suggests that optimizing wind corridors and building alignments in high-AR areas can largely improve pollutant dispersion. The implications are particularly relevant for high-density urban settings, such as Korea’s commercial districts, where most street canyons surpass this threshold. However, we acknowledge that dispersion mechanisms depend on the urban arrangement, core size, and local wind interactions, and the threshold effect at AR = 2.5 observed in our study may not be universally applicable across different urban layouts. Given these variations, policy interventions should prioritize aerodynamic considerations, such as creating ventilation corridors and minimizing excessive block enclosures that trap pollutants. To further refine these strategies, future studies should explore concentration decrease trends across diverse urban configurations [70,79,80].
These findings collectively demonstrate that integrating ML with CFD is a powerful approach to advancing urban air quality analysis. By dynamically refining predictions and improving simulations of complex fluid dynamics, this integration enhances the adaptability of pollutant dispersion models to evolving urban conditions [64]. Unlike traditional numerical models, which may have limited capacity to adjust to real-time data variations, ML-driven CFD analysis processes new information more efficiently [37,63,64,81], capturing the intricate interactions between urban morphology, road configurations, and meteorological factors.
This integration is crucial for urban areas, where proactive measures informed by high-accuracy predictions can largely improve air quality [63,64]. For example, ML-enhanced CFD simulations can support zoning regulations by identifying areas where building height and density adjustments can improve ventilation and pollutant dispersion. Furthermore, integrating ML-driven CFD analysis into early-stage urban planning processes can help optimize road network layouts, ensuring that new developments incorporate aerodynamic considerations to minimize pollution accumulation.
Despite the valuable insights gained from this study, certain limitations should be acknowledged. First, the CFD simulations were conducted under steady-state conditions, based on the prevailing westerlies in South Korea, which do not account for temporal variations in pollutant concentrations due to changing meteorological conditions, such as wind direction shifts. Additionally, microclimatic factors can influence airflow and pollutant dispersion in high-density urban areas. Urban morphological elements, including building height, volume, form, and layout, can modify wind flow, creating corner wind zones, stagnation areas, and pollutant accumulation [82]. Future studies should emphasize the importance of integrating both urban morphology and large-scale topographical influences to develop more effective air quality and airflow management strategies in cities.
Future research should incorporate simulations with diverse wind directions to better capture the dynamic nature of PM2.5 dispersion in urban environments [83,84,85]. Second, while this study incorporates urban morphology and meteorological factors, other aspects, such as pollutant emission levels and land-use patterns, were not explicitly examined. Broadening the analysis to include spatial variations in land use, emission source estimations, and validation with extended field data would enhance the robustness and applicability of the findings [86,87,88]. Moreover, advancing simulation methodologies to better reflect the complexities of real-world urban environments remains an important area for future research.

5. Conclusions

This study advances the understanding of PM2.5 dispersion in high-density urban environments by integrating CFD simulations with interpretable ML models, offering a data-driven approach to analyzing pollutant accumulation at the block scale. While traditional studies focus on individual street canyons, this research demonstrates that road configurations, building arrangements, and AR interact with meteorological conditions to shape air quality at a broader urban block level. The findings emphasize that pollutant dispersion efficiency varies greatly depending on road network type, with grid-road configurations facilitating better airflow and loop-road layouts contributing to pollutant stagnation. Furthermore, building height distribution and side spacing must be carefully considered within different road structures to optimize ventilation and mitigate PM2.5 concentrations. This highlights the need for context-specific interventions, as strategies effective for one road type may be counterproductive for another.
These findings offer practical guidance for urban planners and policymakers, highlighting the need for tailored urban design strategies to mitigate PM2.5 pollution effectively. Successful interventions must account for the interactions between road configurations, building layouts, and meteorological factors, ensuring that urban design enhances airflow dynamics while limiting pollutant accumulation. The relationship between AR and wind velocity further emphasizes the importance of aerodynamic design considerations, such as wind corridors and strategic building alignments, in improving urban air quality. By providing an evidence-based framework, this research offers urban planners and policymakers practical strategies to foster healthier, more resilient cities capable of addressing air pollution challenges in high-density environments.

Author Contributions

Conceptualization, J.L.; methodology, D.L. and J.L.; software, D.L. and C.A.M.B.; validation, D.L.; formal analysis, D.L. and C.A.M.B.; investigation, resources, data curation, D.L.; writing—original draft preparation, D.L., C.A.M.B. and J.L.; writing—review and editing, D.L. and J.L.; visualization, D.L. and C.A.M.B.; supervision, funding acquisition, J.L. All authors have read and agreed to the published version of the manuscript.

Funding

This research received no external funding.

Data Availability Statement

The raw data supporting the conclusions of this article will be made available by the authors on request.

Acknowledgments

This work was supported by the Chung-Ang University Graduate Research Scholarship in 2024 and the National Research Foundation of Korea (NRF) grant funded by the Korea government (MSIT) (RS-2025-00523493 and RS-2022-NR070694).

Conflicts of Interest

The authors declare no conflicts of interest.

Abbreviations

PM2.5Fine particulate matter
CFDComputational Fluid Dynamics
PMParticulate matter
MLMachine learning
RFRandom Forest
XGBoostExtreme Gradient Boosting
ARAspect ratio
SST k-ωShear-Stress Transport k-ω
GRCGrid road configuration
LRCLoop road configuration
TRCT-junction road configuration
DLDeep learning
SVMSupport Vector Machine
ANNArtificial Neural Network
CNNConvolutional Neural Network
IRCMIntegrated road configuration model
GRCMGrid road configuration model
LRCMLoop road configuration model
TRCMT-junction road configuration model
SHAPSHapley Addictive exPlanations

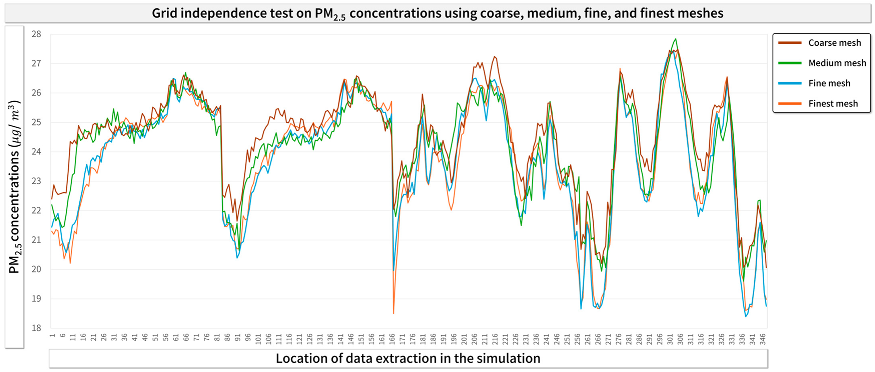
Appendix A. Grid Independence Test on PM2.5 Using Four Types of Meshes

Land 14 00632 i001

Appendix B. K-Fold Cross Validation Results (R2 and RMSE) for All Machine Learning Approach

Land 14 00632 i002

References

  1. Xing, Y.-F.; Xu, Y.-H.; Shi, M.-H.; Lian, Y.-X. The Impact of PM2.5 on the Human Respiratory System. J. Thorac. Dis. 2016, 8, E69–E74. [Google Scholar] [CrossRef] [PubMed]
  2. Hayes, R.B.; Lim, C.; Zhang, Y.; Cromar, K.; Shao, Y.; Reynolds, H.R.; Silverman, D.T.; Jones, R.R.; Park, Y.; Jerrett, M.; et al. PM2.5 Air Pollution and Cause-Specific Cardiovascular Disease Mortality. Int. J. Epidemiol. 2020, 49, 25–35. [Google Scholar] [CrossRef] [PubMed]
  3. Maji, K.J.; Dikshit, A.K.; Arora, M.; Deshpande, A. Estimating Premature Mortality Attributable to PM2.5 Exposure and Benefit of Air Pollution Control Policies in China for 2020. Sci. Total Environ. 2018, 612, 683–693. [Google Scholar] [CrossRef]
  4. Requia, W.J.; Dalumpines, R.; Adams, M.D.; Arain, A.; Ferguson, M.; Koutrakis, P. Modeling Spatial Patterns of Link-Based PM2.5 Emissions and Subsequent Human Exposure in a Large Canadian Metropolitan Area. Atmos. Environ. 2017, 158, 172–180. [Google Scholar] [CrossRef]
  5. Shi, K.; Wang, H.; Yang, Q.; Wang, L.; Sun, X.; Li, Y. Exploring the Relationships between Urban Forms and Fine Particulate (PM2.5) Concentration in China: A Multi-Perspective Study. J. Clean. Prod. 2019, 231, 990–1004. [Google Scholar] [CrossRef]
  6. Clark, L.P.; Millet, D.B.; Marshall, J.D. Air Quality and Urban Form in U.S. Urban Areas: Evidence from Regulatory Monitors. Environ. Sci. Technol. 2011, 45, 7028–7035. [Google Scholar] [CrossRef]
  7. Li, X.; Feng, Y.J.; Liang, H.Y. The Impact of Meteorological Factors on PM2.5 Variations in Hong Kong. IOP Conf. Ser. Earth Environ. Sci. 2017, 78, 012003. [Google Scholar] [CrossRef]
  8. Guo, X.; Zhang, M.; Gao, Z.; Zhang, J.; Buccolieri, R. Neighborhood-Scale Dispersion of Traffic-Related PM2.5: Simulations of Nine Typical Residential Cases from Nanjing. Sustain. Cities Soc. 2023, 90, 104393. [Google Scholar] [CrossRef]
  9. Wang, F.; Peng, Y.; Jiang, C. Influence of Road Patterns on PM2.5 Concentrations and the Available Solutions: The Case of Beijing City, China. Sustainability 2017, 9, 217. [Google Scholar] [CrossRef]
  10. Chen, M.; Dai, F.; Yang, B.; Zhu, S. Effects of Neighborhood Green Space on PM2.5 Mitigation: Evidence from Five Megacities in China. Build. Environ. 2019, 156, 33–45. [Google Scholar] [CrossRef]
  11. Li, Z.; Fung, J.C.H.; Lau, A.K.H. High Spatiotemporal Characterization of On-Road PM2.5 Concentrations in High-Density Urban Areas Using Mobile Monitoring. Build. Environ. 2018, 143, 196–205. [Google Scholar] [CrossRef]
  12. Ke, B.; Hu, W.; Huang, D.; Zhang, J.; Lin, X.; Li, C.; Jin, X.; Chen, J. Three-Dimensional Building Morphology Impacts on PM2.5 Distribution in Urban Landscape Settings in Zhejiang, China. Sci. Total Environ. 2022, 826, 154094. [Google Scholar] [CrossRef] [PubMed]
  13. Hong, B.; Lin, B.; Qin, H. Numerical Investigation on the Effect of Avenue Trees on PM2.5 Dispersion in Urban Street Canyons. Atmosphere 2017, 8, 129. [Google Scholar] [CrossRef]
  14. Chatzimichailidis, A.E.; Argyropoulos, C.D.; Assael, M.J.; Kakosimos, K.E. Qualitative and Quantitative Investigation of Multiple Large Eddy Simulation Aspects for Pollutant Dispersion in Street Canyons Using OpenFOAM. Atmosphere 2019, 10, 17. [Google Scholar] [CrossRef]
  15. Li, F.; Rubinato, M.; Zhou, T.; Li, J.; Chen, C. Numerical Simulation of the Influence of Building-Tree Arrangements on Wind Velocity and PM2.5 Dispersion in Urban Communities. Sci. Rep. 2022, 12, 16378. [Google Scholar] [CrossRef]
  16. Hassan, A.M.; ELMokadem, A.A.; Megahed, N.A.; Abo Eleinen, O.M. Urban Morphology as a Passive Strategy in Promoting Outdoor Air Quality. J. Build. Eng. 2020, 29, 101204. [Google Scholar] [CrossRef]
  17. Liu, Y.; Miao, C.; Cui, A.; Wang, D. Spatial Distribution of Air Pollutants in Different Urban Functional Zones Based on Mobile Monitoring and CFD Simulation. Int. J. Environ. Sci. Technol. 2024, 1–14. [Google Scholar] [CrossRef]
  18. Chung, C.-Y.; Chung, P.-L. A Numerical and Experimental Study of Pollutant Dispersion in a Traffic Tunnel. Environ. Monit. Assess. 2007, 130, 289–299. [Google Scholar] [CrossRef]
  19. Miao, Y.; Liu, S.; Chen, B.; Zhang, B.; Wang, S.; Li, S. Simulating Urban Flow and Dispersion in Beijing by Coupling a CFD Model with the WRF Model. Adv. Atmos. Sci. 2013, 30, 1663–1678. [Google Scholar] [CrossRef]
  20. Chang, S.; Jiang, Q.; Zhao, Y. Integrating CFD and GIS into the Development of Urban Ventilation Corridors: A Case Study in Changchun City, China. Sustainability 2018, 10, 1814. [Google Scholar] [CrossRef]
  21. Fernández-Pacheco, V.M.; Álvarez-Álvarez, E.; Blanco-Marigorta, E.; Ackermann, T. CFD Model to Study PM 10 Dispersion in Large-Scale Open Spaces. Sci. Rep. 2023, 13, 5966. [Google Scholar] [CrossRef] [PubMed]
  22. Zhou, S.; Lin, R. Spatial-Temporal Heterogeneity of Air Pollution: The Relationship between Built Environment and on-Road PM2.5 at Micro Scale. Transp. Res. Part D Transp. Environ. 2019, 76, 305–322. [Google Scholar] [CrossRef]
  23. Gulia, S.; Shiva Nagendra, S.M.; Khare, M.; Khanna, I. Urban Air Quality Management-A Review. Atmos. Pollut. Res. 2015, 6, 286–304. [Google Scholar] [CrossRef]
  24. Bao, H.; Shan, L.; Wang, Y.; Jiang, Y.; Lee, C.; Cui, X. How Does Local Real Estate Investment Influence Neighborhood PM2.5 Concentrations? A Spatial Econometric Analysis. Land 2021, 10, 518. [Google Scholar] [CrossRef]
  25. Hoek, G.; Beelen, R.; de Hoogh, K.; Vienneau, D.; Gulliver, J.; Fischer, P.; Briggs, D. A Review of Land-Use Regression Models to Assess Spatial Variation of Outdoor Air Pollution. Atmos. Environ. 2008, 42, 7561–7578. [Google Scholar] [CrossRef]
  26. Kim, H.; Hong, S. Relationship between Land-Use Type and Daily Concentration and Variability of PM10 in Metropolitan Cities: Evidence from South Korea. Land 2022, 11, 23. [Google Scholar] [CrossRef]
  27. Zhang, Z.; Shan, B.; Lin, Q.; Chen, Y.; Yu, X. Influence of the Spatial Distribution Pattern of Buildings on the Distribution of PM2.5 Concentration. Stoch Environ. Res Risk Assess 2022, 36, 985–997. [Google Scholar] [CrossRef]
  28. Chen, G.; Li, S.; Knibbs, L.D.; Hamm, N.A.S.; Cao, W.; Li, T.; Guo, J.; Ren, H.; Abramson, M.J.; Guo, Y. A Machine Learning Method to Estimate PM2.5 Concentrations across China with Remote Sensing, Meteorological and Land Use Information. Sci. Total Environ. 2018, 636, 52–60. [Google Scholar] [CrossRef]
  29. Cui, P.; Dai, C.; Zhang, J.; Li, T. Assessing the Effects of Urban Morphology Parameters on PM2.5 Distribution in Northeast China Based on Gradient Boosted Regression Trees Method. Sustainability 2022, 14, 2618. [Google Scholar] [CrossRef]
  30. Zamani Joharestani, M.; Cao, C.; Ni, X.; Bashir, B.; Talebiesfandarani, S. PM2.5 Prediction Based on Random Forest, XGBoost, and Deep Learning Using Multisource Remote Sensing Data. Atmosphere 2019, 10, 373. [Google Scholar] [CrossRef]
  31. Ren, L.; An, F.; Su, M.; Liu, J. Exposure Assessment of Traffic-Related Air Pollution Based on CFD and BP Neural Network and Artificial Intelligence Prediction of Optimal Route in an Urban Area. Buildings 2022, 12, 1227. [Google Scholar] [CrossRef]
  32. Jiang, Z.; Cheng, H.; Zhang, P.; Kang, T. Influence of Urban Morphological Parameters on the Distribution and Diffusion of Air Pollutants: A Case Study in China. J. Environ. Sci. 2021, 105, 163–172. [Google Scholar] [CrossRef] [PubMed]
  33. Kwak, K.-H.; Baik, J.-J.; Ryu, Y.-H.; Lee, S.-H. Urban Air Quality Simulation in a High-Rise Building Area Using a CFD Model Coupled with Mesoscale Meteorological and Chemistry-Transport Models. Atmos. Environ. 2015, 100, 167–177. [Google Scholar] [CrossRef]
  34. Huang, C.; Hu, T.; Duan, Y.; Li, Q.; Chen, N.; Wang, Q.; Zhou, M.; Rao, P. Effect of Urban Morphology on Air Pollution Distribution in High-Density Urban Blocks Based on Mobile Monitoring and Machine Learning. Build. Environ. 2022, 219, 109173. [Google Scholar] [CrossRef]
  35. Liu, X.; Shi, X.-Q.; Li, X.-B.; Peng, Z.-R. Quantification of Multifactorial Effects on Particle Distributions at Urban Neighborhood Scale Using Machine Learning and Unmanned Aerial Vehicle Measurement. J. Clean. Prod. 2022, 378, 134494. [Google Scholar] [CrossRef]
  36. Lange, M.; Suominen, H.; Kurppa, M.; Järvi, L.; Oikarinen, E.; Savvides, R.; Puolamäki, K. Machine-Learning Models to Replicate Large-Eddy Simulations of Air Pollutant Concentrations along Boulevard-Type Streets. Geosci. Model Dev. 2021, 14, 7411–7424. [Google Scholar] [CrossRef]
  37. Panchigar, D.; Kar, K.; Shukla, S.; Mathew, R.M.; Chadha, U.; Selvaraj, S.K. Machine Learning-Based CFD Simulations: A Review, Models, Open Threats, and Future Tactics. Neural Comput. Appl. 2022, 34, 21677–21700. [Google Scholar] [CrossRef]
  38. Wang, R.; Kim, J.-H.; Li, M.-H. Predicting Stream Water Quality under Different Urban Development Pattern Scenarios with an Interpretable Machine Learning Approach. Sci. Total Environ. 2021, 761, 144057. [Google Scholar] [CrossRef]
  39. Pantusheva, M.; Mitkov, R.; Hristov, P.O.; Petrova-Antonova, D. Air Pollution Dispersion Modelling in Urban Environment Using CFD: A Systematic Review. Atmosphere 2022, 13, 1640. [Google Scholar] [CrossRef]
  40. Wu, Q.; Wang, Y.; Sun, H.; Lin, H.; Zhao, Z. A System Coupled GIS and CFD for Atmospheric Pollution Dispersion Simulation in Urban Blocks. Atmosphere 2023, 14, 832. [Google Scholar] [CrossRef]
  41. Makvandi, M.; Yuan, P.F.; Ji, Q.; Li, C.; Elsadek, M.; Li, W.; Hassan, A.; Li, Y. Resilience to Climate Change by Improving Air Circulation Efficiency and Pollutant Dispersion in Cities: A 3D-UFO Approach to Urban Block Design. Heliyon 2024, 10, e36904. [Google Scholar] [CrossRef] [PubMed]
  42. Menter, F. Zonal Two Equation K-w Turbulence Models For Aerodynamic Flows. In Proceedings of the 23rd Fluid Dynamics, Plasmadynamics, and Lasers Conference, Orlando, FL, USA, 6 July 1993; American Institute of Aeronautics and Astronautics: Reston, VA, USA, 1993. [Google Scholar]
  43. Menter, F.R. Two-Equation Eddy-Viscosity Turbulence Models for Engineering Applications. AIAA J. 1994, 32, 1598–1605. [Google Scholar] [CrossRef]
  44. Yuan, C.; Ng, E.; Norford, L.K. Improving Air Quality in High-Density Cities by Understanding the Relationship between Air Pollutant Dispersion and Urban Morphologies. Build. Environ. 2014, 71, 245–258. [Google Scholar] [CrossRef] [PubMed]
  45. Kummitha, O.R.; Kumar, R.V.; Krishna, V.M. CFD Analysis for Airflow Distribution of a Conventional Building Plan for Different Wind Directions. J. Comput. Des. Eng. 2021, 8, 559–569. [Google Scholar] [CrossRef]
  46. ANSYS Inc. ANSYS FLUENT Theory Guide; ANSYS Inc.: Canonsburg, PA, USA, 2023. [Google Scholar]
  47. Zhang, Z.; Chen, Q. Experimental Measurements and Numerical Simulations of Particle Transport and Distribution in Ventilated Rooms. Atmos. Environ. 2006, 40, 3396–3408. [Google Scholar] [CrossRef]
  48. Spalding, D.B. Mixing and Chemical Reaction in Steady Confined Turbulent Flames. Symp. Int. Combust. 1971, 13, 649–657. [Google Scholar] [CrossRef]
  49. Wang, X.; McNamara, K.F. Evaluation of CFD Simulation Using RANS Turbulence Models for Building Effects on Pollutant Dispersion. Environ. Fluid Mech. 2006, 6, 181–202. [Google Scholar] [CrossRef]
  50. Tominaga, Y.; Mochida, A.; Yoshie, R.; Kataoka, H.; Nozu, T.; Yoshikawa, M.; Shirasawa, T. AIJ Guidelines for Practical Applications of CFD to Pedestrian Wind Environment around Buildings. J. Wind Eng. Ind. Aerodyn. 2008, 96, 1749–1761. [Google Scholar] [CrossRef]
  51. Jia, Y.-P.; Lu, K.-F.; Zheng, T.; Li, X.-B.; Liu, X.; Peng, Z.-R.; He, H.-D. Effects of Roadside Green Infrastructure on Particle Exposure: A Focus on Cyclists and Pedestrians on Pathways between Urban Roads and Vegetative Barriers. Atmos. Pollut. Res. 2021, 12, 1–12. [Google Scholar] [CrossRef]
  52. Hang, J.; Li, Y.; Sandberg, M.; Buccolieri, R.; Di Sabatino, S. The Influence of Building Height Variability on Pollutant Dispersion and Pedestrian Ventilation in Idealized High-Rise Urban Areas. Build. Environ. 2012, 56, 346–360. [Google Scholar] [CrossRef]
  53. Han, J.; Lee, J. A Comparative Study of Air Pollution Levels in Different Urban Street Configurations in Pangyo New Town, South Korea. Build. Environ. 2023, 243, 110695. [Google Scholar] [CrossRef]
  54. Antoniou, N.; Montazeri, H.; Neophytou, M.; Blocken, B. CFD Simulation of Urban Microclimate: Validation Using High4Resolution Field Measurements. Sci. Total Environ. 2019, 695, 133743. [Google Scholar] [CrossRef] [PubMed]
  55. Elraouf, R.A.; ELMokadem, A.; Megahed, N.; Eleinen, O.A.; Eltarabily, S. Evaluating Urban Outdoor Thermal Comfort: A Validation of ENVI-Met Simulation through Field Measurement. J. Build. Perform. Simul. 2022, 15, 268–286. [Google Scholar] [CrossRef]
  56. Toparlar, Y.; Blocken, B.; Vos, P.; van Heijst, G.J.F.; Janssen, W.D.; van Hooff, T.; Montazeri, H.; Timmermans, H.J.P. CFD Simulation and Validation of Urban Microclimate: A Case Study for Bergpolder Zuid, Rotterdam. Build. Environ. 2015, 83, 79–90. [Google Scholar] [CrossRef]
  57. Md Saad, Z.; Rasdi, I.; Zainal Abidin, E. Indoor Air Quality and Prevalence of Sick Building Syndrome among University Laboratory Workers. Sci. Basic Appl. Res. 2016, 29, 130–140. [Google Scholar]
  58. Rodes, C.E.; Thornburg, J.W. Breathing Zone Exposure Assessment. In Aerosols Handbook; CRC Press: Boca Raton, FL, USA, 2004; pp. 77–90. [Google Scholar]
  59. Thornburg, J.; Kominsky, J.; Brown, G.G.; Frechtel, P.; Barrett, W.; Shaul, G. A Model to Predict the Breathing Zone Concentrations of Particles Emitted from Surfaces. J. Environ. Monit. 2010, 12, 973–980. [Google Scholar] [CrossRef]
  60. Feng, H.; Feng, H. Correlation Analysis Between PM2.5 Concentration and Meteorological, Vegetation and Topographical Factors in the Urbanized Ecosystem in Beijing, China. NEPT 2020, 19, 1399–1410. [Google Scholar] [CrossRef]
  61. Kubota, T.; Miura, M.; Tominaga, Y.; Mochida, A. Wind Tunnel Tests on the Relationship between Building Density and Pedestrian-Level Wind Velocity: Development of Guidelines for Realizing Acceptable Wind Environment in Residential Neighborhoods. Build. Environ. 2008, 43, 1699–1708. [Google Scholar] [CrossRef]
  62. Hanna, B.N.; Dinh, N.T.; Youngblood, R.W.; Bolotnov, I.A. Machine-Learning Based Error Prediction Approach for Coarse-Grid Computational Fluid Dynamics (CG-CFD). Prog. Nucl. Energy 2020, 118, 103140. [Google Scholar] [CrossRef]
  63. Hashad, K.; Gu, J.; Yang, B.; Rong, M.; Chen, E.; Ma, X.; Zhang, K.M. Designing Roadside Green Infrastructure to Mitigate Traffic-Related Air Pollution Using Machine Learning. Sci. Total Environ. 2021, 773, 144760. [Google Scholar] [CrossRef]
  64. Liu, X.; Shi, X.-Q.; Peng, Z.-R.; He, H.-D. Quantifying the Effects of Urban Fabric and Vegetation Combination Pattern to Mitigate Particle Pollution in Near-Road Areas Using Machine Learning. Sustain. Cities Soc. 2023, 93, 104524. [Google Scholar] [CrossRef]
  65. Wu, C.; He, H.; Song, R.; Peng, Z. Prediction of Air Pollutants on Roadside of the Elevated Roads with Combination of Pollutants Periodicity and Deep Learning Method. Build. Environ. 2022, 207, 108436. [Google Scholar] [CrossRef]
  66. Snoek, J.; Larochelle, H.; Adams, R.P. Practical Bayesian Optimization of Machine Learning Algorithms. Adv. Neural Inf. Process. Syst. 2012, 25, 2951–2959. [Google Scholar]
  67. Shapley, L.S. Stochastic Games*. Proc. Natl. Acad. Sci. USA 1953, 39, 1095–1100. [Google Scholar] [CrossRef]
  68. Lundberg, S.M.; Lee, S.-I. Consistent Feature Attribution for Tree Ensembles. arXiv 2017, arXiv:1706.06060. [Google Scholar]
  69. Chan, T.L.; Dong, G.; Leung, C.W.; Cheung, C.S.; Hung, W.T. Validation of a Two-Dimensional Pollutant Dispersion Model in an Isolated Street Canyon. Atmos. Environ. 2002, 36, 861–872. [Google Scholar] [CrossRef]
  70. Huang, Y.-D.; Xu, X.; Liu, Z.-Y.; Deng, J.-T.; Kim, C.-N. Impacts of Shape and Height of Building Roof on Airflow and Pollutant Dispersion inside an Isolated Street Canyon. Environ. Forensics 2016, 17, 361–379. [Google Scholar] [CrossRef]
  71. Huang, Y.-D.; Hou, R.-W.; Liu, Z.-Y.; Song, Y.; Cui, P.-Y.; Kim, C.-N. Effects of Wind Direction on the Airflow and Pollutant Dispersion inside a Long Street Canyon. Aerosol Air Qual. Res. 2019, 19, 1152–1171. [Google Scholar] [CrossRef]
  72. Murena, F.; Mele, B. Effect of Short–Time Variations of Wind Velocity on Mass Transfer Rate between Street Canyons and the Atmospheric Boundary Layer. Atmos. Pollut. Res. 2014, 5, 484–490. [Google Scholar] [CrossRef]
  73. Klein, P.M.; Galvez, J.M. Flow and Turbulence Characteristics in a Suburban Street Canyon. Environ. Fluid Mech. 2015, 15, 419–438. [Google Scholar] [CrossRef]
  74. Li, X.-X.; Liu, C.-H.; Leung, D.Y.C. Large-Eddy Simulation of Flow and Pollutant Dispersion in High-Aspect-Ratio Urban Street Canyons with Wall Model. Bound.-Layer Meteorol. 2008, 129, 249–268. [Google Scholar] [CrossRef]
  75. Liu, C.-H.; Barth, M.C.; Leung, D.Y. Large-Eddy Simulation of Flow and Pollutant Transport in Street Canyons of Different Building-Height-to-Street-Width Ratios. J. Appl. Meteorol. 2004, 43, 1410–1424. [Google Scholar] [CrossRef]
  76. Li, X.-X.; Liu, C.-H.; Leung, D.Y. Numerical Investigation of Pollutant Transport Characteristics inside Deep Urban Street Canyons. Atmos. Environ. 2009, 43, 2410–2418. [Google Scholar] [CrossRef]
  77. Yin, Q.; Wang, J.; Hu, M.; Wong, H. Estimation of Daily PM2.5 Concentration and Its Relationship with Meteorological Conditions in Beijing. J. Environ. Sci. 2016, 48, 161–168. [Google Scholar] [CrossRef]
  78. Zhang, B.; Jiao, L.; Xu, G.; Zhao, S.; Tang, X.; Zhou, Y.; Gong, C. Influences of Wind and Precipitation on Different-Sized Particulate Matter Concentrations (PM2.5, PM10, PM2.5–10). Meteorol. Atmos. Phys. 2018, 130, 383–392. [Google Scholar] [CrossRef]
  79. Chew, L.W.; Norford, L.K. Pedestrian-Level Wind Speed Enhancement in Urban Street Canyons with Void Decks. Build. Environ. 2018, 146, 64–76. [Google Scholar] [CrossRef]
  80. Baik, J.-J.; Kwak, K.-H.; Park, S.-B.; Ryu, Y.-H. Effects of Building Roof Greening on Air Quality in Street Canyons. Atmos. Environ. 2012, 61, 48–55. [Google Scholar] [CrossRef]
  81. Yeom, S.H.; Na, J.S.; Jung, H.-D.; Cho, H.-J.; Choi, Y.J.; Lee, J.S. Computational Analysis of Airflow Dynamics for Predicting Collapsible Sites in the Upper Airways: Machine Learning Approach. J. Appl. Physiol. 2019, 127, 959–973. [Google Scholar] [CrossRef]
  82. Yang, J.; Shi, B.; Shi, Y.; Marvin, S.; Zheng, Y.; Xia, G. Air Pollution Dispersal in High Density Urban Areas: Research on the Triadic Relation of Wind, Air Pollution, and Urban Form. Sustain. Cities Soc. 2020, 54, 101941. [Google Scholar] [CrossRef]
  83. Hong, B.; Lin, B.; Qin, H. Numerical Investigation on the Coupled Effects of Building-Tree Arrangements on Fine Particulate Matter (PM2.5) Dispersion in Housing Blocks. Sustain. Cities Soc. 2017, 34, 358–370. [Google Scholar] [CrossRef]
  84. Pan, J.; Ji, J. Influence of Building Height Variation on Air Pollution Dispersion in Different Wind Directions: A Numerical Simulation Study. Appl. Sci. 2024, 14, 979. [Google Scholar] [CrossRef]
  85. Gromke, C.; Ruck, B. Pollutant Concentrations in Street Canyons of Different Aspect Ratio with Avenues of Trees for Various Wind Directions. Bound.-Layer Meteorol 2012, 144, 41–64. [Google Scholar] [CrossRef]
  86. Song, X.; Zhang, Y.; Zhang, G.; Zhao, Y. Factors Evaluation of PM2.5 Diffusion in Street Canyons in Dalian Based on Numerical Simulation. Build. Simul. 2025, 18, 619–639. [Google Scholar] [CrossRef]
  87. Wang, B.; Li, Y.; Tang, Z.; Cai, N.; Niu, H. Effects of Vehicle Emissions on the PM2.5 Dispersion and Intake Fraction in Urban Street Canyons. J. Clean. Prod. 2021, 324, 129212. [Google Scholar] [CrossRef]
  88. Wang, W.; Chen, H.; Lai, Y. Modeling Airflow Dynamics and Their Effects on PM2.5 Concentrations in Urban Ventilation Corridors of Hangzhou. Sci. Total Environ. 2024, 957, 177794. [Google Scholar] [CrossRef]
Figure 1. Research framework for integrating computational fluid domain (CFD) simulation and machine learning (ML).
Land 14 00632 g001
Figure 2. (a) Computational domain and boundary conditions, (b) scale of representative geometry models reflecting different road layout configurations, and (c) location and shape of emission sources.
Land 14 00632 g002
Figure 3. (a) Combination of three road patterns, three block height configurations, and eight AR levels and (b) a total of 72 idealized geometry scenarios.
Land 14 00632 g003
Figure 4. PM2.5 distribution for each geometry model presented in the CFD simulation results: (a) PM2.5 distribution in the block with an elevated core configuration, (b) PM2.5 distribution in the block with TRC, (c) box plot of PM2.5 distribution in the block with an elevated core configuration, and (d) box plot of PM2.5 distribution of T-junction on road configuration.
Land 14 00632 g004
Figure 5. (a) Field measurement site in Pangyo. (b) Simplified geometry model and comparison locations, where (A, E), (C, G), and I are points within street canyons with different ARs, D is the corner point of Loop roads, and H is the corner point of T-junction roads. (c) CFD-validated simulation results for the field measurement site.
Land 14 00632 g005
Figure 6. PM2.5 prediction model performance results for (a) RF, (b) XGBoost, (c) SVM, (d) ANN, and (e) CNN models.
Land 14 00632 g006
Figure 7. Variable importance and SHAP analysis results for (a) integrated road configuration model (IRCM), (b) grid road configuration Model (GRCM), (c) loop-road configuration model (LRCM), and (d) T-junction road configuration model (TRCM).
Land 14 00632 g007
Figure 8. Effect of wind velocity on PM2.5 concentration. (a) High wind velocity reduces PM2.5 at AR > 2.5. (b) In a T-junction network, it increases PM2.5 accumulation.
Land 14 00632 g008
Table 1. Explanatory variables and their value range of the machine learning model.
VariablesVariables’ Value Range
Urban morphology factorsRoad layout configurationGRC, LRC, and TRC
Aspect ratio configuration1, 1.5, 2, 2.5, 3, 3.5, 4, and 4.5
Block height configurationEnclosed height configuration
Even height configuration
Elevated core configuration
Side space between buildingsExistence (1) and absence (0)
Traffic-related
factors
Distance from arterial roadsNetwork distance from a central line of arterial roads or the center of each intersection
Distance from two-way intersection
Distance from three-way intersection
Distance from four-way intersection
Meteorological
factors
Wind velocityData Extracted from CFD simulation results
Atmospheric pressure
Table 2. Hyperparameter tuning results using Gaussian process-based optimization.
ML ModelsParametersIRCM *GRCM *LRCM *TRCM *
RFMax depth12101212
Max features119811
Min sample split10101010
Min sample leaf10101010
N estimators2000165820001855
XGBoostMax depth12121512
N estimators234899988997
Learning rate0.0900.0190.3890.172
Subsample ratio0.9230.2030.8650.462
Subsampling ratio by tree0.9970.9340.9750.842
SVMRegularization parameter4.3613.3961.7951.796
Epsilon0.0020.0010.0010.000
Kernelrbfrbfrbfrbf
ANNHidden layer sizes500199378477
Alpha0.00010.00010.00010.0247
Activationtanhtanhtanhlogistic
Learning rate0.0010.0010.0010.001
CNNFilters1616128128
Kernel size3232
Dropout rate0.3700.1000.1030.322
Learning rate0.0090.0100.0030.008
* Note: IRCM is the Integrated Road Configuration Model; GRCM is the Grid Road Configuration Model; LRCM is the Loop Road Configuration Model, and TRCM is the T-Junction Road Configuration Model.
Table 3. Model performance comparison.
ML ModelsIRCMGRCMLRCMTRCM
R2RMSER2RMSER2RMSER2RMSE
RF0.870.030.890.030.840.030.840.03
XGBoost0.930.020.930.020.910.020.950.02
SVM0.750.040.760.040.710.050.700.05
ANN0.710.040.730.040.630.040.650.05
CNN0.480.060.720.030.550.040.580.05
Disclaimer/Publisher’s Note: The statements, opinions and data contained in all publications are solely those of the individual author(s) and contributor(s) and not of MDPI and/or the editor(s). MDPI and/or the editor(s) disclaim responsibility for any injury to people or property resulting from any ideas, methods, instructions or products referred to in the content.

