Article

Spatial Correlation between Water Resources and Rural Settlements in the Yanhe Watershed Based on Bivariate Spatial Autocorrelation Methods

1
School of Architecture, Chang’an University, Xi’an 710061, China
2
Engineering Research Center of Collaborative Planning of Low-Carbon Urban Space and Transportation, Universities of Shaanxi Province, Xi’an 710061, China
3
Future Urban Space (Shaanxi) Planning and Design Co., Ltd., Xi’an 710082, China
*
Author to whom correspondence should be addressed.
Land 2023, 12(9), 1719; https://doi.org/10.3390/land12091719
Submission received: 1 August 2023 / Revised: 30 August 2023 / Accepted: 1 September 2023 / Published: 3 September 2023
(This article belongs to the Special Issue Agricultural Land Use and Rural Development)

Abstract

:
The production–living–ecological functions of rural settlements are closely tied to water resources, which are the primary influencing factors of the spatial characteristics of rural settlements. However, the specific relationship between water resources and the spatial characteristics of rural settlements remains unclear. Understanding the interrelationship between the two can better safeguard the ecological pattern of the basin and optimize the living environment of settlements. This study utilized multi-source data to calculate the water yield, water demand, and ecological surplus or deficit of water resources in the Yanhe watershed. We quantified the spatial characteristics of rural settlements and employed bivariate spatial autocorrelation methods to analyze the spatial correlation between water resources and the spatial distribution, scale, and boundary form of rural settlements in the Yanhe watershed. The results show the following: ➀ Seven sub-basins in the upper reaches exhibit a severe ecological deficit in water resources, with insufficient water resources to support the demands of regional socio-economic development. The middle and lower reaches have achieved a balance between water supply and demand. ➁ Rural settlements are most densely distributed in the middle reaches, with the smallest area scale, exhibiting a transitional spatial characteristic towards the upstream and downstream ends. ➂ The Moran’s I values of spatial aggregation and morphological index of rural settlements with respect to the ecological surplus or deficit of water resources are 0.36 and 0.50, respectively, indicating a strong positive correlation. The Moran’s I value of the area scale with respect to the ecological surplus or deficit of water resources is −0.60, indicating a significant negative correlation. This research has important practical significance for guiding the spatial layout of rural settlements in the Yanhe watershed and promoting their sustainable development.

1. Introduction

Rural settlements are spatial places where agricultural populations live and work, and their spatial distribution and patterns reflect the comprehensive relationship between human activities and the natural environment [1]. Water resources are fundamental production factors for regional agricultural production and rural development [2], and they are important influencing factors of settlement spatial characteristics [3]. The loess hilly and gully region in the middle reaches of the Yellow River Basin is an area with severe soil erosion. Issues such as the fragile ecological environment and limited construction land restrict the sustainable development of the regional living environment [4,5]. Water resources have a significant impact on this region in various ways. Compared to well-developed urban infrastructure, rural settlements have a higher dependence on local water resources for production, living, and ecological development. Therefore, integrating water resources and optimizing the spatial layout of rural settlements has become an important aspect of achieving high-quality development in the Yellow River Basin.
The main purpose of studying the spatial pattern characteristics of rural settlements is to analyze the regional spatial characteristics and underlying rules of the rural settlement system [6]. As a natural–social integrated entity of human–land–water interaction, the basin is a cluster unit that integrates various elements [7]. Analyzing the spatial pattern characteristics of rural settlements at the basin scale is more conducive to exploring the formation process and differentiation patterns of rural settlements in different regional environments. It has important value and universal significance for the study of human settlements in complex geographical environments [8]. Currently, research on the spatial characteristics of rural settlements mainly focuses on the spatial distribution, scale structure, landscape form, evolution laws, and mechanisms of settlement patterns [6,9,10]. This research adopts a combination of qualitative and quantitative methods and incorporates GIS spatial analysis, landscape pattern index analysis, spatial econometric models, spatial statistical analysis, and other methods into the study of rural settlement spatial characteristics. The research scale mainly focuses on administrative scales such as province [11], city [12], county [13], and township [1], with only a few scholars studying the spatial characteristics of rural settlements at the basin scale [14,15]. Therefore, it is necessary to conduct relevant research at the basin scale to promote the sustainable development of water and human systems and to facilitate regional rural revitalization.
Regarding the research on the impact of water resources on rural settlements, previous studies have shown that as the distance between rural settlements and water systems increases, both the number and area of settlement patches gradually decrease [16]. With improved access to water resources, the shape of settlements tends to become more compact [17]. The total water consumption is a prerequisite for the development of water resource systems, and water conservation and efficiency are key to the healthy and sustainable development of water resource systems [2]. A certain relationship between the acquisition and utilization of water resources and the spatial characteristics of rural settlements is evident. However, there is currently a lack of research on the relationship between water resource quantity and the spatial pattern of rural settlements. The water footprint is one of the commonly used methods in water resource utilization studies, and it has the potential to be applied in research on green water resource utilization efficiency, water resource carrying capacity, and the optimal allocation of water resources [18,19]. This can effectively measure water consumption and sustainable development. Spatial autocorrelation analysis, an important tool for analyzing the interdependence and distribution characteristics of variables within a spatial context, has been widely applied in landscape ecology [20,21,22], aquatic ecology [23], rural settlements [24] and other fields. Therefore, the water footprint method can be used to measure water resources, and spatial autocorrelation analyses can be employed to examine the relationship between water resources and rural settlements.
Based on this, this study uses landscape metrics to quantify the spatial pattern of rural settlements in the Yanhe watershed. The water footprint and water resource ecological surplus or deficit model are employed to analyze the spatial distribution characteristics of water resources in the basin. With the assistance of the GeoDa platform, bivariate spatial autocorrelation methods are applied to specifically analyze the water yield, water demand, and ecological surplus or deficit of water resources in the Yanhe watershed and their spatial correlation with rural settlements. The aim is to provide a reference and guidance for the sustainable development of rural settlements in the loess hilly and gully region of the basin.

2. Study Area and Data Sources
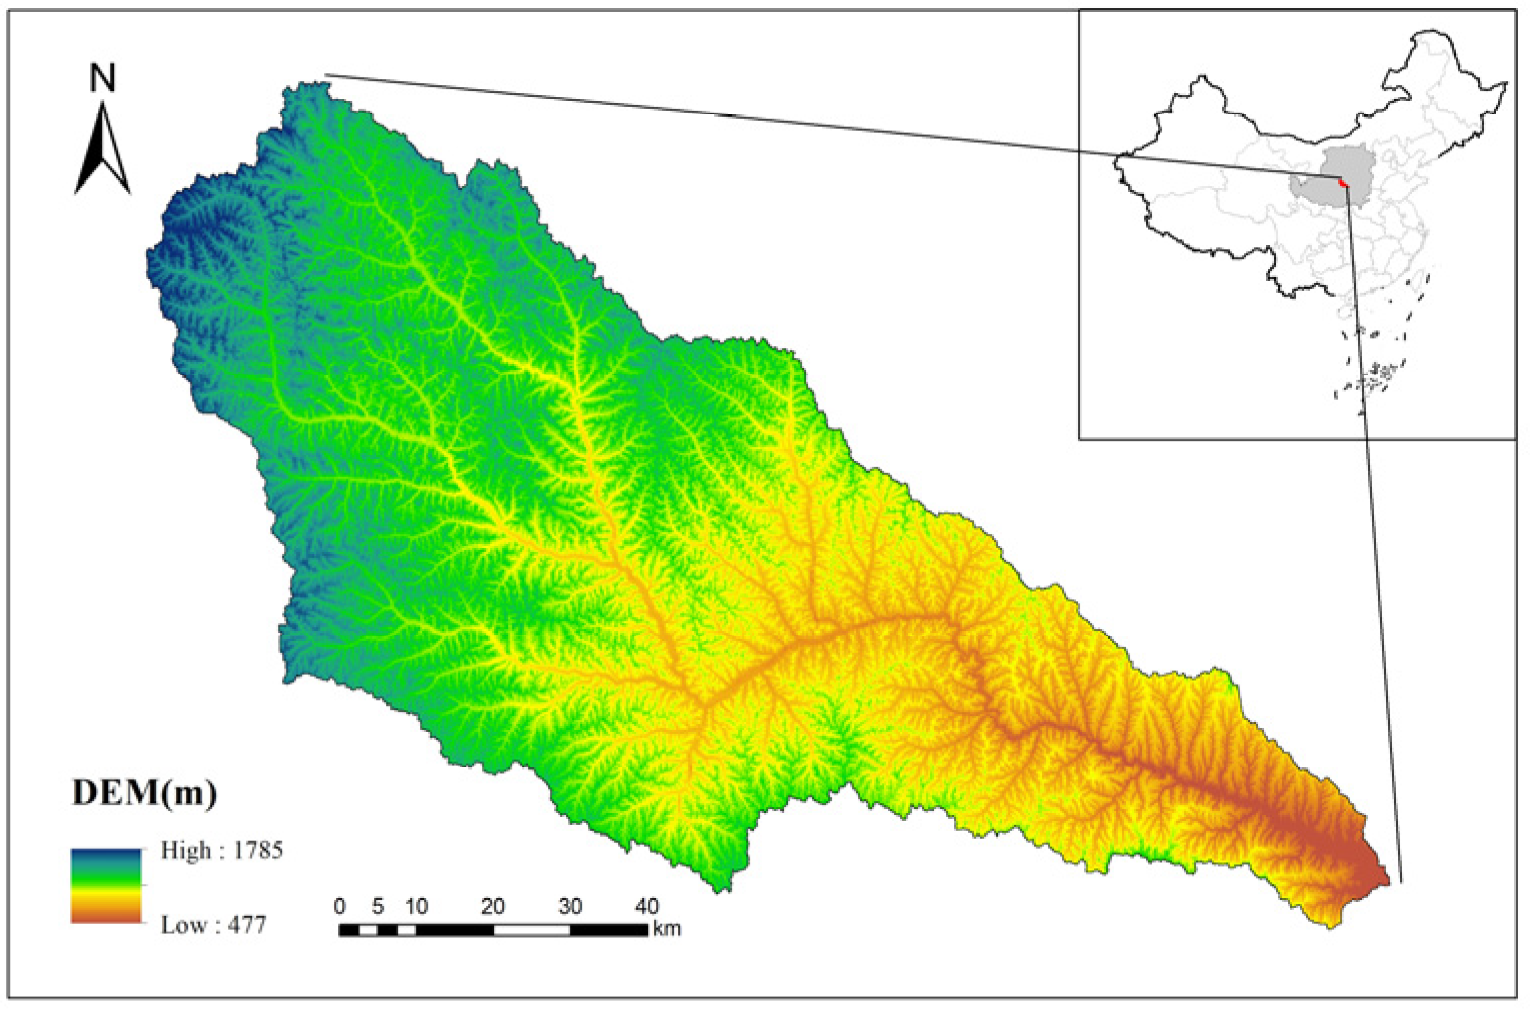
2.1. Study Area

The Yanhe watershed is located in the northern part of Shaanxi Province and belongs to the loess hilly and gully region of the Loess Plateau (Figure 1). The source of the Yan River is in Jingbian County in the northwest of Shaanxi Province. It flows southeastward along the terrain for a total length of approximately 286.9 km, with a basin area of about 7680 km2. This is the main water source that sustains local production, life, and ecology. Due to severe hydraulic erosion on the surface, the local area has formed a network of numerous gullies and fragmented loess gully systems, with undulating terrain ranging from 0 to 204 m. The upstream area is characterized by steep loess slopes, with slope gradients mostly exceeding 25°. The middle reaches are dominated by short and narrow loess ridges with relatively lower slopes, while the downstream area is mainly composed of long and wide ridges, gently sloping floodplains, and fragmented narrow terraces. The basin’s annual precipitation is approximately 431–523 mm (Figure 2), with a decreasing trend from southeast to northwest. The middle reaches have the highest precipitation, followed by the downstream area, while the upstream area has the lowest. The Yanhe watershed mainly consists of Baota District, Ansai District, and Yanchang County, along with small parts of Zhidan County and Jingbian County. Baota District serves as the political, economic, and cultural center of Yan’an City. The basin contains 995 rural settlements, which are closely distributed along the water system, and mainly concentrated in the high-altitude tableland, ridge and hill areas, which are the central part of the basin. Rural settlements in Yanhe watershed have a high dependence on water resources because of their special climatic conditions and topographic features. The distribution of settlements and cultivated land is closely related to the water system, rainfall and runoff.

2.2. Data Sources

The data used in this study mainly include satellite remote sensing images, DEM data, land use data, and socio-economic data. The DEM data were obtained from the website of the Geospatial Data Cloud of the Chinese Academy of Sciences (http://www.gscloud.cn, accessed on 20 May 2023). The primary socio-economic data were sourced from the Statistical Yearbooks of Yan’an City and various counties and districts. The land use data used are the 30 m × 30 m land use data for the year 2022. Nighttime light data were obtained from the dataset provided by the Chinese Academy of Sciences (http://www.resdc.cn, accessed on 20 May 2023). Meteorological and hydrological data were sourced from the “Shaanxi Province Water Resources Bulletin”, the Ganguyi Hydrological Station, the “Yangtze River Sediment Bulletin,” and the China Meteorological Data Network (http://data.cma.cn, accessed on 20 May 2023).

3. Research Methodology

We focused on the unique climate conditions and regional characteristics of the Yanhe watershed, and followed the methodology of “Spatial heterogeneity, Correlation analysis, Impact relationship”. The SWAT model is a spatially distributed and time-continuous hydrological model developed by the Agricultural Research Service (ARS) of the United States Department of Agriculture (USDA). The model can accurately delineate watershed units and flexibly adjust appropriate parameters [25,26,27,28]. Therefore, in this study, the SWAT hydrological model tool divided the Yanhe watershed into 47 sub-basins, which were used as the units for further quantitative analysis. This study quantifies water resource utilization in three aspects, water production, water demand and ecological profit and loss, by constructing a water footprint model of the Yanhe watershed. InVEST is a common model for measuring regional water production, which has been widely used in the Loess Plateau [29,30,31,32,33]. To be more specific, rainfall, runoff, and evapotranspiration are all aspects of water resources that can be fully reflected in terms of water yield. For agricultural production space, rainfall’s temporal and spatial distribution is crucial, and runoff may have an impact on where people live. A significant component influencing the growth and development of cultivated land is evapotranspiration. These signs are connected to rural communities that are closely related spatially. The variation in rural settlements’ needs regarding water resources across different regions is reflected in the spatial and temporal distribution of water demand. The spatial and temporal distribution of water resource use by WEDS has an impact on the location, size, and borders of rural settlements. Fragstats software was used to measure the landscape index of rural settlement patches in three aspects, namely distribution, scale and form, based on sub-catchment units. Finally, through the ArcGIS planform, the spatial autocorrelation method is used to analyze the spatial correlation between water resources and rural settlement characteristics (Figure 3).

3.1. Quantification of Water Resources

3.1.1. Water Production

The water production of the entire Yanhe watershed was simulated using the water yield module of the InVEST model. This module estimates the water production in a region based on precipitation data, plant transpiration data, surface evaporation data, root depth, and soil depth, utilizing the principles of the water cycle. The main algorithm of the model is as follows:
Y x j = ( 1 A E T x j P x ) × P x
In the equation, Y x j represents the water production of type j land use/cover type at grid x . A E T x j is the actual evapotranspiration of type j land use/cover type at grid x , and P x is the annual precipitation in grid x .
A E T x j P x = 1 + ω x R x j 1 + ω x R x j + 1 R x j
R x j represents the dimensionless aridity index of land use/cover type j at grid x , which is defined as the ratio of potential evaporation to precipitation. ω x represents the ratio of modified vegetation annual available amount to expected water amount.
R x j = K x j E T 0 x P x
W x = Z A W C x P x
In the equation, E T 0 x represents the potential evapotranspiration within grid x , measured in mm. K x j denotes the evapotranspiration coefficient of vegetation. A W C x refers to the plant-available water content, which represents the volumetric water content that can be utilized by vegetation. Z represents the seasonal factor, which represents the parameters related to seasonal rainfall distribution and depth.
A W C x = M i n ( M a x . S o i l D e p t h x , R o o t D e p t h x ) × P A W C x
In the equation, P A W C x represents the plant-available water capacity index, which refers to the amount of water that can be effectively used by vegetation. S o i l D e p t h x represents the soil depth in pixel x , R o o t D e p t h x represents the root depth within pixel x .

3.1.2. Water Demand

Water footprint refers to the amount of water resources required for the consumption of all products and services by a country, region, or individual within a certain period. The actual water use of a country or region includes not only the total amount of local water resources required for local product production or services but also the virtual water content of imported products and services in the region [34]. Based on on-site investigations and local water resources bulletins, in the study area, it has been determined that there is no cross-basin water transfer in the Yanhe watershed. Therefore, in calculating the total water footprint, this study does not consider the virtual water content imported from other countries or regions. The analysis focuses on the complex interactions between production, livelihood, and ecology [35], and the specific formula is given as follows (6):
W E F = P E F + L E F + E E F
In the equation W E F represents the water footprint within the region; P E F denotes the water demand for production within the river basin; L E F represents the water demand for residential livelihoods; E E F denotes the water demand for ecosystems.
The calculation of water demand for production was divided into the primary sector and the secondary/tertiary sectors. In this study, the spatialization of water demand for production in the Yanhe watershed was achieved based on the water consumption corresponding to the GDP value of each district and county in the basin. According to the ShaanXi water resources bulletin 2018, the per capita water consumption in Shaanxi-Yan’an area in 2018 was 242.5 m3, the water consumption per 10,000 yuan GDP was 38.3 m3, and the water consumption per mu of farmland irrigation was 301.1 m3.
In the Yanhe watershed, agriculture has the highest proportion of the GDP of the primary sector, followed by animal husbandry, while forestry and fisheries have a relatively small proportion. Therefore, in this study, the water demand for the primary sector in the Yanhe watershed was limited to agriculture and animal husbandry, with agriculture occurring only in dryland areas and animal husbandry occurring only in grassland areas. Land use data and grassland livestock capacity were used to calculate the primary industry water demand of each township in the Yanhe watershed in 2018 and allocate it to each sub-watershed.
The calculation formula for the primary sector GDP is as follows:
G D P 1 i j = G D P 1 i × Q i j ÷ S U M i j
In the equation G D P 1 i j represents the GDP produced in the j-th grid of the i-th city (in 10,000 RMB); G D P 1 i represents the GDP of the primary sector in the i-th city in 2018 (in 10,000 RMB); Q i j represents the weight corresponding to the j-th grid in the i-th city; S U M i j represents the total number of grids with land use type j in the i-th city [36].
Numerous scholars have conducted research demonstrating a strong correlation between nighttime lights and GDP in the secondary/tertiary sectors [37,38]. Therefore, in this study, the linear regression relationship between nighttime lights and GDP was established using SPSS software to calculate the water demand for the secondary/tertiary sectors. The specific formulas are as follows:
G D P 23 i j = V I I R S i j × X i
G D P 23 i j = G D P 23 i × G D P i ÷ S U M i
In the equation: V I I R S i j represents the nighttime lights value in the j-th grid of the i-th district/county; X i represents the conversion coefficient between GDP and nighttime lights in the i-th district/county; G D P 23 i j represents the GDP of the secondary/tertiary sectors in the j-th grid of the i-th district/county (in 10,000 RMB); G D P i represents the secondary/tertiary sector GDP of the i-th district/county in 2018 (in 10,000 RMB); G D P 23 i represents the converted value of GDP in the j-th grid of the i-th district/county; S U M i represents the total sum of G D P 23 i j in the i-th district/county.
Ecological water demand in this study was divided into biological water demand and non-biological water demand. The formula used to calculate non-biological water demand is as follows:
B a = W s + W e + W w
W s = S t / C m a x
W e = { A x E x P   ( E x > P )                     0                       ( E x < P )
W w = a s · H s · A s
In the equation, B a represents the non-biological water demand, W s represents the water demand for sediment transport in rivers, W e represents the water demand for evaporation from rivers and lakes, and W w represents the soil water content. S t represents the long-term average sediment transport in rivers, C m a x represents the average value of the maximum sediment concentration in rivers over the years. E x represents the long-term average evaporation from rivers and lakes, P represents the long-term average annual precipitation, and A x represents the area of rivers and lakes. a s represents the soil water coefficient, H s represents the soil depth, and A s represents the land area.
Biological water demand was calculated based on vegetation evapotranspiration, including evapotranspiration from forests and grasslands. The specific calculation formula is as follows:
W p = K 0 · E T 0 · A p
In the equation, W p represents vegetation evapotranspiration, K 0 represents the evapotranspiration coefficient of vegetation, E T 0 represents the potential evapotranspiration, and A p represents the vegetation distribution area.

3.1.3. Water Resources Ecological Surplus/Deficit (WRES/D)

The water resource ecological surplus/deficit ( W E D ) is the difference between the water supply ( W E C ) and water footprint ( W E F ) within a region. It can be used to assess the sustainability of water resource utilization in the region. The calculation formula is as follows [19,39,40]:
W E D = W E C W E F
If W E D > 0, this indicates a surplus of water resource ecological balance in the region, indicating a sustainable utilization state. When W E D = 0, this represents an ecological balance state. If W E D < 0, this indicates a deficit in water resource ecological balance, implying that the water resources are insufficient to support the demands of regional socio-economic development.

3.2. Spatial Characteristics of Rural Settlements

The landscape pattern indices can reflect the characteristics of rural settlement patterns and spatial configurations [12]. For this study, three indices were selected to assess the landscape patterns of rural settlements in the sub-basins: Patch Density (PD), Mean Patch Size (MPS), and Mean Patch Fractal Dimension (FRAC_MN). Fragstats 4.2 software was used to calculate these landscape indices, allowing for an analysis of the spatial distribution, size, and boundary shape characteristics of rural settlements in the Yanhe watershed.
The Mean Patch Fractal Dimension (FRAC_MN) represents the spatial form of rural settlements, with values ranging from 1 to 2. A value closer to 1 indicates stronger self-similarity of rural settlement patches, with smaller ratios of length to width and more regular patch shapes. This demonstrates that rural settlements are artificial patches; under the conscious intervention of human beings, the nature of rural settlement patches is relatively regular and easy to manage [41]. Therefore, the patches tend to resemble circles or squares, indicating a higher degree of human interference, as patches formed by human activities often have more regular shapes. Conversely, a value closer to 2 indicates more complex shapes of rural settlement patches, with elongated and narrower geometries, suggesting less human interference.

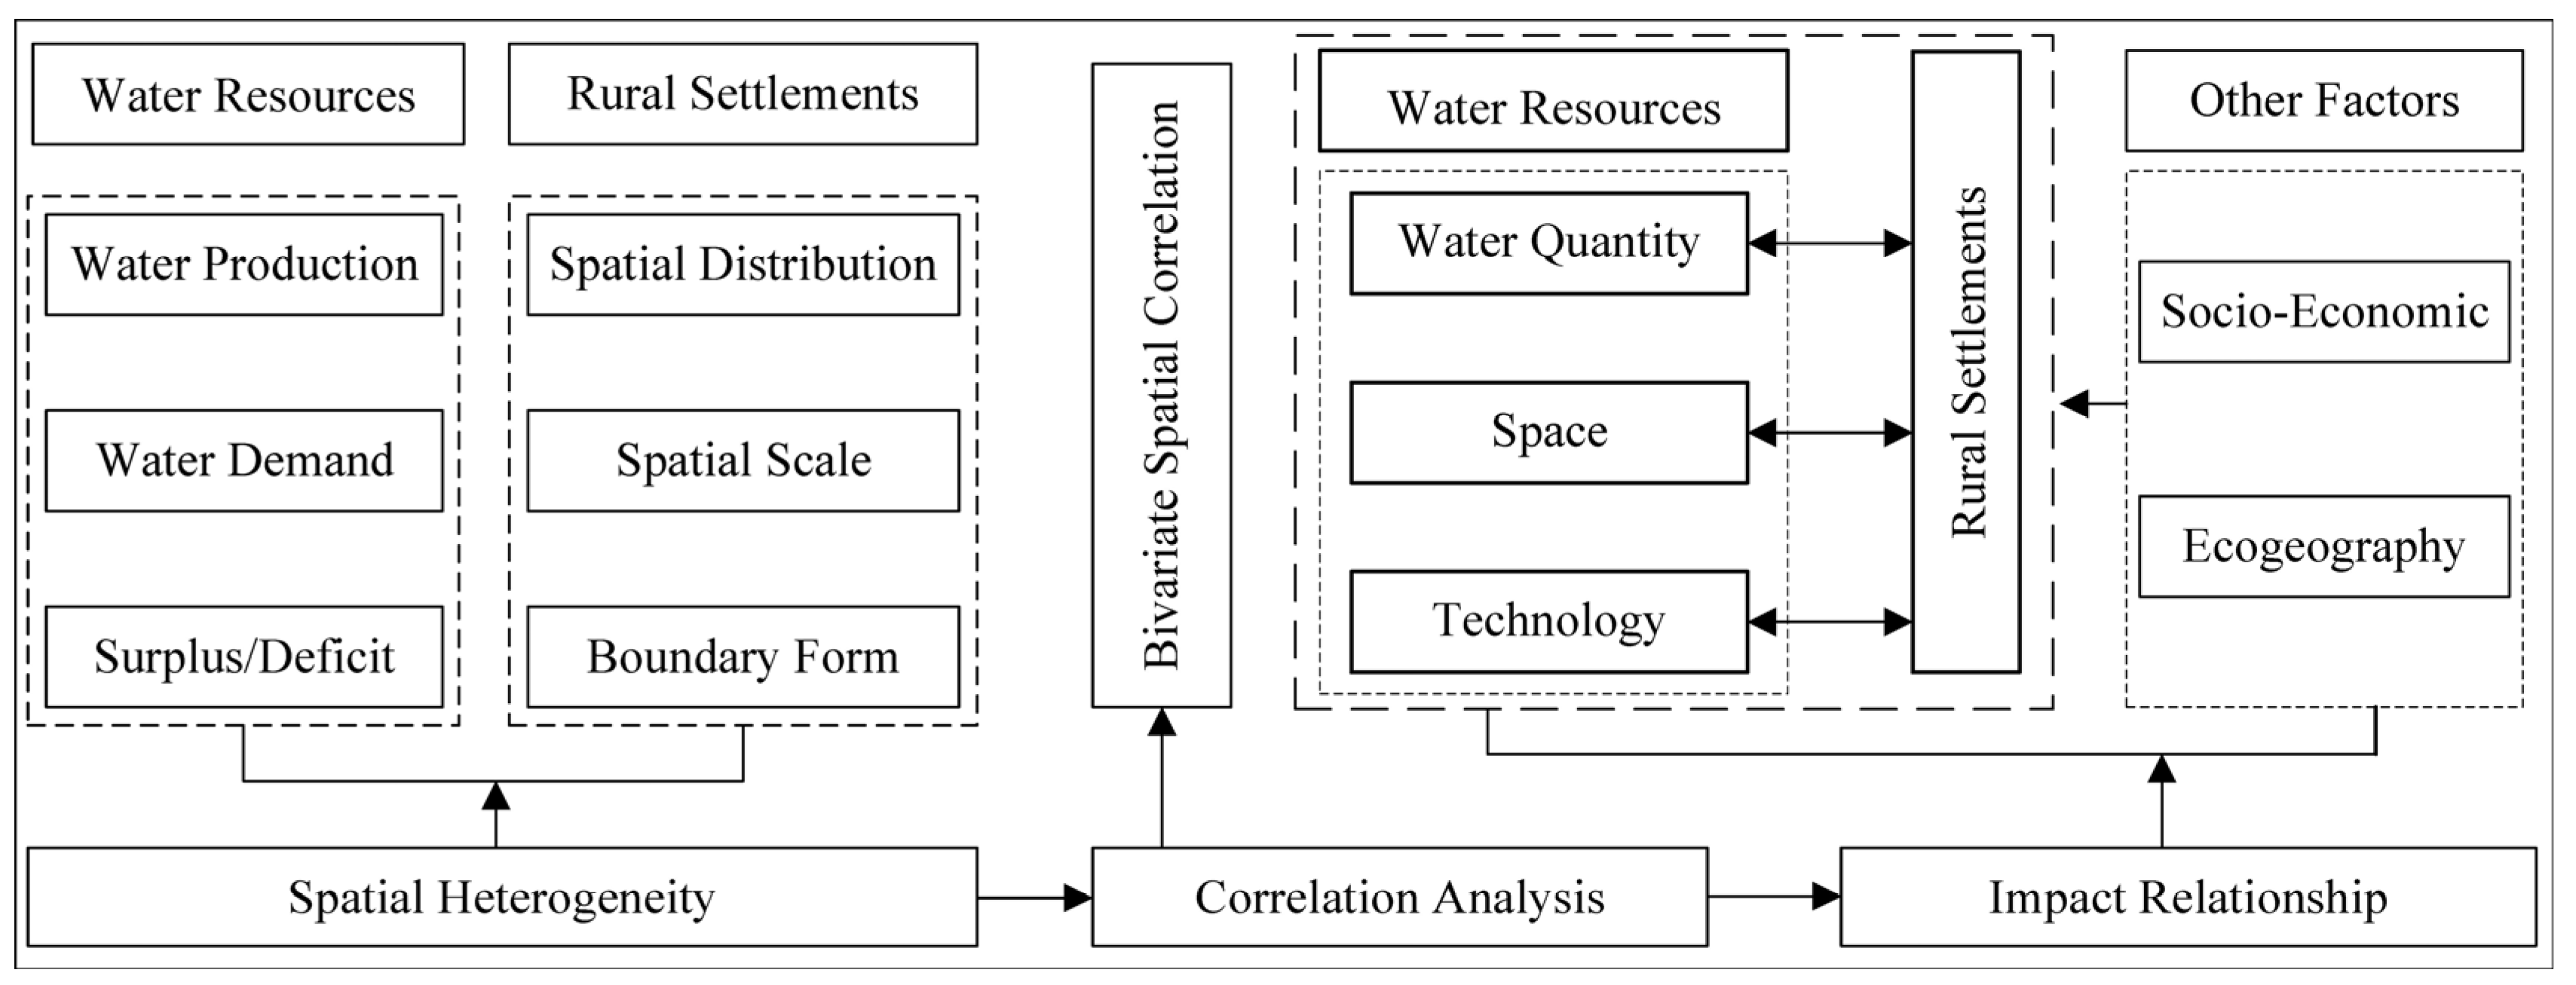
3.3. Bivariate Spatial Autocorrelation

Compared to traditional spatial autocorrelation, which considers only one variable, bivariate spatial autocorrelation characterizes the spatial relationship between different geographic features. The Moran’s I index obtained from bivariate spatial autocorrelation is used to evaluate the degree of correlation between a location variable and other variables [42]. The range of Moran’s I coefficient is [–1, 1]. The results can be classified into three main situations: ➀ When the value of Moran’s I coefficient is greater than 0, this indicates a positive spatial autocorrelation among the study objects. Specifically, the closer the coefficient value is to 1, the stronger the positive correlation, indicating a stronger spatial clustering of the study objects. ➁ When the value of Moran’s I coefficient is less than 0, this indicates a negative spatial autocorrelation among the study objects. Specifically, the closer the coefficient value is to −1, the stronger the negative correlation, indicating greater spatial dissimilarity among the study objects. ➂ When the value of Moran’s I coefficient approaches 0, this reflects the random distribution characteristic of the study objects, indicating the absence of spatial autocorrelation [19].
In this study, the global bivariate spatial autocorrelation analysis in Geoda software was used to describe the spatial relationship between the characteristics of rural settlements and water resources in the Yanhe watershed. The local bivariate spatial autocorrelation was employed to identify the differences in this spatial relationship among sub-basins.

4. Analysis Results

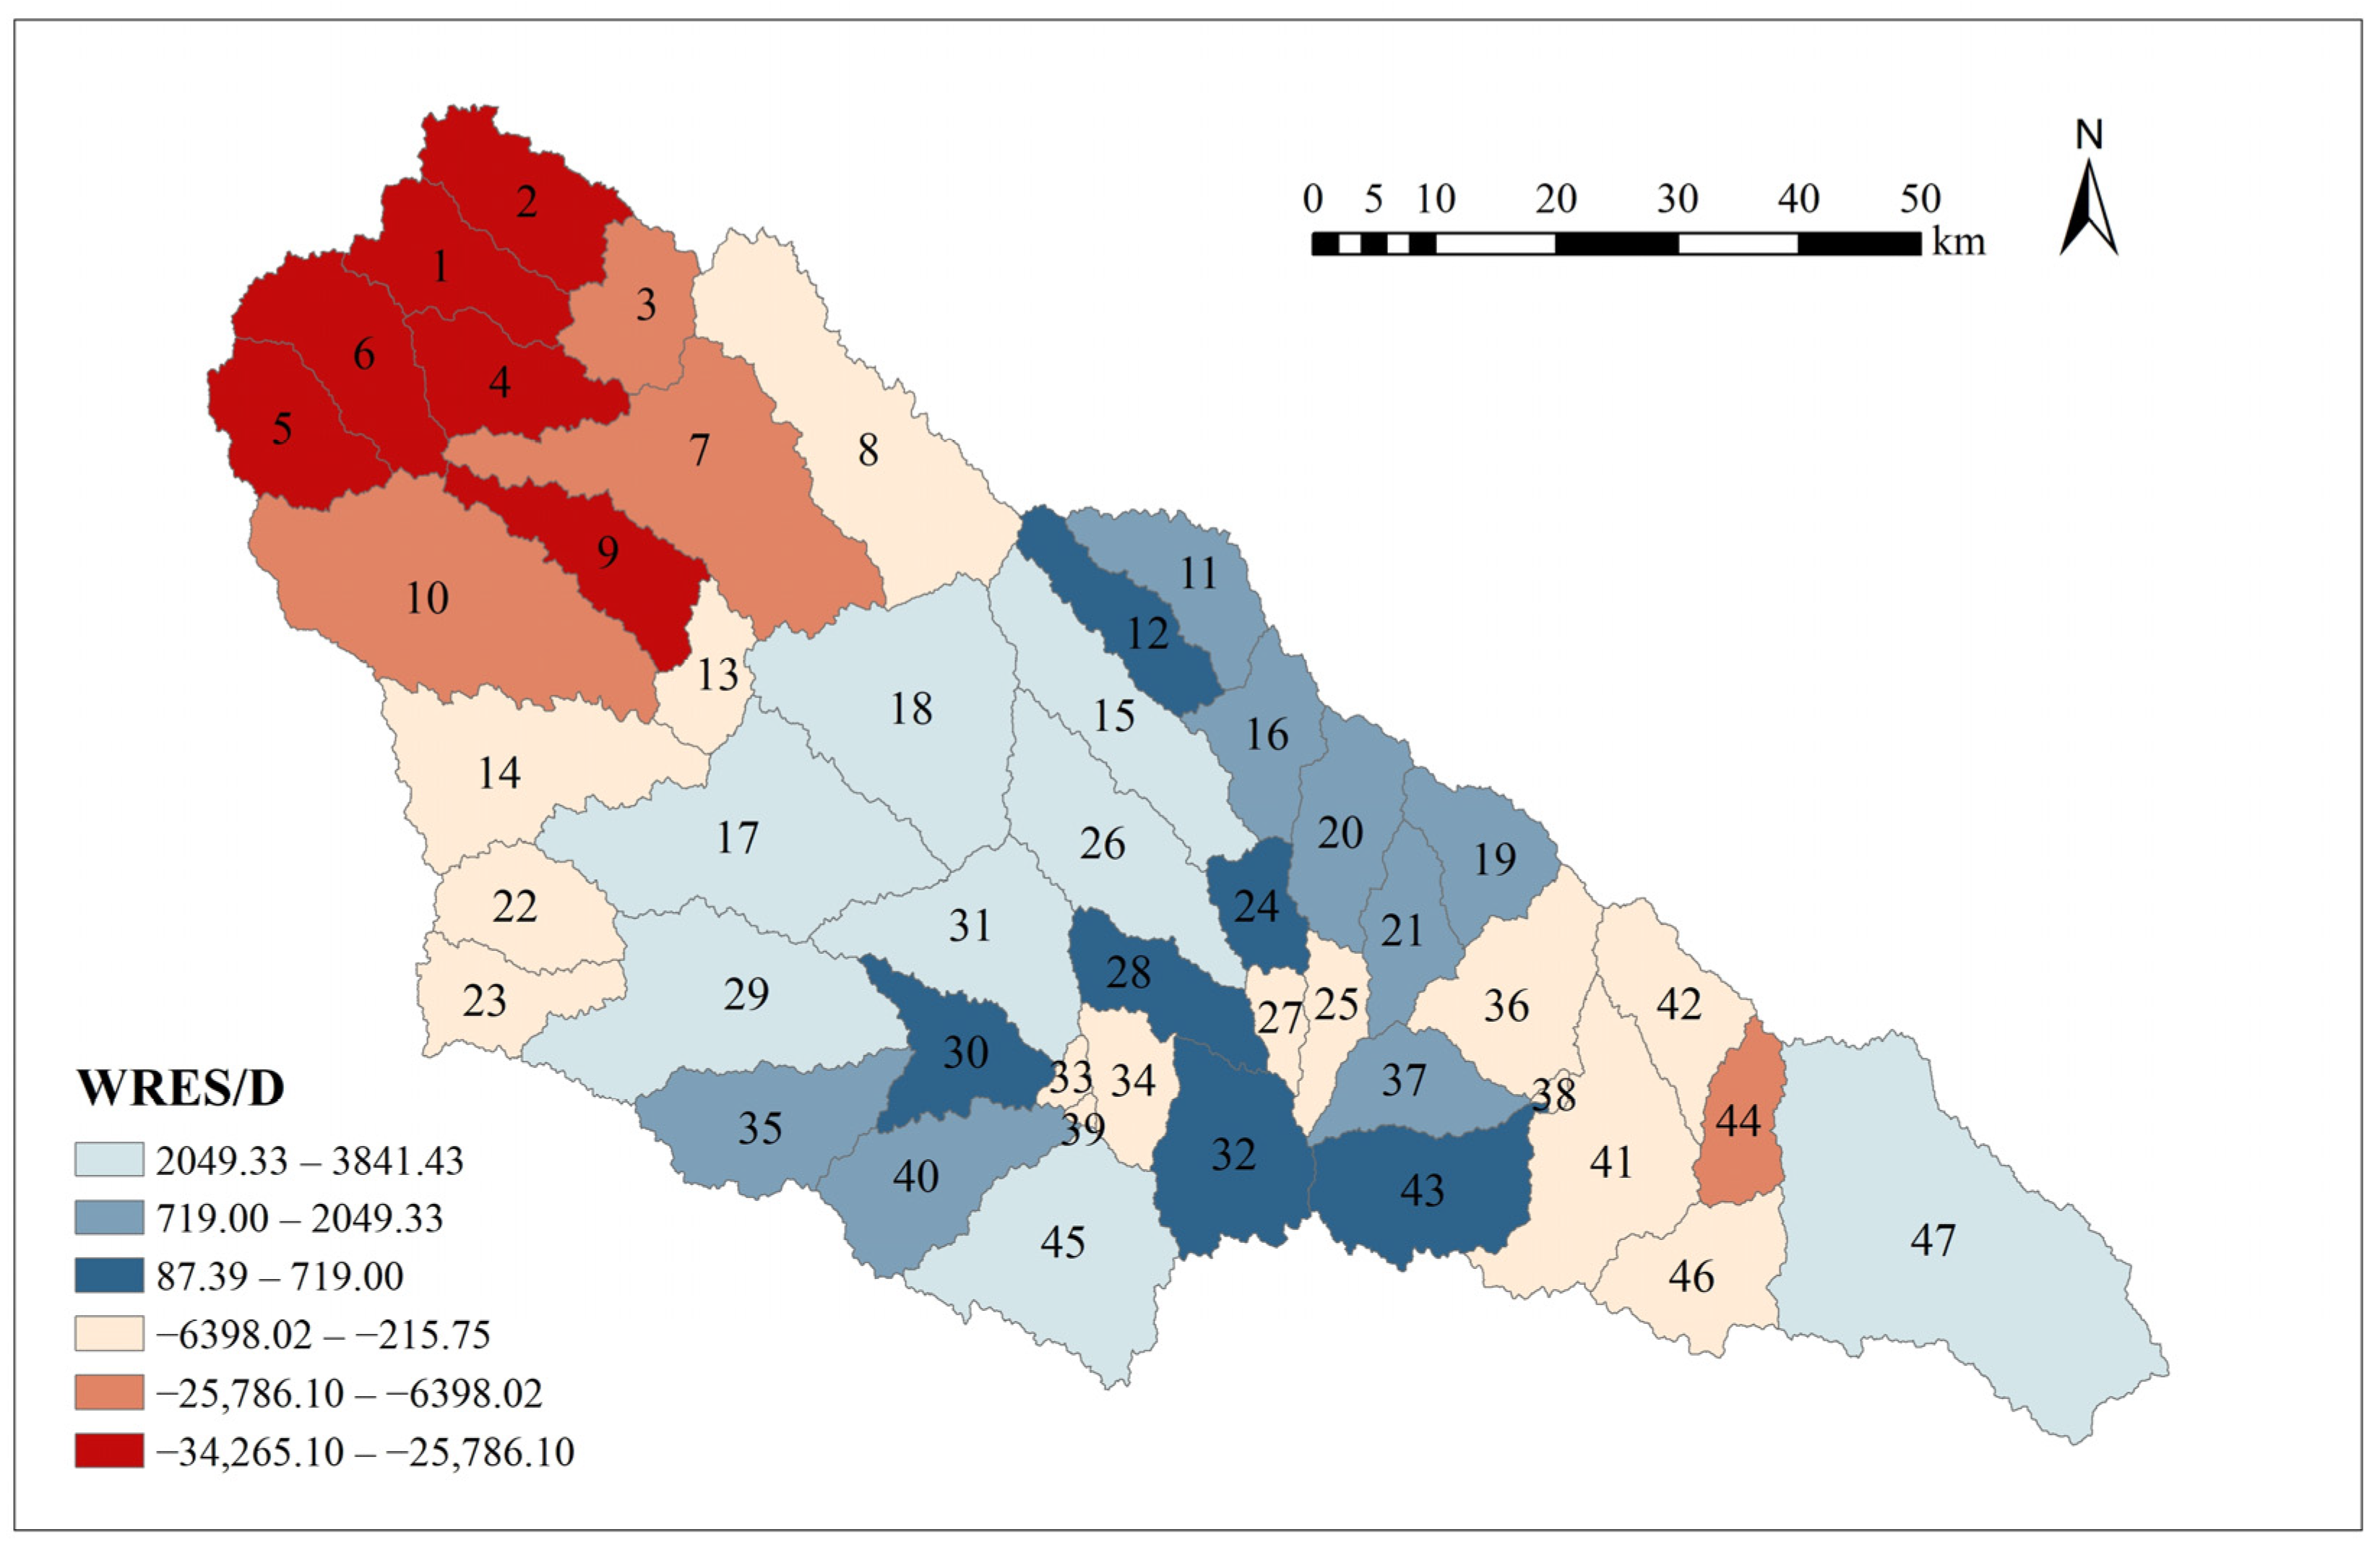
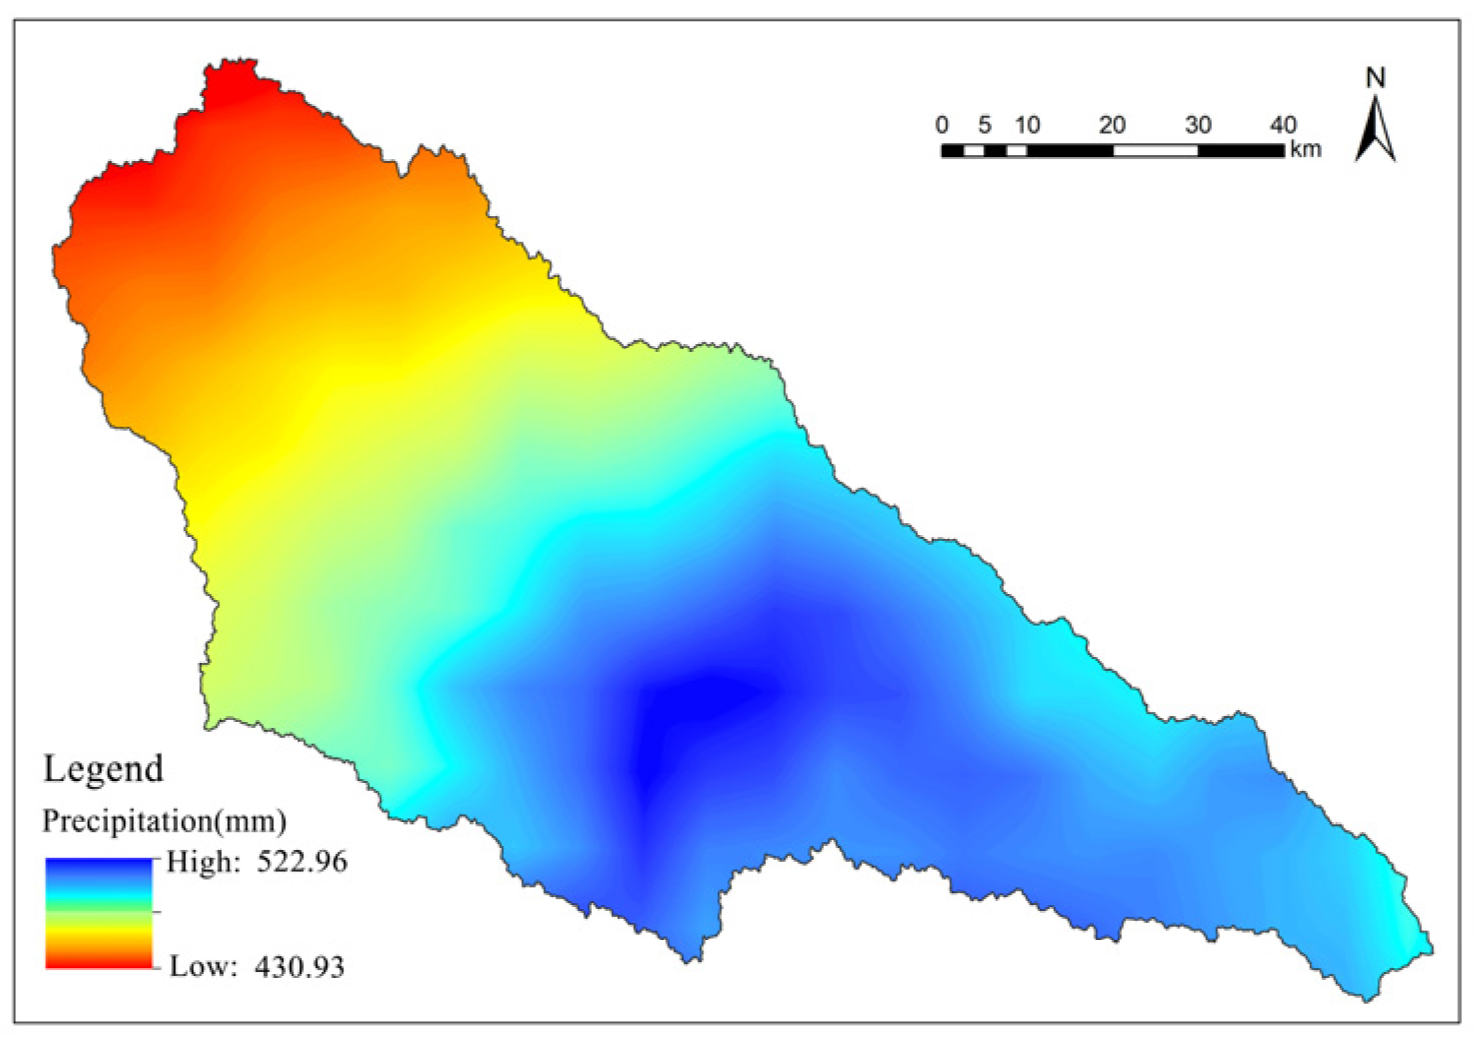
4.1. Spatial Distribution Characteristics of Water Resources in the Yanhe watershed

By using Equation (15), the water resource ecological surplus or deficit was calculated for each sub-basin, revealing that the water resource ecological surplus or deficit in the Yanhe watershed ranges from −34265.14 × 104 m3 to 3841.43 × 104 m3. Due to differences in geographical environment and area size, there are significant disparities in water resource ecological surplus or deficit among sub-basins. The sub-basin with the highest water resource ecological surplus/deficit is sub-basin 29 (Xichuan), located in the middle reaches, while sub-basin 1 (Maquangou), located in the upper reaches, has the lowest water resource ecological surplus/deficit. Using the natural breaks method in ArcGIS 10.2, the water resource ecological surplus or deficit results were classified into five levels: low, relatively low, medium, relatively high, and high. A distribution map of water resource ecological surplus or deficit in the Yanhe watershed (Figure 4) was obtained. Seven sub-basins located in the upper reaches, namely sub-basins 5 (Yapangou), 6 (Zhoujiawangou), 1 (Maquangou), 4 (Hezhuanggou), 2 (Kangjiahegou), 9 (Gaojiagou), and 10 (Chaluchuangou), have the lowest level of water resource ecological surplus/deficit, indicating a severe water resource ecological deficit. Several larger tributaries in the middle reaches, such as sub-basins 15 (Mudanchuan), 18 (Majiagou), 26 (Fengfuchuan), 17 (Xingzigou), 29 (Xichuan), 35 (Loupingchuan), 40 (Dufuchuan), 45 (Longsigou), and the downstream sub-basin 47 (Gaojiahe, Nanhegou), have the highest level of water resource ecological surplus/deficit. The water supply–demand status is relatively balanced in these areas, indicating a state of supply–demand equilibrium.

4.2. Spatial Layout Characteristics of Rural Settlements in the Yanhe watershed

In order to further explore the spatial layout characteristics of rural settlements in the study area, the landscape index was divided by the natural discontinuity grading method (Jenks) (Figure 5). It can be seen that rural settlements in Yanhe watershed have obvious spatial clustering characteristics in three aspects: spatial distribution, scale characteristics and boundary form.

4.2.1. Spatial Distribution Characteristics

The analysis of patch density was used to examine the spatial distribution characteristics of rural settlements in the Yanhe watershed (Figure 5a). The results indicate that the patch density values of rural settlements in the Yanhe watershed range from 0 to 0.39 patches/km2, showing a pattern of “dense in the central part and sparse at both ends.” The density core area in the middle of the Yanhe watershed has a patch density range of 0.20 to 0.70 patches/km2, including areas such as sub-basins 12 (Guansugou), 16, 20, 24, 25 (Panlongchuan), 26 (Fengfuchuan), and sub-basins 27, 28, 33, 39 (Nanchuan), where the central urban area of Yan’an City is located.

4.2.2. Scale Characteristics

The average area of rural settlements in each sub-basin unit within the Yanhe watershed was calculated (Figure 5b). The results show that the sub-basin unit with the smallest average area of rural settlements is sub-basin 33, with an average area of only 2.30 km2, located in the central area of Yan’an City. The sub-basin unit with the largest average area of rural settlements is sub-basin 1 (Maquangou), spanning Zhidan County and Jingbian County in the upstream area, with an average area of 20.79 km2, indicating a larger scale. The central part of the basin has favorable natural conditions, a relatively wide terrain, and abundant water resources, which is why rural settlements in this area have smaller and more concentrated areas. The standard deviation of average settlement area within sub-basins 29 (Xichuan), 1 (Maquangou), 2 (Kangjiahegou), 10 (Chaluchuan), 43 (Zhengzhuanggou), and 37 (Guoqishugou) ranges from 5.15 km2 to 12.76 km2. Among them, sub-basin 29 (Xichuan) has the highest standard deviation of average settlement area, at 12.76 km2, indicating significant differences in the development scale of rural settlements within the sub-basin. Sub-basin 33 has a standard deviation of only 0.85 km2, indicating a relatively similar development scale of rural settlements within the sub-basin.

4.2.3. Boundary Form Characteristics

The fractal dimension of each sub-basin unit in the Yanhe watershed was calculated (Figure 5c). The fractal dimension shows an increasing trend from the northwest to the southeast, with the minimum value of 1.07 in sub-basin 6 (Zhoujiawangou) at the upstream end and the maximum value of 1.14 in sub-basin 35 (Loupingchuan) in the Baota District of the middle reaches. This indicates that there is a tendency for the shape of rural settlements to become more complex from upstream to downstream. However, the fractal dimension in the Yanhe watershed ranges from 1.07 to 1.14, with an average value of 1.09, which is close to 1.10, with small variations. This suggests that the overall shape of rural settlements in the Yanhe watershed is relatively regular and block-like.

4.3. Influence of Water Resources on the Spatial Characteristics of Rural Settlements in the Yanhe watershed

4.3.1. Global Spatial Association between Water Resources and Spatial Characteristics of Rural Settlements

Using GeoDa spatial analysis tool, a spatial weight matrix was established to calculate the Moran’s I global spatial autocorrelation index between water resources’ ecological surplus/deficit and the different spatial characteristics of rural settlements (Table 1). From Table 1, it can be observed that the bivariate Moran’s I value for spatial clustering and spatial form with a water resource ecological surplus/deficit is greater than 0, while the bivariate Moran’s I value for the area scale of rural settlements with a water resource ecological surplus/deficit is less than 0. All three indicators passed the significance test at the 1% level, indicating a significant spatial correlation between the three types of rural settlement spatial characteristics and water resource ecological surplus/deficit. Specifically, the Moran’s I value for spatial clustering and the water resources ecological surplus/deficit is 0.36, indicating a strong positive correlation. This suggests that, as the availability of water resources improves, rural settlements tend to cluster together. The positive correlation between spatial form and water resources’ ecological surplus/deficit is even stronger, with a Moran’s I value of 0.50. This indicates that when water resource utilization is more sustainable, rural settlements are less likely to be disturbed, resulting in more complex and elongated patches. There is a significant negative correlation between area scale and water resources’ ecological surplus/deficit, with a Moran’s I value of −0.60. This implies that when water conditions are favorable, rural settlements tend to have smaller area scales. This is because, in areas with better water conditions, rural settlements are more concentrated, leaving less land available for expansion and resulting in smaller area scales.
Examining the bivariate spatial autocorrelation of different types of water resources with spatial characteristics of rural settlements, it can be seen that the correlation between different spatial characteristics of rural settlements and ecological water demand is generally stronger than their correlation with other water resource elements. This indicates that ecological water demand has a more significant impact on the spatial characteristics of rural settlements. As the ecological water demand increases, it encroaches more on the production and living space of rural settlements, leading to higher fragmentation, more dispersed spatial distribution, larger area scales, and more regular spatial forms of rural settlements. Industrial water demand only exhibits a weak positive spatial correlation with the spatial clustering of rural settlements, with a Moran’s I value of 0.21, indicating that, in sub-basins with a higher industrial water demand, rural settlements tend to exhibit more clustered distributions. Water production only shows a weak negative spatial correlation with the spatial form of rural settlements, with a Moran’s I value of −0.16, indicating that as the water yield improves, the patch spatial morphology index becomes smaller, which means that the rural settlements are subjected to more human intervention (Figure 6).

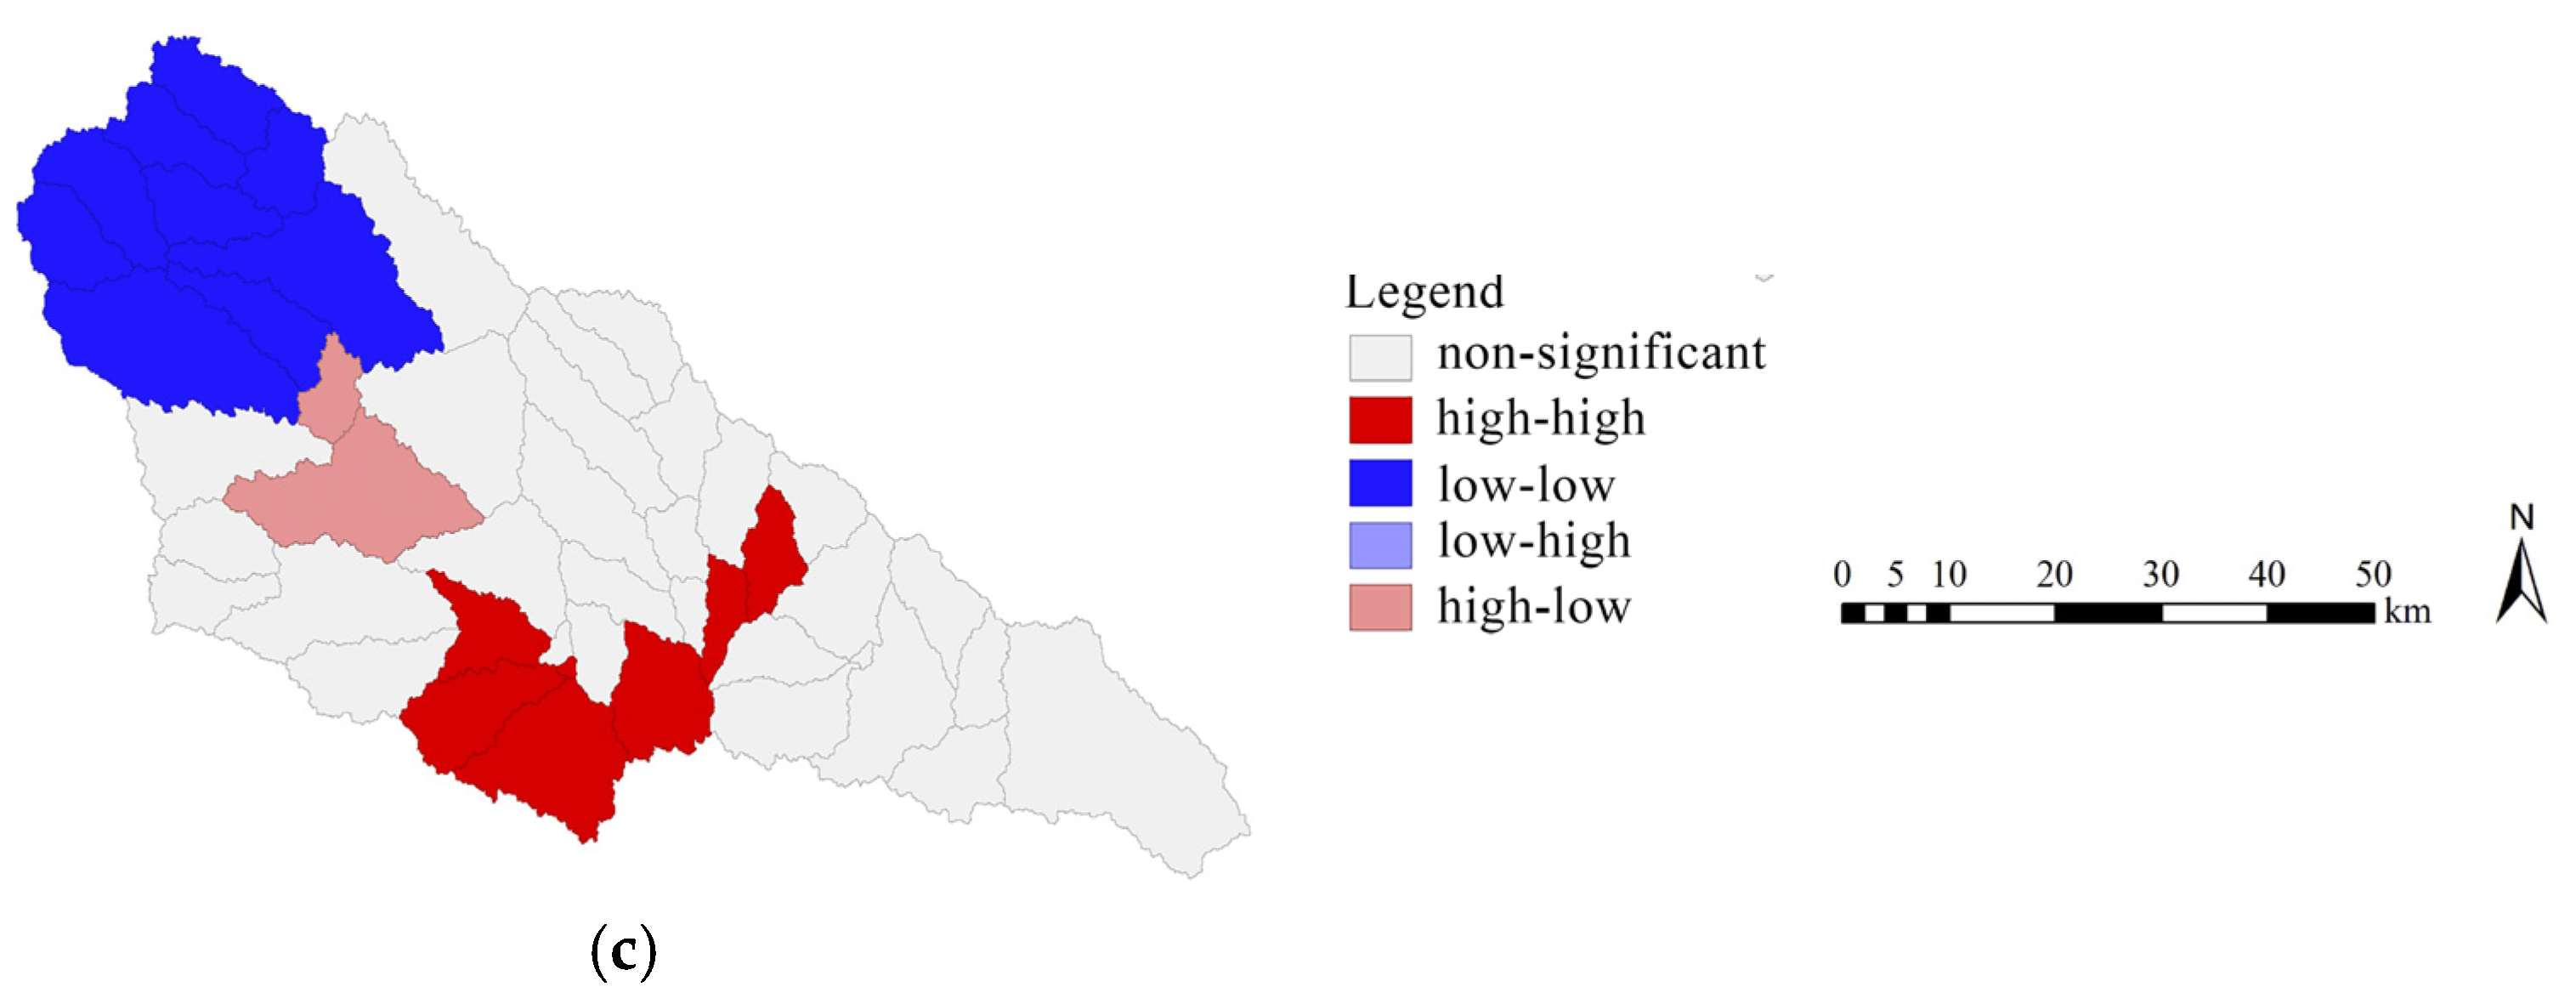
4.3.2. Local Spatial Association between Water Resources and Rural Settlements Characteristics

Based on the bivariate local spatial autocorrelation analysis, the Local Indicators of Spatial Association (LISA) cluster maps were generated to represent the spatial relationship between water resources ecological surplus/deficit and the spatial clustering, area scale, and spatial form of rural settlements in the Yanhe watershed (Figure 7). The LISA cluster maps show whether there is a high–high (H-H)/low–low (L-L) positive spatial correlation, low–high (L-H)/high–low (H-L) negative spatial correlation, or no significant spatial correlation (i.e., spatial randomness) between water resources ecological surplus/deficit and rural settlement spatial characteristics. From Figure 6, it can be observed that there are more L-L-correlated regions between water resources ecological surplus/deficit and spatial clustering, mainly located in the upstream area of the basin. The H-H-correlated regions are found around the Baota District in the middle reaches of the basin, while the H-L-correlated regions are less prominent and mainly located in the upstream area near Xingzigou. In the LISA cluster map of water resources ecological surplus/deficit and area scale, the L-H-correlated regions are also located in the upstream area, while the H-L-correlated regions are observed in the sub-basins of Mudanchuan, Fengfuchuan, Panlongchuan, Nanchuan, Masichuan, Dufuchuan, Longsigou, and other major tributaries in the middle reaches. These regions are surrounded by sub-basins with smaller area scales and exhibit a higher ecological surplus/deficit in water resources. The H-H-correlated region is only present in the Xichuan sub-basin. The LISA cluster map of water resources’ ecological surplus/deficits and spatial form reveals three types of local spatial heterogeneity. The upstream area shows an L-L correlation consistent with the spatial clustering. This further confirms the strong spatial heterogeneity between water resources’ ecological surplus/deficit and the rural settlement spatial characteristics in this region. A small portion of upstream sub-basins forms H-L clusters, while H-H clusters are distributed at the junction of the middle and lower reaches.
Although there are specific characteristics in the local spatial associations between water resources’ ecological surplus/deficit and different rural settlement spatial characteristics, overall, there is a certain degree of spatial similarity. The upstream area and the surrounding Baota District in the Yanhe watershed exhibit significant clustering features. The upstream area of the Yanhe watershed is characterized by steep loess slopes, higher slope gradients, more surface runoff, faster flow velocity, and more severe soil erosion. The sustainable utilization of water resources is more challenging in this area, imposing greater limitations on the spatial development of neighboring rural settlements. The Baota District serves as the core area for urban development in the Yanhe watershed, attracting a large population and many industries. The high demand for water resources in daily life and industrial development in this area leads to a more strained water resource utilization status and a more prominent contradiction with the development of rural settlements. Therefore, it exhibits pronounced spatial clustering characteristics.

4.4. The Relationship between Water Resources and Rural Settlements in the Yanhe watershed

By summarizing and integrating the relationships between various elements of rural settlements and water resources in the Yanhe watershed, we can understand the overall relationship between the two. Water resources in the Yanhe watershed can mainly be categorized into three aspects: quantity, spatial distribution, and technology. Quantity and spatial distribution are inherent characteristics of water resources in the Yanhe watershed, while technology refers to the means of improving the sustainable utilization of water resources for rural settlements. Figure 8 shows that the form, distribution, and scale characteristics of rural settlements are directly linked to water resources in terms of quantity and spatial distribution, and indirectly linked to water resource technologies. Specifically, the spatial form of rural settlements is negatively correlated with the distribution of water resources. The spatial distribution of rural settlements is negatively correlated with ecological water demand and industrial water demand. The spatial scale of rural settlements is positively correlated with domestic water demand and industrial water demand, but negatively correlated with domestic water demand and river network density. Additionally, in terms of water resource technologies, the capacity of domestic wastewater treatment is positively correlated with water environmental quality. Water abundance, as an indicator of water resource quality attributes, reflects the value of water resource utilization for humans. Water abundance is an important indicator for measuring the quality of water resources and their value for human use. This indicator is positively related to both water production and water demand, and can help to evaluate the efficiency of water resource utilization in human activities. Directly adjusting the utilization efficiency and methods of water resources can have an impact on the size and spatial distribution of rural settlements.
As shown in Figure 9, the socio-economic system, as a human factor variable, has a significant impact on both water resources and the development of rural settlements. Policy support, infrastructure, and social support can greatly influence various aspects, such as water quantity, water quality, water cost, wastewater treatment, irrigation methods, and water system landscapes, thereby affecting the quality of life, industrial development, and ecological environment of rural settlements.
Water resources have important impacts on various aspects of rural settlements. In terms of the quantity characteristics of water resources, the development of production, livelihood, and ecological spaces relies, to some extent, on water resources. The supply–demand relationship of water resources can influence the daily life and production activities of rural settlements. In terms of the spatial characteristics of water resources, the density of river networks and the distribution of water systems can affect the scale characteristics, spatial distribution, boundary forms, and internal structures of rural settlements.
The positive and negative effects generated by human water resources’ development during the process of rural settlement development also directly influence the water changes in the quantity of water resources. The spatial layout, development patterns, functional positioning, and internal structures of rural settlements lead to changes in water ecological environment and waterfront land use nature, and the combined effects of positive and negative effects vary in different regions. The upstream area of the Yanhe watershed is characterized by a fragmented terrain, sparse vegetation, and scattered farmland. Severe soil erosion is the main cause of ecological deficits in regional water resources. The impact of rural settlement developments on water resources is manifested in negative effects such as excessive water exploitation. In the middle reaches of the basin, the river valley is broad, the channels are flat, agricultural irrigation conditions are good, and facility agriculture is developed. Moreover, the infrastructure in this region is relatively complete, and water resource utilization efficiency is high. Therefore, the impact of rural settlement development on water resources is mainly characterized by positive effects such as efficient water resource utilization. In the downstream region, which is a fragmented tableland area, rural settlements are concentrated and larger in scale. The industrial scale and mechanization level are high, and the dominant vegetation type is forestland. The impact on water resources is mainly positive, with good water and soil conservation conditions, among other positive effects.

4.5. Discussion

Rural settlements, as complex systems, possess various characteristics, and relying on a single indicator alone is insufficient to accurately and comprehensively reflect the spatial development features of rural settlements in a region [43]. Therefore, the study of rural settlement spatial characteristics requires the selection of multiple indicators from multiple aspects for comprehensive measurement in order to more fully and completely depict the spatial features of rural settlements in a region. In this study, indicators such as rural settlement patch density, average patch size, and average patch fractal dimension were employed to analyze and reveal significant regional differences in the spatial characteristics of rural settlements in the Yanhe watershed. Research conducted by Dong Xiaopu and others also found that the density of rural settlements in the Baota District was relatively high, while the density in the Ansai District was generally low [44]. Consistent with previous studies [2,16,17], this research identifies the middle reaches of the Yanhe watershed as high-value areas in terms of water resources’ ecological surplus/deficit. The region features a gentle terrain, convenient transportation, and small-sized and clustered rural settlements. On the other hand, the tableland, ridge and hill areas in the upper reaches exhibit a higher elevation and transportation difficulties, forming clusters of low-value water resource ecological surplus/deficits characterized by larger-sized settlements with lower density.
At present, the quantification method of water footprint is mainly used to determine the consumption of water resources by calculating the water consumption of various products or economic sectors [45]. Due to the complexity of the water use process of various products, the data acquisition caliber, type, and structure are different, resulting in a certain degree of error in the calculation of water volume. In addition, from the perspective of the scale of land use in the Yanhe watershed, rural settlements and agricultural land account for a large proportion and are widely distributed, and rural residents are mainly engaged in agricultural production [46]. Therefore, in the rural human–land system, the proportion of agricultural water is relatively large, and the proportion of industrial water is relatively small, with little impact on rural settlements. However, in the process of urbanization in the future, industry will play an increasingly important impact on the development of local villages, so it is necessary to further study the impact of industrial water demand and water use on rural settlements in future research.
Bivariate spatial autocorrelation analysis reveals the spatial correlation between water resources and the spatial characteristics of rural settlements, providing a scientific basis for land use decision-making, ecosystem management, and industrial development guidance in the Yanhe watershed. Research by Yue Bangrui and others concluded that the development of rural settlements in arid areas must coordinate with the relationship with water resources. The spatial form of rural settlements should facilitate the intensive use of limited water resources and reduce the loss of long-distance water transport [47]. Gao Kai and others emphasized the importance of qualified water quality, diverse water resource utilization methods, and a good ecological environment for the sustainable development of rural settlements [48]. Due to the limited land and water resources and rugged terrain, it is necessary to strictly control the scale of construction land and the development of villages, optimize the spatial layout of villages, allocate vegetation types reasonably, adjust industrial structure, improve water resource utilization efficiency, and promote the use of water-saving facilities. These measures are the most feasible approach to improving the ecological environment quality and enhaninge the sustainable development of water resources and rural settlements in the Yanhe watershed while maintaining the living standards of rural residents and actively promoting ecological protection. In the process of rural settlement evolution, attention should be paid to the increasing pressure on water resource utilization caused by the growth in rural scale, as well as the significant increase in water pressure due to the expansion of ecological land and the promotion of reforestation. Additionally, based on the spatial local heterogeneity characteristics of water resources and rural settlements at different levels, in the upper reaches of the basin, it is necessary to regulate ecological governance efforts, improve ecological environmental quality, strictly control the amount of ecological water use, and gradually achieve coordinated development between rural settlements and water resources. In the middle reaches of the basin, rural settlement construction should be carried out in an orderly manner while maintaining the relatively good water resource utilization status at present, and minimizing the disturbance and destruction of water resources caused by rural settlement development. These spatial heterogeneity characteristics provide an important basis for the implementation of differentiated rural settlement construction and water resource regulation measures in the basin, and can provide a reference when optimizing the layout of rural settlements. However, due to the limitations of the article’s length, it is difficult to systematically discuss the regional planning and resource governance in the basin, which requires further in-depth research.

5. Conclusions

This study quantitatively measured the sustainable utilization of water resources in the Yanhe watershed using the water resource ecological surplus/deficit method. This reveals the spatial characteristics of rural settlements in the Yanhe watershed from three perspectives: spatial distribution, scale characteristics, and boundary forms. Finally, the bivariate spatial autocorrelation method was used to analyze the correlation between water resources and the spatial characteristics of rural settlements. The main conclusions of the study are as follows:
(1)
The water resource ecological surplus/deficit in the Yanhe watershed show an overall spatial pattern of being low in the west and high in the east. The seven sub-basins in the upstream region exhibit a low level of water resource ecological surplus/deficit, indicating a severe deficit in water resources. The sub-basins in the middle and lower reaches, as well as the larger tributaries, show a relatively balanced supply–demand status of water resources.
(2)
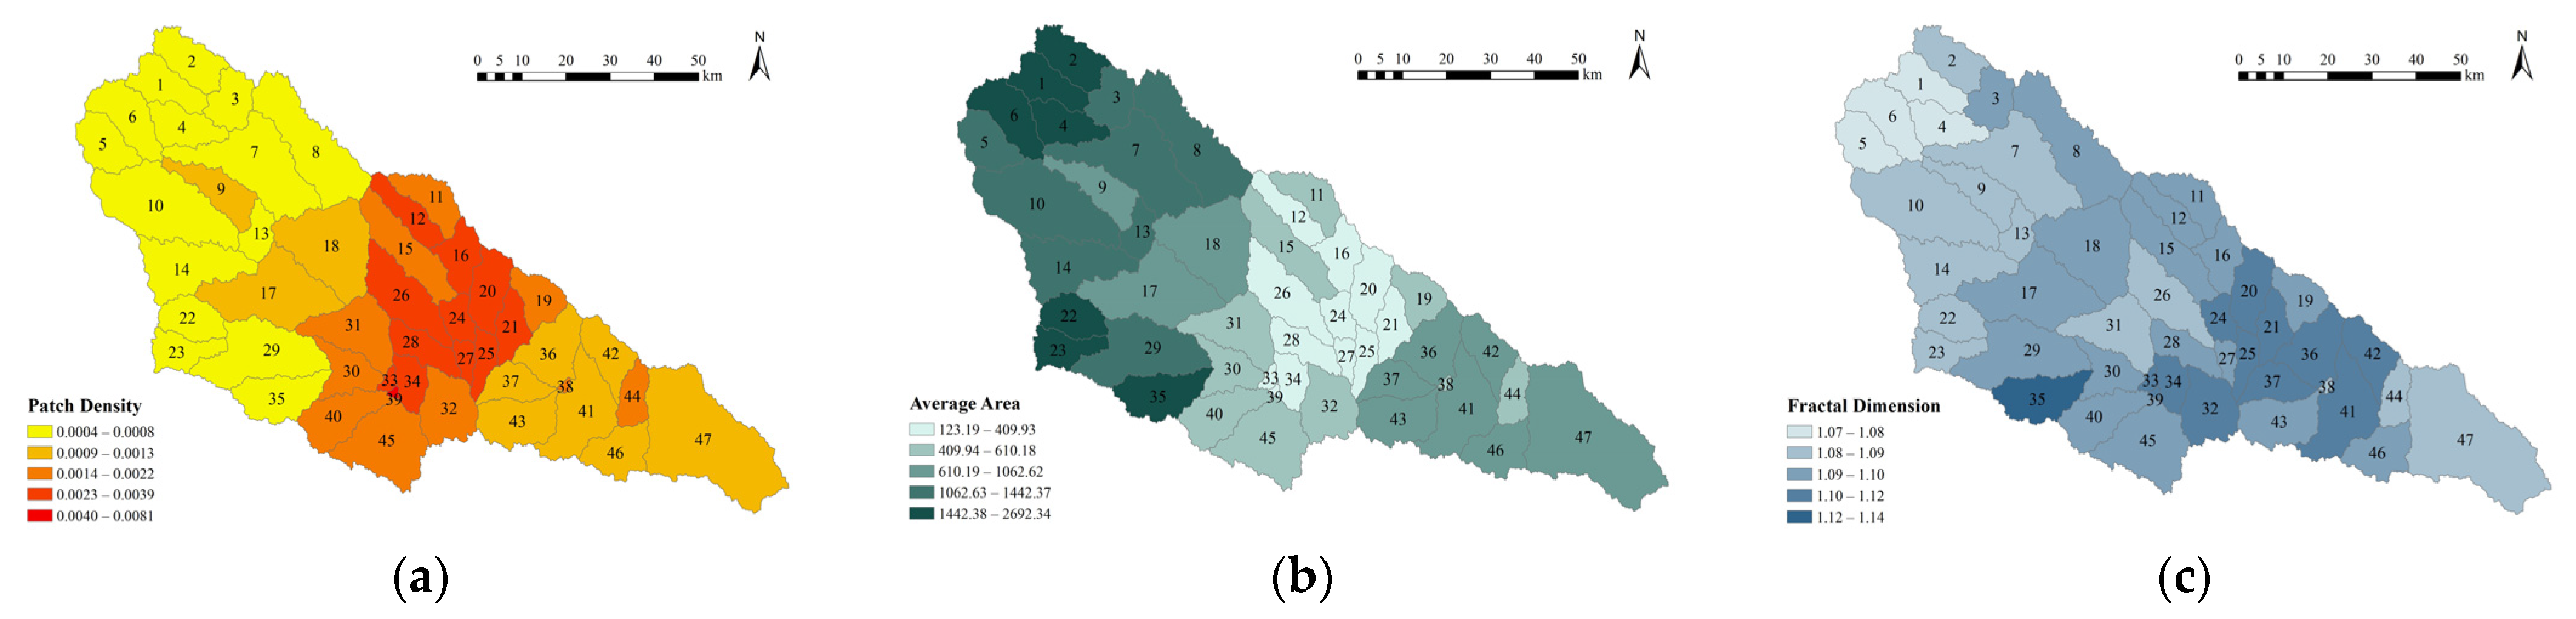
The spatial characteristics of rural settlements in the Yanhe watershed exhibit a spatial differentiation pattern, with the middle reaches as the highest-value zone and a gradual transition in a stepped manner towards the upstream and downstream ends. The distribution of rural settlements is most dense in the middle reaches, with the smallest area and more regular spatial forms.
(3)
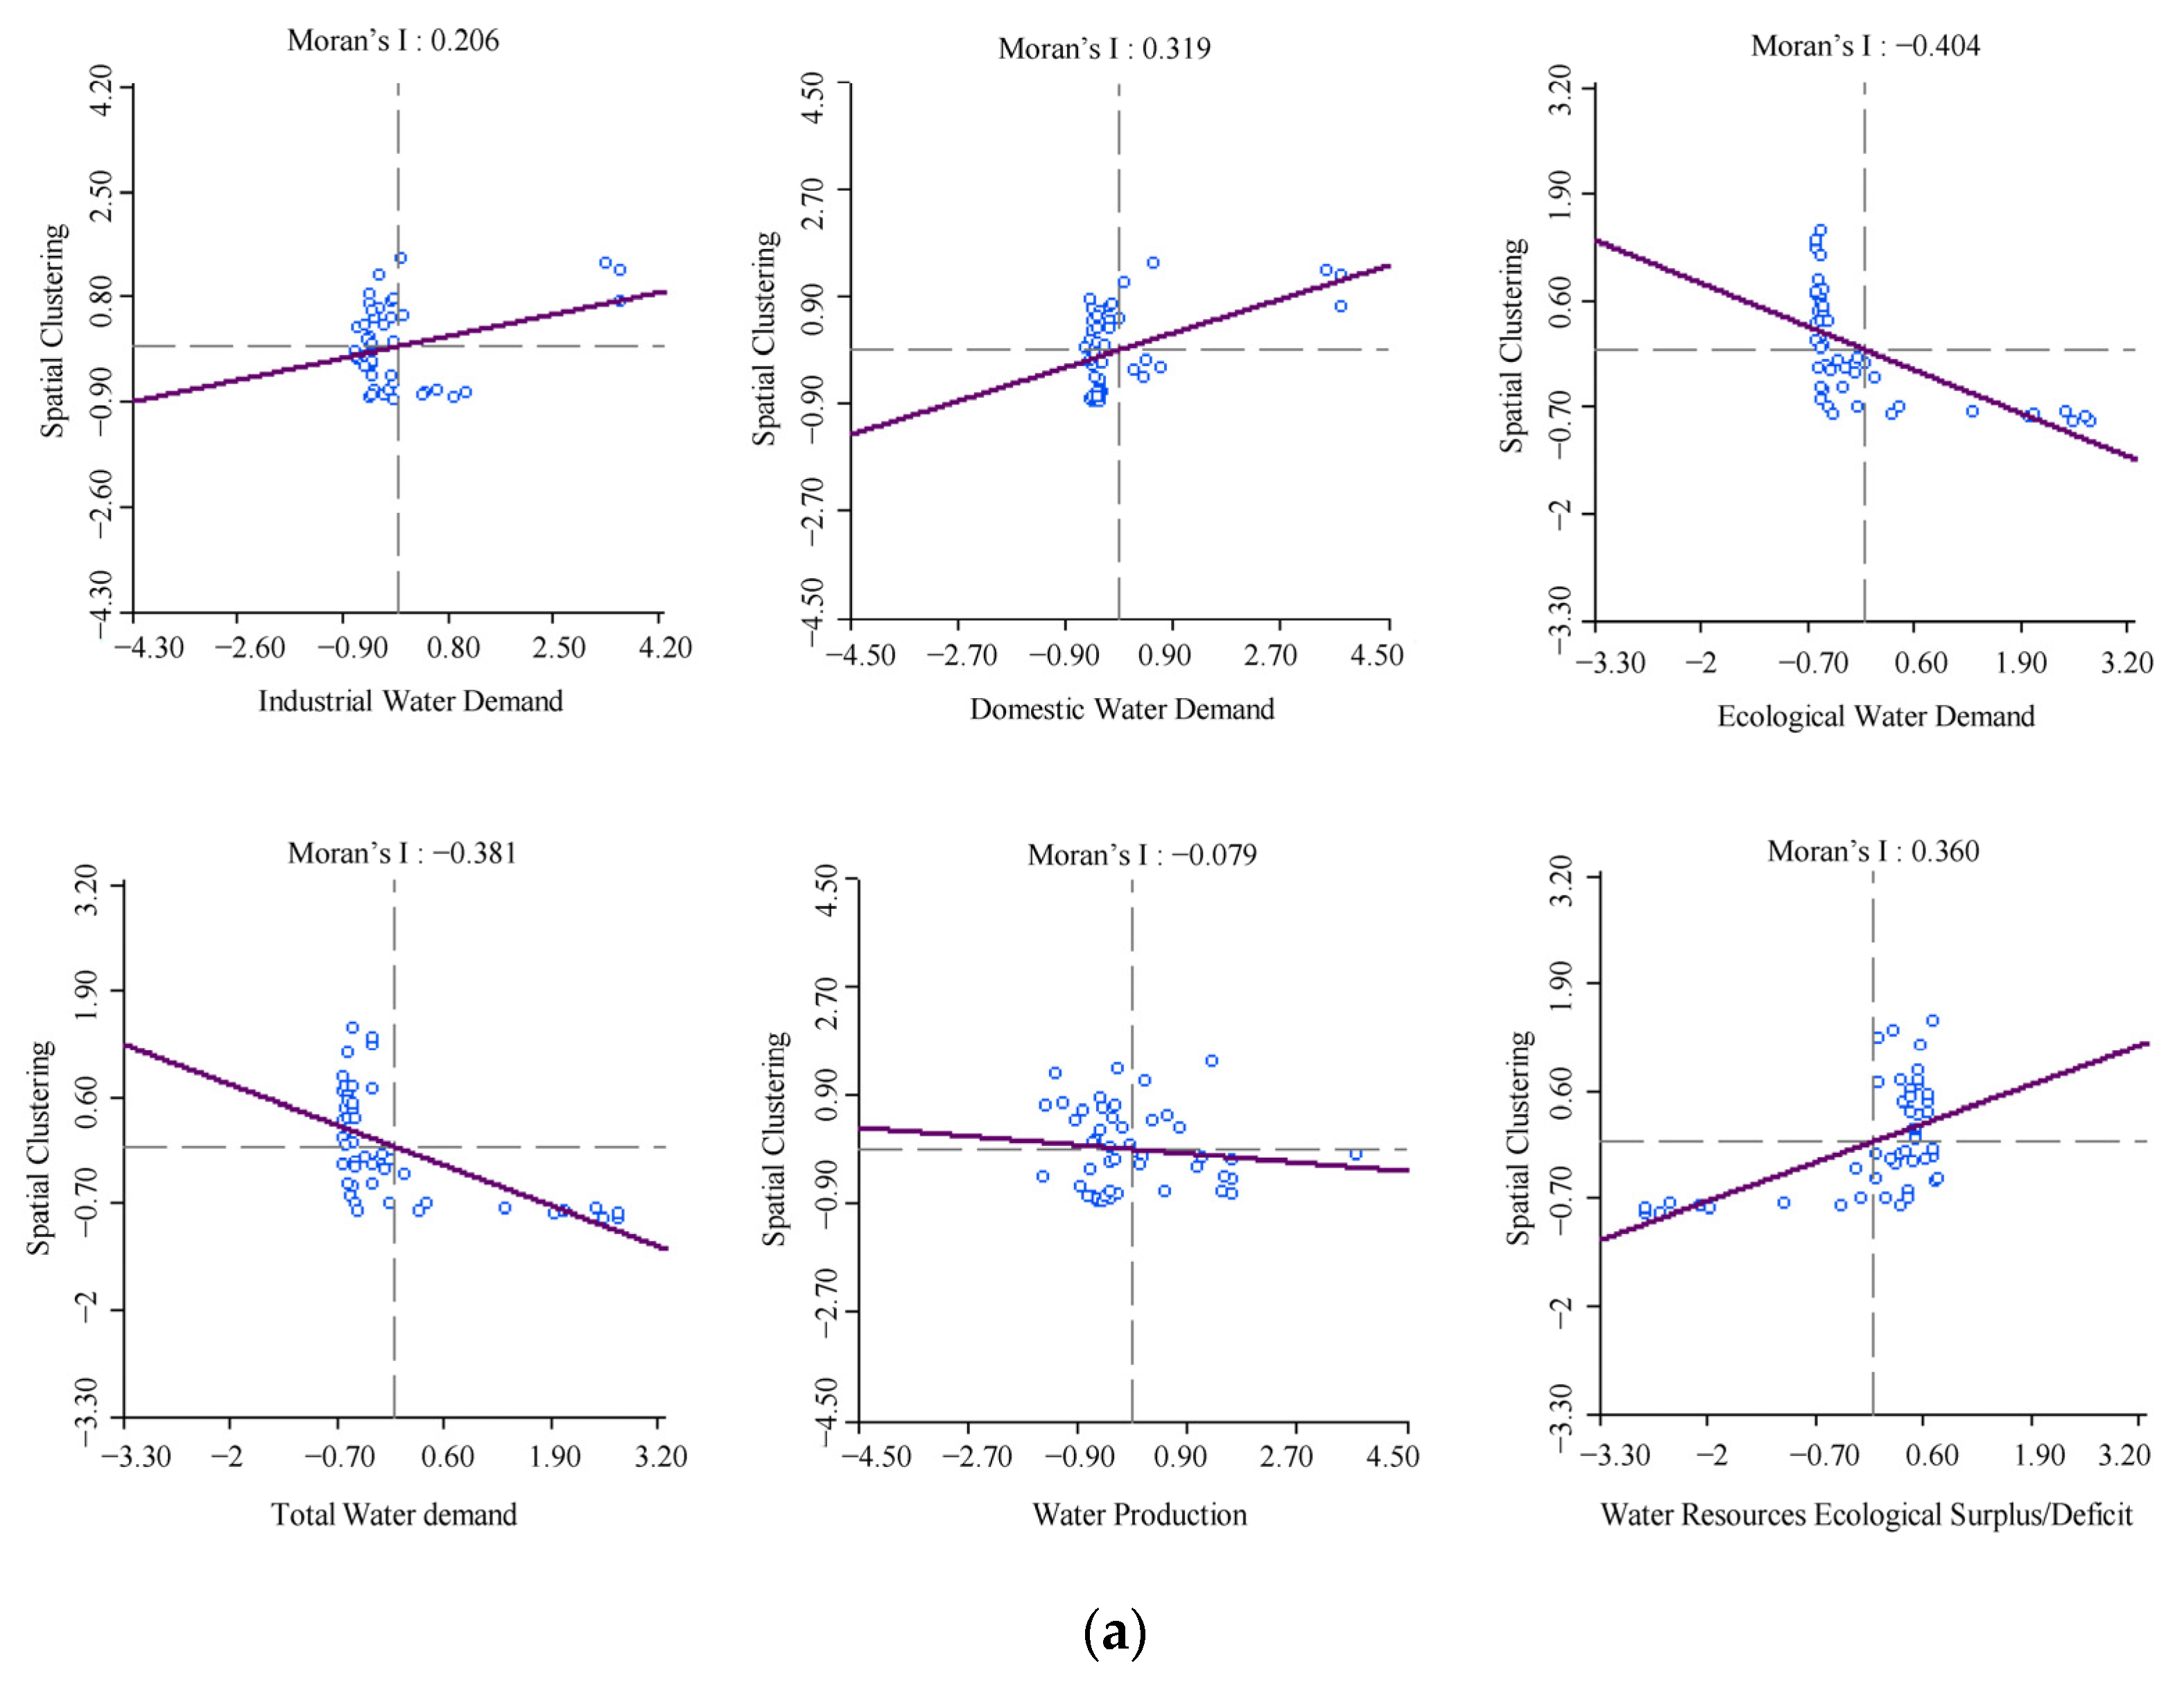
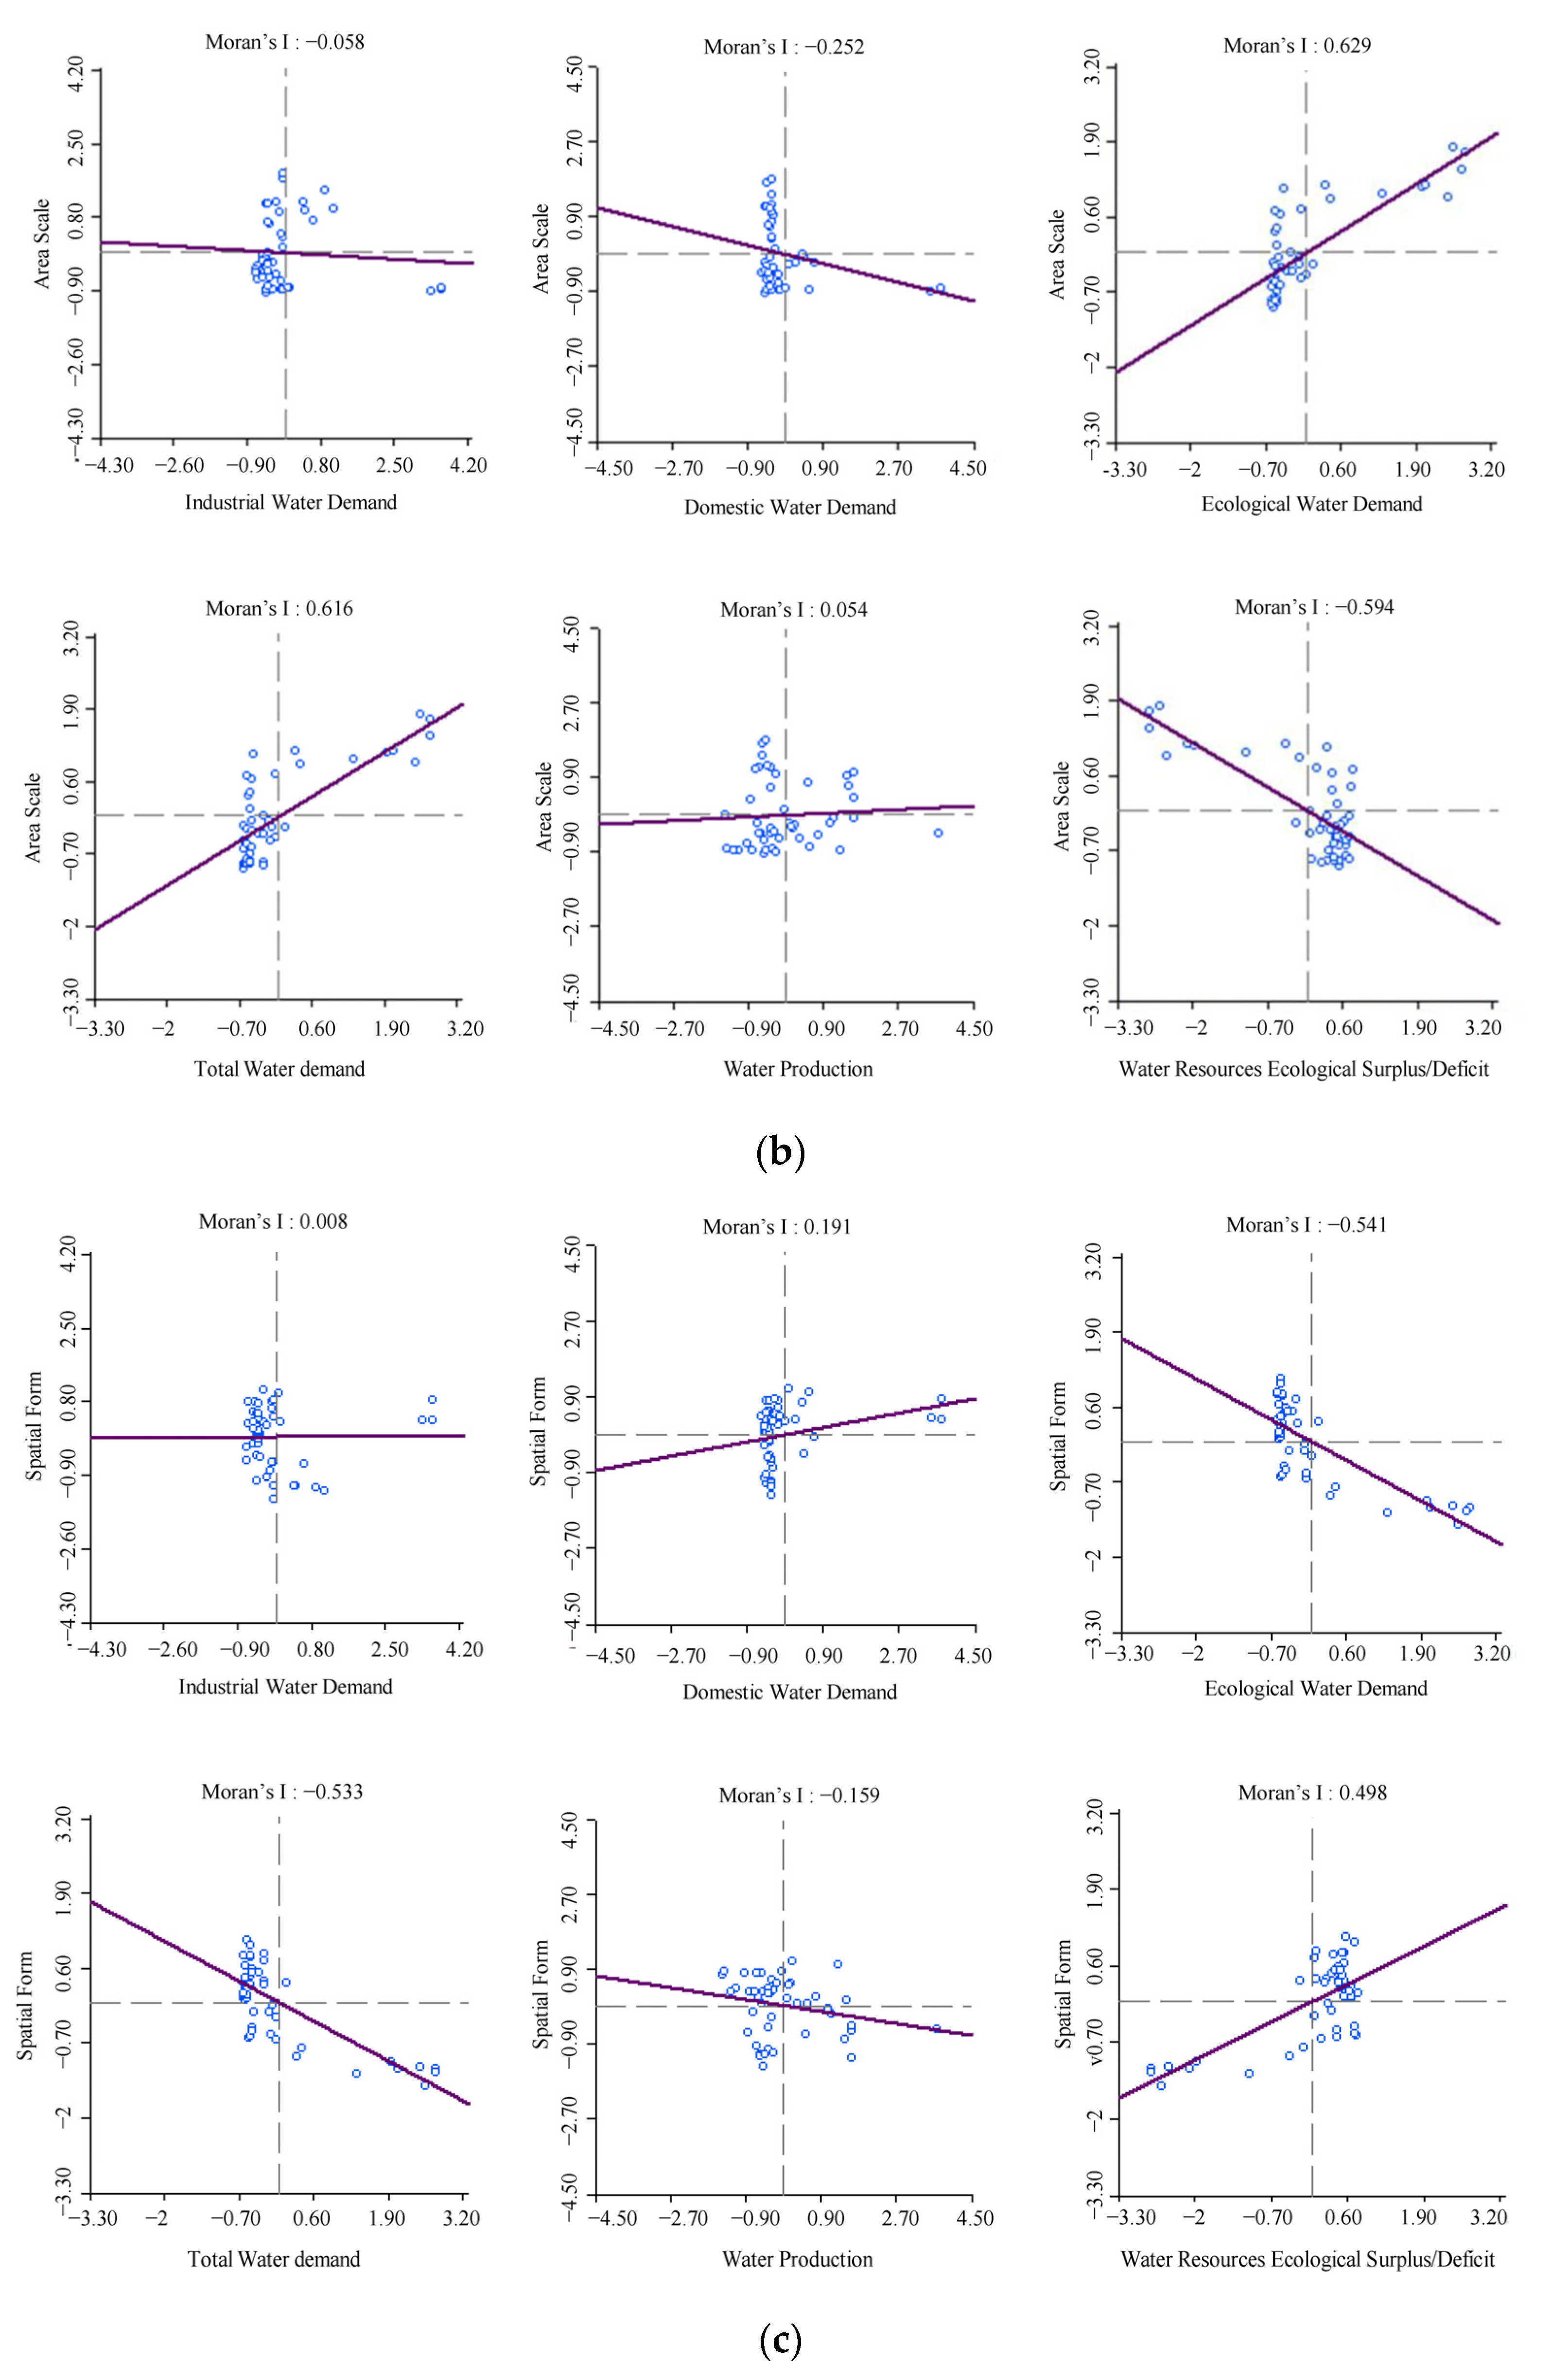
The Moran’s I values of spatial clustering and spatial forms in relation to water resource ecological surplus/deficit are 0.36 and 0.50, respectively, indicating a strong positive correlation. This suggests that as the sustainability of water resource utilization improves, rural settlements tend to cluster more, and patches become more complex and elongated. The Moran’s I value of the area scale in relation to water resource ecological surplus/deficit is −0.60, showing a negative correlation, indicating that when water conditions are better, the size of rural settlements tends to be smaller.
(4)
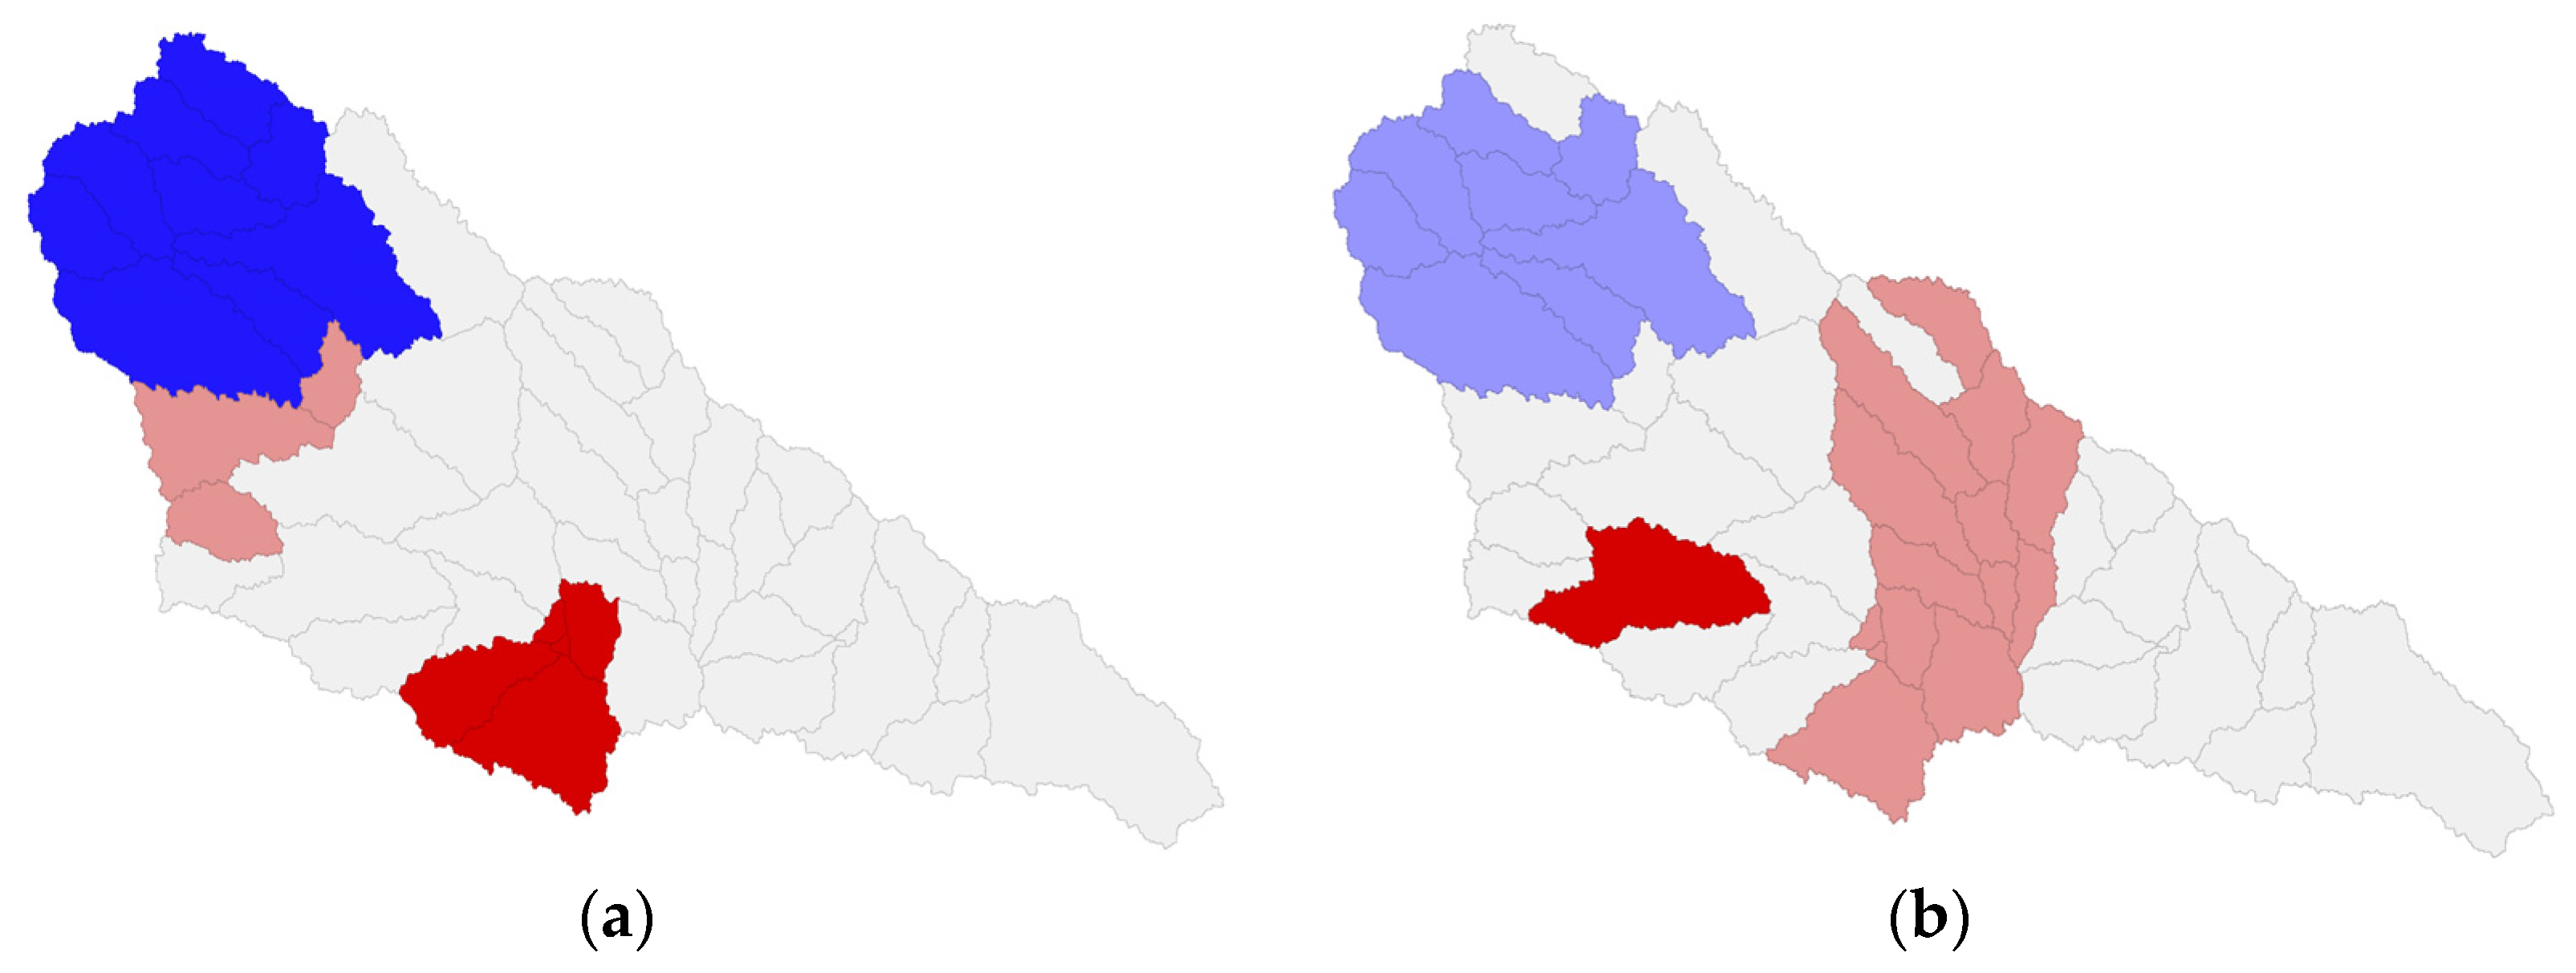
The bivariate LISA maps of water resource ecological surplus/deficit and different spatial characteristics of rural settlements have their own characteristics, but overall, they exhibit certain spatial similarities. In the upstream region of the Yanhe watershed, soil erosion is more severe, the state of sustainable water resource utilization is more challenging, and greater restrictions are imposed on the spatial development of neighboring rural settlements. The residents’ daily lives and industrial development in the Baota District have higher demands for water resources, and the water resource utilization is more strained, leading to more pronounced conflicts with the development of rural settlements.
Although this study has identified the spatial correlation between water resources and rural settlements in the Yanhe watershed, further research is needed to explore the driving factors behind this correlation. With the acquisition of more data and in-depth research, future studies will delve into the driving factors to better guide the optimization of rural settlement layout.

Author Contributions

Conceptualization, L.Z. and W.L.; methodology, W.L.; software, L.Z.; investigation, W.L.; resources, Y.D.; writing—original draft preparation, L.Z. and Q.H.; writing—review and editing, Y.D. and L.Z.; project administration, Y.D. All authors have read and agreed to the published version of the manuscript.

Funding

This research was funded by the National Natural Science Foundation of China under Grant 52178030, the National Key Research and Development Program under Grant 2022YFC3802803, the Fundamental Research Funds for the Central Universities, CHD under Grant 300102412723, and the Philosophy and Social Science Research Project in Shaanxi under Grant 2023ZD0622.

Data Availability Statement

Data will be made available on request.

Acknowledgments

The authors gratefully acknowledge the supports of various foundations. The authors are grateful to the editor and anonymous reviewers whose comments have contributed to improving the quality of this study.

Conflicts of Interest

The authors declare no conflict of interest.

References

  1. Xu, J.; Liu, S.; Xiong, Y.; Li, L. Spatial Distribution and Pattern Optimization of rural Settlements in Southern Mountain Areas—A Case Study of Xishan Yao Nationality Township in Linwu. Econ. Geogr. 2017, 37, 221–227. [Google Scholar]
  2. Ma, L.; Luo, Q.; Li, T.; Li, T.; Long, D. Evalution on the Coupling of Water Resources and Rural Development System in the Semiarid Area:A Case Study of Tongliao City. Econ. Geogr. 2017, 37, 152–159. [Google Scholar]
  3. Dong, F.; Zhao, W. Analysis of Spatial Pattern Characteristics and Influencing Factors of Rural Settlements—A Case Study of Bachuan Street in Tongliang District. J. Southwest China Norm. Univ. (Nat. Sci. Ed.) 2021, 46, 87–95. [Google Scholar]
  4. Zhang, X.; Zhou, Q. A Review of Rural Settlement in the Loess Gully Region from Multidisciplinary Perspective. Huazhong Archit. 2017, 35, 22–26. [Google Scholar]
  5. Zhang, L.; Hou, Q.; Duan, Y. Governance pattern of basin ecological space in Loess Plateau of China. Trans. Chin. Soc. Agric. Eng. 2021, 37, 206–213. [Google Scholar]
  6. Wu, Y.-K.; Luo, J.; Luo, M.-H.; Tian, L.-L.; Jiang, L.; Chen, S.-Y. Analysis of Spatial Pattern of Rural Settlements in Metropolitan Areas: A Case Study of Wuhan. Resour. Environ. Yangtze Basin 2022, 31, 37–48. [Google Scholar]
  7. Tian, Q. Restudying the Southwestern China:Forward an Interdisciplinary AreaResearch Based on Watershed-centered Approach. J. Guangxi Univ. Natl. 2016, 38, 82–86. [Google Scholar]
  8. Liu, Y.; Yang, Y.; Jiao, Y. Spatial Characteristics of Human Settlements in Terraces from the Perspective of Watershed: A Case Study of Yuanjiang River Basin. Landsc. Archit. 2019, 26, 34–40. [Google Scholar]
  9. Chen, Z.; Li, Y.; Liu, Y. Distribution pattern characteristic and type classification of rural settlements in loess hilly-gully region. Trans. Chin. Soc. Agric. Eng. 2017, 33, 266–274. [Google Scholar]
  10. He, J.-Z.; Bi, R.-T. Rural residential space differentiation characteristics and influencing factors of hilly regions and basin area in Jinzhong city. Hubei Agric. Sci. 2022, 61, 49–55. [Google Scholar]
  11. Lin, J.; Lei, J.; Wu, S.; Yang, Z.; Li, J. Spatial pattern and influencing factors of oasis rural settlements in Xinjiang, China. Geogr. Res. 2020, 39, 1182–1199. [Google Scholar]
  12. Hu, H.; Dai, W.; Xu, Y.; Lin, T. Spatial Pattern of Rural Settlements in Fuzhou Mountainous Area and Its Coupling With Water and Soil Resources. J. Ecol. Rural Environ. 2021, 37, 164–171. [Google Scholar]
  13. Sun, G.; Liu, Y.; Wang, C. Analysis on Distribution Characteristics and Evolution Mode of Rural Settlements in the Loess Plateau—A Case Study on Xiji County, Ningxia. J. Ningxia Univ. 2016, 37, 367–371. [Google Scholar]
  14. Wu, C.; Zhang, W.; Xiang, Y.-L.; Tian, D.-R. Distribution of rural settlements in the Loess Plateau of Northern Shaanxi Province from the perspective of fractal theory:a case of the Wuding River Basin. Arid Land Geogr. 2017, 40, 1307–1316. [Google Scholar]
  15. Wang, Z.-W.; Ma, L.-G.; Wang, H.-W.; Yang, S.-T.; Wang, P.; Tong, Y.-J.; Zhang, H.-T. Spatial Pattern and Influencing Factors Of Oasis Rural Settlements in Inland River Basin: A Case Study in Tarim River Basin. Resour. Environ. Yangtze Basin 2020, 29, 2636–2646. [Google Scholar]
  16. Liu, J.; Qie, R.; Wang, W. Spatial Differentiation Characteristics and Influencing Factors of Rural Settlements in Changchun City. Res. Soil Water Conserv. 2019, 26, 334–338. [Google Scholar]
  17. Wang, T.; Hui, Y.; Rui, P.; Shi, Y. Research on the morphological types and influencing factors of dispersed rural settlements based on Alpha Shape: A case study of Long Town, Mizhi County. Arid Land Geogr. 2022, 45, 946–954. [Google Scholar]
  18. Wang, J.; Liang, L.; He, M. Knowledge graph of researches on utilization efficiency of water resources in China based on CiteSpace. J. Econ. Water Resour. 2022, 40, 24–30. [Google Scholar]
  19. Liu, Z.; Zheng, Y. Evaluation of Water Ecological Carrying Capacity Based on Ecological Footprint Theory: A Case Study of Huzhou. Resour. Sci. 2011, 33, 1083–1088. [Google Scholar]
  20. Zhang, X.; Dong, T.; Du, H.; Yuan, C.; Liao, C.; Wang, F. Analysis on Spatial Heterogeneity of Landscape Ecological Risk in Fujiang River Basin. Res. Soil Water Conserv. 2022, 29, 156–163. [Google Scholar]
  21. Wang, Q.; Wang, Y.; Li, W.; Gao, M.; Fu, L. Change and Relationship of Ecosystem Services in Karst Mountainous Cities——Take Guiyang as an Example. J. Southwest Univ. 2022, 44, 158–168. [Google Scholar]
  22. Wang, H.; Zhang, M.; Wang, C.; Wang, K.; Wang, C.; Li, Y.; Bai, X.; Zhou, Y. Spatial and Temporal Changes of Landscape Patterns and Their Effects on Ecosystem Services in the Huaihe River Basin, China. Land 2022, 11, 513. [Google Scholar] [CrossRef]
  23. Xia, Y.; Zhang, Y.; Li, E.; Cai, X.; Yang, C.; Yang, J. Spatio-temporal evolution and prediction of habitat quality in Four Lakes Basin of Jianghan Plain. Resour. Environ. Yangtze Basin 2022, 31, 1616–1626. [Google Scholar]
  24. Jiang, G.; He, X.; Ma, W.; Wang, M.; Zhang, R. Rural settlements spatial pattern evolution and zoning district based on spatial autocorrelation. Trans. Chin. Soc. Agric. Eng. 2015, 31, 265–273. [Google Scholar]
  25. Yang, X.; Sun, W.; Li, P.; Mu, X.; Gao, P.; Zhao, G. Integrating Agricultural Land, Water Yield and Soil Conservation Trade-Offs into Spatial Land Use Planning. Ecol. Indic. 2019, 104, 219–228. [Google Scholar] [CrossRef]
  26. Lian, Y.; Sun, M.; Wang, J.; Luan, Q.; Jiao, M.; Zhao, X.; Gao, X. Quantitative Impacts of Climate Change and Human Activities on the Runoff Evolution Process in the Yanhe River Basin. Phys. Chem. Earth Parts A/B/C 2021, 122, 102998. [Google Scholar] [CrossRef]
  27. Wu, L.; Su, X.; Ma, X.; Kang, Y.; Jiang, Y. Integrated Modeling Framework for Evaluating and Predicting the Water Resources Carrying Capacity in a Continental River Basin of Northwest China. J. Clean. Prod. 2018, 204, 366–379. [Google Scholar] [CrossRef]
  28. Arnold, J.G.; Srinivasan, R.; Muttiah, R.S.; Williams, J.R. Large Area Hydrologic Modeling and Assessment Part I: Model Development1. JAWRA J. Am. Water Resour. Assoc. 1998, 34, 73–89. [Google Scholar] [CrossRef]
  29. Wang, X.; Wu, J.; Liu, Y.; Hai, X.; Shanguan, Z.; Deng, L. Driving Factors of Ecosystem Services and Their Spatiotemporal Change Assessment Based on Land Use Types in the Loess Plateau. J. Environ. Manag. 2022, 311, 114835. [Google Scholar] [CrossRef] [PubMed]
  30. Li, S.; Xie, J.; Paudel, B. Do Ecological Restoration Projects Undermine Economic Performance? A Spatially Explicit Empirical Study in Loess Plateau, China. Remote Sens. 2023, 15, 3035. [Google Scholar] [CrossRef]
  31. Tang, Z.; Zhou, Z.; Wang, D.; Luo, F.; Bai, J.; Fu, Y. Impact of Vegetation Restoration on Ecosystem Services in the Loess Plateau, a Case Study in the Jinghe Watershed, China. Ecol. Indic. 2022, 142, 109183. [Google Scholar] [CrossRef]
  32. Ai, Z.; Li, X.; Li, J.; Yang, Z.; Ren, Z.; Hou, M.; Yao, Y.; Cao, X.; Li, P.; Dang, X. Evaluation and Classification of Landscape Functions: A Case of Pengyang County on the Loess Plateau. Ecol. Indic. 2022, 142, 109221. [Google Scholar] [CrossRef]
  33. Su, C.; Fu, B. Evolution of Ecosystem Services in the Chinese Loess Plateau under Climatic and Land Use Changes. Glob. Planet. Change 2013, 101, 119–128. [Google Scholar] [CrossRef]
  34. Yu, P.; Shang, M.; Yao, M.; Liu, P. Water Resources Carrying Capacity Evaluation Based on Water Footprint and Principal Component Analysis in Xinjiang. J. China Hydrol. 2021, 41, 49–54. [Google Scholar]
  35. Wang, Y.; Wu, P.; Zhao, X.-N.; Li, J.-L. Development tendency of agricultural water structure in China. Chin. J. Eco-Agric. 2010, 18, 399–404. [Google Scholar] [CrossRef]
  36. Zhang, C.; Li, J.; Zhou, Z. Water Resources Security Pattern of the Weihe River Basin Based on Spatial Flow Model of Water Supply Service. Sci. Geogr. Sin. 2021, 41, 350–359. [Google Scholar] [CrossRef]
  37. Li, F.; Mi, X.; Liu, J.; Liu, X.; Prevention, I.O.D.; Center, S.C. Spatialization of GDP in Beijing using NPP-VIIRS data. Remote Sens. Land Resour. 2016, 28, 19–24. [Google Scholar]
  38. Qi, Y.; Fang, Y.; Liu, K. Issues Needing Attention in the Substitution of Night Light Data for GDP. Stat. Decis. 2023, 39, 5–10. [Google Scholar]
  39. Tan, X.; Zheng, Q. Dynamic analysis and forecast of water resources ecological footprint in China. Acta Ecologica. Sin. 2009, 29, 3559–3568. [Google Scholar]
  40. Zhang, Y.; Zhang, H.; Li, F.; Guo, L. Dynamic Analysis of the Water Resource Ecological Footprint of Guangxi Based on an Improved Mode. Resour. Sci. 2013, 35, 1601–1610. [Google Scholar]
  41. Qi, L.; Li, N. The Effect of Rural Settlements Landscape Pattern on Water Conservation in Xinbin County. Chin. J. Agric. Resour. Reg. Plan. 2019, 40, 118–125. [Google Scholar] [CrossRef]
  42. Sun, C.; Hao, S.; Zhao, L. Spatial-temporal differentiation characteristics of water resources-energy-food nexus system efficiency in China. Water Resour. Prot. 2021, 37, 61–68. [Google Scholar]
  43. Yanbo, Q.; Guanghui, J.; Yuting, Y.; Qiuyue, Z.; Yuling, L.; Wenqiu, M. Multi-scale analysis on spatial morphology differentiation and formation mechanism of rural residential land: A case study in Shandong Province, China. Habitat Int. 2018, 71, 135–146. [Google Scholar] [CrossRef]
  44. Dong, X.; Deng, J.; Zhao, M. Study on Spatial Aggregation Degree of Rural Settlement in Loess Gully Region of Northern Shaanxi Province. Chin. J. Agric. Resour. Reg. Plan. 2021, 42, 155–161. [Google Scholar]
  45. Huang, K.; Wang, Z.; Yang, S.; Jin, C. Theory, calculation method and application progress of water footprint. Adv. Sci. Technol. Water Resour. 2013, 33, 78–83. [Google Scholar]
  46. Yang, S.; Zhao, W.; Liu, Y.; Wang, S.; Wang, J.; Zhai, R. Influence of Land Use Change on the Ecosystem Service Trade-Offs in the Ecological Restoration Area: Dynamics and Scenarios in the Yanhe Watershed, China. Sci. Total Environ. 2018, 644, 556–566. [Google Scholar] [CrossRef] [PubMed]
  47. Yue, B.; Li, Y.; Wang, J. Features of oasis vernacular settlement patterns under the perspective on water resource constraints——Case study of Turpan Mazar village in Xinjiang, China. J. Arid Land Resour. Environ. 2011, 25, 80–85. [Google Scholar]
  48. Gao, K.; Lei, Y.; Zhang, R.; Chen, H. Correlation and Interaction between Vernacular Settlement in Mountain Areas and Water System with a Case Study of Azheke in Yunnan Province. Mod. Urban Res. 2021, 101–105. [Google Scholar]
Figure 1. Location map of the Yanhe watershed.
Land 12 01719 g001
Figure 2. Precipitation map of the Yanhe watershed.
Land 12 01719 g002
Figure 3. Research methodology.
Land 12 01719 g003
Figure 4. Spatial distribution of water resources in the Yanhe watershed.
Land 12 01719 g004
Figure 5. Spatial layout characteristics of rural settlements in the Yanhe watershed. (a) patch density; (b) average area; (c) fractal dimension.
Land 12 01719 g005
Figure 6. The Moran scatter plot of spatial autocorrelation between rural settlement spatial characteristics and water resources. (a) The Moran scatter plot of spatial autocorrelation between spatial clustering index and water resources. (b) The Moran scatter plot of spatial autocorrelation between area scale index and water resources. (c) The Moran scatter plot of spatial autocorrelation between spatial form index and water resources.
Land 12 01719 g006aLand 12 01719 g006b
Figure 7. LISA cluster maps of the water resources ecological surplus/deficit and rural settlements spatial characteristics. (a) WRES/D and patch density. (b) WRES/D and patch area. (c) WRES/D and patch shape.
Land 12 01719 g007aLand 12 01719 g007b
Figure 8. Mechanism of interaction between rural settlements and water resources in the Yanhe watershed. “−” indicates negative influence, “+” indicates positive influence.
Land 12 01719 g008
Figure 9. Relationship between rural settlements and water resources in the Yanhe watershed.
Land 12 01719 g009
Table 1. Bivariate Moran’s I statistics of water resources and spatial characteristics of rural settlements in the Yanhe watershed.
Industrial Water DemandDomestic Water DemandEcological Water DemandTotal Water DemandWater ProductionWater Resources Ecological Surplus/Deficit
Spatial Clustering0.21 ***0.32 ***−0.40 ***−0.38 ***−0.080.36 ***
Area Scale−0.06−0.25 ***0.63 ***0.62 ***0.05−0.60 ***
Spatial Form0.010.19 ***−0.54 ***−0.53 ***−0.16 ***0.50 ***
Note: The superscripts *** indicate significance at the 1% levels.
Disclaimer/Publisher’s Note: The statements, opinions and data contained in all publications are solely those of the individual author(s) and contributor(s) and not of MDPI and/or the editor(s). MDPI and/or the editor(s) disclaim responsibility for any injury to people or property resulting from any ideas, methods, instructions or products referred to in the content.

