Article

The Spatial Pattern Evolution of Rural Settlements and Multi-Scenario Simulations since the Initiation of the Reform and Opening up Policy in China

School of Architecture and Urban Planning, Lanzhou Jiaotong University, Lanzhou 730070, China
*
Author to whom correspondence should be addressed.
Land 2023, 12(9), 1763; https://doi.org/10.3390/land12091763
Submission received: 24 August 2023 / Revised: 8 September 2023 / Accepted: 10 September 2023 / Published: 11 September 2023
(This article belongs to the Special Issue Agricultural Land Use and Rural Development)

Abstract

:
Since the inception of China’s reform and opening-up policy, the rapidly advancing process of urbanization and the primacy accorded to urban development policies have imparted increasingly profound ramifications on rural domains. Nonetheless, antecedent research has predominantly fixated on urban sprawl, overlooking the spatial metamorphosis of rural settlements and the prospective developmental trajectories within the policy paradigm. Consequently, this inquiry endeavors to scrutinize the evolution of the spatial configuration of rural settlements in She County from the advent of reform and opening-up (1980–2020) utilizing remote sensing data. In tandem, through scenario delineation and the utilization of the CLUE-S model, it aspires to prognosticate the evolving trends in the spatial arrangements of rural settlements in She County by 2035. The empirical findings divulge that (1) The temporal progression of rural settlement spatial configurations in She County over the preceding four decades can be delineated into two discernible phases. From 1980 to 2000, alterations in the number, extent, and spatial morphological attributes of rural settlements remained circumscribed. While the count of rural settlements registered a diminution (by 3), the aggregate extent experienced a marginal augmentation (by 8.45%), concomitant with a gradual gravitation towards regular boundaries, manifesting a stochastic distribution throughout the investigation expanse. Conversely, from 2000 to 2020, the quantity and extent of rural settlements in She County underwent a precipitous augmentation (92 and 36.37%, respectively), characterized by irregular peripheries. (2) The CLUE-S model achieved an overall precision of 0.929, underscoring its applicability in emulating fluctuations in rural settlements. (3) Within the new-type urbanization scenario, the cumulative expanse of rural settlements witnessed a decline of 35.36% compared to the natural development scenario, marked by substantial conversions into grassland and urban land usage. Furthermore, orchestrated planning and directive measures have propelled the consolidation of rural settlements in She County, engendering a more equitable and standardized layout. Under the aegis of the ecological conservation scenario, the total rural settlement area recorded a 0.38% reduction vis-à-vis the natural development scenario, primarily entailing competitive coexistence with arable land, grassland, and urban land usage in spatial terms.

1. Introduction

Inappropriate land utilization practices are currently imperiling the global trajectory toward sustainable development, thereby compounding the intricacies associated with realizing the objectives of SDG13 (Addressing Climate Change) and SDG16 (Preserving, Restoring, and Promoting Sustainable Land Ecosystems) [1,2]. Within the intricate tapestry of our planet’s ecological dynamics, land emerges as a finite and non-renewable resource, pivotal in the intricate interplay of human societal and economic dynamics [3]. However, the prevailing landscape is marred by a series of suboptimal land usage paradigms that not only upset ecological equilibrium but also cast shadows upon the tenets of socio-economic sustainability [4]. The convergence of rational and systematically orchestrated land utilization patterns assumes an eminent significance in the face of global climate fluctuations, eroding biodiversity, and the pressing matter of food security, among others [5,6]. Through prudent land apportionment, the reduction of carbon emissions and the preservation of biodiversity can be harmonized with the provisioning of ample arable land to satiate humanity’s nutritional requisites [7,8]. Nevertheless, as the global populace continues its relentless expansion, the scarcity of land resources is destined to escalate, further exacerbating the tensions between burgeoning human needs and the limited expanse of the land [9]. Hence, it becomes imperative to recalibrate our vantage point and embrace the pivotal role of land utilization metamorphosis in elevating the quality of our habitation and propelling sustainable human advancement.
Rural settlements, the foundational units of rural production and subsistence, are pivotal in upholding familial bonds and facilitating social interactions [10]. However, the rapid global march of urbanization has spawned the unremitting expansion of urban areas, imparting profound repercussions on the trajectory of rural settlements and the associated challenges they confront [11]. For instance, in advanced economies, certain nations like France and Athens have prioritized urban expansion, inadvertently disregarding the excessive encroachment of urban sprawl upon rural settlements, leading to a fragmentation of rural settlement distributions [12,13]. Conversely, during Poland’s urban economic metamorphosis, rural settlements experienced similar flourishing, giving rise to diverse village typologies encompassing domains such as tourism, entertainment, and agriculture [14]. However, Lithuania’s swift urban development has triggered an excessive outflow of rural populations, culminating in the rapid vanishing of rural settlements [15]. In a parallel vein, China, as the world’s most populous developing nation, has placed a distinct emphasis on the expansion of urban areas after economic reforms [16].
Nonetheless, this rural-urban developmental disbalance has bred a litany of pressing concerns, encompassing the sluggish socioeconomic progress of rural regions, inadequate preservation of cultural heritage, exacerbated population outmigration, and the conspicuous lack of unified governance and strategic planning for rural settlements [17,18]. This scenario has crystallized into the emergence of a distinctive dual urban-rural paradigm [19]. Acknowledging the profound historical heritage of rural China, rural settlements wield a critical role in nurturing their inhabitants’ spiritual and material cultural lives [20]. Hence, it is imperative that we accord paramount attention to rural development concerns, particularly those entwined with rural settlements.
Recognizing the dynamic spatial transformations of rural settlements assumes profound significance in pursuing rational configurations and efficacious planning for these habitation clusters [21]. However, methodological and data disparities emerge among scholars across different national contexts. Drawing upon conventional survey data, Polish scholars unearth that within the ambit of 15 villages encompassing Lublin city, a conspicuous trend of settlement expansion is discerned in closer proximity to the urban core and major transportation arteries. This expansion, nevertheless, correlates with a reduction in the proportion of agricultural expanse, accompanied by architectural nuances diverging from traditional rural motifs [14]. In the context of Lithuania, the diminishing demographic sway of rural denizens prompts a recalibration of rural settlements within suburban peripheries or adjacency to agrarian enterprises, with extant rural dwellings subject to a comprehensive spatial blueprint to regiment developmental trajectories [15]. Harnessing remote sensing-derived land use data, Slovenian investigations underscore the interval from 1991 to 2005, wherein rural settlements exhibit an augmenting central functional locus, correspondingly accompanied by an ascent in density within proximate hinterlands [22]. An exploratory foray into the Indian province of West Bengal spanning 1975 to 2020 divulges an uneven spatial distribution and variable pace of rural residential domain expansion. Concurrently, the fortification of public utilities embracing education, healthcare, communication, and commercial infrastructure facilitates the confluence of rural habitats and attains a harmonized scale, concurrently attenuating reliance on urban nuclei [23]. Worth underscoring is that while the trove of antecedent research on rural habitat transmutations furnishes a diverse spectrum of insights and pragmatic solutions, the unique tapestry of China’s rural fabric, characterized by historical profundity, demographic amplitude, and pronounced economic heterogeneity across regional demarcations, necessitates nuanced consideration. When juxtaposed against orthodox data modalities germane to examining rural settlements, remote sensing datasets offer heightened visual lucidity and proffer more conspicuous patterns, thus exhibiting an enhanced alignment with the mandate of discerning spatial evolution within the contours of Chinese rural settlements [24]. Furthermore, the judicious calibration of bespoke policies and pragmatic measures tailored to the developmental trajectory of rural settlements mandates an in-depth grasp of their protracted evolution [25].
Simulating land use changes under diverse scenarios assumes a pivotal role in the formulation of empirically grounded decisions, fostering the tenets of sustainable development, and orchestrating resource management strategies [26]. For instance, within land use dynamics intertwined with global urbanization, scholars in the United States undertook simulations encompassing the intricate tapestry of land cover patterns across an expansive spectrum of 2000 urban agglomerations [27]. In the context of the East African Rift Valley Basin, researchers diligently sought to simulate the metamorphosis of land use patterns within the Matenchose watershed, therein affording a quantification of its manifold ramifications upon the finite troves of natural resources [28]. Across the topography of Romania, scholars embarked upon an intellectual odyssey of simulating the transformative contours of land use, thereby probing the latent underpinnings underpinning environmental stewardship and the dynamics of land management paradigms [29]. This investigative expanse was further enriched by manifold cross-scenario simulations orchestrated to discern the optimal vantages within the mosaic of land utilization strategies. Japanese scholars, for instance, judiciously deliberated upon the cascading consequences that divergent climatic and land use scenarios visited upon the aqueous resources of watersheds, therein illuminating their intricate interplay [30]. In concert, a constellation of research endeavors proliferated, adorning the landscape of inquiries spanning the gamut from simulating the vicissitudes of land use under the aegis of climatic transmutations to addressing the imperatives of food security and confronting the frangible precincts of ecological vulnerability [31,32,33].
Nonetheless, while this corpus of scholarship coalesces around the liminal realm of land use transitions, a discernible lacuna in the annals of research pertains to the prognostication and simulation of developmental trajectories intrinsic to rural settlements. Concurrently, prevailing inquiries that dissect the prospects of simulation and prognostication inherent to rural settlements predominantly gravitate toward the troposphere of natural expansion, with scant consideration afforded to the entwined narrative of rural settlement evolution as it exists within the interplay of policy incentives and spatial governance dynamics [34]. Functioning as enclaves of paramount importance, rural settlements constitute the crucible within which the alchemy of policy determinism and socioeconomic dynamics coalesce [35]. Hence, the harmonious integration of policy levers into the ambit of scenario formulations, as they traverse the landscape of prognosticating and simulating the spatiotemporal choreography of rural settlements amid varying policy interventions, assumes profound salience. Within this intellectual precinct, the rubric of assessing nascent rural settlement paradigms and the sculpting of judicious developmental templates stands poised at the precipice of significance. In tandem, this intellectual pursuit serves as a vanguard, proffering the blueprints and directives that underpin the trajectory of rural spheres, instilling them with foresight and navigational clarity.
Against the backdrop of policy imperatives and human activities, the spatial configuration of rural habitation within She County has traversed a trajectory of evolvement. In their predictive and simulated manifestations, divergent scenarios expound the potential permutations that might be engendered within She County’s rural habitation landscape. Nevertheless, prevailing research exhibits a proclivity toward urban dynamics, leaving the study of rural settlements relatively marginalized. Concomitantly, the orchestration of scenarios often disregards the nuances of regional contexts and the dynamic flux inherent within planning policies. Within this framework, the objectives of this study are threefold: firstly, to scrutinize the mutational trends underpinning the dimensions of rural habitation within She County across the temporal span from 1980 to 2020; secondly, to unveil the distinctive characteristics and patterns underpinning the spatial evolution of rural habitation during this period; lastly, employing simulation and projection methodologies, to dissect the trajectories and pivotal attributes of rural habitation dynamics across varying scenarios. By traversing this intellectual terrain and filling a lacuna in scholarship, this study aspires to proffer a more comprehensive vista, thereby affording a deeper comprehension of the intricate interplay engendering the relationship between urbanization and rural developmental paradigms.

2. Study Area and Data Sources

2.1. Study Area

Situated in the Hebei Province of China, precisely at coordinates 36°17′ N–36°55′ N and 113°26′ E–114° E, She County holds a strategic location within the city of Handan. Nestled on the eastern foothills of the Taihang Mountains, this county occupies the southwestern realm of Hebei Province, forming a nexus at the confluence of the Shanxi, Hebei, and Henan provinces. Reverberating as an essential hinge, She County exemplifies its significance as a pivotal juncture connecting the prominent Jing-Jin-Ji (Beijing-Tianjin-Hebei) region with the heart of the Central Plains, thereby assuming a distinctive locus (see Figure 1). Notably, She County boasts the distinction of being included in the third tranche of comprehensive national pilot areas for pioneering new urbanization endeavors—a designation conferred in December 2016 [36]. Its topographical tapestry predominantly comprises rugged terrain, with an average elevation cresting at 1000 m, punctuated by a zenith at 1562.9 m. Distinguished by a warm temperate continental monsoon climate, the annual precipitation quantifies to 571.7 mm, painting the climatic canvas. As of the terminus 2020, She County encompassed a total populace of 432,754 souls, with an urbanization quotient marking 65.11%. In 2020, the county’s gross domestic product (GDP) scaled 17.282 billion yuan, encapsulating a year-on-year escalation of 4.5%. A facet warranting attention resides in the per capita disposable income for denizens of urban provenance, constituting 26,630 yuan, bearing witness to a 4.9% augmentation, whereas, for their rural counterparts, this metric stood at 15,676 yuan, manifesting a 6.6% augmentation [37].

2.2. Data Sources

The data utilized in this study can be categorized into two main types: natural geographic data and socio-economic data (Table 1). The natural geographic data encompass land use, digital elevation model (DEM) data, and water bodies. The socio-economic data encompass population density, gross domestic product (GDP), railway networks, road networks, and nocturnal luminosity data. Details regarding these data’s temporal scope, resolution, sources, and intended applications are provided below.

3. Research Methodology

In this study, we employed several methods to achieve our objectives. Firstly, we extracted rural settlement data in She County using land use data. Subsequently, we employed the spatial rhythm index and average nearest neighbor index to ascertain the spatial patterns and evolutionary characteristics of rural settlements in different periods. Lastly, we utilized the Markov model and CLUE-S model to predict and simulate the spatial distribution of rural settlements under various developmental scenarios.

3.1. Measurement of Spatial Landscape Patterns

3.1.1. Spatial Rhythm Index

The utilization of the Spatial Rhythm Index commonly elucidates the dynamic evolution of land utilization patterns, thereby encapsulating pertinent insights into the configuration of landscapes and the spatial arrangement of elements. Within the scope of this study, the selection of indices is poised to be both focused and comprehensive, strategically capturing the multifaceted attributes pertaining to the spatial disposition and developmental scale of rural settlements [46]. Consequently, we have judiciously chosen density indicators (reflecting patch count), land use indicators (pertaining to patch area), scale indicators (encompassing average patch size and the largest patch index), and shape indicators (encompassing the landscape shape index) to aptly delineate the evolutionary traits of the spatial pattern exhibited by rural settlements. The computation of all selected indices can be adeptly performed using the Fragstats software suite, which draws upon land utilization data germane to rural settlements. A comprehensive elucidation of the meanings and mathematical formulations for each index is elucidated in Table 2.

3.1.2. Average Nearest Neighbor Index

The Average Nearest Neighbor Index (NNA) offers a lens to illuminate the spatial disposition and clustering propensities of rural settlement patches [49]. This method entails gauging the mean distance between each patch’s centroid and that of its closest neighbor. This average distance is subsequently juxtaposed against the expected average distance derived from a hypothetical random distribution model. This comparison aims to discern whether the arrangement of patches showcases tendencies towards spatial clustering, thereby shedding light on the clustering tendencies of settlements. Calculating the NNA value can be facilitated using the spatial analysis capabilities within ArcGIS 10.8 software, with the formula presented as follows:
N N A = i = 1 n d i / m n / R / 2
where d i represents the distance between the centroid of the ith rural settlement patch and the centroid of its nearest neighboring rural settlement patch, measured in meters (m). n denotes the total count of rural settlement patches, while R signifies the area of the minimum bounding rectangle that encompasses all rural settlement patches within the study area, expressed in square meters (m2). A NNA value of 1 indicates a random distribution pattern of rural settlement patches. Conversely, if NNA < 1, it reflects an aggregated spatial distribution of rural settlement patches. On the other hand, values exceeding 1 suggest a dispersed distribution of rural settlement patches.
In addition, a significance test is required to be conducted. Further assessment of the significance of the NNA values is accomplished by calculating standardized Z scores [49]. In this study, we utilized ArcGIS 10.8 software to extract the rural settlement patches of She County as points. Subsequently, the ArcGIS spatial statistics tool was employed to calculate the Z scores for the years 1980, 2000, and 2020, aiding in determining the spatial distribution pattern of rural settlement patches in She County, whether they exhibit clustering or dispersion. The formula employed is provided below:
Z = d i ¯ E ( d ) v a r ( d i ¯ E ( d ) )
where di represents the distance between the centroid of the ith rural settlement patch and the centroid of its nearest neighboring rural settlement patch, measured in meters, and the average nearest neighbor distance is denoted as E(d). If Z exceeds 1.96 or falls below −1.96, it signifies a statistically significant d value. Conversely, if the Z value falls within the range of −1.96 to 1.96, no statistically significant difference is observed.

3.2. Simulating and Predicting the Spatial Evolution of Rural Settlement Patterns

The simulation of land use dynamics, informed by driving factors and the competitive interactions among different land use categories, is executed through the iterative spatial allocation methodology of the CLUE-S model [50]. This model encompasses two principal modules: the non-spatial demand and spatial allocation modules. The former determines the composition and quantities of land use types under various scenarios, while the latter employs binary logistic regression to allocate these demands to suitable spatial locations within the study area based on the cumulative probability of land use requirements across scenarios. This intricate process replicates the evolving spatial configuration of land use changes. Notably, CLUE-S is a refined adaptation of the original CLUE model, meticulously tailored to simulate land use transitions within smaller geographic regions. The operationalization of the CLUE-S model necessitates an array of input files, encompassing the baseline land use map of the study area for the initial simulation year, datasets related to land use demands, transition matrices for land use conversions, driver-specific data, and the central parameter configuration files integral to the model’s functioning.
The choice to set the year 2035 as the focal point of our simulation holds significance due to a well-considered rationale. We projected future land use changes over a two-decade span (2015–2035) based on the land use change rates observed during the preceding ten years (2005–2015). Given the formal designation of She County as a pilot zone for new urbanization initiatives by national authorities in 2015, our decision to utilize data predating that year was motivated by a desire for a more accurate portrayal of the county’s forthcoming land use dynamics. Furthermore, in harmony with local governance strategies, the She County government has ratified the “Overall Land Spatial Planning for She County (2021–2035)”, henceforth referred to as the “She County Land Spatial Plan”. This plan articulates 2035 as the ultimate target year, with an interim milestone in 2025 [37]. In alignment with these strategic guidelines, our study strategically adopts 2035 as the designated target year.

3.2.1. Non-Spatial Demand Module

In the context of simulating the 2035 land use changes, the non-spatial demand module assumes a critical role in quantifying alterations in land use types driven by diverse factors or demands within distinct scenarios. In this study, we have delineated three scenarios: Natural Development, New Urbanization, and Ecological Conservation, each designed to encapsulate the evolving patterns of rural residential settlements in She County.
(1)
Natural Development Scenario
The Natural Development Scenario unveils the impending landscape of land use changes and the trajectory of rural residential settlement evolution in She County. In this scenario, the change rates for different land cover categories adhere to historical trends. This scenario is a foundational reference point, illuminating the nuanced developmental trajectories of land use and rural residential settlements within She County. Accordingly, the land use areas for each land cover category in 2035 are projected based on the observed land use change rates from 2005–2015. Furthermore, the land use type areas for each year between 2015 and 2035 are derived through linear interpolation techniques.
(2)
New Urbanization Scenario
The New Urbanization Scenario primarily focuses on the prospective patterns of land use and the evolution of rural residential settlements following the implementation of the New Urbanization Plan.
In December 2016, She County was designated one of China’s third National Comprehensive Pilot Zones for New Urbanization [36]. The future developmental trajectory of She County is intricately tied to the contours of China’s New Urbanization policy. To quantitatively assess the policy’s impact, an in-depth analysis of its specifics and distinctive features is essential. This serves as the foundation for allocating scales and spatial distributions to various land use types, ultimately formulating the requirements for different categories of land utilization. The essence of the New Urbanization policy revolves around placing people at the heart of urbanization, necessitating the transformation of rural inhabitants into urban citizens. This transformation is epitomized by the migration of rural residents to urban areas. Accordingly, using projected urban and rural population figures for 2035 and employing Primary Indicator Drivers (PID), we delineate the demand for urban and rural habitation. Moreover, as New Urbanization mandates coordinated industrial growth, emphasizing the harmonious development of urbanization alongside the respective economic and industrial foundations, we can ascertain the requisites for other construction land based on the migration patterns of the rural labor force.
Regarding population data and land use change values, the Primary Indicator Drivers (PID) approach can deduce the increments in target land use types resulting from population growth and subsequently compute the corresponding land use quantities for future urban and rural populations of She County. The formula for this process is as follows [21]:
U ( t ) = A ( t )
Taking the rural registered population as an example, in the equation, U(t) represents the increase in the quantity of land occupied by rural settlements within a specific period in the study area; d p d t signifies the growth of rural population during the same period; A(t) denotes the increase in the quantity of land occupied by rural residential areas due to the rise in per capita population.
Moreover, within the context of the current intermediate urbanization rate (65.11%) prevailing in the study area, the realization of this process necessitates the continual expansion of urban land to accommodate the urbanization of the populace and the augmentation of other construction land for industrial advancement. The Land Use Spatial Planning of She County outlines that by the year 2035, the total permanent population of the county is projected to reach 712,100, with an urban population of 526,900 and an urbanization rate of 74%. The total area allocated for construction land across the entire jurisdiction is estimated at approximately 178.81 square kilometers. Within this expanse, urban construction land is earmarked for 92.74 square kilometers, while rural residential land covers 30.8 square kilometers. Hence, drawing on the PID methodology, it becomes feasible to compute the anticipated demands for urban and rural residential land by 2035.
Furthermore, due to the imperative of ecological conservation stipulated by the new paradigm of urbanization, there arises the need for a commensurate increase in ecologically designated lands, such as forests and grasslands. In tandem, the expansion of urban areas may inevitably lead to a concomitant reduction in arable land. In sum, juxtaposed with the scenario of natural growth, the trajectory of new-model urbanization underscores the necessity for augmenting areas dedicated to urban spaces, other construction purposes, as well as forested and grassland areas while concurrently scaling back the allotment of land for rural residential use. Grounded in these considerations, the imperatives for land allocation across various categories in 2035 can be effectively ascertained.
(3)
Ecological Protection Scenario
The ecological protection scenario incorporates ecological security constraints into the natural development scenario, aiming to safeguard the ecological environment and restrain unregulated conversions of existing natural ecological land. Accordingly, this scenario intensifies the emphasis on conserving forested areas, grasslands, and water bodies while rigorously constraining the expansion of arable and construction land. Concurrently, the likelihood of converting ecologically functional grasslands, forests, and water bodies in She County into construction and arable land is diminished within the purview of this ecological scenario.

3.2.2. Spatial Allocation Module

The spatial allocation module encompasses the allocation of land use data from distinct scenarios into appropriate spatial locations, with the objective of simulating the spatial arrangement of land use changes [51]. Throughout the spatial allocation process, we integrate spatial policies as a foundational element, establishing designated restricted conversion zones to guide the spatial distribution of land use.
(1)
Restricted Conversion Zones
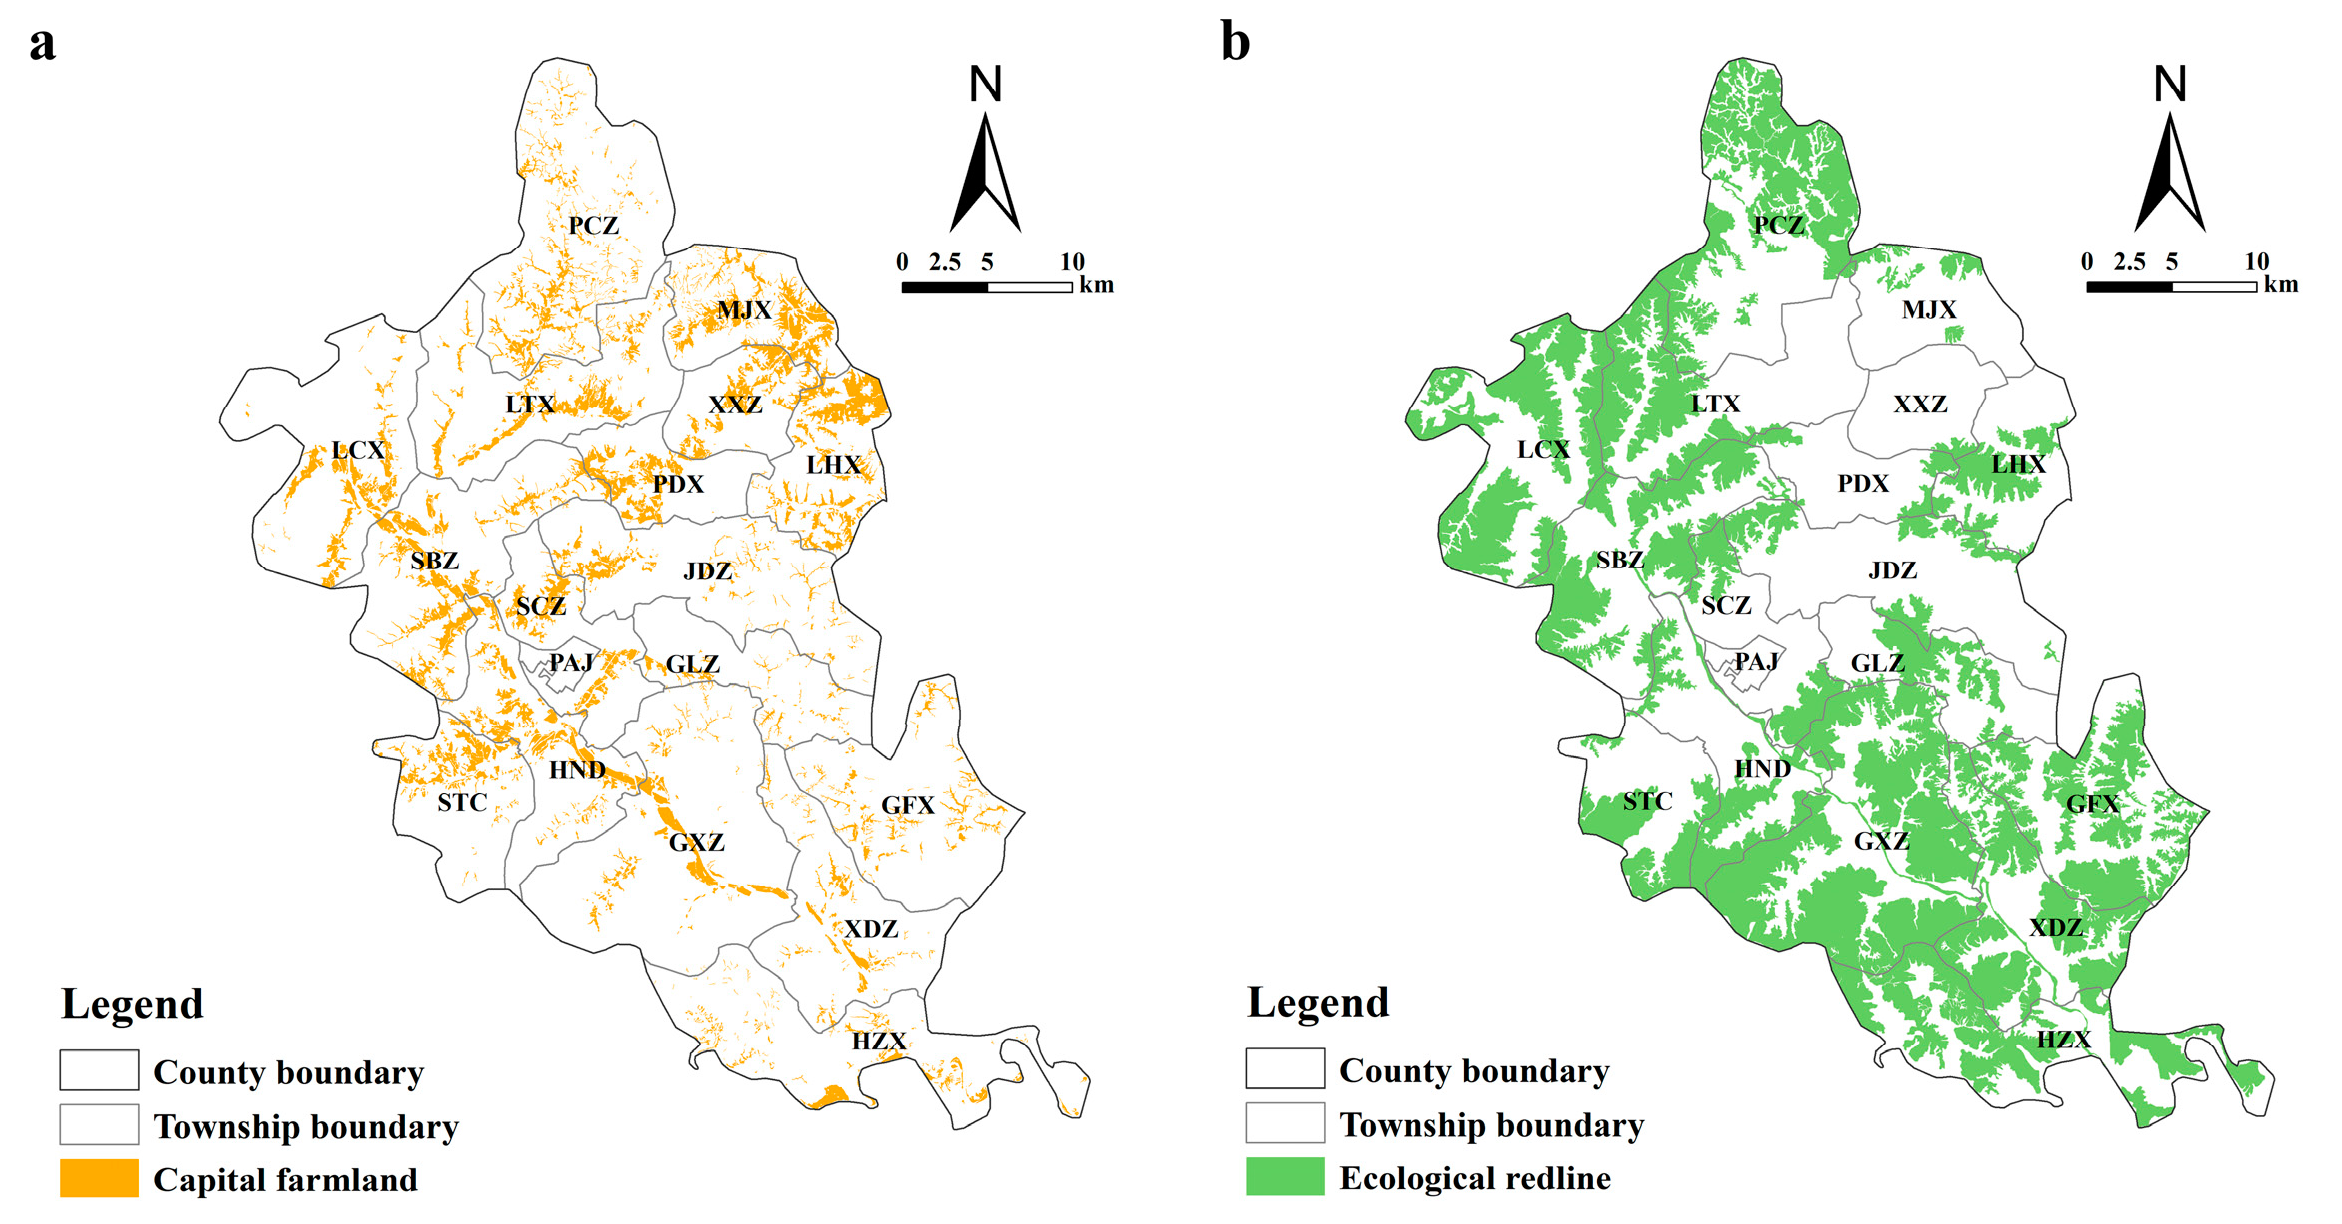
Establishing policy-driven restricted conversion zones is primarily predicated upon the actual transformation patterns of land use types. In conjunction with China’s Third National Land Survey, we have delineated distinct prohibited conversion zones for varying development scenarios (Figure 2). In conventional urbanization, where land use changes adhere to natural developmental trajectories and encompass unrestricted conversions of land use types, no explicitly defined restricted zones are designated. Conversely, within the ambit of the new urbanization scenario, we meticulously adhere to directives outlined in documents such as the “National New Urbanization Plan (2021–2035)”, “Handan City New Urbanization Plan (2021–2035)”, and She County’s Land Spatial Plan. The crux of the new urbanization policy lies in eschewing any compromise vis-à-vis agriculture, food security, ecology, and the environment.
Furthermore, She County’s Land Spatial Plan ensures the safeguarding of arable land and guarantees the security of staple food and vital agricultural products. Henceforth, the essential cropland areas in She County’s Land Spatial Plan are marked as restricted conversion zones (Figure 2a). Within the framework of ecological protection, we hew closely to the ecological protection red line policies enunciated in She County’s Land Spatial Plan. Areas encircled by the ecological protection red line shall be stringently managed, with an unequivocal prohibition on development, implementation of stringent access controls, and rigorous oversight of construction activities. A phased withdrawal strategy, contingent on real-world contingencies, is concurrently instated. Beyond the ecological protection red line, a classification-driven management approach is adopted. With a paramount emphasis on conservation, imperative ecological restoration initiatives are undertaken while safeguarding ecological functionality and preserving ecosystems. This approach, underpinned by planning and control precepts, facilitates judicious development. Consequently, areas demarcated within She County’s ecological protection red line are demarcated as restricted conversion zones (Figure 2b).
(2)
Driver Analysis
Distinct driving factors exert varying influences on both land use changes and the evolution of rural settlements. To effectively elucidate the nuanced impacts of these factors, we draw upon research findings pertaining to rural settlements and judiciously select a comprehensive set of nine driving factors for the evolution of rural settlements. These factors encompass elevation, slope, aspect, distance to water bodies, distance to roadways, distance to railways, GDP, population density, and nocturnal luminosity data (depicted in Figure 3) [10,21,52]. Notably, slope and aspect data are derived from the Digital Elevation Model (DEM) dataset, and all distance metrics are calculated as Euclidean distances utilizing ArcGIS 10.8. These driving factors are meticulously resampled to a spatial resolution of 30 m × 30 m and converted into ASCII files, which are pivotal input factors for the CLUE-S model.
Before conducting simulations, it is imperative to assess the compatibility of all driving factors with the simulation prerequisites. Employing the Convert module within the CLUE-S model, we transformed all driving force files into a txt format, subsequently inputting them into the SPSS software for binary logistic stepwise regression analysis, yielding regression coefficients (β values) [53]. This approach was deployed to scrutinize the driving factors, providing insight into the quantitative relationship between the spatial distribution of distinct land-use types and the driving forces influencing their spatial allocation, as elucidated by the ensuing equation:
log P i 1 P i = β 0   +   β 1   X 1 , i   + β 2 X 2 , i + + β m X m , n
where P i (ranging between 0 and 1) denotes the likelihood of the spatial distribution (suitability) of land-use type i at each grid unit. X i represents the influencing factors on land-use type i, and β i corresponds to the coefficient linked with the driving factors specific to land-use type i.
The validation of the Logistic regression results is assessed using the ROC (relative operating characteristics) analysis. A ROC value below 0.5 indicates a weakened explanatory capacity of the driving factor for the specific land class. Conversely, when the ROC surpasses 0.7, the selected driving factors demonstrate strong explanatory capabilities, rendering them suitable for simulation within the study area. Regression coefficients calculated from the driving force files with ROC values exceeding 0.7 are then selected for simulation.

3.3. Spatial Iterative Computation

The CLUE-S model utilizes spatial iterative computation to determine the total probabilities of each land use type, primarily through the spatial allocation module for simulating the spatiotemporal patterns of land use [54]. The formula for spatial iteration is as follows:
T P R O P i , u = P i , u + E L A S u + I T E R u
where T P R O P i , u denotes the comprehensive probability associated with land use type u on grid i, while P i , u signifies the probability of the spatial distribution (suitability) of land use type u, computed through the logistic regression equation for grid i. The term E L A S u represents the elasticity transformation coefficient specific to land use type u, and its inclusion is contingent upon grid unit i already belonging to land use type u during the considered year. Additionally, I T E R u serves as an iterative variable that conveys the relative competitive dynamics of the land use type.

3.4. Evaluation of Simulation Accuracy

Before applying the CLUE-S model to project future land use dynamics across various scenarios, a preliminary evaluation of its simulation accuracy is essential. The Kappa index, commonly employed for assessing classification image precision, is our chosen metric for this evaluation [52]. In this study, we employ the Kappa index to quantitatively gauge the simulation performance of the CLUE-S model. Specifically, the reference year of 2005 forms the baseline, against which we simulate land use changes for 2015 through the model application. Subsequently, the simulated outcomes are juxtaposed with actual land cover data from 2015, enabling a thorough appraisal of the simulation accuracy. The Kappa index formula, central to this assessment, is articulated as follows:
K a p p a = P m P n P p P n
where P m represents the proportion of accurately simulated outcomes; P n denotes the anticipated proportion of accurate simulations under random circumstances; and P p signifies the proportion of accurate simulations under ideal classification scenarios. It is generally acknowledged that Kappa values within the range of 0.41 to 0.60 indicate viable model simulation outcomes, reflecting a moderate level of concordance. Kappa values falling between 0.61 and 0.80 suggest favorable model simulation results, showcasing a substantial degree of concurrence.

4. Research Results

4.1. Evolution of Rural Settlement Size from 1980 to 2020

The cumulative expansion of rural settlement extents in She County demonstrated a sustained growth trajectory spanning 1980 to 2020. Over this temporal span, the collective augmentation of rural settlement areas aggregated to 1448.19 hectares, as depicted in Table 3. Significantly, distinct developmental phases emerged, each marked by its characteristic features. During the initial period encompassing 1980 to 2000, the enlargement of rural settlement dimensions in She County exhibited a restrained progression. The alteration in patch areas amounted to 255.21 hectares, characterized by an annual growth rate of 0.42%. Notably, the year 2000 witnessed a reduction in the number of patches compared to 1980, presenting a negative growth rate of −0.1%. This stage indicated a comparatively gradual development of rural settlements, marked by constrained size escalation. In the subsequent era spanning 2000 to 2020, the rural settlement domain in She County underwent a substantial expansion, accruing 1192.68 hectares. Within this timeframe, the aggregate number of patches reached 149, demonstrating an annual growth rate of 3.1%, while the patch areas experienced an average annual growth rate of 1.82%. In stark contrast to the 1980–2000 phase, this period was characterized by an accelerated pace of rural settlement development and a notable surge in size. Notably, despite reaching their pinnacle in terms of patch count and cumulative area by 2020, rural settlements in She County exhibited the smallest average patch area during this juncture, measuring 18.56 hectares. In juxtaposition, the zenith of the average patch area occurred in 2000, registering at 22.01 hectares.

4.2. Evolution of Spatial Patterns of Rural Settlements

Between 1980 and 2020, the spatial distribution of rural settlements in She County exhibited a progressive shift towards irregularity and fragmentation. Taking the years 1980, 2000, and 2020 as pivotal instances, the landscape shape index of rural settlements in She County registered values of 15.22, 15.08, and 22.65, respectively. These values indicate a pattern where the landscape shape index of rural settlements initially declined before experiencing an upward trend. Notably, post-2000, there was a noticeable intensification of irregularity in the external configuration of rural settlements. The landscape morphology of rural settlements in She County appeared to reach a turning point around the year 2000. Before 2000, rural settlements displayed a tendency towards spatial regularity. However, from 2000, irregular tendencies became more pronounced, leading to a greater degree of irregularity and fragmentation in the landscape morphology of rural settlements. Moreover, the proportion of the largest contiguous rural settlement patch relative to the total landscape area in She County for 1980, 2000, and 2020 stood at 7.30%, 7.41%, and 3.68%, respectively. This metric underscores the escalated fragmentation of rural settlements post-2000, accompanied by a diminishing area of the largest contiguous patch.
Moreover, from 1980 to 2020, the NNA (Nearest Neighbor Analysis) values for rural residential points in She County consistently remained below 1, indicating a tendency towards spatial agglomeration in Table 4. Furthermore, the corresponding Z-values for these rural residential points consistently fell below −1.96, underscoring a statistically significant spatial clustering pattern. In addition, the NNA (Nearest Antecedent Analysis) values for 1980, 2000, and 2020 exhibited a progressive increase (0.2453, 0.2554, 0.2822). This trend suggests that the degree of spatial aggregation among rural residential points in She County has gradually lessened since 1980.
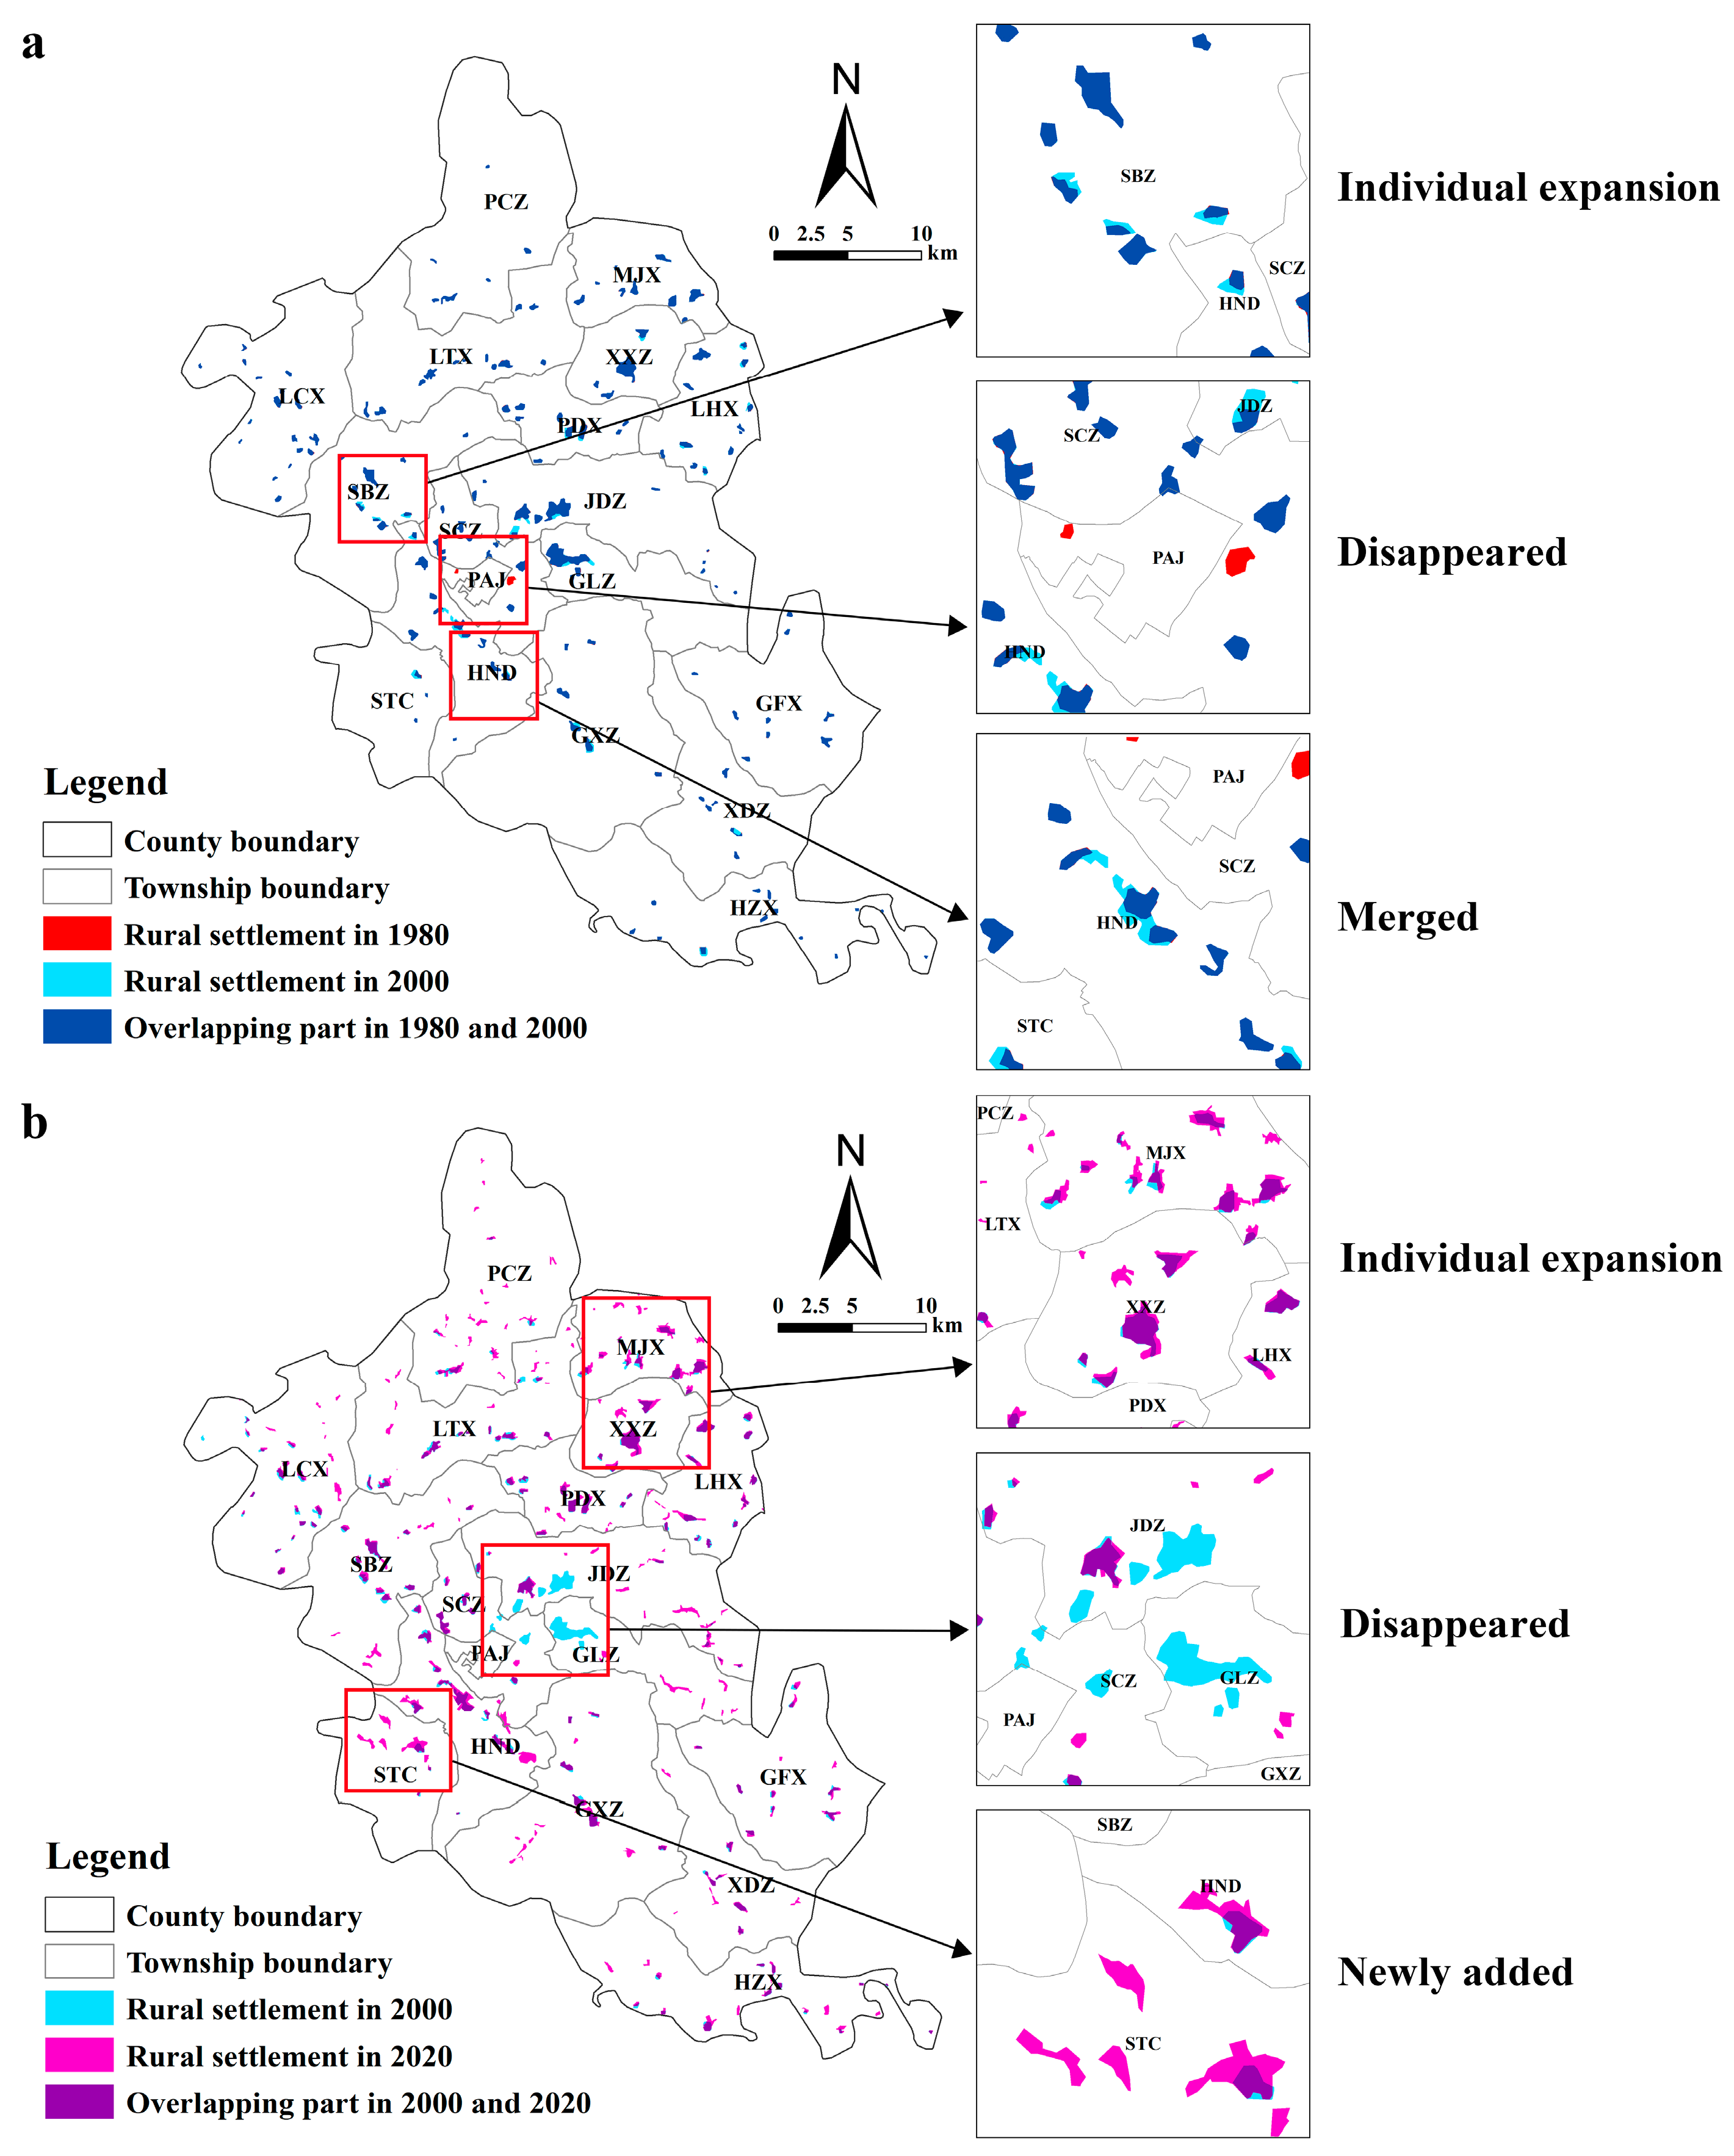
From 1980 to 2020, the evolution of the spatial pattern of rural residential points in She County can be delineated through four distinct modes: the expansion of preexisting settlements outward (termed individual expansion), the spontaneous amalgamation of smaller and dispersed settlements into larger entities (referred to as agglomeration), the removal of existing rural residential points (characterized as disappearance), and the emergence of new rural residential points (labeled as an addition) (Figure 4). During the period spanning 1980 to 2000, the spatial configuration of rural residential points in She County predominantly exhibited a pattern of overall expansion intertwined with localized disappearance (Figure 4a). This epoch was marked by the expansion of rural settlements largely in an individualistic manner, occasionally accompanied by instances of merging (for example, in Henandian Town). The phenomenon of individual expansion was widely distributed across diverse townships within She County. Between 2000 and 2020, the spatial arrangement of rural residential points underwent a transformation towards heightened occurrences of overall addition and expansion concurrently with instances of localized disappearance (Figure 4b). Freshly established rural residential points were noted to have been dispersed extensively across various townships, with particularly significant instances observed in Pei Town, Shentou Township, and Jingdian Town. Individual cases of expansion were primarily concentrated in Henandian and Mujing Township. However, the disappearance of rural residential points was mainly concentrated in Jingdian Town and Gengle Town, primarily attributed to urban land expansion.

4.3. Simulation of Rural Settlements

4.3.1. Verify the Accuracy of Simulation Results

We conducted a simulation of land use changes in She County from 2005 to 2015 and assessed the accuracy of these simulations by applying the kappa index. The kappa index values for all simulated land types were calculated at 0.929, while for simulating rural residential points, the corresponding kappa index value was computed as 0.879. These values exceeded the threshold of 0.8, demonstrating the capability of the CLUE-S model to generate robust simulation outcomes, thus rendering it suitable for predicting the trajectory of rural residential points in the year 2035.
The results from the ROC test indicated that the fitness of each land class exceeded 0.7, underscoring the robust explanatory capability of the selected driving factors for elucidating land use dynamics in She County. Consequently, these findings can be effectively leveraged to simulate and forecast the probabilistic distribution of future land use patterns and rural residential point allocations within the county.

4.3.2. Evolution Analysis of Rural Settlements under Multi-Scenario Simulation

We have undertaken simulation and projection exercises to assess She County’s prospective land utilization scenarios in 2035, considering varying developmental contexts. We have utilized land-use transition matrices (Table 5, Table 6 and Table 7) to quantify the transitions between distinct land categories during the timeframe spanning 2020 to 2035.
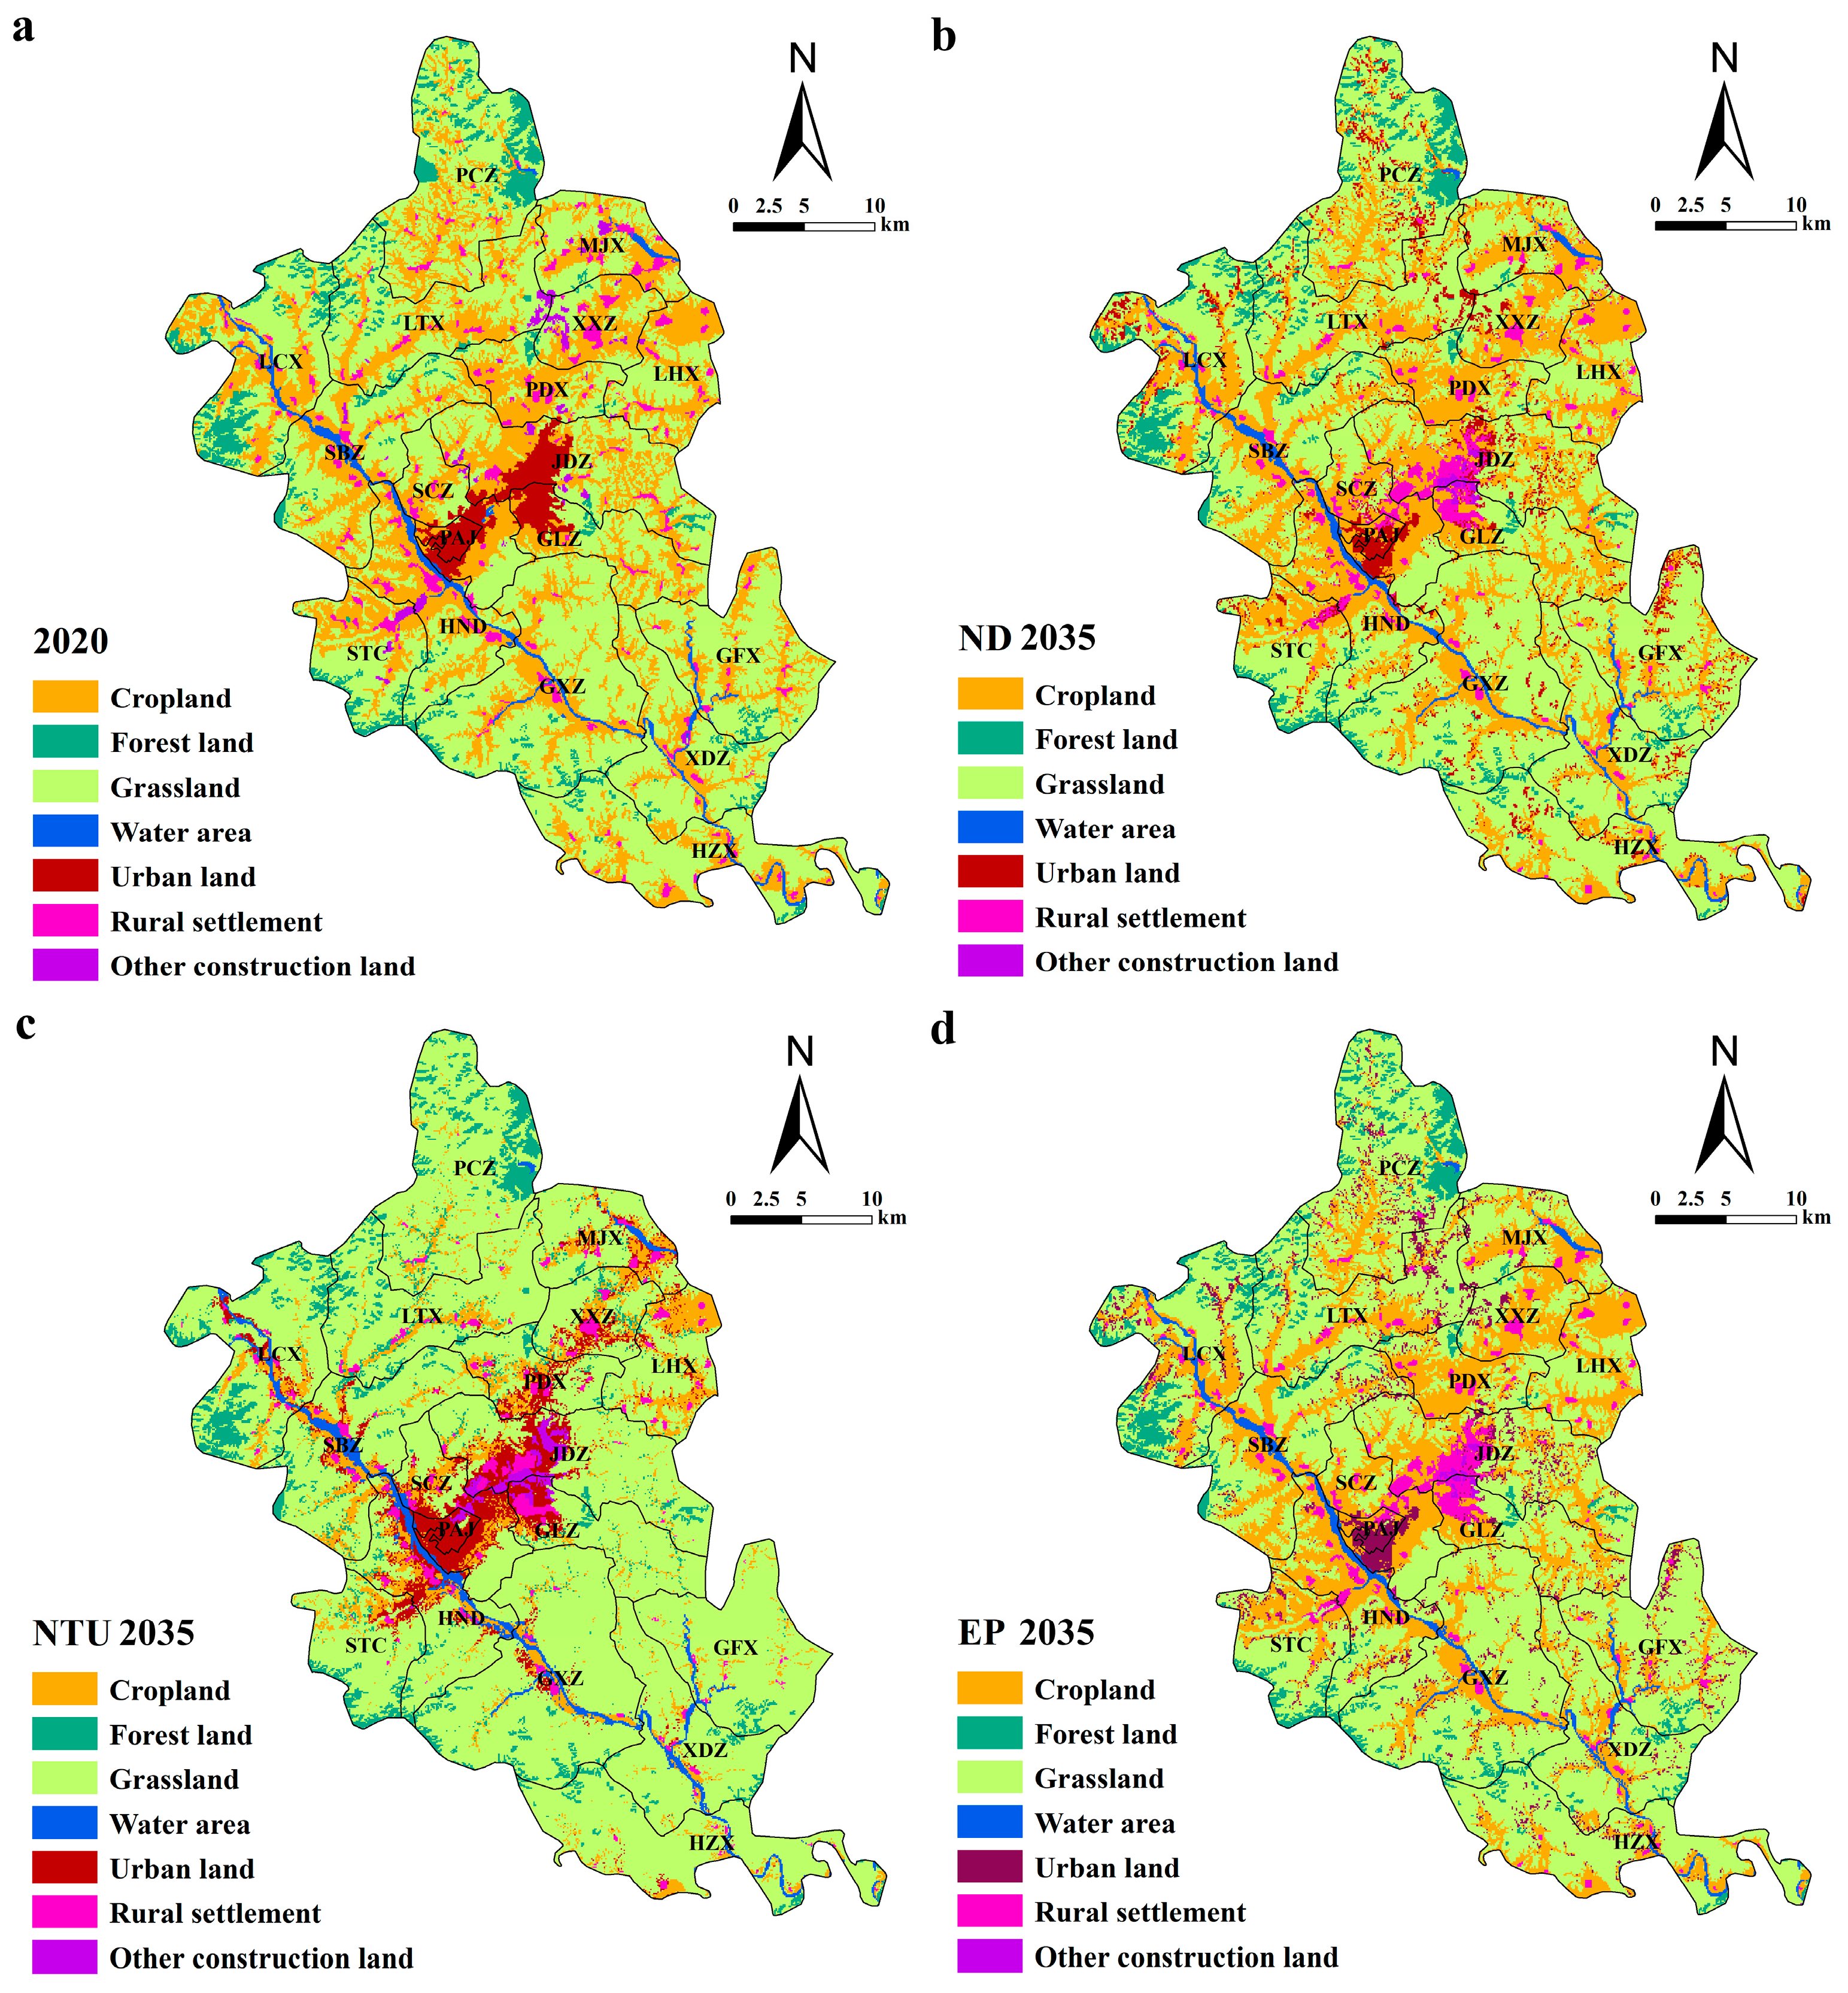
Within the framework of the natural development scenario, it is anticipated that by the year 2035, She County will witness an expansion in the geographical extent of rural residential areas, urban land parcels, and grassland tracts, corresponding to an augmentation of 2.97 square kilometers, 40.33 square kilometers, and 1.23 square kilometers, respectively (Table 5). Simultaneously, there will be a decline in cropland, forest land, and other constructed areas by an estimated 31.24 square kilometers, 4.07 square kilometers, and 9.29 square kilometers, while the expanse of aquatic bodies will remain relatively stable. Delving into the spatial distribution patterns (Figure 5a), the trajectory of rural residential expansion within the natural development scenario will be interwoven with competition for cropland and urban territories. This predictive model posits that approximately 8.08 square kilometers of rural residential domains are poised to metamorphose into cropland, while 12.88 square kilometers are poised for conversion into urban precincts. Conversely, around 19.09 square kilometers of cropland and 1.76 square kilometers of urban zones are projected to undergo a transformation into rural residential zones. The geographic expansion of rural residential locales in She County will be predominantly concentrated within the central region, encompassing locales such as Jingdian and Gele towns. This expansion phenomenon owes its impetus primarily to the encroaching impact of the adjacent urban expanse.
Within the context of the new-type urbanization development scenario, it is envisaged that by the year 2035, She County will experience a reduction in the expanse of rural residential zones, other constructed areas, and croplands, amounting to 13.89 square kilometers, 1.54 square kilometers, and 334.66 square kilometers, respectively. In contrast, urban land, forested areas, grasslands, and aquatic bodies are poised to expand, encompassing 48.25 square kilometers, 20.96 square kilometers, 272.64 square kilometers, and 8.23 square kilometers, respectively (Table 6). Scrutinizing the spatial distribution within the new-type urbanization development scenario framework, the decline in rural residential areas is primarily intertwined with the competition for grasslands, urban land parcels, and croplands. Approximately 13.34 square kilometers of rural residential expanses are anticipated to transition into grasslands, with 5.01 square kilometers earmarked for urban land conversion and 2.62 square kilometers poised for transformation into croplands. Moreover, around 4.97 square kilometers of urban land and 5.43 square kilometers of croplands are predicted to metamorphose into rural residential enclaves (Figure 5c). While the impact of the new-type urbanization policy is notably pronounced within the central zones of She County, such as Shetown, Jingdian, and Gele, leading to a concentrated and contiguous expansion of urban land in these areas, the phenomenon of rural residential expansion within the central region of She County is even more remarkable, engrossing substantial extents of urban territories. Notably, the northern (e.g., Pianzhen) and southern (e.g., Hezhang Township) parts of She County exhibit a conspicuous decline in rural residential locales, primarily transitioning into grasslands.
Under the ecological conservation scenario, it is projected that by the year 2035, She County will witness an expansion in various land use categories, including rural residential areas, forested zones, grasslands, urban land, and aquatic bodies, with increments of 2.79 square kilometers, 0.34 square kilometers, 50.89 square kilometers, 40.3 square kilometers, and 1.38 square kilometers respectively (Table 7). However, this comes alongside a reduction in cropland and other constructed areas, estimated at 85.89 square kilometers and 9.77 square kilometers, respectively. Upon scrutinizing the spatial distribution, the ecological conservation scenario reveals that the expansion of rural residential areas correlates predominantly with the competition for croplands, grasslands, and urban land. Notably, an anticipated 18.18 square kilometers of rural residential regions are poised for conversion into croplands, with an additional 2.46 square kilometers earmarked for the transformation into grasslands and 1.79 square kilometers designated for urban land transition. Simultaneously, approximately 7.9 square kilometers of cropland and 15.77 square kilometers of urban land are foreseen to be repurposed into rural residential zones (Figure 5d). This scenario accentuates the pronounced expansion of rural residential areas within pivotal central regions of She County, such as Jingdian and Gele, which, in turn, absorb substantial portions of urban territories.

4.3.3. Analysis of Rural Residential Spatial Pattern Evolution Trends

We will juxtapose the simulated outcomes against the spatial distribution of rural residential zones in 2020 (Figure 6) to ascertain the evolutionary trajectories of rural residential spatial patterns across distinct developmental scenarios.
Within the ambit of the natural development scenario (Figure 6a), the morphological dynamics of rural residential areas in She County exhibit a binary scheme: accretion and attrition. Throughout this epoch, the central precincts of She County (encompassing Jingdian Town, Gele Town, Shecheng Town, and Ping’an Street) experienced marked augmentations in rural residential domains, largely predicated on the repurposing of preexisting urban tracts. Simultaneously, rural residential areas undergo cessation across multiple townships within She County.
Conversely, under the purview of the new-type urbanization scenario (Figure 6b), an overarching descent tendency characterizes rural residential acreages in She County, interspersed with localized augmentations. The diminution of rural residential domains permeates across diverse townships, while emergent additions are concentrated proximate to the urban precincts of Jingdian Town and Gele Town. Within this framework, She County’s rural residential expanses predominantly coalesce along the banks of the Clear Zhang River.
In the ecological conservation scenario (Figure 6c), rural settlements’ spatial pattern evolution trend follows a similar pattern to that of the new urbanization scenario. However, in the central region of She County County (including Jingdian Town and Gele Town), the phenomenon of new rural settlements is even more pronounced.

5. Discussion

5.1. Analysis of the Driving Forces behind the Spatiotemporal Evolution of Rural Residential Patterns

5.1.1. Analysis of the Driving Forces behind Rural Residential Scale Changes

The spatial dynamics of rural residential settlements in She County are profoundly influenced by policy and institutional factors. Simultaneously, different temporal stages reveal distinct predominant drivers of spatial transformations in these settlements. The enactment of the reform and opening-up policy has catalyzed rapid economic advancement in She County, subsequently inducing significant shifts in the spatial magnitudes of rural residential domains.
The primary propellants steering the expansion of rural residential areas in She County emanate from swift economic growth and the persistent rise in population. During 1980–2000, rural residential settlements in She County experienced a modest overall expansion, albeit with a reduced numerical count. This epoch bore witness to the ascendancy of township enterprises, which significantly bolstered industrial progress within the county. By 1996, the tally of township enterprises had surged to 11,830, boasting a workforce of 69,000 and a total output valuation of 3.354 billion yuan. Fiscal revenue for the county eclipsed the billion yuan threshold in 1995 [55]. Following the restructuring state-owned enterprises after 1998, the private sector emerged as a vibrant growth engine [55].
Consequently, since the 1990s, the proliferation of employment avenues in townships, augmented earnings for farmers, and the subsequent metamorphosis of rudimentary abodes into capacious brick-and-mortar structures have propelled the magnification of rural residential settlements. However, industrial advancement also encroached upon select settlements, prompting migration, dissolution, or amalgamation of certain rural residential domains. From 2000 to 2020, rural residential settlements in She County demonstrated a tendency toward clustered expansion in scale and quantity. In the post-2000 era, improved living conditions for farmers resulted in a surge of brick-and-concrete constructions, coupled with a shift from one-story dwellings to multi-story edifices. Affluent households undertook the expansion of existing settlements and even embarked on constructing villas. This phenomenon propelled the ceaseless expansion and sprawl of rural residential precincts. By 2012, She County’s Gross Domestic Product had reached 24.846 billion yuan, with total social fixed asset investment reaching 1.143 billion yuan and fiscal revenue amounting to 2.041 billion yuan [55]. The swift economic progress substantially elevated farmers’ living standards, fostering material aspirations, and accelerating the acquisition and construction of residential properties.

5.1.2. Analysis of the Driving Forces behind the Spatial Pattern Evolution of Rural Residential Settlements

The period from 1980 to 2000 witnessed a distinctive spatial transformation in the rural residential settlements of She County. During this period, the distribution pattern of these settlements displayed a trend towards stochastic dispersion, gradually transitioning towards a more ordered arrangement. This spatial phenomenon can be attributed to two prominent factors that exerted significant influence. Foremost among these factors is She County’s endowed resource abundance. Rural inhabitants historically settled along the picturesque banks of the Qingzhang River, seamlessly integrating their way of life with the watercourse and arable lands. This settlement pattern predominantly clustered along the north-south axis of the river, mirroring its natural flow. Throughout this phase, the expansion of rural residential areas remained largely confined within their existing boundaries, avoiding uncontrolled sprawl encroaching upon cultivable terrain.
Furthermore, the county’s southwestern and northeastern zones boasted fertile cropland, creating an environment conducive to rural habitation. However, due to the limited extent of plains, the augmentation of these settlements occurred in measured increments. By contrast, the northwest and southeast regions, characterized by sprawling wetlands and verdant forests, featured topographic undulations unsuitable for prolonged rural settlement. Consequently, these areas exhibited restrained expansion and minimal establishment of new rural residential locales.
However, after the year 2000, She County proactively embarked on the development of new urban areas, giving rise to a frequent occurrence of rural settlement construction in the suburban zones of the new city [56]. Commencing in 2004, concomitant with the impetus of poverty alleviation initiatives and the robust advancement of socialist rural reconstruction, the trajectory of rural residential settlements assumed an accelerated trajectory. Of seminal significance, the year 2009 marked the inauguration of the formulation of the “She County Urban Actual Control Zone Construction Plan”, an administrative imperative that instigated a consequential augmentation in the tally of administrative villages, transitioning from 30 to 44 [56]. This administrative pivot, in tandem with the proactive deployment of the Beijing-Tianjin-Hebei coordinated development framework, culminated in the continual elevation of vital transport corridors, including the Taihang Mountain Expressway segment within She County, the Wangjinzhuang connector of the Taihang Mountain Expressway in Handan, and the G234 National Highway segment (formerly known as the Ping She Road) in She County. This infrastructural impetus engendered a heightened interplay of human mobility across regions, thus facilitating the burgeoning proliferation of rural residential settlements [56].
Furthermore, She County orchestrated a sustained ascent along the trajectory of the “Taihang Red River Valley High-Quality Tourism Economic Belt” in its western expanse, propelling the dynamic vitality of the tourism sector. Paradoxically, the ascendancy of tourism-driven enterprises, notably the profusion of agritourism ventures, inadvertently wrought perturbations upon the extant structural tapestry of rural areas. As this burgeoning trend unfolds, a discernible elevation of the fragmentation phenomena manifests, rendering the rural residential settlement milieu increasingly ensnared within the intricate weave of emergent developments.

5.2. Reasons for the Evolution of Spatial Pattern of Rural Settlements under Different Scenarios

In the natural development scenario context, the shifts in land use patterns within She County and the evolving spatial configurations of rural settlements echo patterns akin to those observed during the 2005–2015 timeframe. This alludes to the ongoing urbanization thrust within the rural settlements surrounding urban peripheries, progressively metamorphosing them into urbanized land parcels. However, this trajectory is concomitant with a set of consequential trends and intricacies. With the elevation of residents’ living standards, an escalating aspiration for more capacious and comfortable residential environs among rural denizens ensues. This, in turn, culminates in the proliferation of new rural settlements upon arable lands, meticulously crafted to cater to the burgeoning housing requisites of the populace. Nonetheless, this trajectory necessitates judicious equilibrium within the context of territorial spatial planning, assiduously safeguarding the integrity of food production and the enduring sustainability of agriculture.
In the context of the new-type urbanization scenario, it is anticipated that the scale of rural settlements in She County will be diminished compared to the natural development scenario, as illustrated in Table 5 and Table 6. The development and growth trajectory of She County will be meticulously aligned with the principles and directives of the new-type urbanization policies, as outlined in the ‘She County Territorial Spatial Plan 2021–2035’. Positioned as one of China’s comprehensive pilot areas for new-type urbanization, She County’s strategic location in close proximity to the Beijing-Tianjin-Hebei region, nestled within the heart of the central plains, confers upon it a pivotal role in facilitating synergistic connections between the Beijing-Tianjin-Hebei region and the central plains. This favorable geographic positioning is poised to generate a wealth of employment opportunities, catalyzing rural-to-urban migration in the surrounding regions. Consequently, within the framework of the new-type urbanization scenario, it is plausible that the scale of rural settlements may contract while the allotment of land for urban development and other developmental purposes will expand.
Furthermore, rural settlement land will predominantly witness competition and transformation vis-à-vis grassland, forestland, and urban land uses. This shift is primarily attributable to the objectives delineated in the ‘She County Territorial Spatial Plan 2021–2035’, which accentuate the attainment of notable progress and environmental aesthetics in constructing characteristic small towns by 2035 [37]. Additionally, the new-type urbanization policy espouses a resolute commitment to a ‘people-centered’ approach, with arable land acknowledged as a pivotal cornerstone supporting food production. Consequently, under the new-type urbanization scenario, measures will be undertaken to safeguard the integrity of basic farmland, resulting in relatively tempered competition between rural settlements and arable land.
In the ecological conservation scenario, She County’s rural settlement scale remains at parity with the natural development scenario, as detailed in Table 5 and Table 7. This outcome stems from She County’s steadfast commitment to fostering high-quality ecological development and the harmonious coexistence of rural habitats with their surrounding environment. Within this context, there is a paramount focus on amalgamating She County’s natural conservation areas, ecologically significant zones, highly vulnerable regions, and ecologically valuable spaces, all systematically encompassed within the purview of the ecological protection redline. Moreover, within the precincts of the ecological protection redline in the study area, the pre-existing scale and extent of rural settlements consistently dwindle and gradually shift. Consequently, heightened competition ensues between rural settlements and arable land, as well as grasslands. This strategic endeavor is grounded in reinforcing ecosystem functionality, ensuring the sustainability and robust development of the ecological environment.
Additionally, it contributes significantly to preserving ecological equilibrium, safeguarding endangered species and natural resources, thereby strengthening the long-term ecological health and sustainable development of rural habitation areas. It is crucial to underscore that within the ecological conservation scenario, the aspiration to achieve harmonious coexistence between humanity and nature is unwaveringly upheld without compromising residents’ living space and quality of life. Consequently, a substantial portion of urban land is transitioned into rural settlements to fulfill these objectives.

5.3. Comparison with Other Studies

The New Urbanization Policy represents a pivotal guiding framework for shaping the future landscape of urban development in China. Within the scope of this research, She County, designated as one of the comprehensive trial areas for China’s New Urbanization Initiative, serves as an illustrative case study, epitomizing the dynamics of rural settlement spatial pattern evolution within the context of the New Urbanization paradigm [36]. Furthermore, this study bears considerable significance as it transcends the examination of rural settlement spatial patterns, delving deeper into the ramifications they entail for future societal, economic, and environmental interplays [57]. Its substantive import lies in its capacity to furnish us with nuanced insights into the plausible trajectories and complexities that lie ahead. By simulating rural settlement evolution under diverse scenarios, we are better poised to formulate strategic land-use plans, safeguard ecological systems, foster sustainable rural progress, and provide policymakers with empirically grounded foundations to navigate an increasingly intricate and unpredictable future [58]. The influence of this research extends far beyond rural domains, resonating profoundly with critical imperatives such as urbanization dynamics, environmental conservation imperatives, food security, and the quest for social equity, thereby furnishing indispensable support for the cultivation of a more sustainable tomorrow.
However, previous simulation studies, despite accounting for the driving factors behind settlement spatial pattern evolution, have regrettably failed to consider the influence of actual spatial policy variables [10,21,52]. As a result, the outcomes produced by these studies may not comprehensively reflect the implications of forthcoming policies, thus introducing a considerable degree of uncertainty. Consequently, we have considered and seamlessly integrated She County’s most recent designations of “permanent basic farmland” and “ecological protection redlines” into the New Urbanization and Ecological Conservation scenarios, incorporating them as pivotal constraints within our simulation research. This astute incorporation guarantees the future food security of urban and rural inhabitants within the New Urbanization scenario while safeguarding the integrity of ecological functions and environmental stability within the Ecological Conservation scenario. Therefore, our study bears notable practical significance in guiding the future developmental trajectory of She County.

5.4. Policy Implications

Reasonable planning policies and context-specific planning strategies stand as the foremost determinants shaping the urban-rural development pattern [59]. Historical planning policies often fell short of comprehensively considering regional contexts, resulting in an undue skew of resources towards urban areas and a disregard for the aspirations of rural residents [60]. Hence, governmental authorities should adopt an encompassing perspective, integrating various development models, preempting potential challenges in forthcoming urban-rural development, and devising bespoke development policies suited to each locale [61].
The paradigm of new urbanization policy demands a judicious equilibrium between urban and rural development while orchestrating a harmonious urban-rural layout. It is imperative to underscore that the essence of new urbanization policy extends far beyond a mere pursuit of “urban intensification”. To this end, it is paramount to steer urban progress away from the indiscriminate depletion of rural assets and to eschew any compromise that jeopardizes the welfare of agricultural sectors, rural regions, and the farming populace [62]. Anchored within the contours of the new urbanization policy, the demographic landscape of She County is poised for further recalibration. Thus, a sagacious calibration of urban and rural populations is essential, with an appropriate allocation of optimal urban and rural scales tailored to their distinct demographic requirements. A corollary concern centers on ensuring food security as a bedrock of human safety, which mandates vigilant safeguards against urban expansion that impinges upon arable lands.
Meanwhile, vigilance must be maintained over the concomitant challenge of idle arable lands stemming from rural emigration. In a culminating reflection, She County, as a pivotal bridge uniting the urban nexus (Handan) and rural domains, can strategically introduce enterprises uniquely attuned to the tapestry of characteristics across its varied townships. This proactive measure can catalyze rural employment prospects, tempering the inflow of rural denizens into urban settings and stemming the outflux of agrarian communities.
Similarly, the ecological scenario entails a harmonious blend of economic advancement and ecological preservation, effectively striking a balance between human activities and the natural world. This involves a comprehensive approach to planning that considers the intricate interplay of human endeavors, resource management, and environmental safeguarding. Emphasis is placed on safeguarding She County’s natural reserves, including the She County Qingta Lake Wetland Park, the provincial-level forest park, and the ecologically sensitive areas flanking the Taihang Mountain Expressway. Within these designated ecological protection zones, a rigorous framework is established to curtail the unchecked expansion of rural settlements. This measure is aimed at preserving the pristine ecological equilibrium of the region. The retention of settlements posing a minimal ecological threat is deemed essential while simultaneously addressing potential risks posed by settlements that could disrupt ecological stability. In cases necessitating relocation, the government will play a proactive role in orchestrating the process, ensuring the seamless transition of affected communities. In this relocation strategy, residents will receive appropriate compensation, safeguarding their well-being and interests during the transition. This concerted effort fortifies the resilience and continuity of the ecological environment and upholds the quality of life for the local populace. By embracing these proactive measures, She County is poised to uphold the integrity of its ecological landscape and ensure the sustainable coexistence of both the natural environment and human settlements.
The future spatial development planning of rural settlements must holistically consider external factors. In recent years, factors such as the COVID-19 pandemic, energy crises, and geopolitical dynamics have introduced severe housing crises and elements of social instability [63]. The COVID-19 pandemic has fundamentally altered people’s living and working habits, potentially leading to an increased number of individuals seeking rural resettlement. As a result, planning needs to account for potential population influx and societal service requirements [64]. Energy crises and the trend toward sustainable energy necessitate rural communities to contemplate the accessibility and cost implications of energy supply, advocating for green energy solutions to reduce energy dependence. Factors related to geopolitical stability necessitate the consideration of the security of food and resource supply chains. To effectively address these challenges, rural area planning can encompass digital infrastructure, support for remote work, healthcare and medical services enhancements, and the promotion of diversified economic development [65]. This approach will ensure that the future spatial development of rural settlements exhibits greater resilience and adaptability to the ever-changing external environment.

6. Conclusions

Between 1980 and 2020, the scale of rural settlements in She County exhibited a continuous expansion. During the timeframe spanning 1980 to 2000, She County’s rural settlement dimensions exhibited a comparatively subdued expansion, evidenced by a cumulative augmentation in patch surface area amounting to 255.21 hectares; subsequently, from 2000 to 2020, the scale of rural settlements witnessed substantial expansion, with an increase of 1192.68 hectares. Over the entire span from 1980 to 2020, the spatial configuration of rural settlements in She County exhibited an escalating trend toward irregularity and fragmentation. Notably, the pivotal year of 2000 marked a significant turning point, transitioning from an orderly development trajectory to a more chaotic evolution of settlements. This transformation was notably shaped by the advancement of urbanization processes and the notable influence of anthropogenic activities, which substantially shaped the spatial dynamics of rural settlements.
In light of this context, three distinct scenarios—natural development, new urbanization, and ecological conservation—have been formulated to simulate and forecast potential trends in rural settlement dynamics under diverse policy interventions. The principal aim of these scenarios is to offer practical recommendations and strategies for governmental authorities and urban planners, with the overarching goal of fostering rational land planning and utilization practices. These endeavors are poised to contribute to environmental preservation and the safeguarding of ecological systems and to creating healthier and more habitable human habitats. In the forthcoming years, through optimising land utilization practices and harmonising human developmental demands with ecological preservation imperatives, the profound impact of these efforts is anticipated to resonate in alignment with global sustainable development goals.

Author Contributions

S.S.: Methodology, Software, Data curation, Writing—original draft; H.L.: Conceptualization, funding acquisition; Writing—review & editing; S.S.: investigation, validation; H.L.: proofreading. All authors have read and agreed to the published version of the manuscript.

Funding

This research was supported by the Study on the pattern evolution and regulation of rural residential areas for new urbanization (Grant No. 41671177).

Data Availability Statement

The majority of the datasets used in this study are publicly available and can be accessed through public repositories. All used data repositories are cited either in the main text. Land use Data, DEM data, water area data, GDP data and road data come from the Resource and Environment Science and Data Center (https://www.resdc.cn/ accessed on 20 May 2023). This website allows real-name applications. Population density data from wordpop (https://hub.worldpop.org/geodata/summary?id=39778). This website allows open access. Highway data from NASA (https://sedac.ciesin.columbia.edu/data/set/groads-global-roads-open-access-v1). This website allows open access. Night light data from Global Change Data Warehousing electronic journal (English and Chinese) (https://doi.org/10.3974/geodb.2022.06.01.V1). This website allows open access.

Conflicts of Interest

The authors declare no conflict of interest.

References

  1. Pascual, U.; Balvanera, P.; Anderson, C.B.; Chaplin-Kramer, R.; Christie, M.; González-Jiménez, D.; Martin, A.; Raymond, C.M.; Termansen, M.; Vatn, A.; et al. Diverse values of nature for sustainability. Nature 2023, 620, 813–823. [Google Scholar] [CrossRef] [PubMed]
  2. Pacheco, A.; Meyer, C. Land tenure drives Brazil’s deforestation rates across socio-environmental contexts. Nat. Commun. 2022, 13, 5759. [Google Scholar] [CrossRef] [PubMed]
  3. Martin, D.A.; Andrianisaina, F.; Fulgence, T.R.; Osen, K.; Rakotomalala, A.A.N.A.; Raveloaritiana, E.; Soazafy, M.R.; Wurz, A.; Andriafanomezantsoa, R.; Andriamaniraka, H. Land-use trajectories for sustainable land system transformations: Identifying leverage points in a global biodiversity hotspot. Proc. Natl. Acad. Sci. USA 2022, 119, e2107747119. [Google Scholar] [CrossRef] [PubMed]
  4. Simkin, R.D.; Seto, K.C.; McDonald, R.I.; Jetz, W. Biodiversity impacts and conservation implications of urban land expansion projected to 2050. Proc. Natl. Acad. Sci. USA 2022, 119, e2117297119. [Google Scholar] [CrossRef] [PubMed]
  5. Obersteiner, M.; Walsh, B.; Frank, S.; Havlik, P.; Cantele, M.; Liu, J.G.; Palazzo, A.; Herrero, M.; Lu, Y.L.; Mosnier, A.; et al. Assessing the land resource-food price nexus of the Sustainable Development Goals. Sci. Adv. 2016, 2, e1501499. [Google Scholar] [CrossRef]
  6. Carpio, A.; Ponce-Lopez, R.; Lozano-García, D.F. Urban form, land use, and cover change and their impact on carbon emissions in the Monterrey Metropolitan area, Mexico. Urban Clim. 2021, 39, 100947. [Google Scholar] [CrossRef]
  7. Newbold, T.; Hudson, L.N.; Hill, S.L.L.; Contu, S.; Lysenko, I.; Senior, R.A.; Borger, L.; Bennett, D.J.; Choimes, A.; Collen, B.; et al. Global effects of land use on local terrestrial biodiversity. Nature 2015, 520, 45–50. [Google Scholar] [CrossRef]
  8. Kalnay, E.; Cai, M. Impact of urbanization and land-use change on climate. Nature 2003, 423, 528–531. [Google Scholar] [CrossRef]
  9. Sheng, S.; Song, W.; Lian, H.; Ning, L. Review of urban land management based on bibliometrics. Land 2022, 11, 1968. [Google Scholar] [CrossRef]
  10. Li, H.; Song, W. Evolution of rural settlements in the Tongzhou District of Beijing under the new-type urbanization policies. Habitat Int. 2020, 101, 102198. [Google Scholar] [CrossRef]
  11. De Paula Pereira, A.S.A.; Dos Santos, V.J.; do Carmo Alves, S.; Amaral, A.; Da Silva, C.G.; Calijuri, M.L. Contribution of rural settlements to the deforestation dynamics in the Legal Amazon. Land Use Policy 2022, 115, 106039. [Google Scholar] [CrossRef]
  12. Sémécurbe, F.; Tannier, C.; Roux, S.G. Applying two fractal methods to characterise the local and global deviations from scale invariance of built patterns throughout mainland France. J. Geogr. Syst. 2019, 21, 271–293. [Google Scholar] [CrossRef]
  13. Tomao, A.; Quaranta, G.; Salvia, R.; Salvati, L.; Cividino, S. Neighbours matter: A micro-scale indicator of settlement structure assessing urban dispersion and planning effectiveness. Int. Plan. Stud. 2022, 27, 267–283. [Google Scholar] [CrossRef]
  14. Banski, J.; Wesolowska, M. Transformations in housing construction in rural areas of Poland’s Lublin region-Influence on the spatial settlement structure and landscape aesthetics. Landsc. Urban Plan. 2010, 94, 116–126. [Google Scholar] [CrossRef]
  15. Aleknavicius, P.; Aleknavicius, M.; Akelaityte, S. Research of changes of rural residential areas In Lithuania. J. Archit. Urban. 2014, 38, 161–172. [Google Scholar]
  16. Liu, J.Y.; Kuang, W.H.; Zhang, Z.X.; Xu, X.L.; Qin, Y.W.; Ning, J.; Zhou, W.C.; Zhang, S.W.; Li, R.D.; Yan, C.Z.; et al. Spatiotemporal characteristics, patterns, and causes of land-use changes in China since the late 1980s. J. Geogr. Sci. 2014, 24, 195–210. [Google Scholar] [CrossRef]
  17. Ekici, S.C.; Özçakır, Ö.; Bilgin Altinöz, A.G. Sustainability of historic rural settlements based on participatory conservation approach: Kemer Village in Turkey. J. Cult. Herit. Manag. Sustain. Dev. 2022. [Google Scholar] [CrossRef]
  18. Balta, S.; Atik, M. Rural planning guidelines for urban-rural transition zones as a tool for the protection of rural landscape characters and retaining urban sprawl: Antalya case from Mediterranean. Land Use Policy 2022, 119, 106144. [Google Scholar] [CrossRef]
  19. Li, S.; Song, W. Research progress in land consolidation and rural Revitalization: Current status, characteristics, regional differences, and evolution laws. Land 2023, 12, 210. [Google Scholar] [CrossRef]
  20. Zhao, X.; Sun, H.B.; Chen, B.; Xia, X.H.; Li, P.F. China’s rural human settlements: Qualitative evaluation, quantitative analysis and policy implications. Ecol. Indic. 2019, 105, 398–405. [Google Scholar] [CrossRef]
  21. Song, W.; Li, H.H. Spatial pattern evolution of rural settlements from 1961 to 2030 in Tongzhou District, China. Land Use Policy 2020, 99, 105044. [Google Scholar] [CrossRef]
  22. Topole, M.; Bole, D.; Petek, F.; Repolusk, P. Spatial and functional changes in built-up areas in selected slovene rural settlements after 1991. Acta Geogr. Slov. Geogr. Zb. 2006, 46, 190–226. [Google Scholar] [CrossRef]
  23. Nandi, S.; Mistri, T. Transformation of rural settlement in Salanpur community development block, West Bengal, India. GeoJournal 2023, 88, 291–318. [Google Scholar] [CrossRef]
  24. Alphan, H.; Karamanli, E.; Derse, M.A.; Uslu, C. Analyzing pattern features of urban/rural residential land use change: The case of the southern coast of Turkey. Land Use Policy 2022, 122, 106348. [Google Scholar] [CrossRef]
  25. Ntassiou, K. Studying abandoned settlements’ renaissance in the context of rural geography: Perspectives for Prespes, Greece. Eur. Plan. Stud. 2022, 30, 359–383. [Google Scholar] [CrossRef]
  26. Çağlıyan, A.; Dağlı, D. Monitoring land use land cover changes and modelling of urban growth using a future land use simulation model (FLUS) in Diyarbakır, Turkey. Sustainability 2022, 14, 9180. [Google Scholar] [CrossRef]
  27. Jenerette, G.D.; Potere, D. Global analysis and simulation of land-use change associated with urbanization. Landsc. Ecol. 2010, 25, 657–670. [Google Scholar] [CrossRef]
  28. Mathewos, M.; Lencha, S.M.; Tsegaye, M. Land use and land cover change assessment and future predictions in the Matenchose Watershed, Rift Valley Basin, using CA-Markov simulation. Land 2022, 11, 1632. [Google Scholar] [CrossRef]
  29. Kucsicsa, G.; Popovici, E.A.; Balteanu, D.; Grigorescu, I.; Dumitrascu, M.; Mitrica, B. Future land use/cover changes in Romania: Regional simulations based on CLUE-S model and CORINE land cover database. Landsc. Ecol. Eng. 2019, 15, 75–90. [Google Scholar] [CrossRef]
  30. Fan, M.; Shibata, H. Simulation of watershed hydrology and stream water quality under land use and climate change scenarios in Teshio River watershed, northern Japan. Ecol. Indic. 2015, 50, 79–89. [Google Scholar] [CrossRef]
  31. Pham, Q.B.; Chandra Pal, S.; Chakrabortty, R.; Saha, A.; Janizadeh, S.; Ahmadi, K.; Khedher, K.M.; Anh, D.T.; Tiefenbacher, J.P.; Bannari, A. Predicting landslide susceptibility based on decision tree machine learning models under climate and land use changes. Geocarto Int. 2022, 37, 7881–7907. [Google Scholar] [CrossRef]
  32. Teeuwen, A.S.; Meyer, M.A.; Dou, Y.; Nelson, A. A systematic review of the impact of food security governance measures as simulated in modelling studies. Nat. Food 2022, 3, 619–630. [Google Scholar] [CrossRef] [PubMed]
  33. Marino, D.; Palmieri, M.; Marucci, A.; Soraci, M.; Barone, A.; Pili, S. Linking flood risk mitigation and food security: An analysis of land-use change in the metropolitan area of Rome. Land 2023, 12, 366. [Google Scholar] [CrossRef]
  34. Sánchez-Rivero, M.V.; Alonso, I.B.; Serrano, M.V.D.; Pozas, B.M. SDG monitoring framework for rural settlements mapping interactions with the Spanish Urban Agenda. Sustain. Cities Soc. 2023, 93, 104514. [Google Scholar] [CrossRef]
  35. Manouchehri, F.; Bahrami, R.; Parishan, M.; Ghaderi, R. Recognizing and analysing of empowerment rural settlements with an emphasis on sustainable development (case study of Kalashi district of Javanrud county). Village Space Sustain. Dev. 2023, 4, 14. [Google Scholar] [CrossRef]
  36. National Development and Reform Commission Announcement on the Publication of the List of the Third Batch of National New Urbanization Comprehensive Pilot Areas. Available online: https://www.gov.cn/xinwen/2016-12/07/content_5144553.htm#1 (accessed on 20 May 2023).
  37. She County Natural Resources and Planning Bureau, She County National Land and Space Master Plan Draft for Public Review. 10 May 2023. Available online: http://www.shexian.gov.cn/sxxxgk/bmxx/zfxt/xzrzyhghj/202303/t20230310_1852340.html (accessed on 20 May 2023).
  38. Xu, X.L.; Liu, J.Y.; Zhang, S.W.; Li, R.D.; Yan, C.Z.; Wu, S.X. China Multi-Temporal Land Use Remote Sensing Monitoring Data set (CNLUCC); Resource and Environment Science Data Registration and Publication System: Beijing, China, 2018. [Google Scholar]
  39. Resource and Environment Science Data Center. Provincial Digital Elevation Model (DEM) 30 m Data (SRTM 30 m); Resource and Environment Science Data Center: Beijing, China, 2005. [Google Scholar]
  40. Xu, X.L. Watershed and River Network Dataset of China Extracted from DEM; Resource and Environment Science Data Registration and Publishing System: Beijing, China, 2018. [Google Scholar]
  41. CIESIN. The Spatial Distribution of Population Density in 2005, China; Columbia University: New York, NY, USA, 2018. [Google Scholar] [CrossRef]
  42. Xu, X.L. Spatial Distribution Grid Dataset of China’s GDP at Kilometer Scale; Resource and Environment Science Data Registration and Publishing System: Beijing, China, 2017. [Google Scholar]
  43. Resource and Environment Science Data Center. Spatial Distribution Data of Roads in China for Multiple Years (1995/2012/2016/2018/2020); Resource and Environment Science Data Center: Beijing, China, 2020. [Google Scholar]
  44. Center for International Earth Science Information Network-CIESIN-Columbia University, and Information Technology Outreach Services-ITOS-University of Georgia. Global Roads Open Access Data Set, Version 1 (gROADSv1); NASA Socioeconomic Data and Applications Center (SEDAC): Palisades, NY, USA, 2013. [Google Scholar]
  45. Zhong, X.; Yan, Q.; Li, G. China Long-Term Time Series Nighttime Light Dataset (2000–2020) [J/DB/OL]. Digit. J. Glob. Chang. Data Repos. 2022. [Google Scholar] [CrossRef]
  46. Shafie, B.; Javid, A.H.; Behbahani, H.I.; Darabi, H.; Lotfi, F.H. An analysis of the landscape structure changes as an ecological approach to achieve sustainable regional planning (case study: Latian Dam watershed). J. Environ. Eng. Landsc. Manag. 2023, 31, 9–22. [Google Scholar] [CrossRef]
  47. Keita, M.A.; Ruan, R.Z.; An, R. Spatiotemporal change of urban sprawl patterns in Bamako district in Mali based on time series analysis. Urban Sci. 2021, 5, 4. [Google Scholar] [CrossRef]
  48. Domingues, G.F.; Hughes, F.M.; dos Santos, A.G.; Carvalho, A.F.; Calegario, A.T.; Saiter, F.Z.; Marcatti, G.E. Designing an optimized landscape restoration with spatially interdependent non-linear models. Sci. Total Environ. 2023, 873, 162299. [Google Scholar] [CrossRef] [PubMed]
  49. Mansour, S.; Alahmadi, M.; Abulibdeh, A. Spatial assessment of audience accessibility to historical monuments and museums in Qatar during the 2022 FIFA World Cup. Transp. Policy 2022, 127, 116–129. [Google Scholar] [CrossRef]
  50. Kiziridis, D.A.; Mastrogianni, A.; Pleniou, M.; Tsiftsis, S.; Xystrakis, F.; Tsiripidis, I. Improving the predictive performance of CLUE-S by extending demand to land transitions: The trans-CLUE-S model. Ecol. Model. 2023, 478, 110307. [Google Scholar] [CrossRef]
  51. Mamanis, G.; Vrahnakis, M.; Chouvardas, D.; Nasiakou, S.; Kleftoyanni, V. Land Use Demands for the CLUE-S Spatiotemporal Model in an Agroforestry Perspective. Land 2021, 10, 1097. [Google Scholar] [CrossRef]
  52. Guo, J.; Song, W.; Guo, L.; Zhang, Y. Simulation of the Effects of New Urbanization Policies on Rural Settlement Changes: A Case Study of Dingzhou City, China. J. Resour. Ecol. 2020, 13, 285–298. [Google Scholar]
  53. Nasiakou, S.; Vrahnakis, M.; Chouvardas, D.; Mamanis, G.; Kleftoyanni, V. Land Use Changes for Investments in Silvoarable Agriculture Projected by the CLUE-S Spatio-Temporal Model. Land 2022, 11, 598. [Google Scholar] [CrossRef]
  54. Akin, A.; Erdogan, N.; Berberoglu, S.; Cilek, A.; Erdogan, A.; Donmez, C.; Satir, O. Evaluating the efficiency of future crop pattern modelling using the CLUE-S approach in an agricultural plain. Ecol. Inform. 2022, 71, 101806. [Google Scholar] [CrossRef]
  55. She County Local Records Compilation Committee. Concise Version of She County Annals; Hebei People’s Publishing House: Shijiazhuang, China, 2015. [Google Scholar]
  56. Wang, L. Publication of “She County Annals (1991–2011)”. China Local Chron. Alm. 2014, 1, 1. [Google Scholar]
  57. Sarchani, S.; Koutroulis, A.G. Probabilistic dam breach flood modeling: The case of Valsamiotis dam in Crete. Nat. Hazards 2022, 114, 1763–1814. [Google Scholar] [CrossRef]
  58. Karashima, K.; Ohgai, A.; Motose, A. A Spatial Simulation Model to Explore Agglutination of Residential Areas and Public Service Facilities. Int. Rev. Spat. Plan. Sustain. Dev. 2015, 3, 57–74. [Google Scholar] [CrossRef]
  59. Rodriguez, E.D.; Garcia, I.G. Morphological problems in rural municipalities: Their difficult addressing through conventional urban planning tools. Ciudad. Rev. Inst. Univ. Urban. Univ. Valladolid 2021, 24, 119–144. [Google Scholar]
  60. Doussard, C.; Fonticelli, C. Ecologizing planning policies and practices in France: Insights from peri-urban and rural EcoQuartier certified neighborhoods. Environ. Sci. Policy 2022, 136, 588–598. [Google Scholar] [CrossRef]
  61. Ning, L.; Lian, H.; Niu, Y.; Sheng, S.; Gao, Z. Identification, classification and factors of contraction of urban development: A case of Gansu section of the Yellow River Basin. Arid Land Geogr. 2023, 46, 13. [Google Scholar]
  62. Carson, D.A.; Carson, D.B.; Argent, N. Cities, hinterlands and disconnected urban-rural development: Perspectives from sparsely populated areas. J. Rural Stud. 2022, 93, 104–111. [Google Scholar] [CrossRef]
  63. Amidu, M.; Mensah, J.K.; Ahenkan, A.; Bawole, J.N. Insulating highly vulnerable populations from global pandemics: The case of Ghanaian informal settlements. Cities 2023, 141, 104504. [Google Scholar] [CrossRef]
  64. von Seidlein, L.; Alabaster, G.; Deen, J.; Knudsen, J. Crowding has consequences: Prevention and management of COVID-19 in informal urban settlements. Build. Environ. 2021, 188, 107472. [Google Scholar] [CrossRef] [PubMed]
  65. Hofstede, H.; Salemink, K.; Haartsen, T. Beyond the (im)mobility and social-environmental dichotomy: Young adults’ motives to reside in rural northwest Europe. Popul. Space Place 2023, 29, e32. [Google Scholar] [CrossRef]
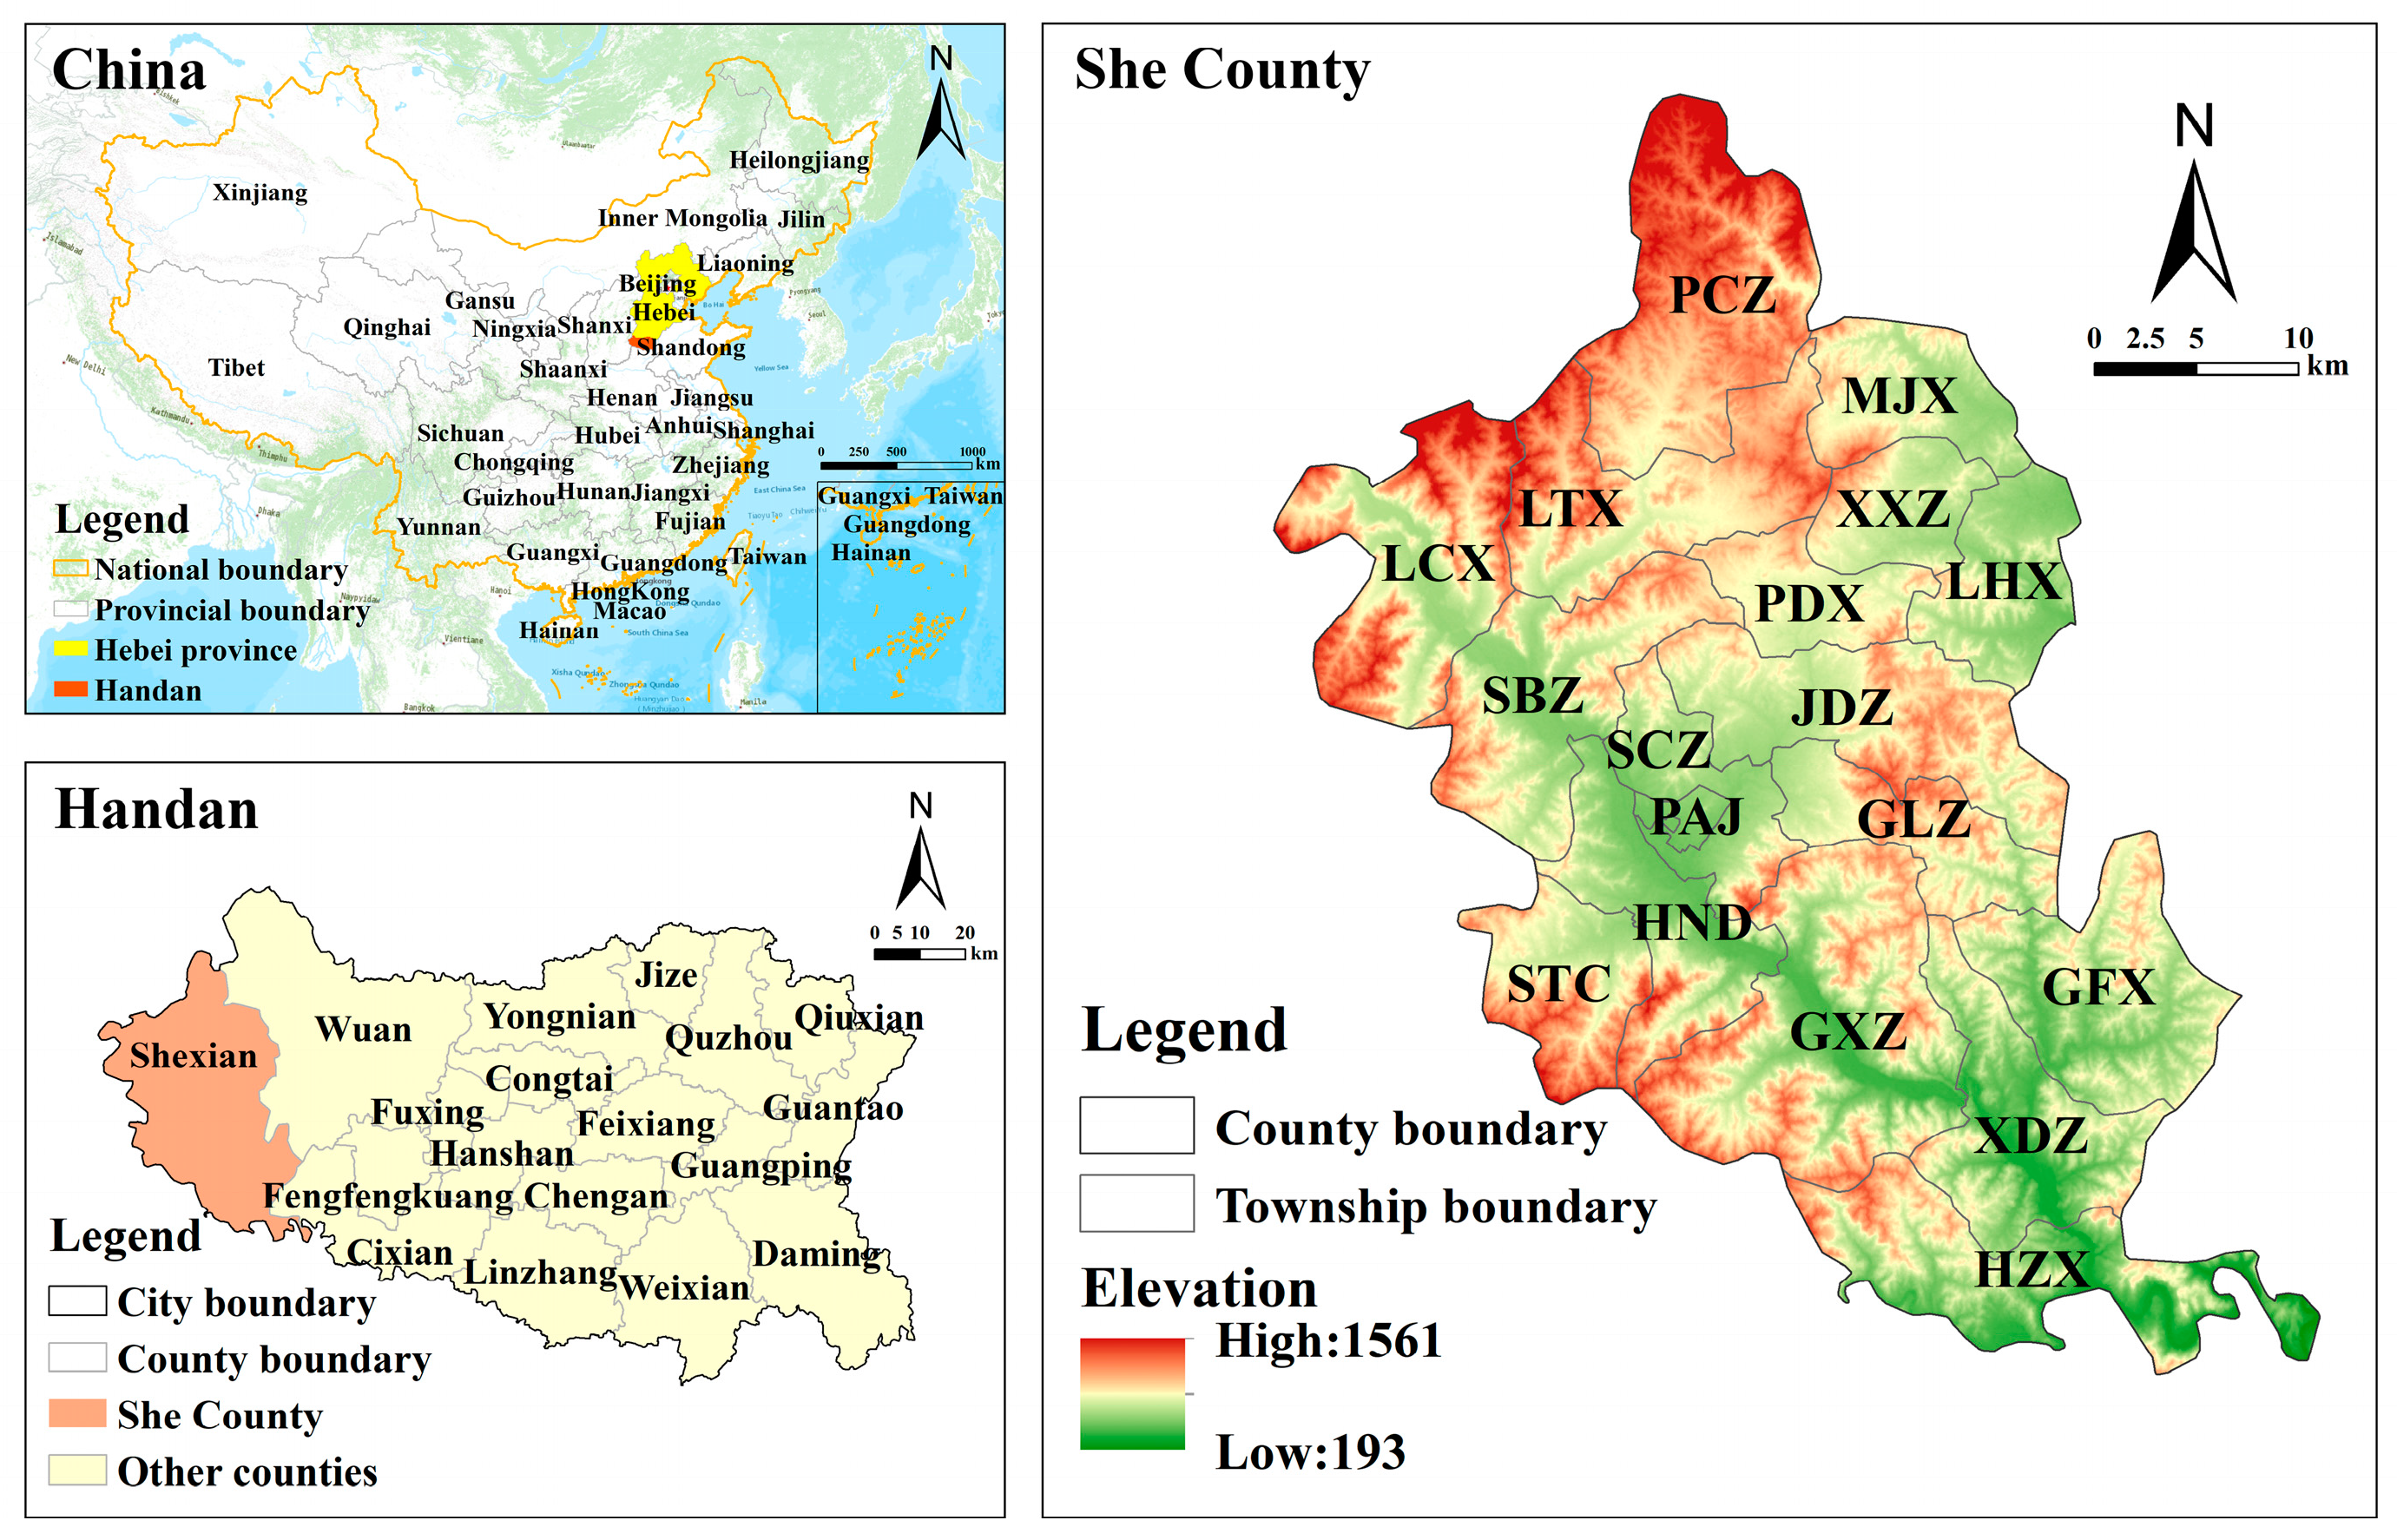
Figure 1. Location map of She County in Hebei Province, China. JDZ stands for Jingdian Town; PCZ stands for partial town; PDX stands for Bidian Township; PAJ stands for Ping An Street; GFC stands for Guanphong Township; MJX stands for Mujing Township; GXZ stands for Guxin Town; GLZ stands for Gengle Town; SBZ stands for Soburg Town; SCZ stands for involved town; LCX represents Liaoning urban and rural areas; STC stands for Shentou Township; XXZ stands for Xixu Town; LTX stands for Lutou Township; HND stands for Henan Branch; HZX stands for Hezhang Township; LHX stands for Longhu Township.
Land 12 01763 g001
Figure 2. Restricted Conversion Zones. (a) Represents Essential cropland, and (b) Depicts Ecological Protection Red Line; JDZ stands for Jingdian Town; PCZ stands for partial town; PDX stands for Bidian Township; PAJ stands for Ping An Street; GFC stands for Guanphong Township; MJX stands for Mujing Township; GXZ stands for Guxin Town; GLZ stands for Gengle Town; SBZ stands for Soburg Town; SCZ stands for involved town; LCX represents Liaoning urban and rural areas; STC stands for Shentou Township; XXZ stands for Xixu Town; LTX stands for Lutou Township; HND stands for Henan Branch; HZX stands for Hezhang Township; LHX stands for Longhu Township.
Land 12 01763 g002
Figure 3. Driving Factors of Spatial Patterns Evolution in Rural Residential Areas of She County in 2005.
Land 12 01763 g003
Figure 4. Evolution model of rural settlements in She County from 1980 to 2000 (a), and evolution model of rural settlements in She County from 2000 to 2020 (b). JDZ stands for Jingdian Town; PCZ stands for partial town; PDX stands for Bidian Township; PAJ stands for Ping An Street; GFC stands for Guanphong Township; MJX stands for Mujing Township; GXZ stands for Guxin Town; GLZ stands for Gengle Town; SBZ stands for Soburg Town; SCZ stands for involved town; LCX represents Liaoning urban and rural areas; STC stands for Shentou Township; XXZ stands for Xixu Town; LTX stands for Lutou Township; HND stands for Henan Branch; HZX stands for Hezhang Township; LHX stands for Longhu Township.
Land 12 01763 g004
Figure 5. Land use status in 2020 (a); Land use simulation in 2035 under natural development scenario (b); New urbanization scenario (c) and ecological protection scenario (d). JDZ stands for Jingdian Town; PCZ stands for partial town; PDX stands for Bidian Township; PAJ stands for Ping An Street; GFC stands for Guanphong Township; MJX stands for Mujing Township; GXZ stands for Guxin Town; GLZ stands for Gengle Town; SBZ stands for Soburg Town; SCZ stands for involved town; LCX represents Liaoning urban and rural areas; STC stands for Shentou Township; XXZ stands for Xixu Town; LTX stands for Lutou Township; HND stands for Henan Branch; HZX stands for Hezhang Township; LHX stands for Longhu Township.
Land 12 01763 g005
Figure 6. Rural areas in 2035 under natural development scenario (a), new urbanization scenario (b) and ecological protection scenario (c). JDZ stands for Jingdian Town; PCZ stands for partial town; PDX stands for Bidian Township; PAJ stands for Ping An Street; GFC stands for Guanphong Township; MJX stands for Mujing Township; GXZ stands for Guxin Town; GLZ stands for Gengle Town; SBZ stands for Soburg Town; SCZ stands for involved town; LCX represents Liaoning urban and rural areas; STC stands for Shentou Township; XXZ stands for Xixu Town; LTX stands for Lutou Township; HND stands for Henan Branch; HZX stands for Hezhang Township; LHX stands for Longhu Township.
Land 12 01763 g006
Table 1. Data Sources and Explanation of Usage.
DataTimeResolutionData SourcesData Sources
Physical
geographic data
land use data1980–202030 mChina Resources Environment Science and Data Center [38]Extraction and simulation of rural settlements
DEM200530 mChina Resources Environment Science and Data Center [39]Extraction and simulation of rural settlements
Water area2005China Resources Environment Science and Data Center [40]Extraction and simulation of rural settlements
Socioeconomic
data
Population density20051000 mWorldPop [41]Extraction and simulation of rural settlements
GDP20051000 mChina Resources Environment Science and Data Center [42]Extraction and simulation of rural settlements
Railway2005China Resources Environment Science and Data Center [43]Extraction and simulation of rural settlements
Highway2005NASA [44]Extraction and simulation of rural settlements
Nocturnal Luminosity Data20051000 mGlobal Change Research Data Publishing & Repository [45]Extraction and simulation of rural settlements
Table 2. Spatial Rhythm Indices and Their Significance.
Primary IndicatorsSecondary IndicatorsIndex InterpretationFormulaFormula Specification
Density indexNumber of Patches
(NP) [47]
Number of landscape patches of a certain class. N P = n i Where, n i
represents the number of patches containing a specific patch type within the landscape, measured in “units”.
Land use indexPatch Area (CA) [47]The class area (CA) reflects the size of a specific patch type within the landscape and serves as the basis for calculating other indicators. C A = j = 1 n a i j × 1 1000 Where
a i j represents the area of patch
ij, with values falling within the range
CA ≥ 0, measured in hectares (hm2).
scale meritMean patch area (MPS) [47]The Mean Patch Size represents an average condition, indicating the degree of landscape fragmentation. A smaller MPS value indicates a more dispersed patch type. M P S = C A N P Where, CA refers to the total area in hectares (hm2), and NP represents the total number of patches.
Largest Patch Index (LPI) [48]The Maximum Patch Index is used to identify the dominant patch type within the landscape. L P I = a C A In this context,
a stands for the maximum area of a patch within a certain patch type, measured in hectares (hm2);
CA represents the total area of patches of a specific type within the landscape, also measured in hectares (hm2).
Shape indexLandscape Shape Index (LSI) [48]The Landscape Shape Index (LSI) is employed to reflect the irregularity or complexity of a given patch. A higher LSI value indicates greater irregularity and elongation in the shape of the corresponding patch. L S I = 0.25 i = 1 n c i i = 1 n a i Where, c i denotes the perimeter of the ith patch, measured in meters (m), while a i represents the area of the ith patch, measured in hectares (hm2).
Table 3. Spatial Rhythmic Indicators of Rural Settlements in She County from 1980 to 2020.
Primary IndexSecondary Indicators198020002020
Density indexNP152149241
Average annual change ratio −0.1%3.1%
Land use indexCA (ha)3023.733279.244471.92
Average annual change ratio 0.42%1.82%
Scale meritMPS (ha)19.8922.0118.56
LPI7.307.413.68
Shape indexLSI15.2215.0822.65
Table 4. Nearest Neighbor Index (NNA) and Clustering Characteristics (Z) of Rural Residential Points in She County from 1980 to 2020.
Year198020002020
NNA0.24530.25540.2822
Z−264.651071−271.905351−306.1088
Table 5. Land use transfer matrix from 2020 to 2035 under natural development scenario (km2).
CroplandForest LandGrasslandOther Construction LandRural SettlementUrban LandWater AreaArea in 2020
Cropland373.150.5642.250.008.0844.572.25470.87
Forest land0.3964.1212.460.000.011.450.2578.68
Grassland31.389.87766.850.033.6014.740.63827.11
Other construction land3.680.004.170.001.313.360.1612.68
Rural settlement19.090.061.640.0021.651.760.5144.71
Urban land9.030.000.393.3612.8811.600.0437.30
Water area2.900.000.580.000.150.1421.3225.09
Area under ND439.6374.61828.343.3947.6877.6325.171496.44
Table 6. Land use transfer matrix from 2020 to 2035 under the new urbanization scenario (km2).
CroplandForest LandGrasslandOther Construction LandRural SettlementUrban LandWater AreaArea in 2020
Cropland127.7919.75254.941.045.4353.378.54470.87
Forest land0.0366.0012.400.000.010.000.2478.68
Grassland4.3711.62807.330.090.382.680.65827.11
Other construction land0.510.258.240.100.023.400.1612.68
Rural settlement2.621.9013.340.1219.955.011.7844.71
Urban land0.280.011.899.804.9720.310.0437.30
Water area0.620.111.620.000.000.7821.9025.09
Area under NTU136.2199.641099.7511.1430.8285.5533.321496.44
Table 7. Land use transfer matrix from 2020 to 2035 under ecological protection scenario (km2).
CroplandForest LandGrasslandOther Construction LandRural SettlementUrban LandWater AreaArea in 2020
Cropland329.942.3074.520.007.9052.943.27470.87
Forest land0.1866.0412.040.000.010.160.2578.68
Grassland23.1310.51782.150.030.839.840.63827.11
Other construction land3.520.075.350.001.372.200.1612.68
Rural settlement18.180.082.460.0021.551.790.6444.71
Urban land7.210.000.792.8815.7710.610.0437.30
Water area2.720.020.690.000.080.1121.4725.09
Area under EP384.8979.02878.002.9147.5077.6526.471496.44
Disclaimer/Publisher’s Note: The statements, opinions and data contained in all publications are solely those of the individual author(s) and contributor(s) and not of MDPI and/or the editor(s). MDPI and/or the editor(s) disclaim responsibility for any injury to people or property resulting from any ideas, methods, instructions or products referred to in the content.