


Preservation of Soil Organic Carbon (SOC) through Ecosystems’ Soil Retention Services in China


Abstract
:1. Introduction
2. Material and Methods
2.1. Study Area
2.2. Methods
2.2.1. Estimation of SOC Erosion
2.2.2. Estimation of Potential SOC Erosion
2.2.3. Estimation of SOC Preservation
2.3. Data
3. Results
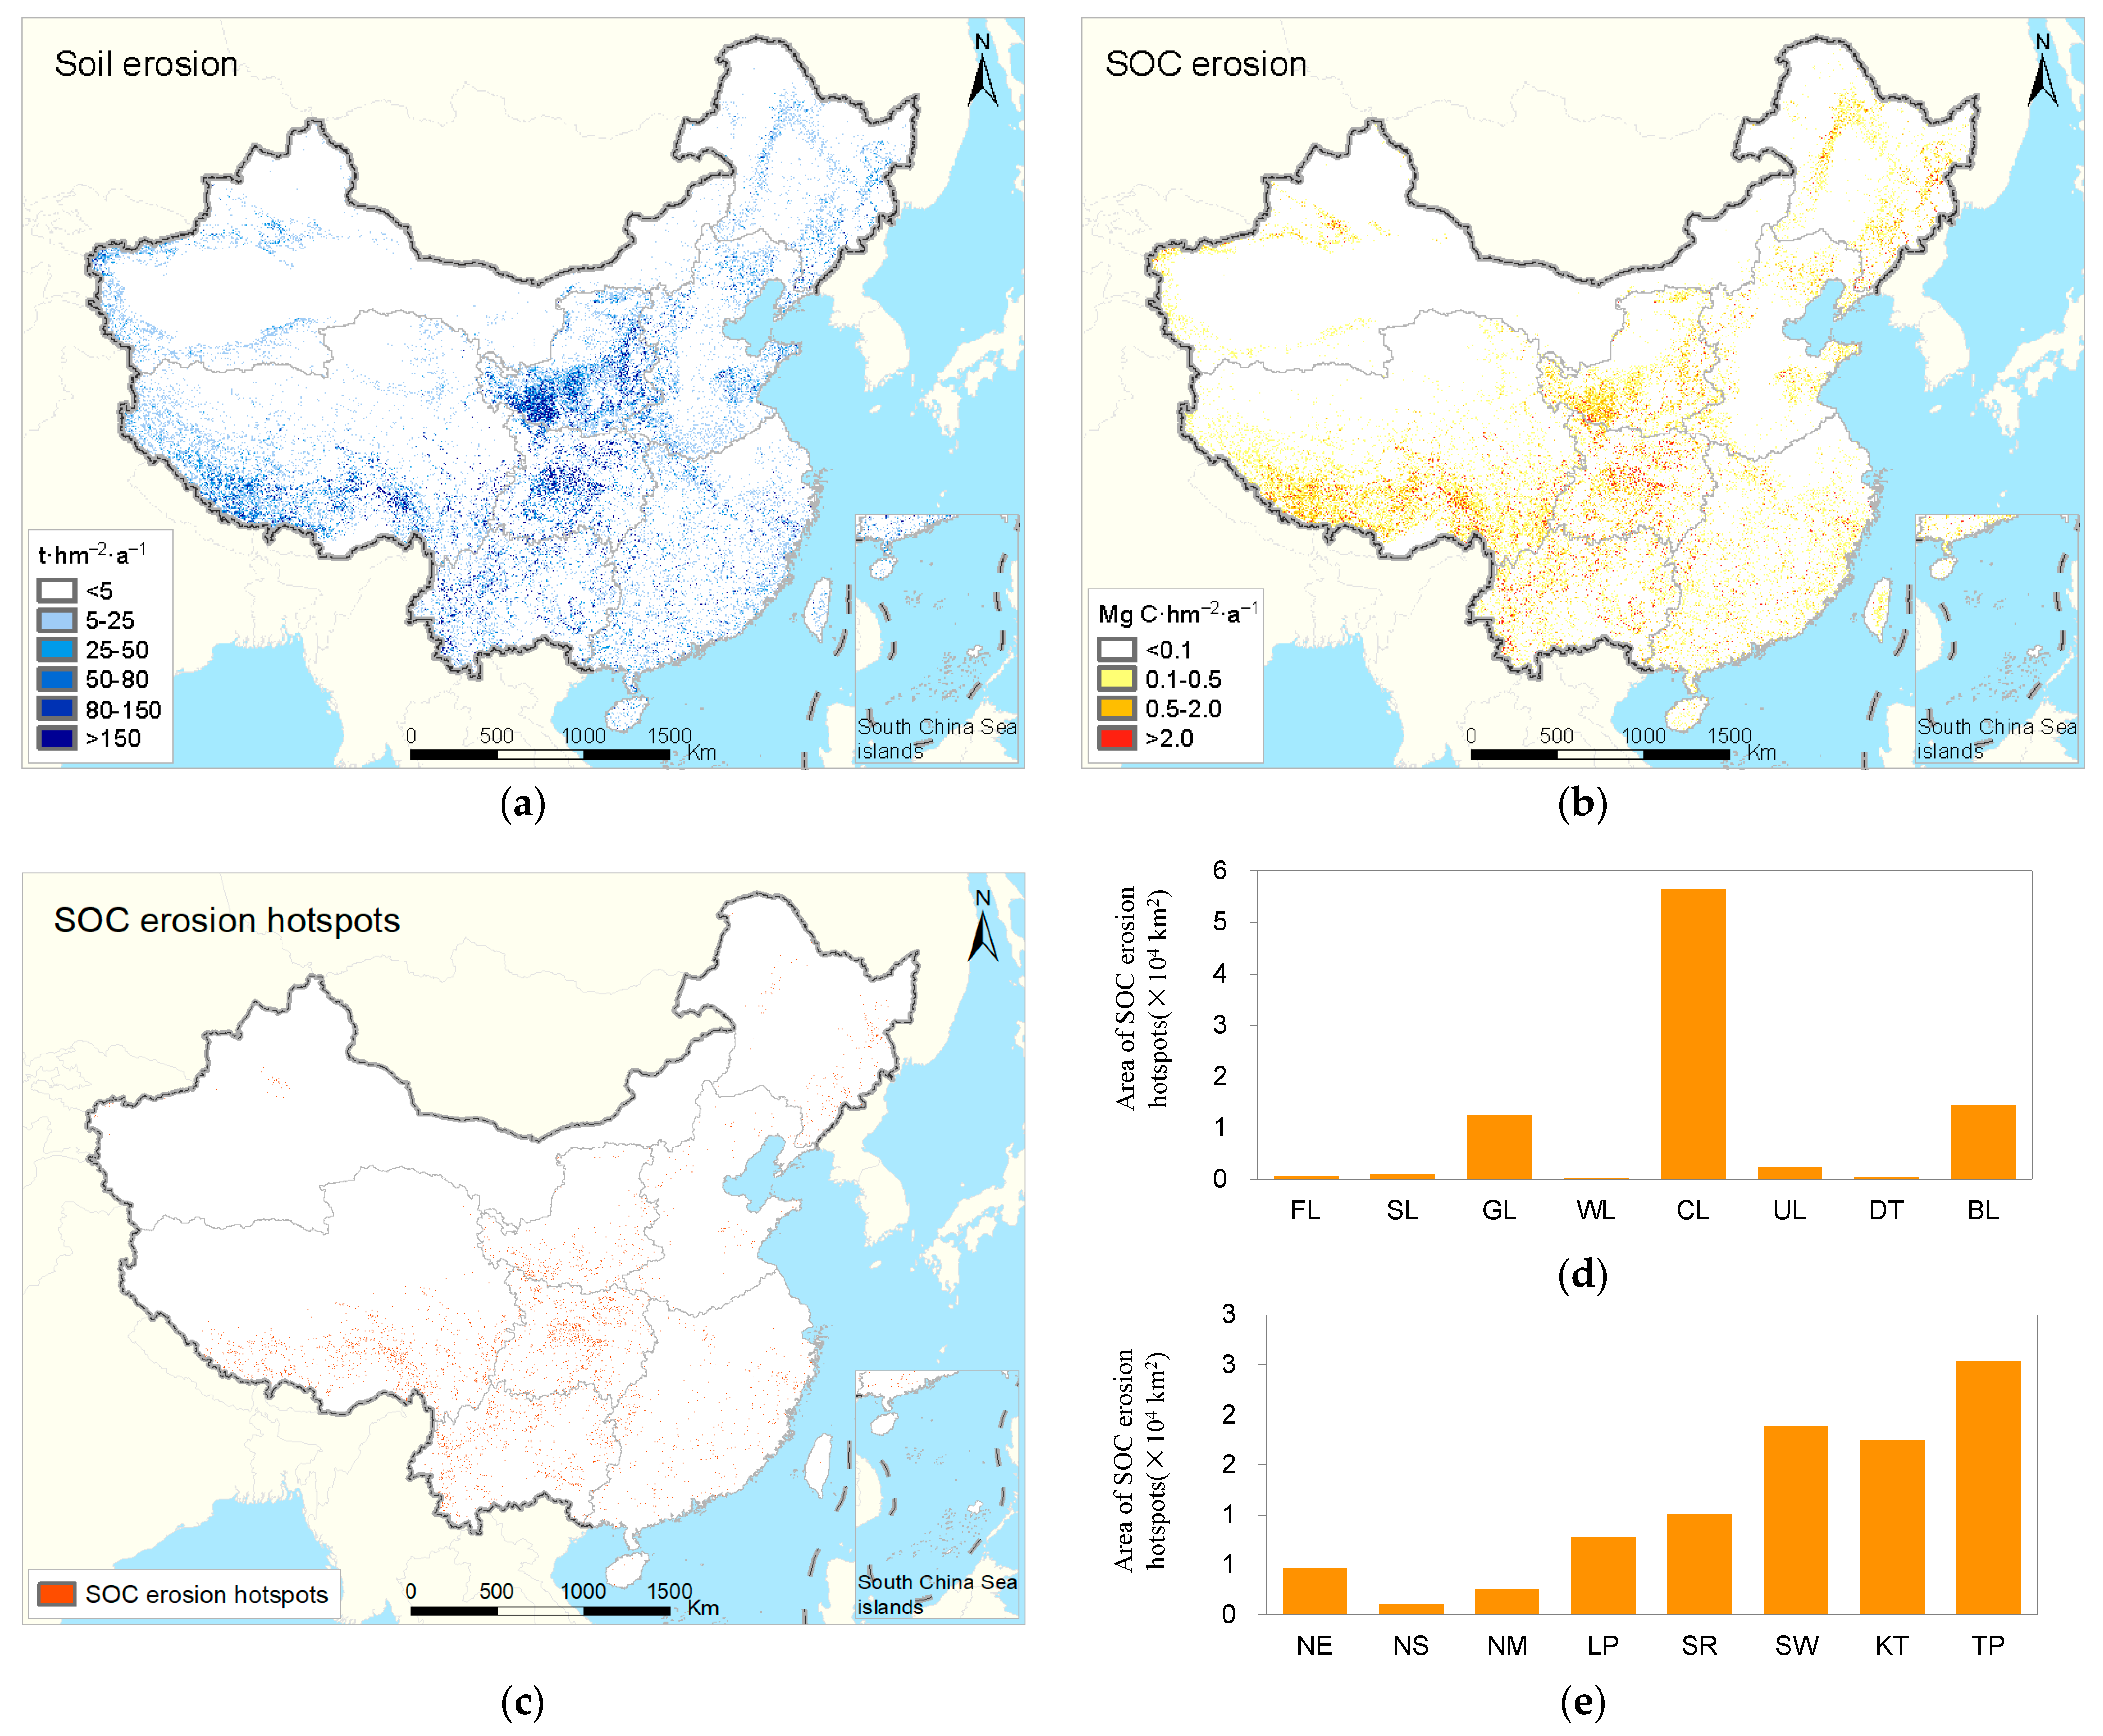
3.1. SOC Erosion
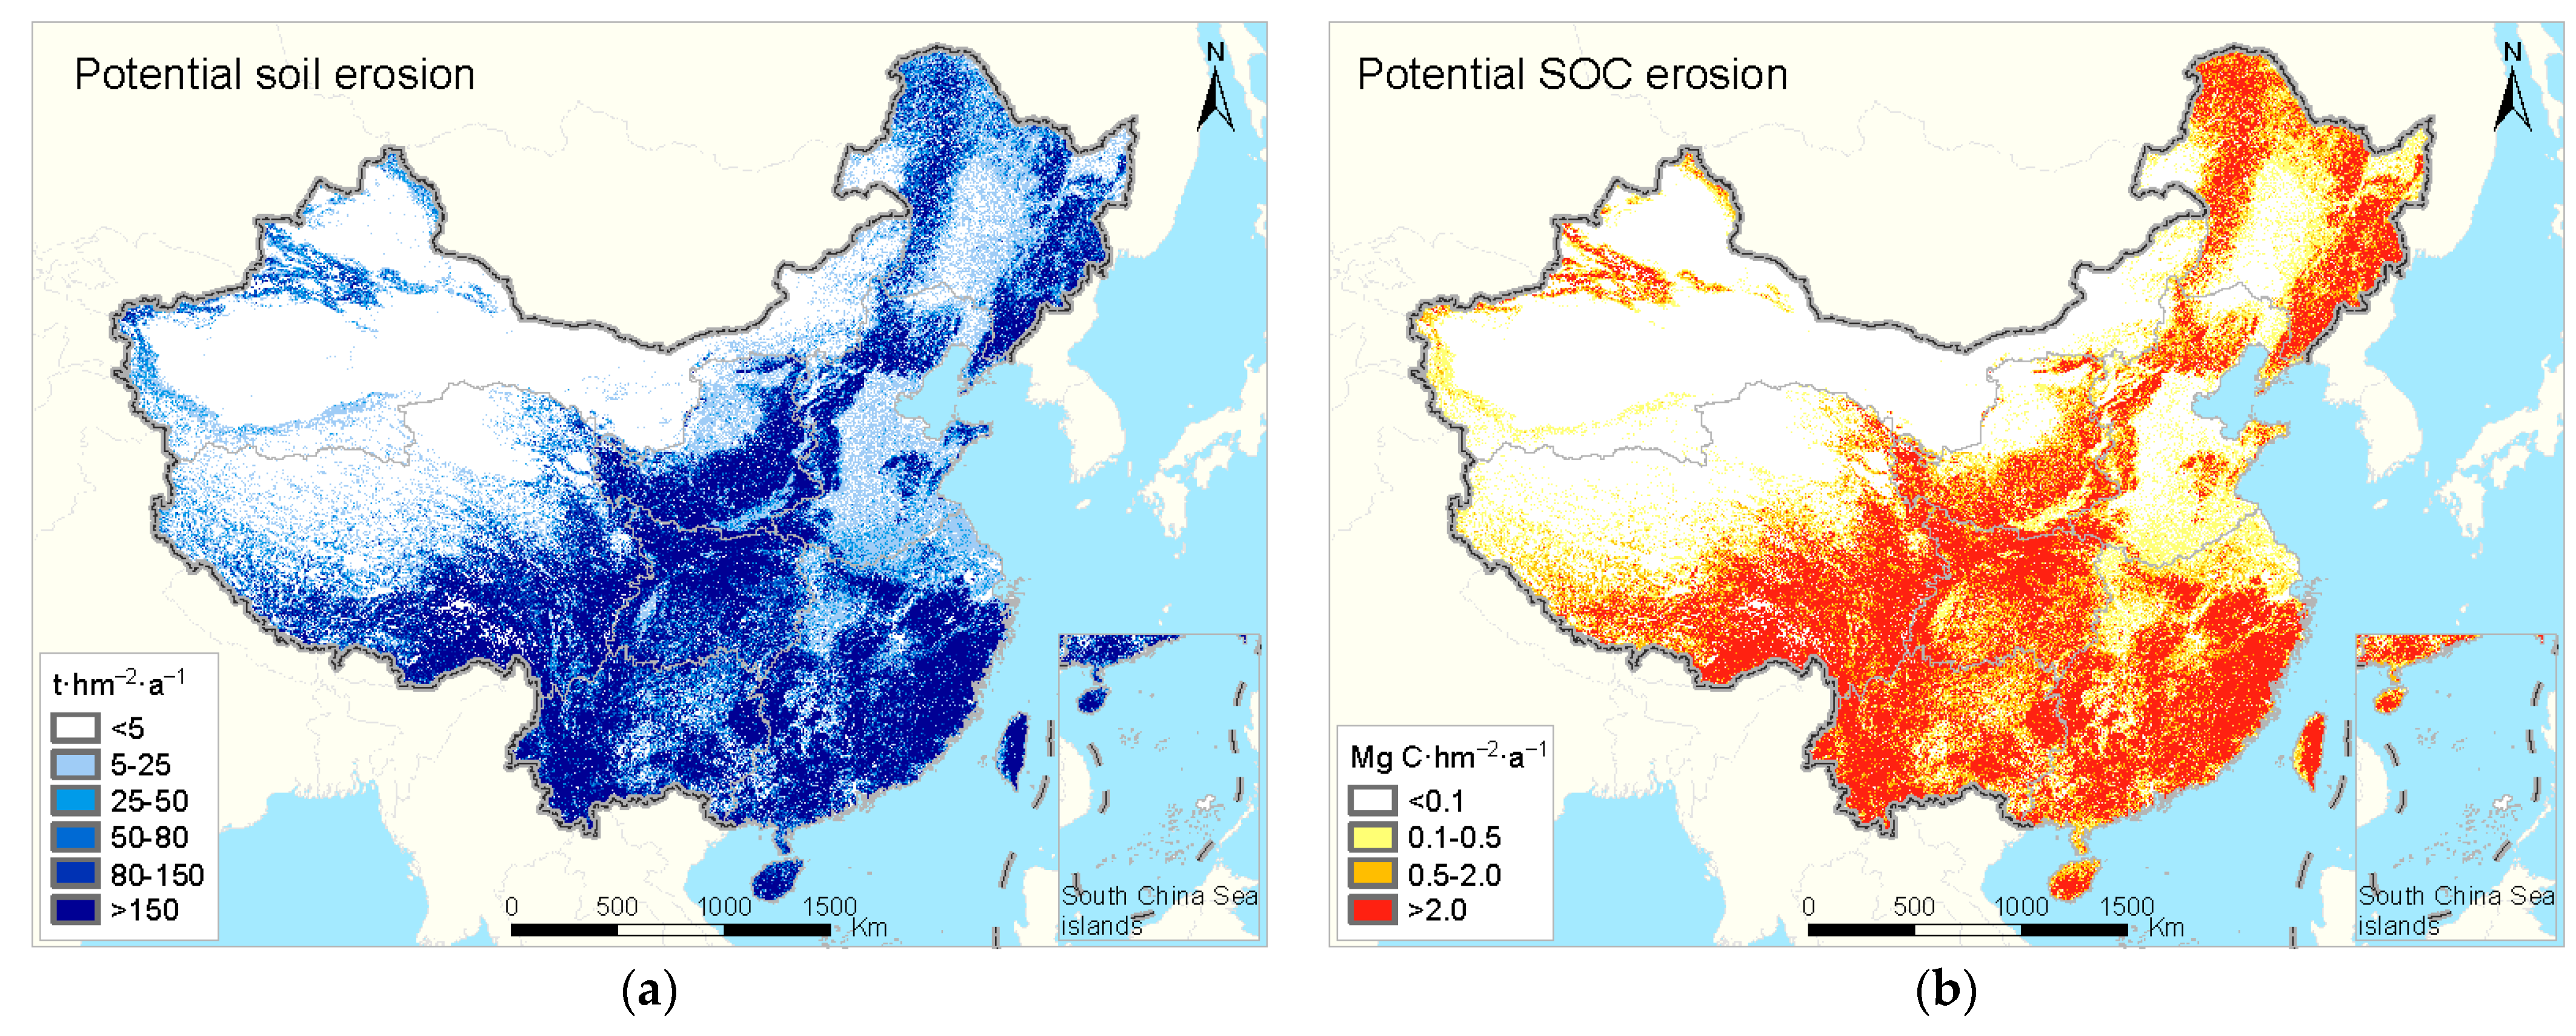
3.2. Potential SOC Erosion
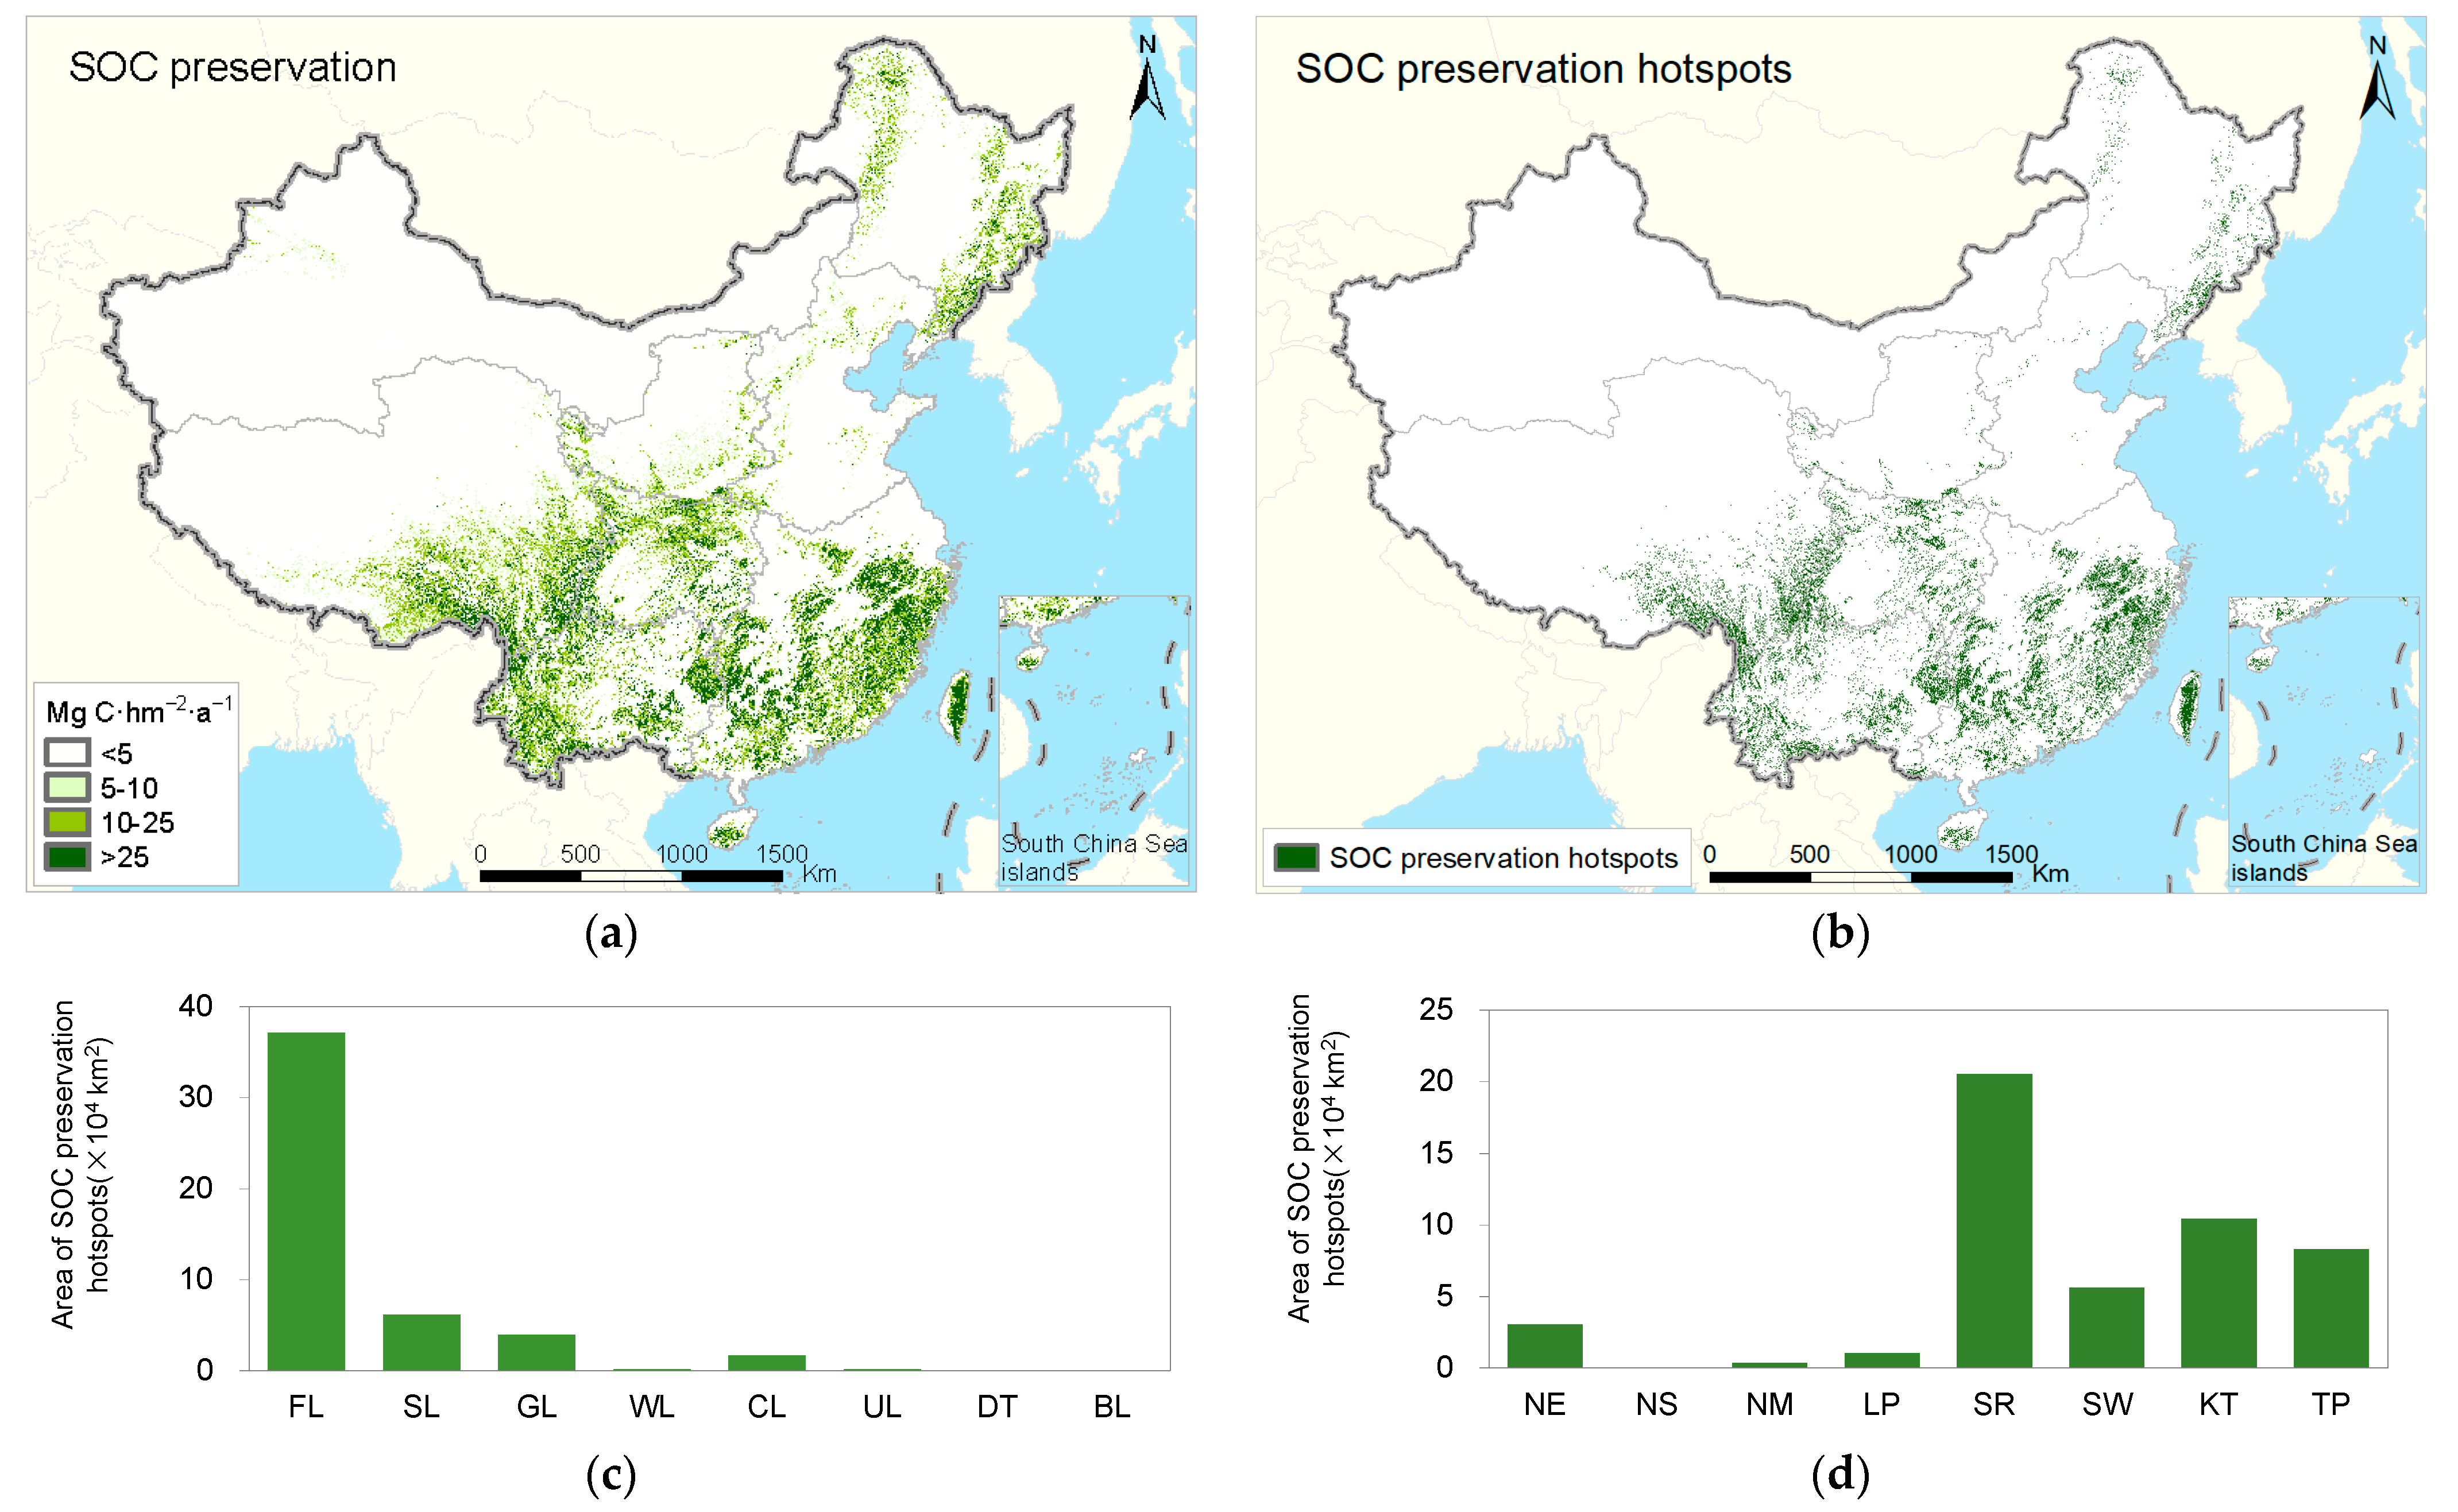
3.3. SOC Preservation through Soil Retention Service
4. Discussion
4.1. SOC Erosion and Its Sources
4.2. Contribution of SOC Preservation to Climate Change Mitigation
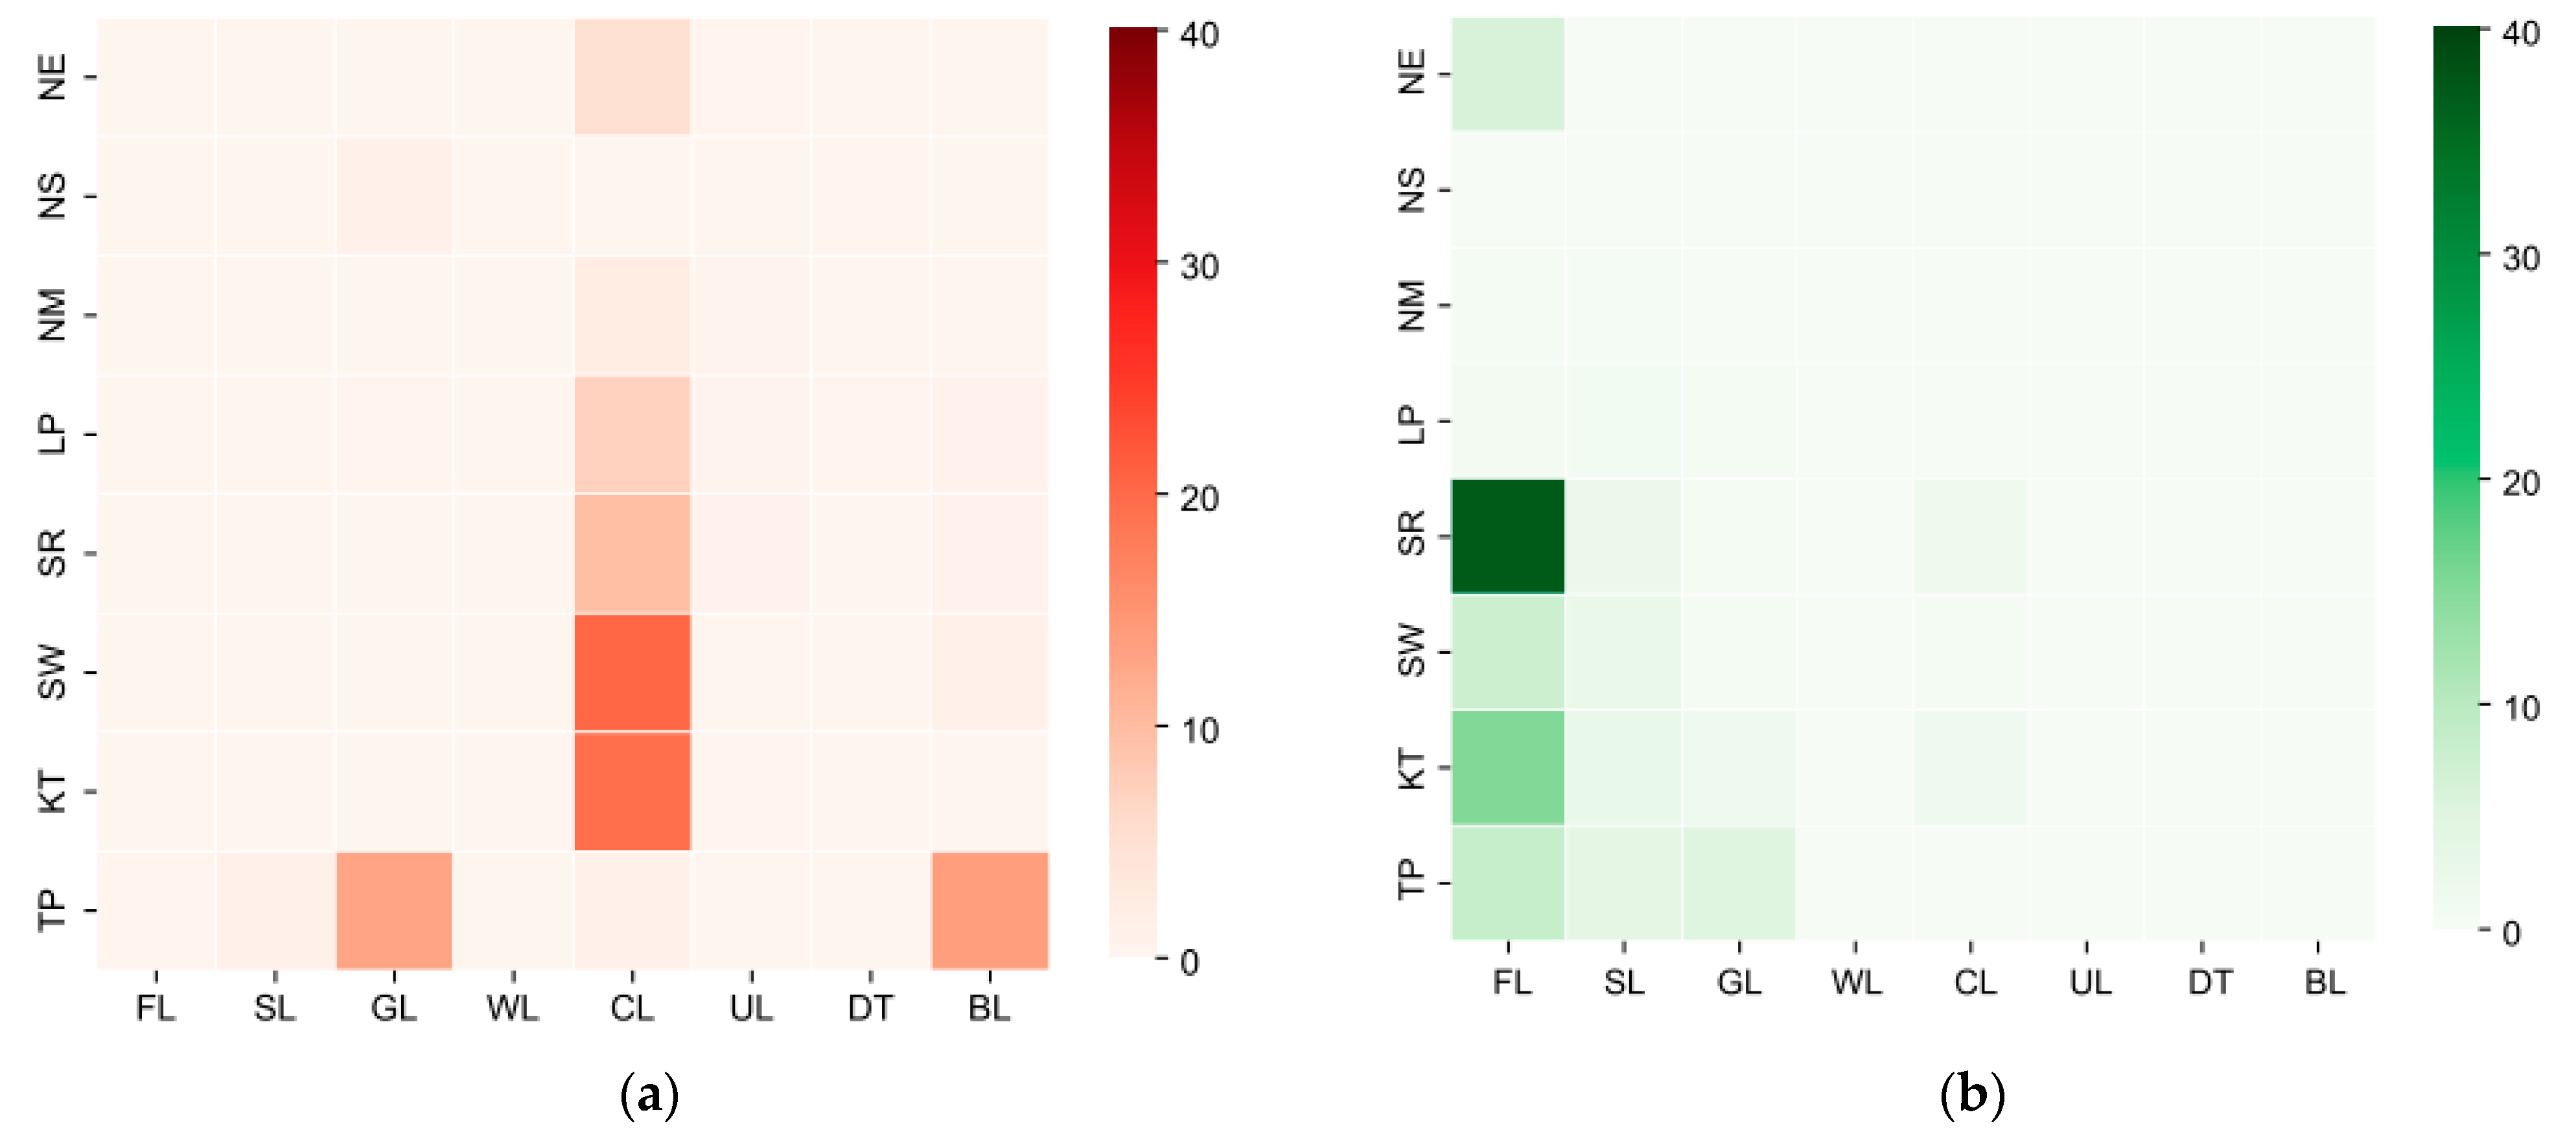
4.3. Key Regions for SOC Erosion and SOC Preservation
4.4. Uncertainties
5. Conclusions
Supplementary Materials
Author Contributions
Funding
Data Availability Statement
Acknowledgments
Conflicts of Interest
References
- Berhe, A.A.; Harte, J.; Harden, J.W.; Torn, M.S. The significance of the erosion-induced terrestrial carbon sink. Bioscience 2007, 57, 337–346. [Google Scholar] [CrossRef]
- Lal, R. Soil erosion and the global carbon budget. Environ. Int. 2003, 29, 437–450. [Google Scholar] [CrossRef] [PubMed]
- Crowther, T.W.; Hoogen, J.V.D.; Wan, J.; Mayes, M.A.; Keiser, A.D.; Mo, L.; Averill, C.; Maynard, D.S. The global soil community and its influence on biogeochemistry. Science 2019, 365, eaav0550. [Google Scholar] [CrossRef] [PubMed]
- Schimel, D.S. Terrestrial ecosystems and the carbon cycle. Glob. Chang. Biol. 1995, 1, 77–91. [Google Scholar] [CrossRef]
- Chappell, A.; Baldock, J.; Sanderman, J. The global significance of omitting soil erosion from soil organic carbon cycling schemes. Nat. Clim. Change 2016, 6, 187–191. [Google Scholar] [CrossRef]
- Whitehead, D.; Schipper, L.A.; Pronger, J.; Moinet, G.Y.K.; Mudge, P.L.; Pereira, R.C.; Kirschbaum, M.U.F.; Mcnally, S.R.; Beare, M.H.; Camps-Arbestain, M. Management practices to reduce losses or increase soil carbon stocks in temperate grazed grasslands: New Zealand as a case study. Agr. Ecosyst. Environ. 2018, 265, 432–443. [Google Scholar] [CrossRef]
- Van Oost, K.; Quine, T.A.; Govers, G.; De Gryze, S.; Six, J.; Harden, J.W.; Ritchie, J.C.; Mccarty, G.W.; Heckrath, G.; Kosmas, C.; et al. The impact of agricultural soil erosion on the global carbon cycle. Science 2007, 318, 626–629. [Google Scholar] [CrossRef]
- Kirkels, F.M.S.A.; Cammeraat, L.H.; Kuhn, N.J. The fate of soil organic carbon upon erosion, transport and deposition in agricultural landscapes-A review of different concepts. Geomorphology 2014, 226, 94–105. [Google Scholar] [CrossRef]
- Zhang, H.; Liu, S.; Yuan, W.; Dong, W.; Ye, A.; Xie, X.; Chen, Y.; Liu, D.; Cai, W.; Mao, Y. Inclusion of soil carbon lateral movement alters terrestrial carbon budget in China. Sci. Rep. 2014, 4, 7247. [Google Scholar] [CrossRef]
- Lal, R. Accelerated Soil erosion as a source of atmospheric CO2. Soil Tillage Res. 2019, 188, 35–40. [Google Scholar] [CrossRef]
- Tan, Z.; Leung, L.R.; Li, H.Y.; Tesfa, T.; Zhu, Q.; Huang, M. A substantial role of soil erosion in the land carbon sink and its future changes. Glob. Chang. Biol. 2020, 26, 2642–2655. [Google Scholar] [CrossRef]
- Yadav, V.; Malanson, G.P. Modeling impacts of erosion and deposition on soil organic carbon in the Big Creek Basin of southern Illinois. Geomorphology 2009, 106, 304–314. [Google Scholar] [CrossRef]
- Quinton, J.N.; Govers, G.; Van Oost, K.; Bardgett, R.D. The impact of agricultural soil erosion on biogeochemical cycling. Nat. Geosci. 2010, 3, 311–314. [Google Scholar] [CrossRef]
- Liu, C.; Li, Z.; Hu, B.X.; Yan, J.; Xiao, H. Identifying eroded organic matter sources in sediments at fluvial system using multiple tracers on the Loess Plateau of China. Catena 2020, 193, 104623. [Google Scholar] [CrossRef]
- Lin, H.; Duan, X.; Li, Y.; Zhang, L.; Rong, L.; Li, R. Simulating the effects of erosion on organic carbon dynamics in agricultural soils. Catena 2022, 208, 105753. [Google Scholar] [CrossRef]
- Schiettecatte, W.; Gabriels, D.; Cornelis, W.M.; Hofman, G. Impact of deposition on the enrichment of organic carbon in eroded sediment. Catena 2008, 72, 340–347. [Google Scholar] [CrossRef]
- De Nijs, E.A.; Cammeraat, E.L.H. The stability and fate of Soil Organic Carbon during the transport phase of soil erosion. Earth-Sci. Rev. 2020, 201, 103067. [Google Scholar] [CrossRef]
- Lugato, E.; Smith, P.; Borrelli, P.; Panagos, P.; Ballabio, C.; Orgiazzi, A.; Fernandez-Ugalde, O.; Montanarella, L.; Jones, A. Soil erosion is unlikely to drive a future carbon sink in Europe. Sci. Adv. 2018, 4, eaau3523. [Google Scholar] [CrossRef]
- Li, J.; Fu, B.; Liu, S.; Dargush, P.; Gao, G.; Liu, J.; Wei, F. Vegetation restoration changes topsoil biophysical regulations of carbon fluxes in an eroding soil landscape. Land Degrad. Dev. 2018, 29, 4061–4070. [Google Scholar] [CrossRef]
- Liang, Y.; Li, X.; Zha, T.; Zhang, X. Vegetation Restoration Alleviated the Soil Surface Organic Carbon Redistribution in the Hillslope Scale on the Loess Plateau, China. Front. Environ. Sci. 2021, 8, 614761. [Google Scholar] [CrossRef]
- Bhattacharyya, S.S.; Leite, F.F.G.D.; France, C.L.; Adekoya, A.O.; Ros, G.H.; De Vries, W.; Melchor-Martinez, E.M.; Iqbal, H.M.N.; Parra-Saldivar, R. Soil carbon sequestration, greenhouse gas emissions, and water pollution under different tillage practices. Sci. Total Environ. 2022, 826, 154161. [Google Scholar] [CrossRef] [PubMed]
- Naipal, V.; Ciais, P.; Wang, Y.; Lauerwald, R.; Guenet, B.; Van Oost, K. Global soil organic carbon removal by water erosion under climate change and land use change during AD 1850–2005. Biogeosciences 2018, 15, 4459–4480. [Google Scholar] [CrossRef]
- Ran, L.; Lu, X.; Fang, N.; Yang, X. Effective soil erosion control represents a significant net carbon sequestration. Sci. Rep. 2018, 8, 12018. [Google Scholar] [CrossRef]
- Lal, R. Soil conservation and ecosystem services. Int. Soil. Water Conserv. Res. 2014, 2, 36–47. [Google Scholar] [CrossRef]
- Rao, E.; Ouyang, Z.; Yu, X.; Xiao, Y. Spatial patterns and impacts of soil conservation service in China. Geomorphology 2014, 207, 64–70. [Google Scholar] [CrossRef]
- Liu, H.; Liu, Y.; Wang, K.; Zhao, W. Soil conservation efficiency assessment based on land use scenarios in the Nile River Basin. Ecol. Indic. 2020, 119, 106864. [Google Scholar] [CrossRef]
- An, Y.; Zhao, W.; Li, C.; Sofia Santos Ferreira, C. Temporal changes on soil conservation services in large basins across the world. Catena 2022, 209, 105793. [Google Scholar] [CrossRef]
- Kuhlman, T.; Reinhard, S.; Gaaff, A. Estimating the costs and benefits of soil conservation in Europe. Land Use Policy 2010, 27, 22–32. [Google Scholar] [CrossRef]
- Pimentel, D.; Harvey, C.; Resosudarmo, P.; Sinclair, K.; Kurz, D.; McNair, M.; Crist, S.; Shpritz, L.; Fitton, L.; Saffouri, R.; et al. Environmental and economic costs of soil erosion and conservation benefits. Science 1995, 267, 1117–1123. [Google Scholar] [CrossRef]
- Borrelli, P.; Robinson, D.A.; Fleischer, L.R.; Lugato, E.; Ballabio, C.; Alewell, C.; Meusburger, K.; Modugno, S.; Schutt, B.; Ferro, V.; et al. An assessment of the global impact of 21st century land use change on soil erosion. Nat. Commun. 2017, 8, 2013. [Google Scholar] [CrossRef]
- Wu, L.; Cai, Z. Estimation of the change of topsoil organic carbon of croplands in China based on long-term experimental data. Ecol. Environ. 2007, 16, 1768–1774. [Google Scholar] [CrossRef]
- Tang, X.; Zhao, X.; Bai, Y.; Tang, Z.; Wang, W.; Zhao, Y.; Wan, H.; Xie, Z.; Shi, X.; Wu, B.; et al. Carbon pools in China’s terrestrial ecosystems: New estimates based on an intensive field survey. Proc. Natl. Acad. Sci. USA 2018, 115, 4021–4026. [Google Scholar] [CrossRef]
- Ministry of Water Resources of China. The National Soil and Water Conservation Plan (2015–2030); China Waterpower Press: Beijing, China, 2015. [Google Scholar]
- Wischmeier, W.H.; Smith, D.D. Predicting Rainfall Erosion Losses: A Guide to Conservation Planning; Department of Agriculture: Washington, DC, USA, 1978. [Google Scholar]
- Rao, E.; Xiao, Y.; Ouyang, Z.; Yu, X. National assessment of soil erosion and its spatial patterns in China. Ecosyst. Health Sustain. 2015, 1, 13. [Google Scholar] [CrossRef]
- Liu, B.; Xie, Y.; Li, Z.; Liang, Y.; Zhang, W.; Fu, S.; Yin, S.; Wei, X.; Zhang, K.; Wang, Z.; et al. The assessment of soil loss by water erosion in China. Int. Soil. Water Conserv. Res. 2020, 8, 430–439. [Google Scholar] [CrossRef]
- Shangguan, W.; Dai, Y.; Liu, B.; Zhu, A.; Duan, Q.; Wu, L.; Ji, D.; Ye, A.; Yuan, H.; Zhang, Q.; et al. A China data set of soil properties for land surface modeling. J. Adv. Model. Earth Syst. 2013, 5, 212–224. [Google Scholar] [CrossRef]
- Yue, Y.; Ni, J.; Ciais, P.; Piao, S.; Wang, T.; Huang, M.; Borthwick, A.G.L.; Li, T.; Wang, Y.; Chappell, A.; et al. Lateral transport of soil carbon and land-atmosphere CO2 flux induced by water erosion in China. Proc. Natl. Acad. Sci. USA 2016, 113, 6617–6622. [Google Scholar] [CrossRef]
- Ouyang, Z.; Zheng, H.; Xiao, Y.; Polasky, S.; Liu, J.; Xu, W.; Wang, Q.; Zhang, L.; Xiao, Y.; Rao, E.; et al. Improvements in ecosystem services from investments in natural capital. Science 2016, 352, 1455–1459. [Google Scholar] [CrossRef]
- Ministry of Water Resources of China. River Sediment Bulletin of China 2020; China Waterpower Press: Beijing, China, 2021. [Google Scholar]
- Lal, R. Soil Erosion and Gaseous Emissions. Appl. Sci. 2020, 10, 2784. [Google Scholar] [CrossRef]
- Chenu, C.; Angers, D.A.; Barre, P.; Derrien, D.; Arrouays, D.; Balesdent, J. Increasing organic stocks in agricultural soils: Knowledge gaps and potential innovations. Soil. Tillage Res. 2019, 188, 41–52. [Google Scholar] [CrossRef]
- Song, G.; Li, L.; Pan, G.; Zhang, Q. Topsoil organic carbon storage of China and its loss by cultivation. Biogeochemistry 2005, 74, 47–62. [Google Scholar] [CrossRef]
- Wu, L.; Cai, Z. Effect of Agricultural Cultivation on Soil Organic Carbon in China. J. Soil Water Conserv. 2007, 21, 118–121+134. [Google Scholar] [CrossRef]
- Guo, Q.; Hao, Y.; Liu, B. Rates of soil erosion in China: A study based on runoff plot data. Catena 2015, 124, 68–76. [Google Scholar] [CrossRef]
- Garcia-Ruiz, J.M.; Begueria, S.; Nadal-Romero, E.; Gonzalez-Hidalgo, J.C.; Lana-Renault, N.; Sanjuan, Y. A meta-analysis of soil erosion rates across the world. Geomorphology 2015, 239, 160–173. [Google Scholar] [CrossRef]
- Xiong, M.; Sun, R.; Chen, L. A global comparison of soil erosion associated with land use and climate type. Geoderma 2019, 343, 31–39. [Google Scholar] [CrossRef]
- Zuazo, V.H.D.; Pleguezuelo, C.R.R. Soil-erosion and runoff prevention by plant covers. A review. Agron. Sustain. Dev. 2008, 28, 65–86. [Google Scholar] [CrossRef]
- Wen, Z.M.; Lees, B.G.; Jiao, F.; Lei, W.N.; Shi, H.J. Stratified vegetation cover index: A new way to assess vegetation impact on soil erosion. Catena 2010, 83, 87–93. [Google Scholar]
- FAO. Global Forest Resources Assessment 2010, Country Report, China; FAO Forestry Department: Rome, Italy, 2010. [Google Scholar]
- National Forestry and Grassland Administration. The Eighth National Forest Resources Inventory Results; Forest Resources Management: Beijing, China, 2014; pp. 1–2. [Google Scholar] [CrossRef]
- Teng, H.; Liang, Z.; Chen, S.; Liu, Y.; Rossel, R.A.V.; Chappell, A.; Yu, W.; Shi, Z. Current and future assessments of soil erosion by water on the Tibetan Plateau based on RUSLE and CMIP5 climate models. Sci. Total Environ. 2018, 635, 673–686. [Google Scholar] [CrossRef]
- Lal, R. Soil carbon sequestration impacts on global climate change and food security. Science 2004, 304, 1623–1627. [Google Scholar] [CrossRef]
- Zhang, G.; Wang, X.; Zhao, H.; Sun, B.; Lu, F.; Hu, L. Extension of residue retention increases net greenhouse gas mitigation in China’s croplands. J. Clean. Prod. 2017, 165, 1–12. [Google Scholar] [CrossRef]
- Chen, D.; Wei, W.; Daryanto, S.; Tarolli, P. Does terracing enhance soil organic carbon sequestration? A national-scale data analysis in China. Sci. Total Environ. 2020, 721, 137751. [Google Scholar] [CrossRef]
- Lu, F.; Hu, H.; Sun, W.; Zhu, J.; Liu, G.; Zhou, W.; Zhang, Q.; Shi, P.; Liu, X.; Wu, X.; et al. Effects of national ecological restoration projects on carbon sequestration in China from 2001 to 2010. Proc. Natl. Acad. Sci. USA 2018, 115, 4039–4044. [Google Scholar] [CrossRef] [PubMed]
- Zhang, D.; Cai, X.; Diao, L.; Wang, Y.; Wang, J.; An, S.; Cheng, X.; Yang, W. Changes in soil organic carbon and nitrogen pool sizes, dynamics, and biochemical stability during~160 years natural vegetation restoration on the Loess Plateau, China. Catena 2022, 211, 106014. [Google Scholar] [CrossRef]
- Oost, K.V.; Six, J. The soil carbon erosion paradox reconciled. Biogeosciences 2022, preprint. [Google Scholar] [CrossRef]


| Data | Spatial Resolution | Sources |
|---|---|---|
| Ecosystems | 90 m | Aerospace Information Research Institute, Chinese Academy of Sciences |
| Vegetation coverage | 250 m | Aerospace Information Research Institute, Chinese Academy of Sciences |
| SRTM | 90 m | Computer Network Information Center, Chinese Academy of Sciences |
| Soil attributes | 1 km | National Tibetan Plateau Data Center |
| Rainfall erosivity factor | 250 m | Beijing Normal University |
| Ecosystems | SOC Stock | SOC Erosion | Potential SOC Erosion | SOC Preservation | ||||
|---|---|---|---|---|---|---|---|---|
| Mg C hm−2 | Pg C | Mg C hm−2a−1 | Tg C a−1 | Mg C hm−2a−1 | Tg C a−1 | Mg C hm−2a−1 | Tg C a−1 | |
| Forest | 110.7 | 22.0 | 0.03 | 6.6 | 13.94 | 2772.0 | 13.91 | 2765.3 |
| Shrub | 93.2 | 6.0 | 0.08 | 4.9 | 8.63 | 553.7 | 8.55 | 548.8 |
| Grassland | 80.2 | 22.1 | 0.08 | 21.8 | 2.09 | 575.5 | 2.01 | 553.7 |
| Wetland | 134.5 | 3.8 | 0.01 | 0.2 | 0.83 | 23.2 | 0.82 | 22.9 |
| Cropland | 84.3 | 14.5 | 0.29 | 49.2 | 1.78 | 305.7 | 1.49 | 256.5 |
| Urban land | 80.1 | 2.2 | 0.11 | 3.0 | 0.93 | 26.2 | 0.83 | 23.1 |
| Desert | 23.1 | 3.0 | 0.01 | 0.9 | 0.01 | 1.0 | 0.00 | 0.1 |
| Bare land | 66.9 | 1.5 | 0.70 | 16.2 | 0.76 | 18.0 | 0.06 | 1.8 |
| SWCDs | SOC Stock | Soil Erosion | SOC Erosion | |||
|---|---|---|---|---|---|---|
| Mg C hm−2 | Pg C | t hm−2 a−1 | Gt a−1 | Mg C hm−2a−1 | Tg C a−1 | |
| NE | 141.6 | 18.0 | 2.2 | 0.2 | 0.06 | 6.9 |
| NS | 42.9 | 10.5 | 1.2 | 0.3 | 0.02 | 3.7 |
| NM | 72.5 | 5.9 | 5.4 | 0.4 | 0.06 | 4.7 |
| LP | 56.8 | 3.2 | 25.5 | 1.4 | 0.18 | 9.7 |
| SR | 80.7 | 9.0 | 6.9 | 0.8 | 0.12 | 14.1 |
| SW | 92.0 | 4.4 | 21.7 | 1.1 | 0.32 | 16.2 |
| KT | 100.4 | 6.2 | 11.1 | 0.8 | 0.22 | 15.0 |
| TP | 94.9 | 19.6 | 6.4 | 1.4 | 0.15 | 32.7 |
Disclaimer/Publisher’s Note: The statements, opinions and data contained in all publications are solely those of the individual author(s) and contributor(s) and not of MDPI and/or the editor(s). MDPI and/or the editor(s) disclaim responsibility for any injury to people or property resulting from any ideas, methods, instructions or products referred to in the content. |
© 2023 by the authors. Licensee MDPI, Basel, Switzerland. This article is an open access article distributed under the terms and conditions of the Creative Commons Attribution (CC BY) license (https://creativecommons.org/licenses/by/4.0/).
Share and Cite
Rao, E.; Xiao, Y.; Lu, F.; Yang, H.; Ouyang, Z. Preservation of Soil Organic Carbon (SOC) through Ecosystems’ Soil Retention Services in China. Land 2023, 12, 1718. https://doi.org/10.3390/land12091718
Rao E, Xiao Y, Lu F, Yang H, Ouyang Z. Preservation of Soil Organic Carbon (SOC) through Ecosystems’ Soil Retention Services in China. Land. 2023; 12(9):1718. https://doi.org/10.3390/land12091718
Chicago/Turabian StyleRao, Enming, Yi Xiao, Fei Lu, Hongbo Yang, and Zhiyun Ouyang. 2023. "Preservation of Soil Organic Carbon (SOC) through Ecosystems’ Soil Retention Services in China" Land 12, no. 9: 1718. https://doi.org/10.3390/land12091718
APA StyleRao, E., Xiao, Y., Lu, F., Yang, H., & Ouyang, Z. (2023). Preservation of Soil Organic Carbon (SOC) through Ecosystems’ Soil Retention Services in China. Land, 12(9), 1718. https://doi.org/10.3390/land12091718