
Detectability of the Critically Endangered Araucaria angustifolia Tree Using Worldview-2 Images, Google Earth Engine and UAV-LiDAR


 , and
, and 
Abstract
:1. Introduction
- Can A. angustifolia canopies be accurately delineated using multispectral classification of pan-sharpened Worldview-2 images in Google Earth Engine?
- When combined with field estimates of crown sizes, is it possible to extrapolate from canopy cover the number of A. angustifolia trees?
- How different are estimates of numbers of trees based on crown segmentation from UAV-LiDAR imagery and estimates based on multispectral analysis of Worldview-2 images?
2. Methods
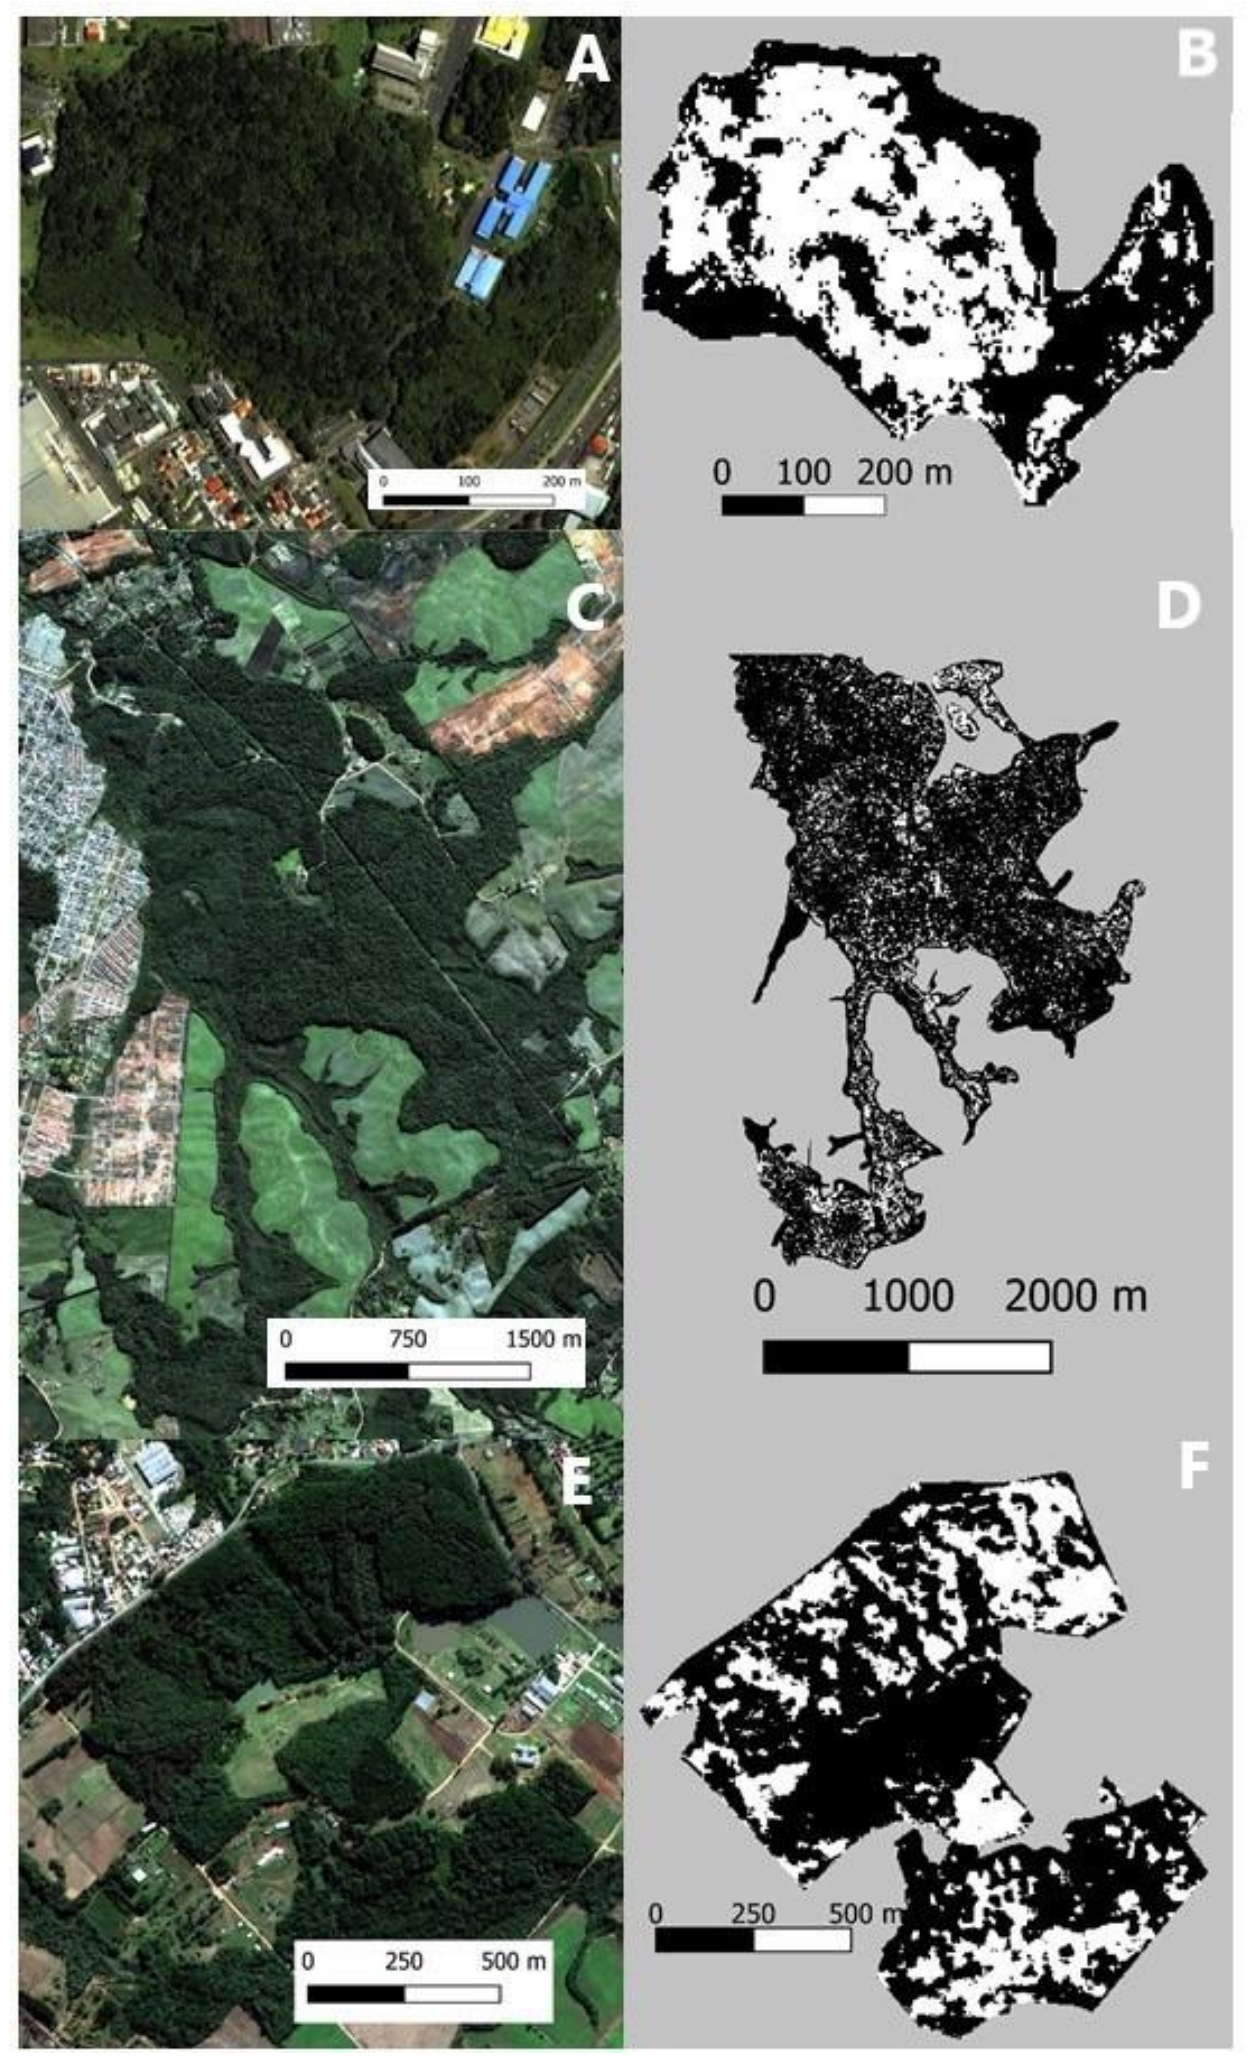
2.1. Study Sites
2.2. Data
2.2.1. Worldview-2
2.2.2. UAV-LiDAR
2.2.3. Field Data
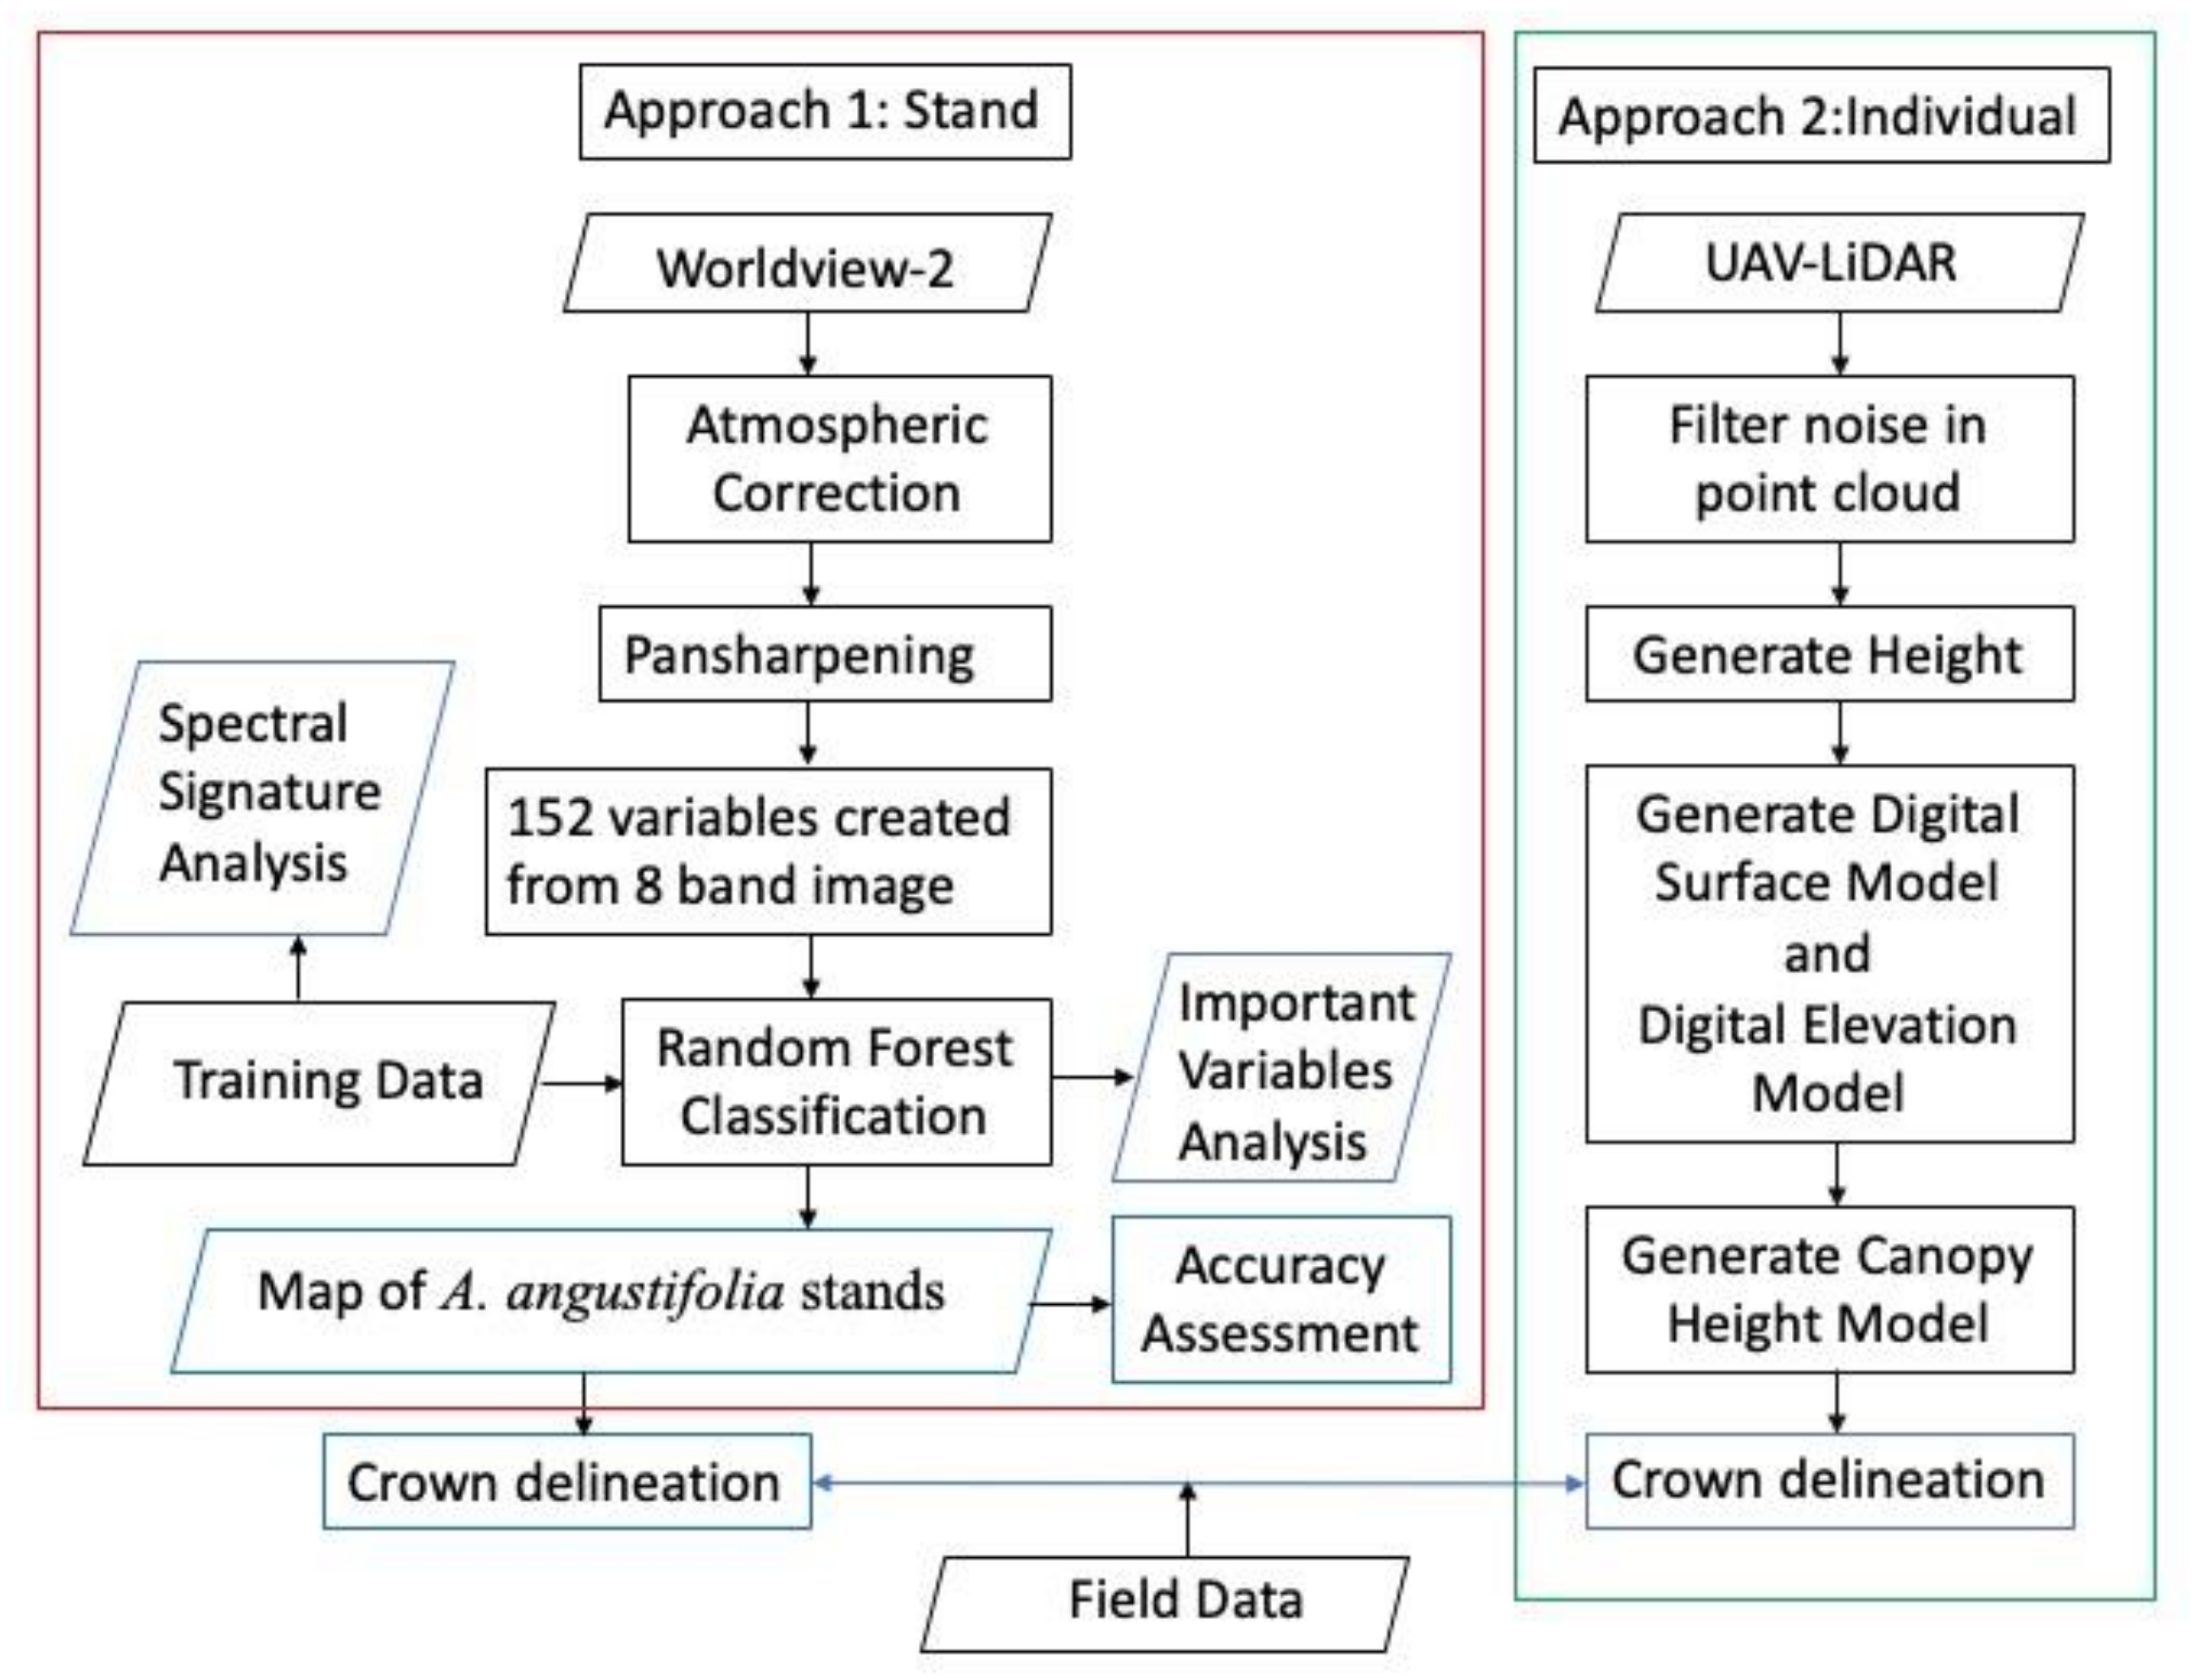
2.3. Methodology
- (a)
- Map Araucaria forest stands across all three study sites using Worldview-2.
- (b)
- Estimate the population of Araucaria trees at one study site using UAV-LiDAR.
2.3.1. Mapping Extent of Araucaria Forests across All Three Study Sites Using Worldview-2
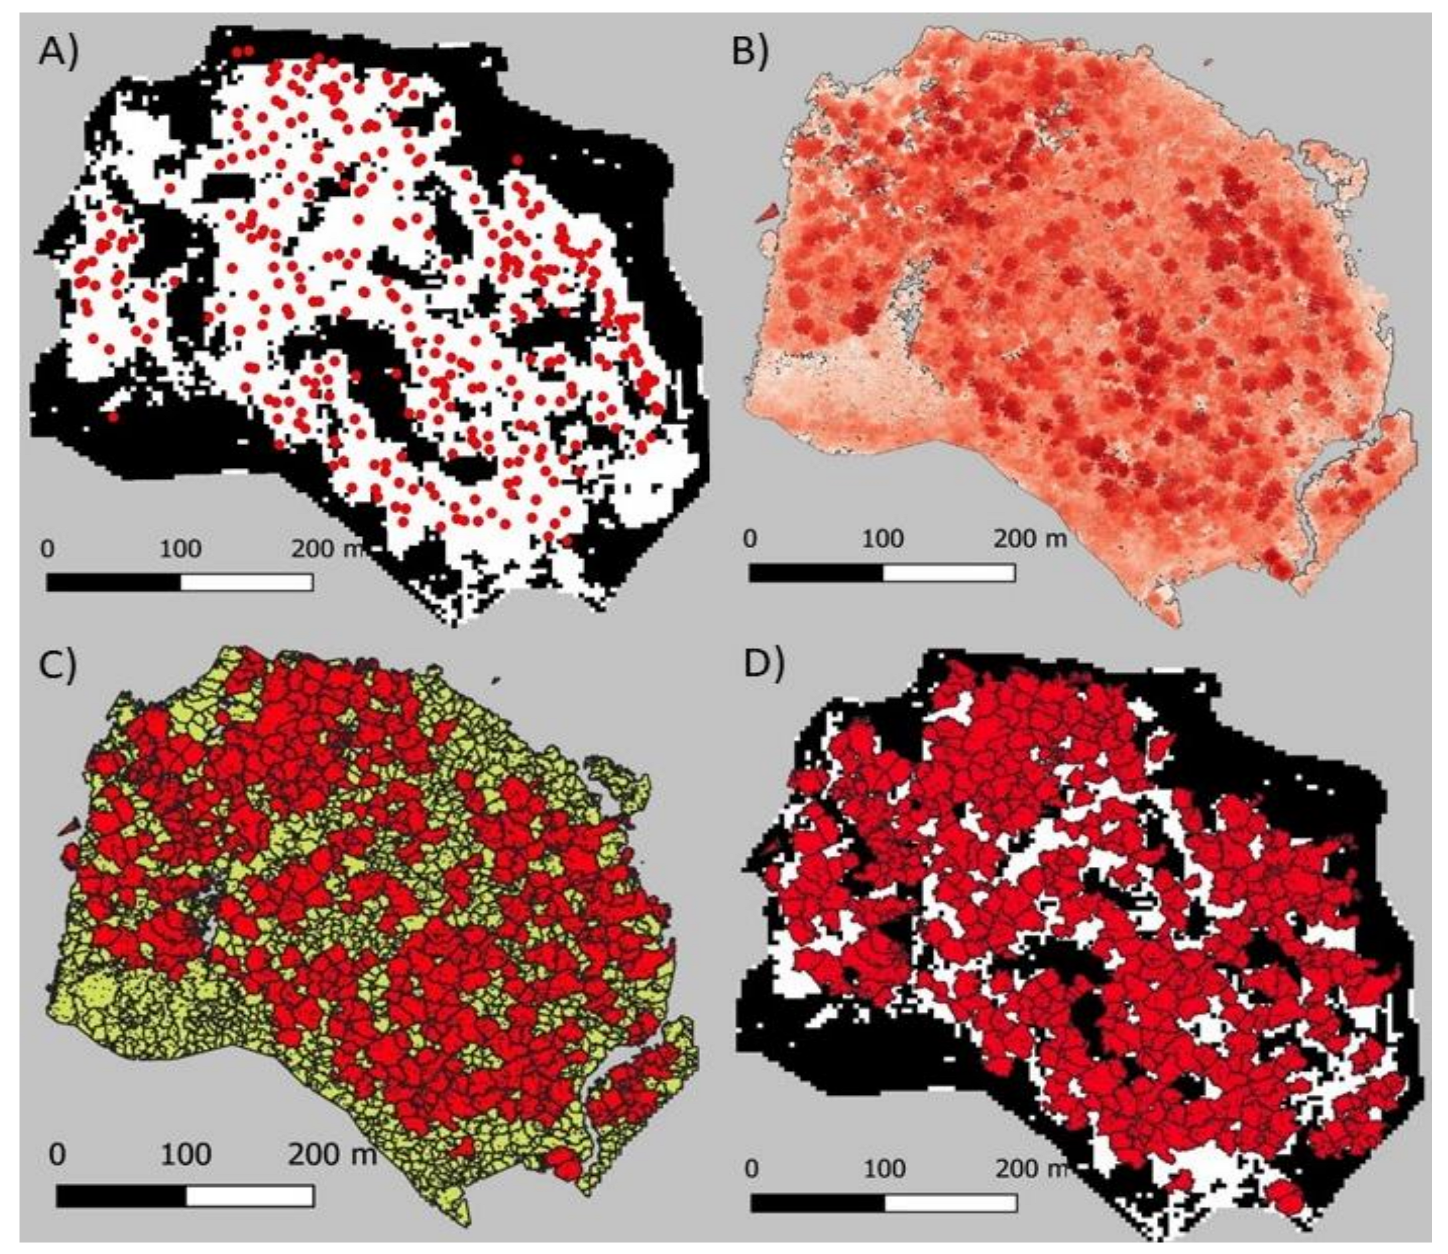
2.3.2. Estimating the Number of Araucaria Trees at One Study Site Using UAV-LiDAR
2.3.3. Analysis
2.3.4. Accuracy Assessment
- (a)
- An assessment of how well our pixel-based classification of Worldview-2 images can separate A. angustifolia stands from other forests across all three study sites.
- (b)
- The accuracy of estimating the number of A. angustifolia trees based on a simple model relating areas of A. angustifolia canopy from Worldview-2 to the number of individual trees at the Capão do Tigre study site.
- (c)
- The accuracy of counting all A. angustifolia trees using object-based classification of tree crowns using UAV-LiDAR data at the Capão do Tigre study site.
3. Results
3.1. Spectral Response of A. angustifolia Trees
3.2. Mapping Araucaria angustifolia Using High-Resolution Satellite Imagery
3.3. Validation—Random Forest
3.4. LiDAR Analysis and Validation
4. Discussion
- (a)
- The density of A. angustifolia individuals, where low densities (i.e., small sample sizes in training data) may result in less distinct differences from other forest types;
- (b)
- The age and species composition of interspersed forest types.
5. Conclusions
Supplementary Materials
Author Contributions
Funding
Institutional Review Board Statement
Data Availability Statement
Conflicts of Interest
References
- Díaz, S.; Settele, J.; Brondizio, E.S.; Ngo, H.T.; Guèze, M.; Agard, J.; Arneth, A.; Balvanera, P.; Brauman, K.A.; Butchart, S.H.M.; et al. (Eds.) IPBES Summary for Policymakers of the Global Assessment Report on Biodiversity and Ecosys-Tem Services of the Intergovernmental Science-Policy Platform on Biodiversity and Eco-System Services; IPBES Secretariat: Bonn, Germany, 2019. [Google Scholar]
- Pimm, S.L.; Jenkins, C.N.; Abell, R.; Brooks, T.M.; Gittleman, J.L.; Joppa, L.N.; Raven, P.H.; Roberts, C.M.; Sexton, J.O. The biodiversity of species and their rates of extinction, distribution, and protection. Science 2014, 344, 1246752. [Google Scholar] [CrossRef] [PubMed]
- Pereira, H.M.; Leadley, P.W.; Proença, V.; Alkemade, R.; Scharlemann, J.P.W.; Fernandez-Manjarrés, J.F.; Araújo, M.B.; Balvanera, P.; Biggs, R.; Cheung, W.W.L.; et al. Scenarios for global biodiversity in the 21st century. Science 2010, 330, 1496–1501. [Google Scholar] [CrossRef] [PubMed] [Green Version]
- Myers, N.; Mittermeier, R.A.; Mittermeier, C.G.; Fonseca, G.A.B.; Kent, J. 2013 Potency and Efficacy of a Low Pathogenic H5N2 Inactivated Vaccine Against. Nature 2000, 403, 853–858. [Google Scholar] [CrossRef] [PubMed]
- Brooks, T.M.; Mittermeier, R.A.; Mittermeier, C.G.; Da Fonseca, G.A.B.; Rylands, A.B.; Konstant, W.R.; Flick, P.; Pilgrim, J.; Oldfield, S.; Magin, G.; et al. Habitat Loss and Extinction in the Hotspots of Biodiversity. Conserv. Biol. 2002, 16, 909–923. [Google Scholar] [CrossRef] [Green Version]
- Ribeiro, M.C.; Metzger, J.P.; Martensen, A.C.; Ponzoni, F.J.; Hirota, M.M. The Brazilian Atlantic Forest: How much is left, and how is the remaining forest distributed? Implications for conservation. Biol. Conserv. 2009, 142, 1141–1153. [Google Scholar] [CrossRef]
- Di Marco, M.; Harwood, T.D.; Hoskins, A.J.; Ware, C.; Hill, S.L.L.; Ferrier, S. Projecting impacts of global climate and land-use scenarios on plant biodiversity using compositional-turnover modelling. Glob. Chang. Biol. 2019, 25, 2763–2778. [Google Scholar] [CrossRef]
- Komatsu, K.J.; Avolio, M.L.; Lemoine, N.P.; Isbell, F.; Grman, E.; Houseman, G.R.; Koerner, S.E.; Johnson, D.S.; Wilcox, K.R.; Alatalo, J.M.; et al. Global change effects on plant communities are magnified by time and the number of global change factors imposed. Proc. Natl. Acad. Sci. USA 2019, 116, 17867–17873. [Google Scholar] [CrossRef] [Green Version]
- Zwiener, V.P.; Padial, A.A.; Marques, M.C.M.; Faleiro, F.V.; Loyola, R.; Peterson, A.T. Planning for conservation and restoration under climate and land use change in the Brazilian Atlantic Forest. Divers. Distrib. 2017, 23, 955–966. [Google Scholar] [CrossRef]
- Bogoni, J.A.; Muniz-Tagliari, M.; Peroni, N.; Peres, C.A. Testing the keystone plant resource role of a flagship subtropical tree species (Araucaria angustifolia) in the Brazilian Atlantic Forest. Ecol. Indic. 2020, 118, 106778. [Google Scholar] [CrossRef]
- Duarte, L.D.S.; Bergamin, R.S.; Marcilio-Silva, V.; Seger, G.D.D.S.; Marques, M.C.M. Phylobetadiversity among forest types in the Brazilian Atlantic Forest complex. PLoS ONE 2014, 9, 1–10. [Google Scholar] [CrossRef]
- Behling, H.; Pillar, V.D.P. Late Quaternary vegetation, biodiversity and fire dynamics on the southern Brazilian highland and their implication for conservation and management of modern Araucaria forest and grassland ecosystems. Philos. Trans. R. Soc. B Biol. Sci. 2007, 362, 243–251. [Google Scholar] [CrossRef] [PubMed] [Green Version]
- Koch, Z.; Corrêa, M. Araucária: A Floresta do Brasil Meridional; Olhar Brasileiro: Curitiba, Brazil, 2002. [Google Scholar]
- Carlucci, M.B.; Prieto, P.V.; Hering, R.L.O.; Judice, D.M.; Monteiro, N.P. Araucariaceae. In Livro Vermelho da Flora do Brasil; Martinelli, G., Moraes, M.A., Eds.; Instituto de Pesquisas Jardim Botânico do Rio de Janeiro: Rio de Janeiro, Brazil, 2013; pp. 185–186. [Google Scholar]
- Thomas, P. Araucaria angustifolia. The IUCN Red List of Threatened Species 2013: e.T32975A2829141. Available online: https://dx.doi.org/10.2305/IUCN.UK.2013-1.RLTS.T32975A2829141.en (accessed on 2 May 2019).
- Fagan, M.E.; DeFries, R.S.; Sesnie, S.E.; Arroyo-Mora, J.P.; Soto, C.; Singh, A.; Townsend, P.A.; Chazdon, R.L. Mapping species composition of forests and tree plantations in northeastern Costa Rica with an integration of hyperspectral and multitemporal landsat imagery. Remote Sens. 2015, 7, 5660–5696. [Google Scholar] [CrossRef] [Green Version]
- Biswas, S.; Lasko, K.D.; Vadrevu, K.P. Fire Disturbance in Tropical Forests of Myanmar-Analysis Using MODIS Satellite Datasets. IEEE J. Sel. Top. Appl. Earth Obs. Remote Sens. 2015, 8, 2273–2281. [Google Scholar] [CrossRef]
- Batar, A.K.; Watanabe, T.; Kumar, A. Assessment of land-use/land-cover change and forest fragmentation in the Garhwal Himalayan region of India. Environments 2017, 4, 34. [Google Scholar] [CrossRef] [Green Version]
- Woellner, R.; Wagner, T.C. Saving species, time and money: Application of unmanned aerial vehicles (UAVs) for monitoring of an endangered alpine river specialist in a small nature reserve. Biol. Conserv. 2019, 233, 162–175. [Google Scholar] [CrossRef]
- Campbell, M.J.; Dennison, P.E.; Tune, J.W.; Kannenberg, S.A.; Kerr, K.L.; Codding, B.F.; Anderegg, W.R.L. A multi-sensor, multi-scale approach to mapping tree mortality in woodland ecosystems. Remote Sens. Environ. 2020, 245, 111853. [Google Scholar] [CrossRef]
- Getzin, S.; Wiegand, K.; Schöning, I. Assessing biodiversity in forests using very high-resolution images and unmanned aerial vehicles. Methods Ecol. Evol. 2012, 3, 397–404. [Google Scholar] [CrossRef]
- Vadrevu, K.P.; Lasko, K.; Giglio, L.; Schroeder, W.; Biswas, S.; Justice, C. Trends in Vegetation fires in South and Southeast Asian Countries. Sci. Rep. 2019, 9, 1–13. [Google Scholar] [CrossRef]
- Rocchini, D.; Marcantonio, M.; Da Re, D.; Chirici, G.; Galluzzi, M.; Lenoir, J.; Ricotta, C.; Torresani, M.; Ziv, G. Time-lapsing biodiversity: An open source method for measuring diversity changes by remote sensing. Remote Sens. Environ. 2019, 231, 111192. [Google Scholar] [CrossRef] [Green Version]
- Garcia, M.; Ustin, S.L. Detection of interannual vegetation responses to climatic variability using AVIRIS data in a Coastal Savanna in California. IEEE Trans. Geosci. Remote Sens. 2001, 39, 1480–1490. [Google Scholar] [CrossRef]
- Vaglio Laurin, G.; Cheung-Wai Chan, J.; Chen, Q.; Lindsell, J.A.; Coomes, D.A.; Guerriero, L.; Del Frate, F.; Miglietta, F.; Valentini, R. Biodiversity mapping in a tropical West African forest with airborne hyperspectral data. PLoS ONE 2014, 9, e97910. [Google Scholar] [CrossRef]
- Arellano, P.; Tansey, K.; Balzter, H.; Boyd, D.S. Detecting the effects of hydrocarbon pollution in the Amazon forest using hyperspectral satellite images. Environ. Pollut. 2015, 205, 225–239. [Google Scholar] [CrossRef] [PubMed]
- Guo, X.; Coops, N.C.; Tompalski, P.; Nielsen, S.E.; Bater, C.W.; John Stadt, J. Regional mapping of vegetation structure for biodiversity monitoring using airborne lidar data. Ecol. Inform. 2017, 38, 50–61. [Google Scholar] [CrossRef]
- Clark, M.L.; Buck-Diaz, J.; Evens, J. Mapping of forest alliances with simulated multi-seasonal hyperspectral satellite imagery. Remote Sens. Environ. 2018, 210, 490–507. [Google Scholar] [CrossRef]
- Abileah, R. High-resolution imagery applications in the littorals. Sens. Syst. Next-Gener. Satell. V 2001, 4540, 630. [Google Scholar] [CrossRef]
- Waring, R.H.; Coops, N.C.; Ohmann, J.L.; Sarr, D.A. Interpreting Woody Plant Richness from Seasonal Ratios of Photosynthesis. Ecology 2002, 83, 2964. [Google Scholar] [CrossRef]
- Simard, M.; Pinto, N.; Fisher, J.B.; Baccini, A. Mapping forest canopy height globally with spaceborne lidar. J. Geophys. Res. Biogeosci. 2011, 116, 1–12. [Google Scholar] [CrossRef] [Green Version]
- Debastiani, A.B.; Sanquetta, C.R.; Corte, A.P.D.; Rex, F.E.; Pinto, N.S. Evaluating SAR-optical sensor fusion for aboveground biomass estimation in a Brazilian tropical forest. Ann. For. Res. 2019, 62, 109–122. [Google Scholar] [CrossRef]
- Pinto, N.; Keitt, T.H.; Wainright, M. LORACS: JAVA software for modeling landscape connectivity and matrix permeability. Ecography 2012, 35, 388–392. [Google Scholar] [CrossRef]
- Tassi, A.; Gigante, D.; Modica, G.; Di Martino, L.; Vizzari, M. Pixel-vs. Object-based landsat 8 data classification in google earth engine using random forest: The case study of maiella national park. Remote Sens. 2021, 13, 2299. [Google Scholar] [CrossRef]
- Noi Phan, T.; Kuch, V.; Lehnert, L.W. Land cover classification using google earth engine and random forest classifier-the role of image composition. Remote Sens. 2020, 12, 2411. [Google Scholar] [CrossRef]
- Vasconcellos, B.N. Estimativa de Variáveis Dendrométricas Individuais de Araucaria angustifolia por Meio de dados Laser Scanner Aéreo e Terrestre; UFPR—Thesis; Universidade Federal do Paraná—Brazil; 1–185. 2020. Available online: https://acervodigital.ufpr.br/bitstream/handle/1884/70292/R%20-%20T%20-%20BRUNA%20NASCIMENTO%20DE%20VASCONCELLOS.pdf?sequence=1&isAllowed=y (accessed on 13 November 2021).
- ESRI ArcGIS Desktop: Release 10; ESRI: Redlands, CA, USA, 2011.
- Novack, T.; Esch, T.; Kux, H.; Stilla, U. Machine learning comparison between WorldView-2 and QuickBird-2-simulated imagery regarding object-based urban land cover classification. Remote Sens. 2011, 3, 2263–2282. [Google Scholar] [CrossRef] [Green Version]
- Github Statistical Machine Intelligence and Learning Engine (SMILE). Available online: https://haifengl.github.io/classification.html#random-forest (accessed on 18 February 2021).
- Breiman, L. Random Forests. Int. J. Adv. Comput. Sci. Appl. 2016, 7, 1–33. [Google Scholar] [CrossRef]
- Fox, E.W.; Hill, R.A.; Leibowitz, S.G.; Olsen, A.R.; Thornbrugh, D.J.; Weber, M.H. Assessing the accuracy and stability of variable selection methods for random forest modeling in ecology. Environ. Monit. Assess. 2017, 189, 316. [Google Scholar] [CrossRef]
- Breiman, L. Statistical modeling: The two cultures. Stat. Sci. 2001, 16, 199–215. [Google Scholar] [CrossRef]
- Jagadeesan, S.; Chaturvedi, A.; Kumar, S. URL Phishing Analysis using Random Forest. Int. J. Pure Appl. Math. 2018, 118, 4159–4163. [Google Scholar]
- Montealegre, A.L.; Lamelas, M.T.; De La Riva, J. A Comparison of Open-Source LiDAR Filtering Algorithms in a Mediterranean Forest Environment. IEEE J. Sel. Top. Appl. Earth Obs. Remote Sens. 2015, 8, 4072–4085. [Google Scholar] [CrossRef] [Green Version]
- R Core Team. R: A Language and Environment for Statistical Computing. R Foundation for Statistical Computing: Vienna, Austria. Available online: https://www.R-project.org/ (accessed on 18 November 2021).
- Meyer, F.; Beucher, S. Morphological segmentation. J. Vis. Commun. Image Represent. 1990, 1, 21–46. [Google Scholar] [CrossRef]
- Plowright, A. Canopy Analysis in R Using Forest Tools. Available online: https://cran.r-project.org/web/packages/ForestTools/vignettes/treetop_analysis.html (accessed on 18 November 2021).
- Liaw, A.; Wiener, M. Classification and Regression by randomForest. R News 2002, 2, 18–22. [Google Scholar]
- Klein, D.R. Morfometria e Crescimento Diamétrico de Araucaria Angustifolia (bertol.) Kuntze no Planalto Sul Catarinense; UFPR: Curitiba, PR, Brazil, 2017. [Google Scholar]
- Yang, X.; Rochdi, N.; Zhang, J.; Banting, J.; Rolfson, D.; King, C.; Staenz, K.; Patterson, S.; Purdy, B. Mapping tree species in a boreal forest area using RapidEye and LiDAR data. In Proceedings of the 2014 IEEE Geoscience and Remote Sensing Symposium, Quebec City, QC, Canada, 13–18 July 2014; Volume 14, pp. 69–71. [Google Scholar] [CrossRef]
- Adamczyk, J.; Osberger, A. Red-edge vegetation indices for detecting and assessing disturbances in Norway spruce dominated mountain forests. Int. J. Appl. Earth Obs. Geoinf. 2015, 37, 90–99. [Google Scholar] [CrossRef]
- Niemi, M.T.; Vauhkonen, J. Extracting canopy surface texture from airborne laser scanning data for the supervised and unsupervised prediction of area-based forest characteristics. Remote Sens. 2016, 8, 582. [Google Scholar] [CrossRef] [Green Version]
- Immitzer, M.; Atzberger, C.; Koukal, T. Tree species classification with Random forest using very high spatial resolution 8-band worldView-2 satellite data. Remote Sens. 2012, 4, 2661–2693. [Google Scholar] [CrossRef] [Green Version]
- Van Thinh, T.; Duong, P.C.; Nasahara, K.N.; Tadono, T. How does land use/land cover map’s accuracy depend on number of classification classes? Sci. Online Lett. Atmos. 2019, 15, 28–31. [Google Scholar] [CrossRef] [Green Version]
- Gessner, U.; Machwitz, M.; Esch, T.; Tillack, A.; Naeimi, V.; Kuenzer, C.; Dech, S. Multi-sensor mapping of West African land cover using MODIS, ASAR and TanDEM-X/TerraSAR-X data. Remote Sens. Environ. 2015, 164, 282–297. [Google Scholar] [CrossRef]
- Croft, H.; Chen, J.M.; Zhang, Y.; Simic, A. Modelling leaf chlorophyll content in broadleaf and needle leaf canopies from ground, CASI, Landsat TM 5 and MERIS reflectance data. Remote Sens. Environ. 2013, 133, 128–140. [Google Scholar] [CrossRef]
- Hall, F.G.; Huemmrich, K.F.; Strebel, D.E.; Goetz, S.J.; Nickeson, J.E.; Woods, K.E. Biophysical, morphological, canopy optical property, and productivity data from the superior national forest. In NASA Technical Memorandum 104568; NASA: Greenbelt, MD, USA, 1992. [Google Scholar]
- Roberts, D.A.; Ustin, S.L.; Ogunjemiyo, S.; Greenberg, J.; Bobrowski, S.Z.; Chen, J.; Hinckley, T.M. Spectral and structural measures of northwest forest vegetation at leaf to landscape scales. Ecosystems 2004, 7, 545–562. [Google Scholar] [CrossRef]
- Franklin, J. The Elements of Statistical Learning: Data Mining, Inference, and Prediction; Springer: New York, NY, USA, 2009. [Google Scholar]
- Mascaro, J.; Asner, G.P.; Knapp, D.E.; Kennedy-Bowdoin, T.; Martin, R.E.; Anderson, C.; Higgins, M.; Chadwick, K.D. A tale of two “Forests”: Random Forest machine learning aids tropical Forest carbon mapping. PLoS ONE 2014, 9, 12–16. [Google Scholar] [CrossRef]
- Belgiu, M.; Drăgu, L. Random forest in remote sensing: A review of applications and future directions. ISPRS J. Photogramm. Remote Sens. 2016, 114, 24–31. [Google Scholar] [CrossRef]
- Pesck, V.A.; Stepka, T.F.; dos Santos Lisboa, G.; de Jesus França, L.C.; Cerqueira, C.L. Delineamento de copas de Araucaria angustifolia utilizando lógica Fuzzy em imagens Quickbird II. Adv. For. Sci. 2018, 5, 385–390. [Google Scholar]
- Bakx, T.R.M.; Koma, Z.; Seijmonsbergen, A.C.; Kissling, W.D. Use and categorization of light detection and ranging vegetation metrics in avian diversity and species distribution research. Divers. Distrib. 2019, 25, 1045–1059. [Google Scholar] [CrossRef] [Green Version]
- Dubayah, R.; Blair, J.B.; Goetz, S.; Fatoyinbo, L.; Hansen, M.; Healey, S.; Hofton, M.; Hurtt, G.; Kellner, J.; Luthcke, S.; et al. The Global Ecosystem Dynamics Investigation: High-resolution laser ranging of the Earth’s forests and topography. Sci. Remote Sens. 2020, 1, 100002. [Google Scholar] [CrossRef]
- Guirado, E.; Tabik, S.; Alcaraz-Segura, D.; Cabello, J.; Herrera, F. Deep-learning Versus OBIA for scattered shrub detection with Google Earth Imagery: Ziziphus lotus as case study. Remote Sens. 2017, 9, 1220. [Google Scholar] [CrossRef] [Green Version]
- Weinstein, B.G.; Marconi, S.; Bohlman, S.; Zare, A.; White, E. Individual tree-crown detection in rgb imagery using semi-supervised deep learning neural networks. Remote Sens. 2019, 11, 1309. [Google Scholar] [CrossRef] [Green Version]


| Site | Location | Area (ha) | Worldview-2 | UAV-LiDAR |
|---|---|---|---|---|
| Canguiri Farm | Quatro Barras | 103.79 ha | Available | Not available |
| Capão do Tigre | Curitiba | 4.45 ha | Available | Available |
| Gralha-Azul Farm | Fazenda Rio Grande | 571.00 ha | Available | Not available |
| Abbreviation | Feature 1 |
|---|---|
| b1 | Worldview-2 Coastal Band |
| b2 | Worldview-2 Blue Band |
| b3 | Worldview-2 Green Band |
| b4 | Worldview-2 Yellow Band |
| b5 | Worldview-2 Red Band |
| b6 | Worldview-2 Red Edge Band |
| b7 | Worldview-2 Near Infrared Band 1 |
| b8 | Worldview-2 Near Infrared Band 2 |
| asm | Angular Second Moment |
| contrast | Contrast |
| corr | Correlation |
| svar | Sum of Squares: Variance |
| idm | Inverse Difference Moment |
| savg | Sum Average |
| var | Sum Variance |
| sent | Sum Entropy |
| ent | Entropy |
| dvar | Difference Variance |
| dent | Difference Entropy |
| imcorr1 | Information Measures of Correlation 1 |
| Imcorr2 | Information Measures of Correlation 2 |
| maxcorr | Maximal Correlation Coefficient |
| diss | Dissimilarity |
| inertia | Inertia |
| prom | Prominence |
| shade | Shade |
| Sites | Threshold Value | Variables 1 and Importance Values | Accuracy (%) |
|---|---|---|---|
| Canguiri Farm | 9.98 | b5_ent (10.85), b3_dvar (10.17), b2_svar (9.98) | 93. 69 |
| Capão do Tigre | 8.94 | b7_savg (11.30), b6 (9.12), b8 (9.03), b2_var (8.94) | 97.14 |
| Gralha-Azul Farm | 8.96 | b7_shade (10.33), b1_savg (9.37), b6_savg (9.09), b6_dvar (9.05), b2_shade (8.96) | 97.63 |
| Sites | Total Forest (ha) | A. angustifolia (ha) | No. of A. angustifolia | A. angustifolia Density (trees/ha) |
|---|---|---|---|---|
| Canguiri Farm | 103.79 | 33.78 (32.55%) | 3668 | 35.34 |
| Capão do Tigre | 4.45 | 2.52 (56.49%) | 280 | 62.92 |
| Gralha-Azul Farm | 571.00 | 87.65 (15.35%) | 9570 | 16.76 |
| Classified Data | ||||||
|---|---|---|---|---|---|---|
| Study Area | Araucaria | Non-Araucaria | Total | Commission Error (%) | ||
| Reference Data | Gralha-Azul Farm | Araucaria | 1901 | 196 | 2097 | 9 |
| Non-Araucaria | 129 | 2926 | 3055 | 4 | ||
| Total | 2030 | 3122 | 5152 | |||
| Omission error (%) | 6 | 6 | ||||
| Canguiri Farm | Araucaria | 407 | 11 | 418 | 2 | |
| Non-Araucaria | 12 | 340 | 352 | 3 | ||
| Total | 419 | 351 | 764 | |||
| Omission error (%) | 2 | 3 | ||||
| Capão do Tigre | Araucaria | 979 | 17 | 996 | 1 | |
| Non-Araucaria | 12 | 132 | 144 | 8 | ||
| Total | 991 | 149 | 1140 | |||
| Omission error (%) | 1 | 11 | ||||
| Classified Data | |||||
|---|---|---|---|---|---|
| Nº of A. angustifolia | Nº of Other Species | Total | Commission Error (%) | ||
| Reference Data | Nº of A. angustifolia | 315 | 142 | 457 | 31 |
| Nº of Other Species | 20 | 954 | 974 | 2 | |
| Total | 335 | 1096 | |||
| Omission Error (%) | 6 | 13 | |||
Publisher’s Note: MDPI stays neutral with regard to jurisdictional claims in published maps and institutional affiliations. |
© 2021 by the authors. Licensee MDPI, Basel, Switzerland. This article is an open access article distributed under the terms and conditions of the Creative Commons Attribution (CC BY) license (https://creativecommons.org/licenses/by/4.0/).
Share and Cite
Saad, F.; Biswas, S.; Huang, Q.; Corte, A.P.D.; Coraiola, M.; Macey, S.; Carlucci, M.B.; Leimgruber, P. Detectability of the Critically Endangered Araucaria angustifolia Tree Using Worldview-2 Images, Google Earth Engine and UAV-LiDAR. Land 2021, 10, 1316. https://doi.org/10.3390/land10121316
Saad F, Biswas S, Huang Q, Corte APD, Coraiola M, Macey S, Carlucci MB, Leimgruber P. Detectability of the Critically Endangered Araucaria angustifolia Tree Using Worldview-2 Images, Google Earth Engine and UAV-LiDAR. Land. 2021; 10(12):1316. https://doi.org/10.3390/land10121316
Chicago/Turabian StyleSaad, Felipe, Sumalika Biswas, Qiongyu Huang, Ana Paula Dalla Corte, Márcio Coraiola, Sarah Macey, Marcos Bergmann Carlucci, and Peter Leimgruber. 2021. "Detectability of the Critically Endangered Araucaria angustifolia Tree Using Worldview-2 Images, Google Earth Engine and UAV-LiDAR" Land 10, no. 12: 1316. https://doi.org/10.3390/land10121316
APA StyleSaad, F., Biswas, S., Huang, Q., Corte, A. P. D., Coraiola, M., Macey, S., Carlucci, M. B., & Leimgruber, P. (2021). Detectability of the Critically Endangered Araucaria angustifolia Tree Using Worldview-2 Images, Google Earth Engine and UAV-LiDAR. Land, 10(12), 1316. https://doi.org/10.3390/land10121316