
Incorporating Multi-Modal Travel Planning into an Agent-Based Model: A Case Study at the Train Station Kellinghusenstraße in Hamburg

 ,
,  , ,
, , 
Abstract
:1. Introduction
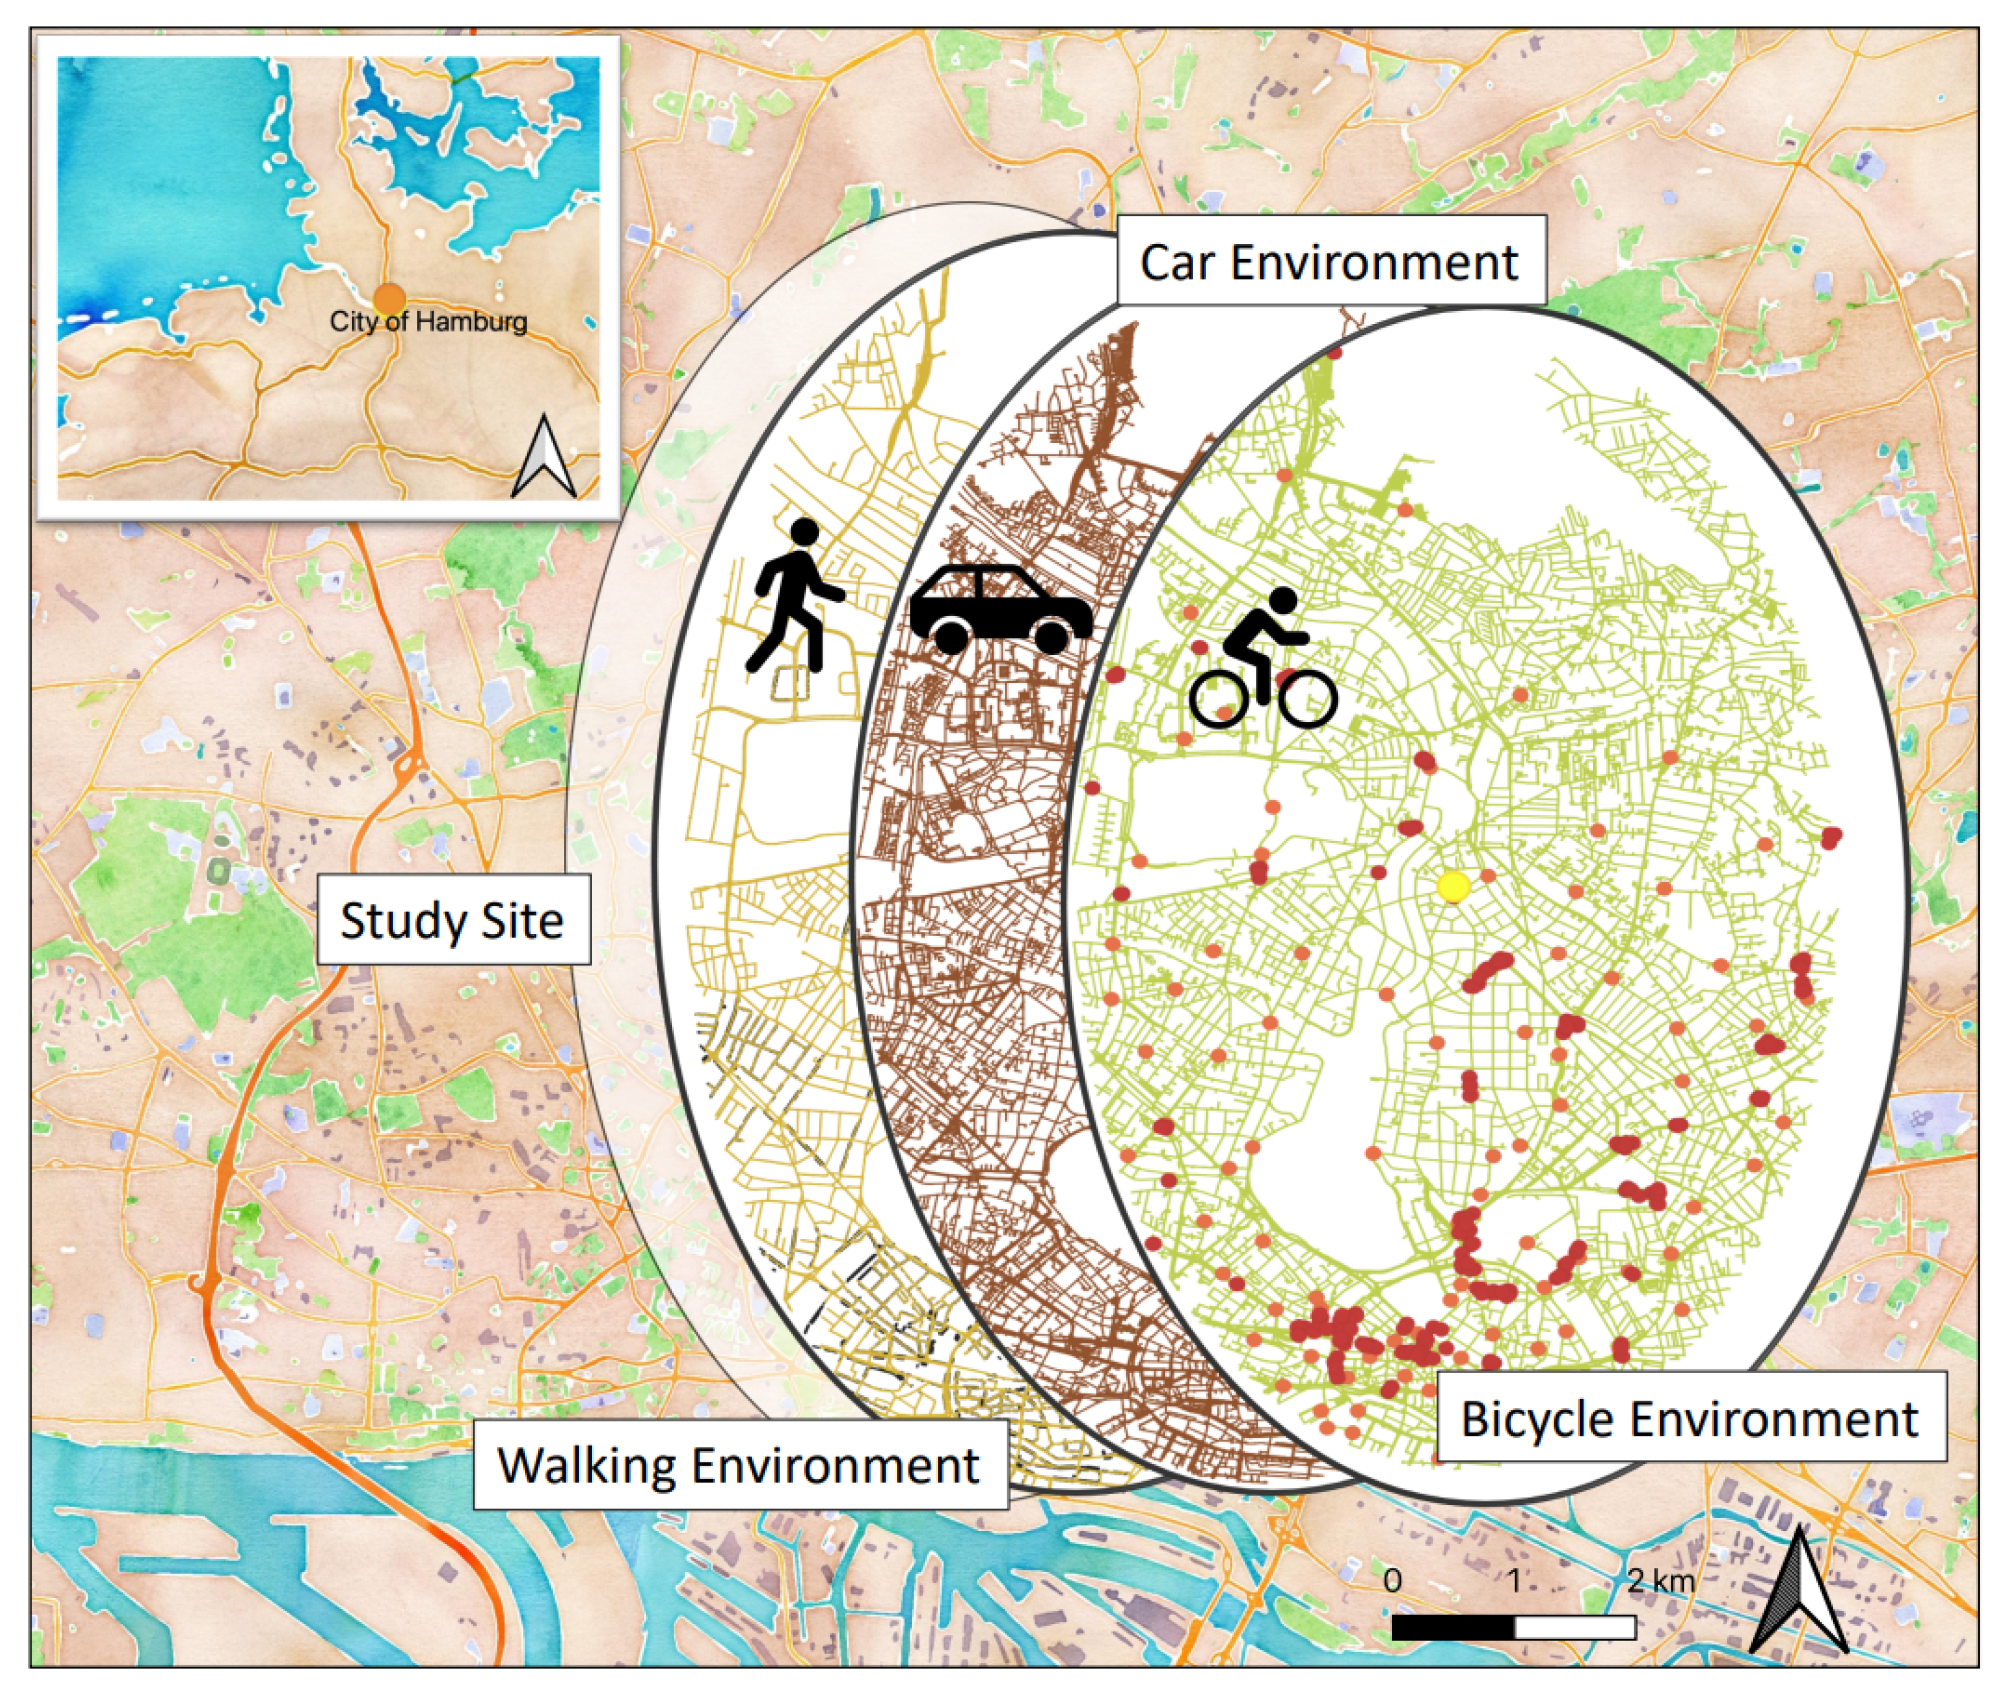
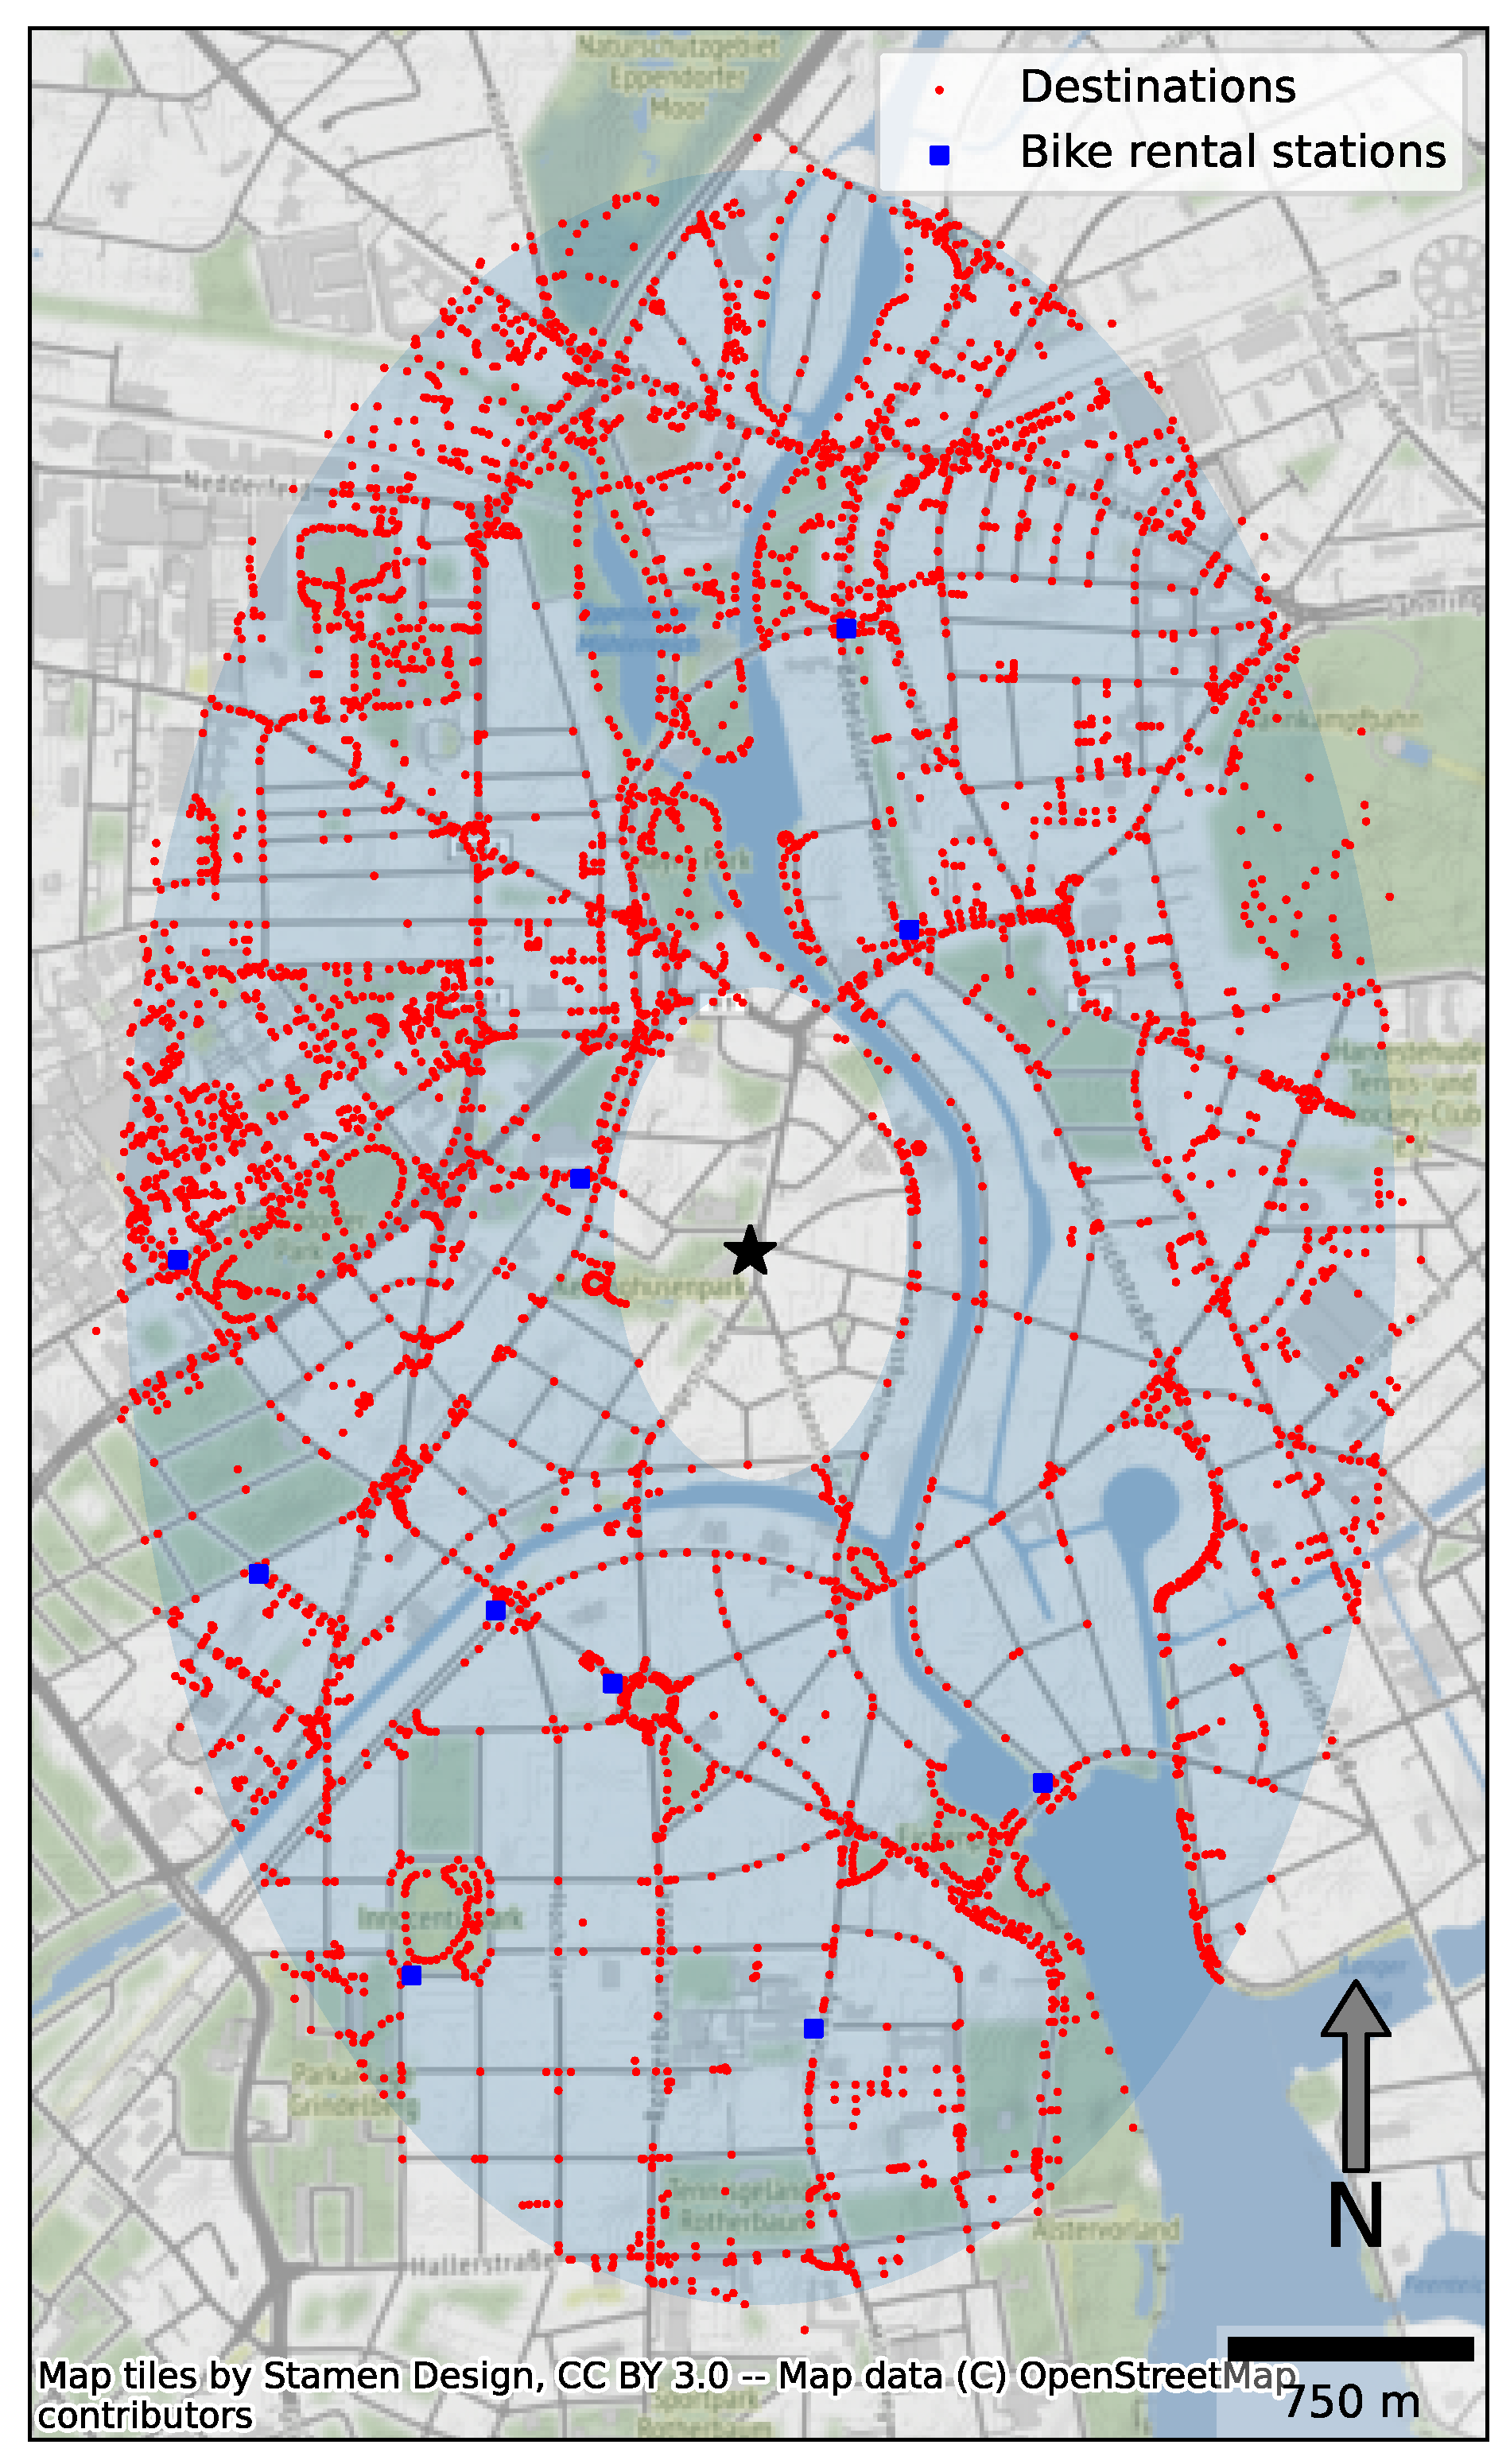
2. Study Site
3. Methodology
3.1. Multi-Agent Simulation
3.2. Simulation System
3.3. Model Realization
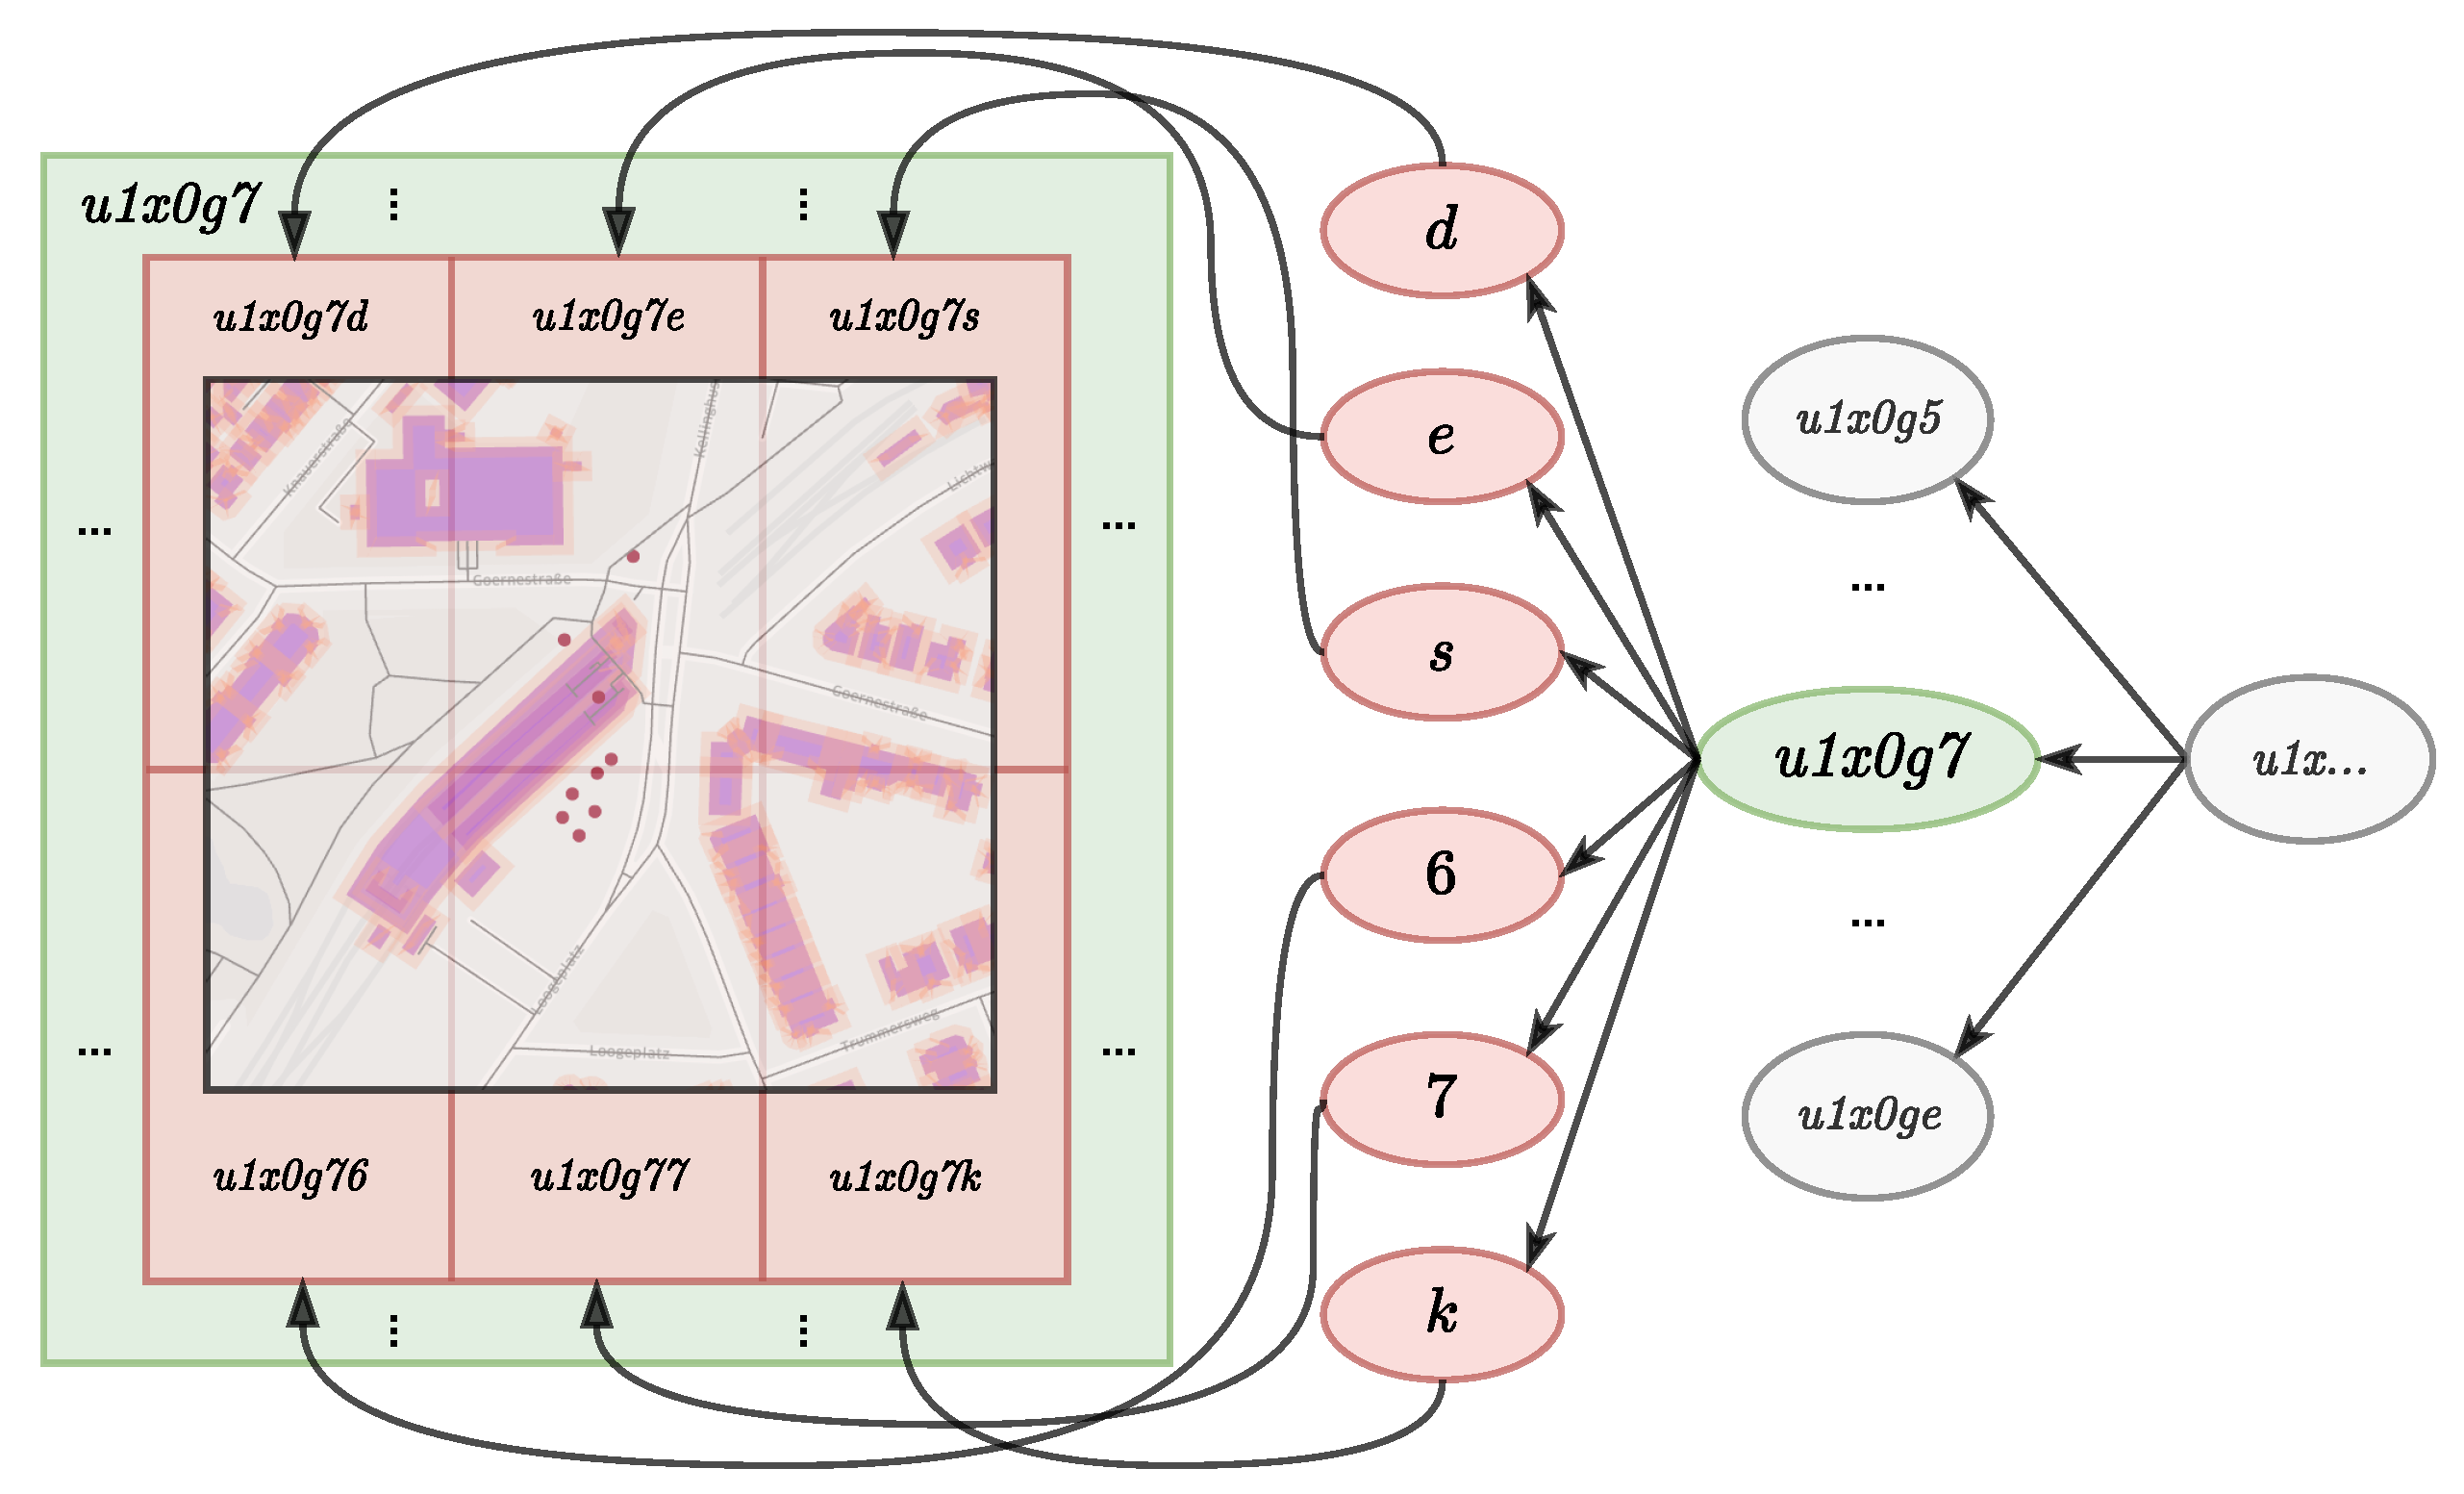
3.3.1. Environment Representation
- Multiple LINESTRING networks to map exact paths in the urban area on which agents may move;
- POINT bicycle rental stations to select a Shared Bike from the available capacity;
- POINT B&R stations to map individual parking spaces for Own Bikes;
- POLYGON buildings to map building cross-section areas. Each cross-sectional area has perimeter areas representing individual pedestrian and bicycle paths and parking spaces;
- POLYGON parking bays to map available vehicle parking spaces for Shared Cars and Own Cars.
3.3.2. Environment Operations
- Point-Location Queries for a set of data objects that intersect with the given coordinate;
- Window-Queries (WQ) to retrieve a set of data objects within the extent of a bounding box given by a lower-left and upper-right coordinate. Data objects which intersect with the box, that is, their supporting coordinates are within the box, are returned;
- Distance-Range Queries providing circle queries in which a WQ is combined with a given radius, building a circle around a source point;
- Constrained K-Nearest-Neighbor (CK-NN) queries of k elements that are the most similar or closest objects in space over the given distance function of the vector-layer and applicable for a given predicate optionally.
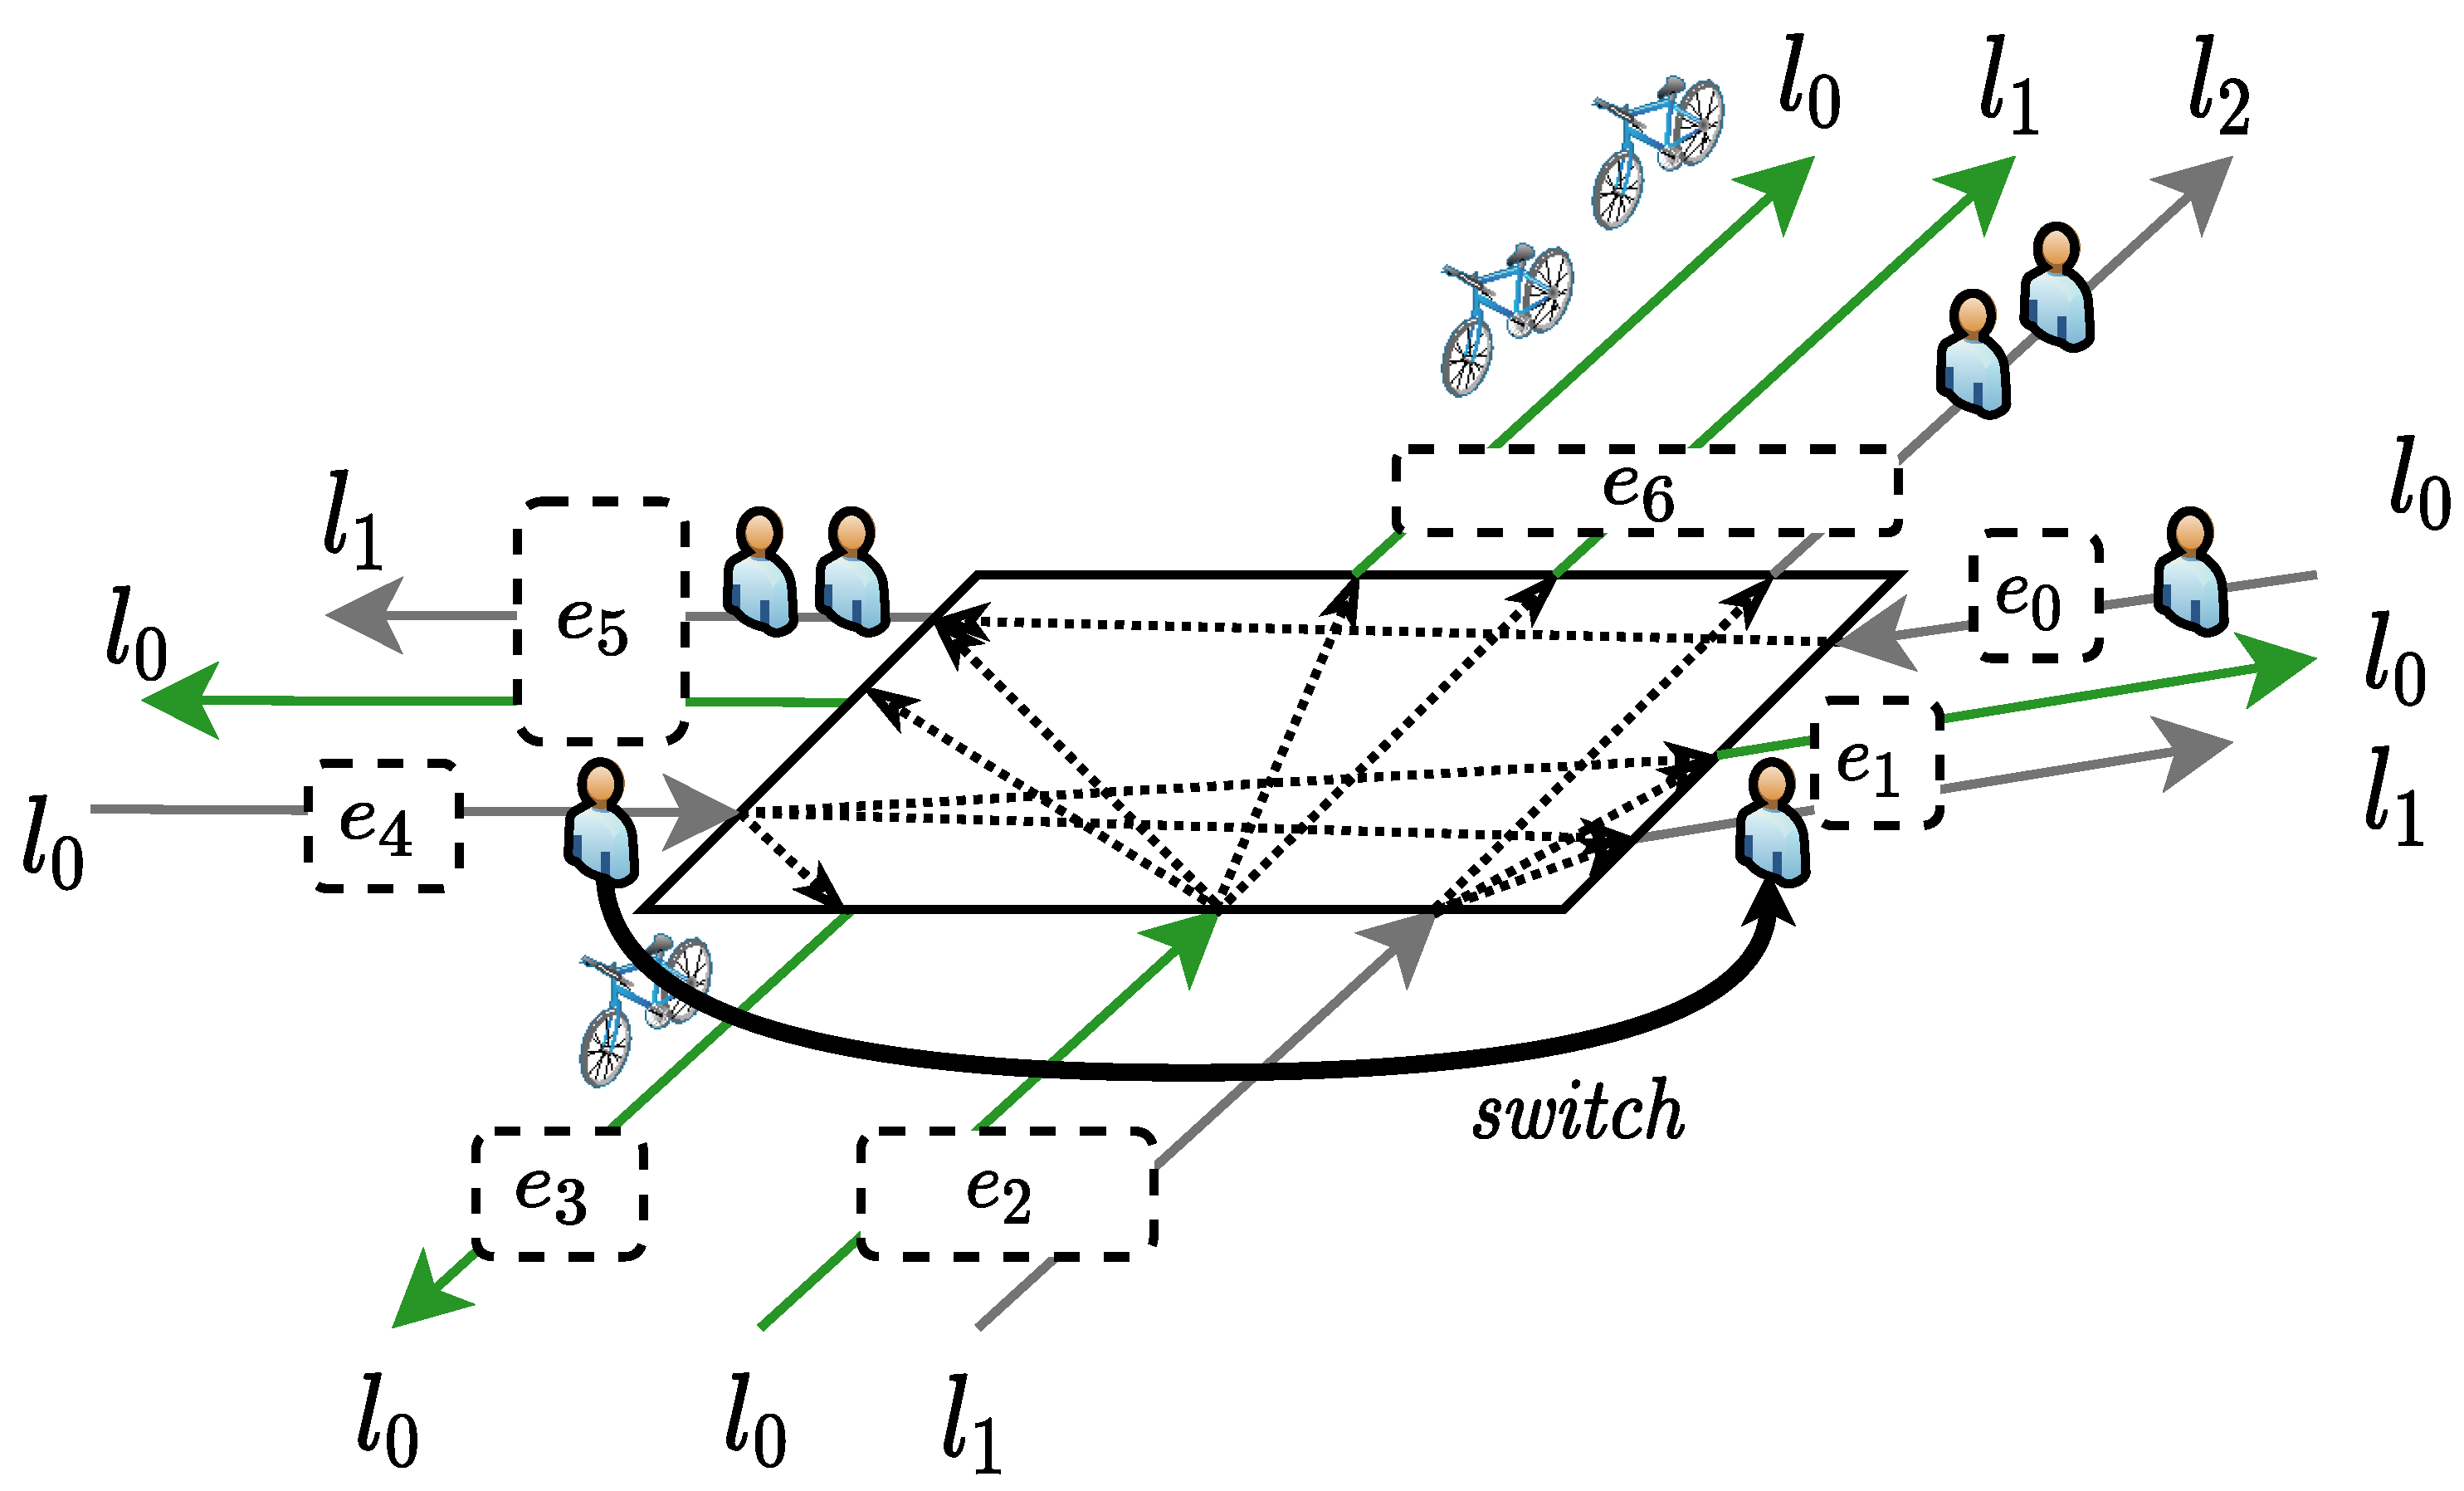
3.3.3. Event Scheduling
3.3.4. Agent Movement
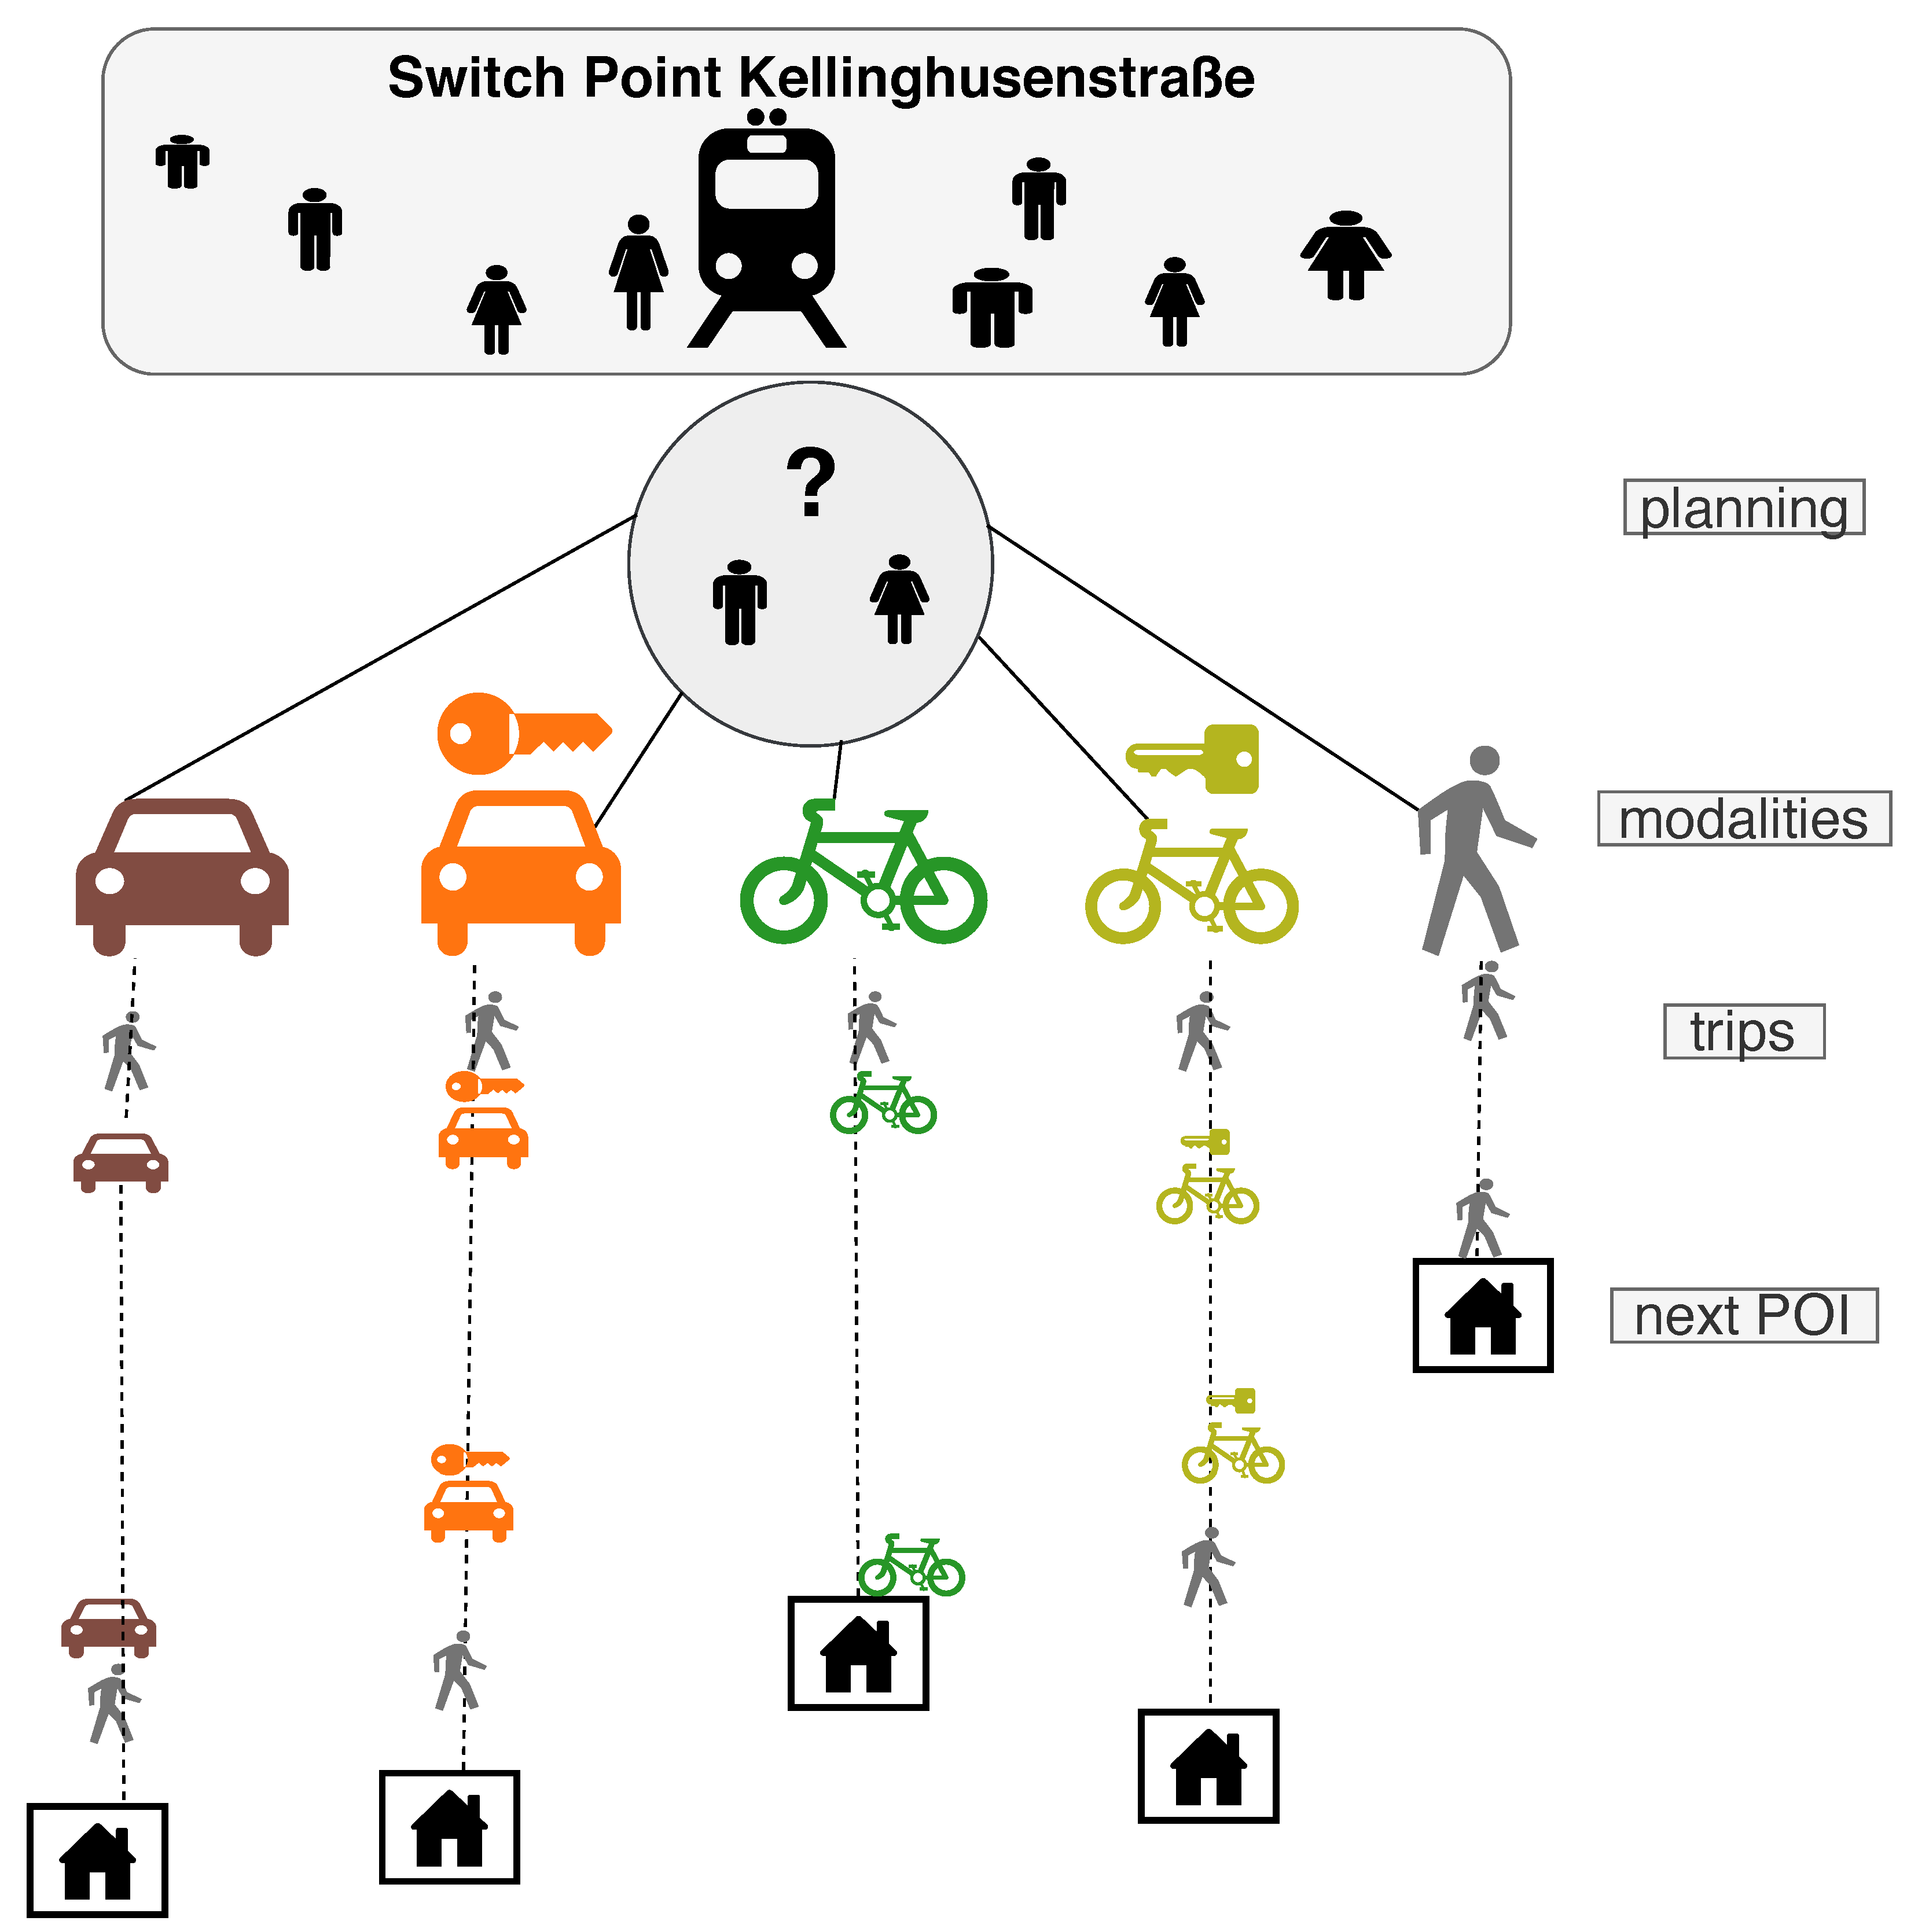
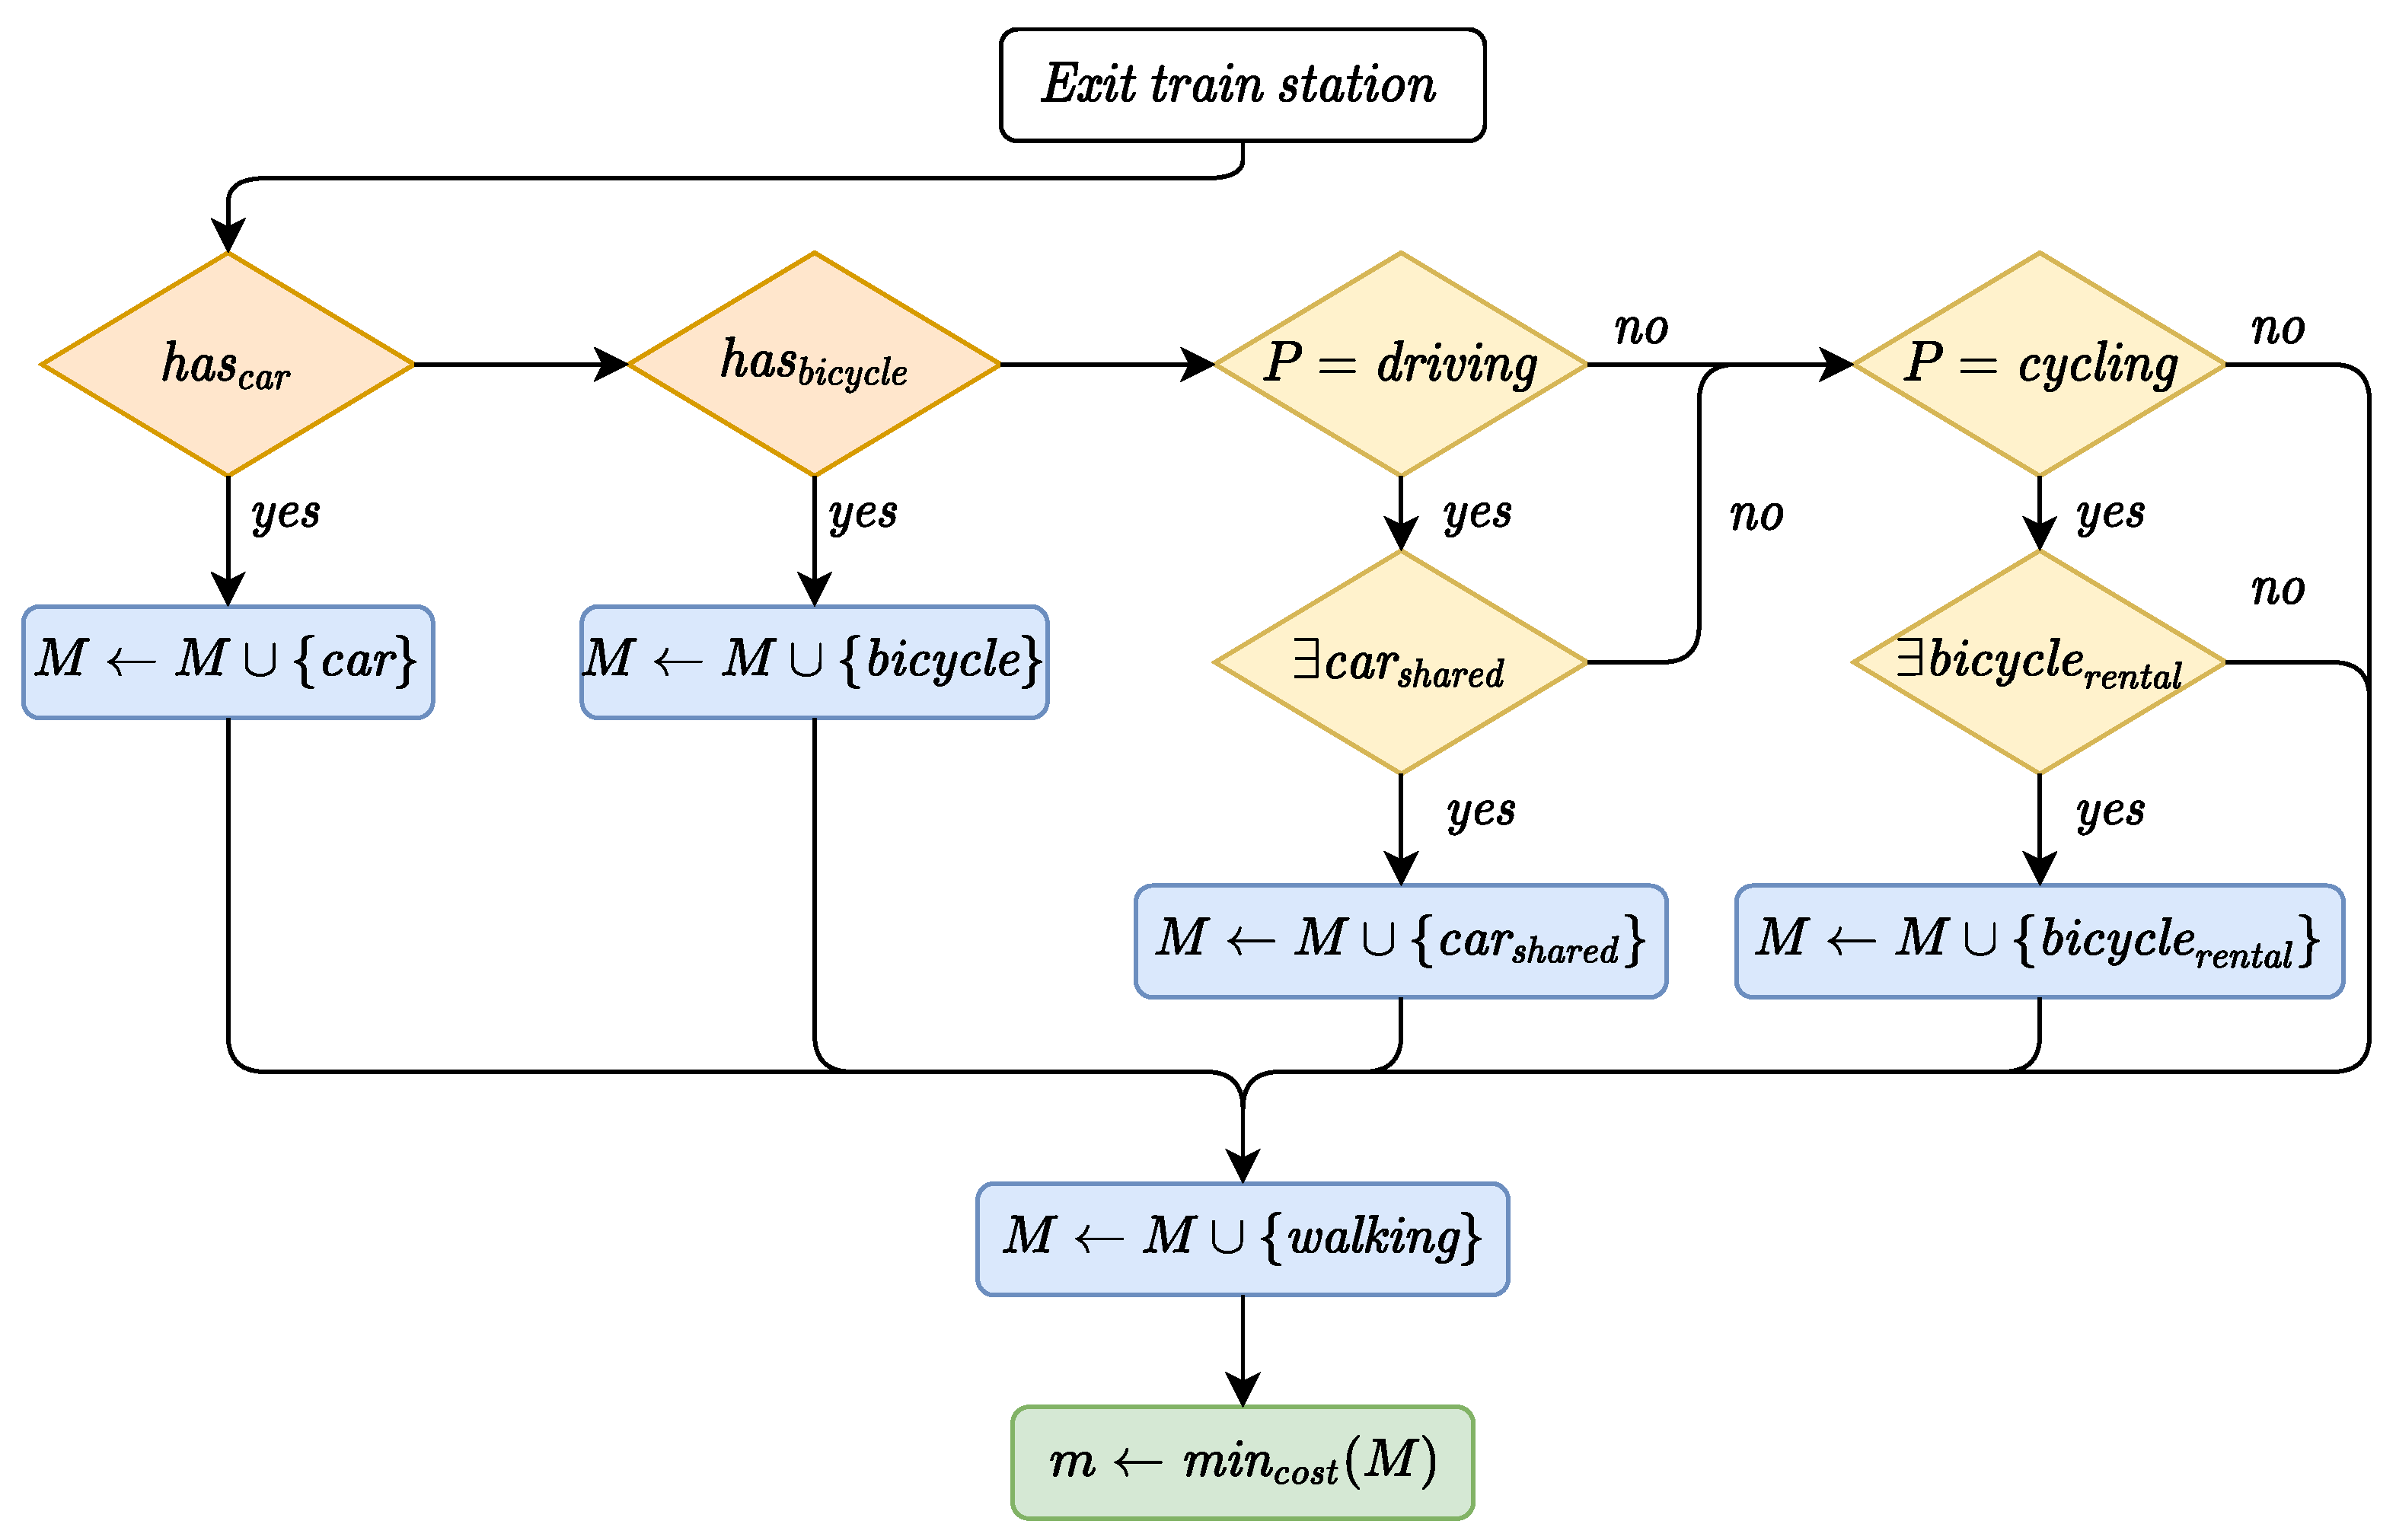
3.4. Planning Algorithm
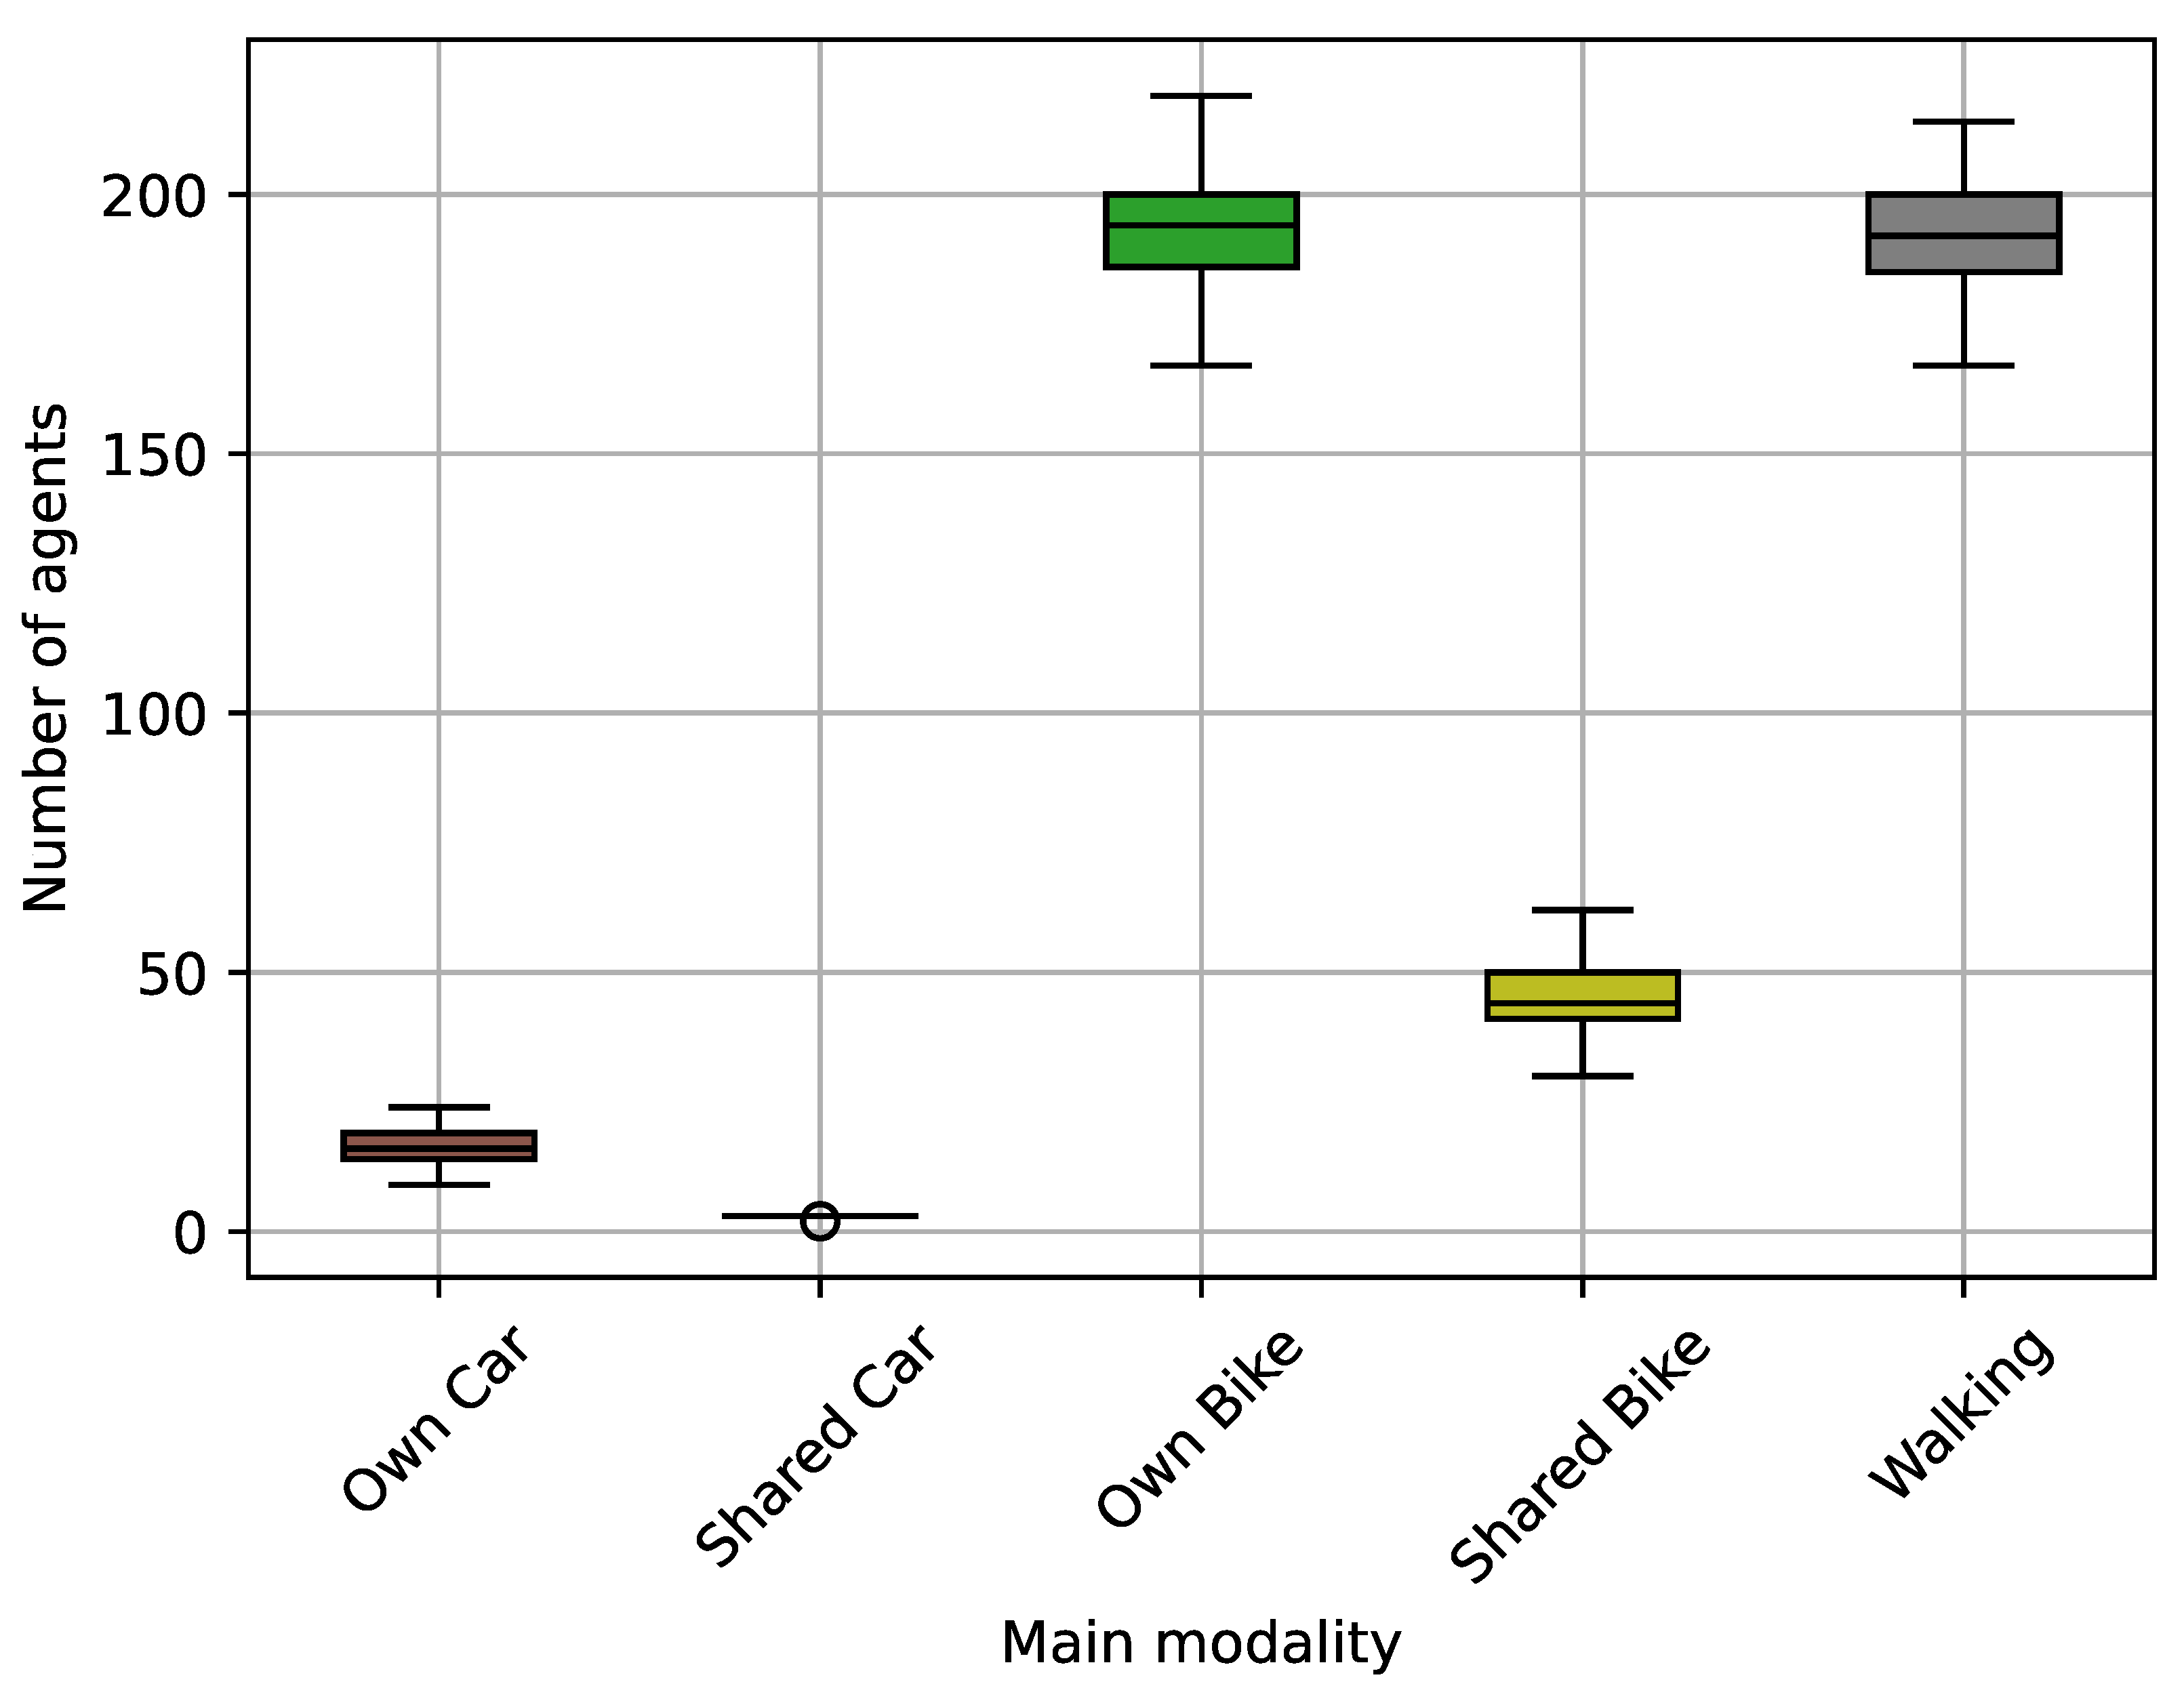
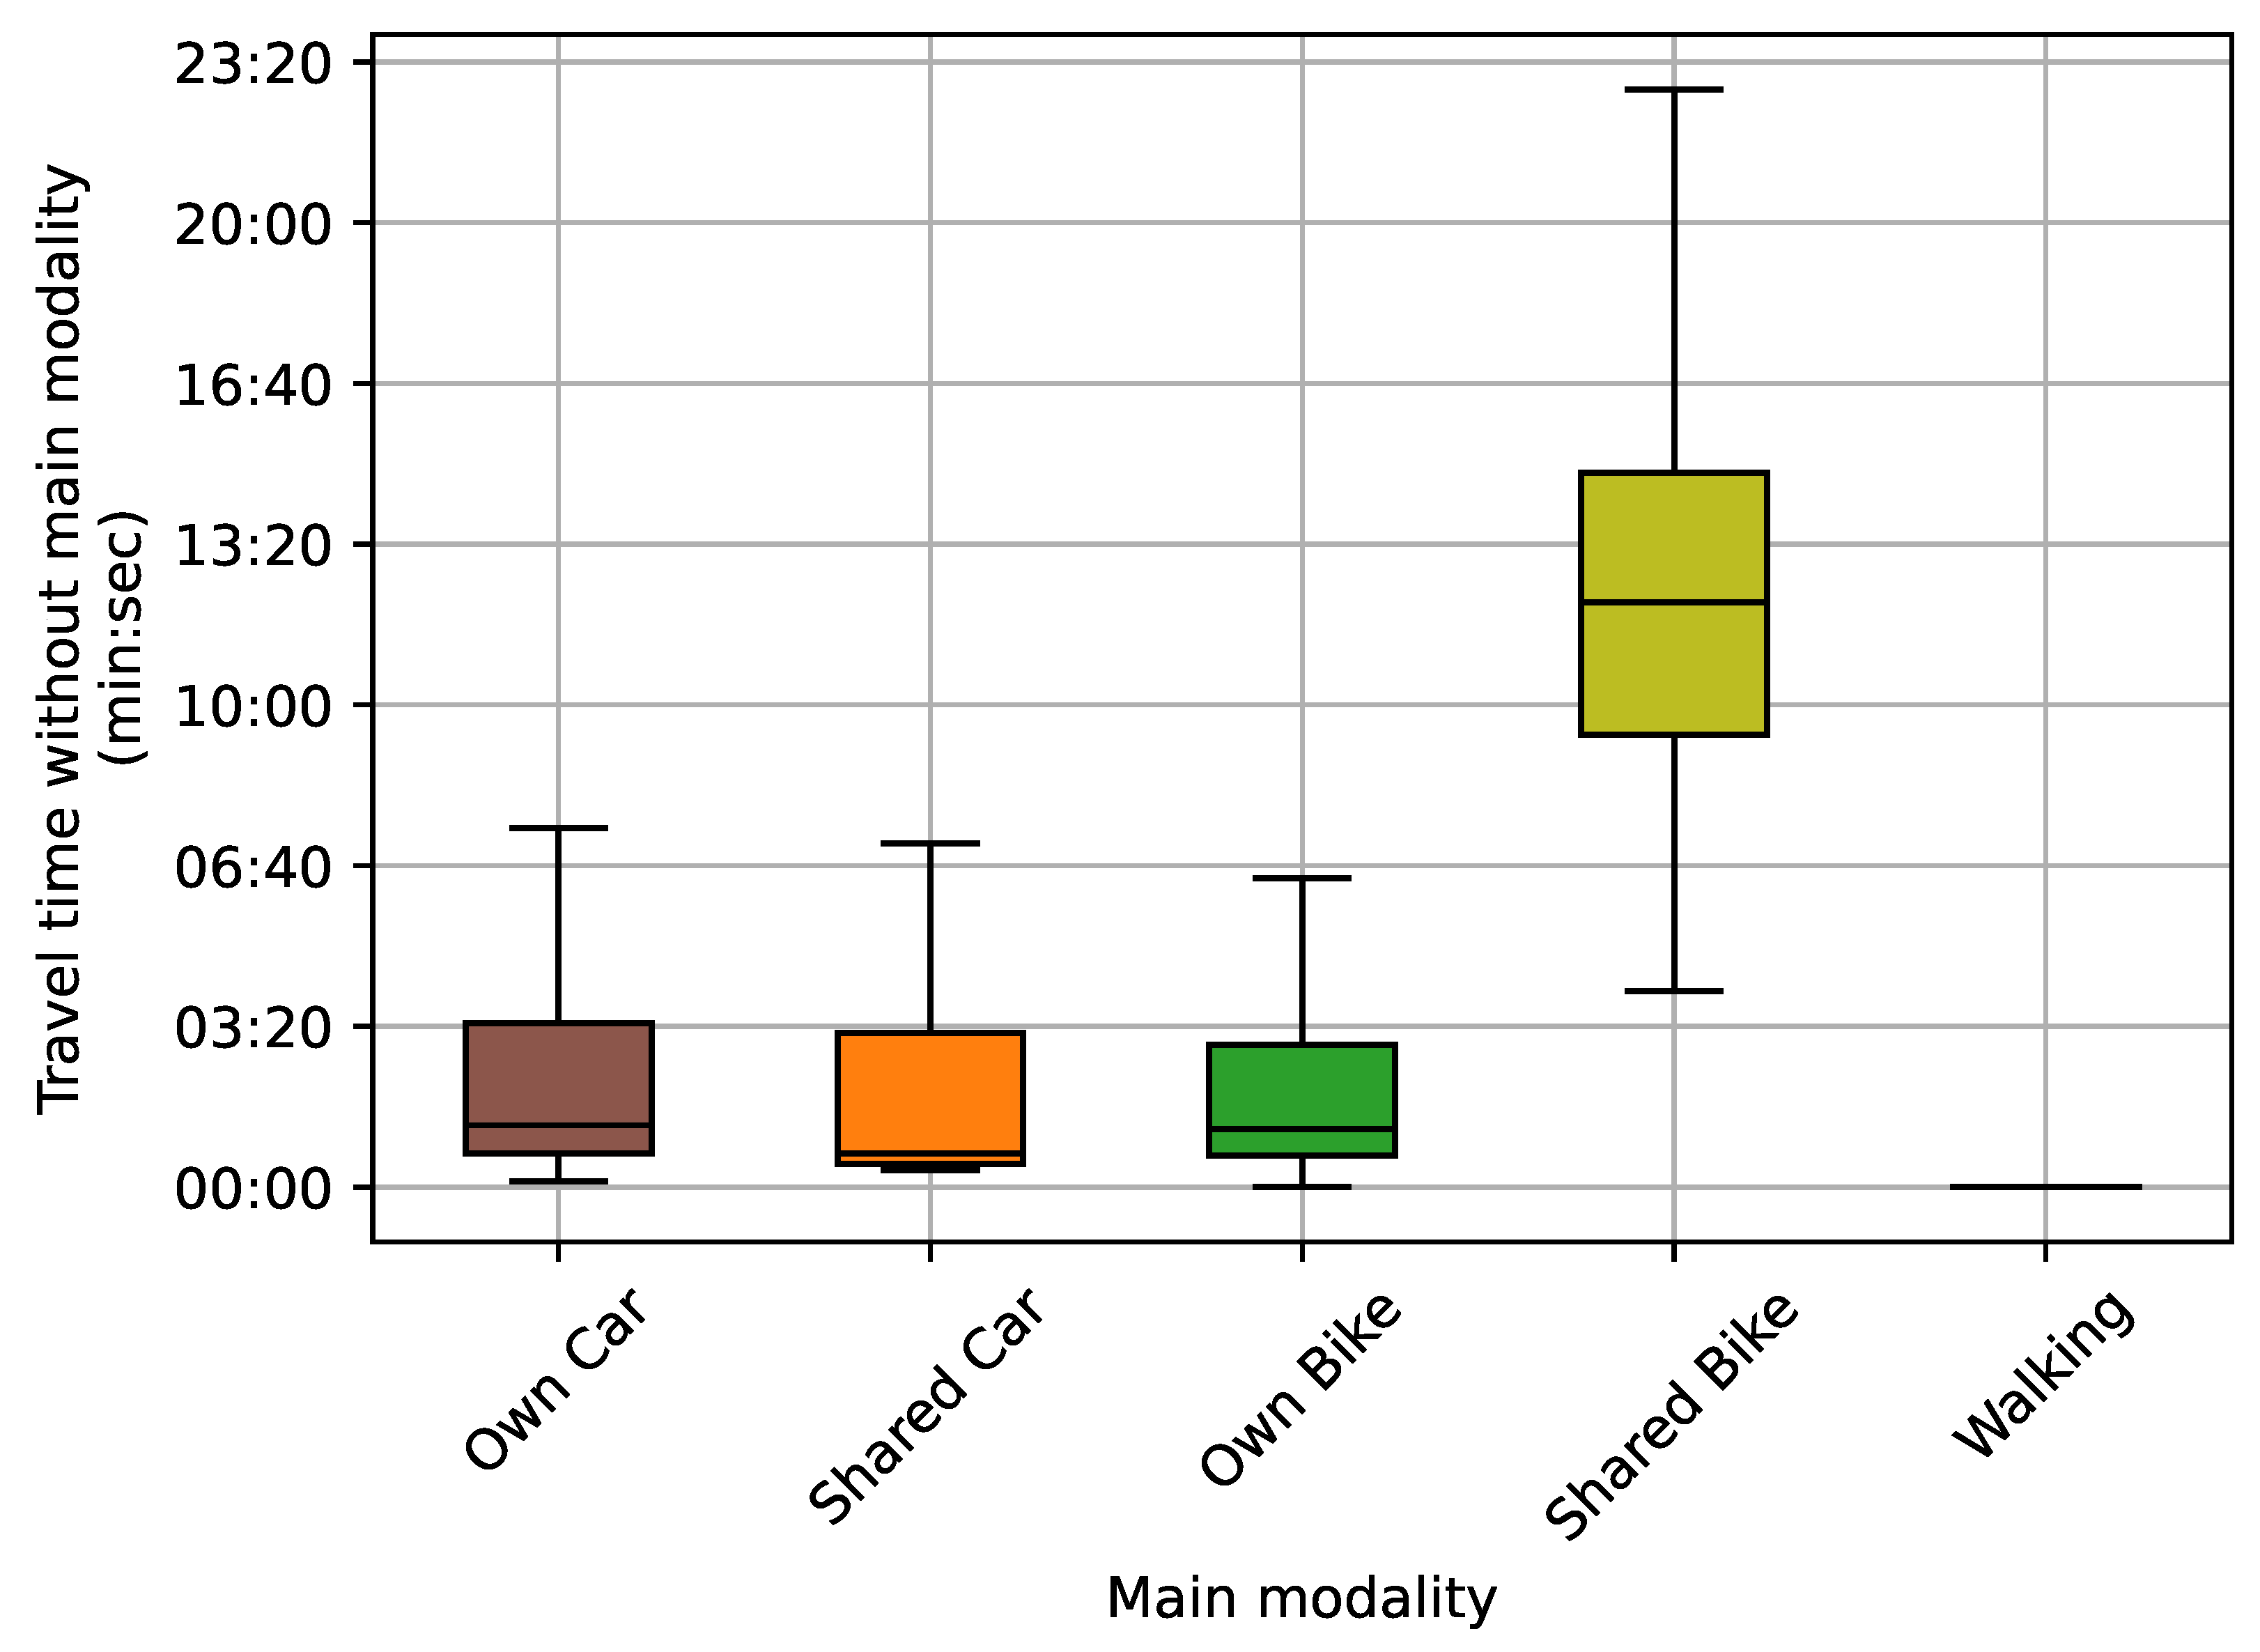
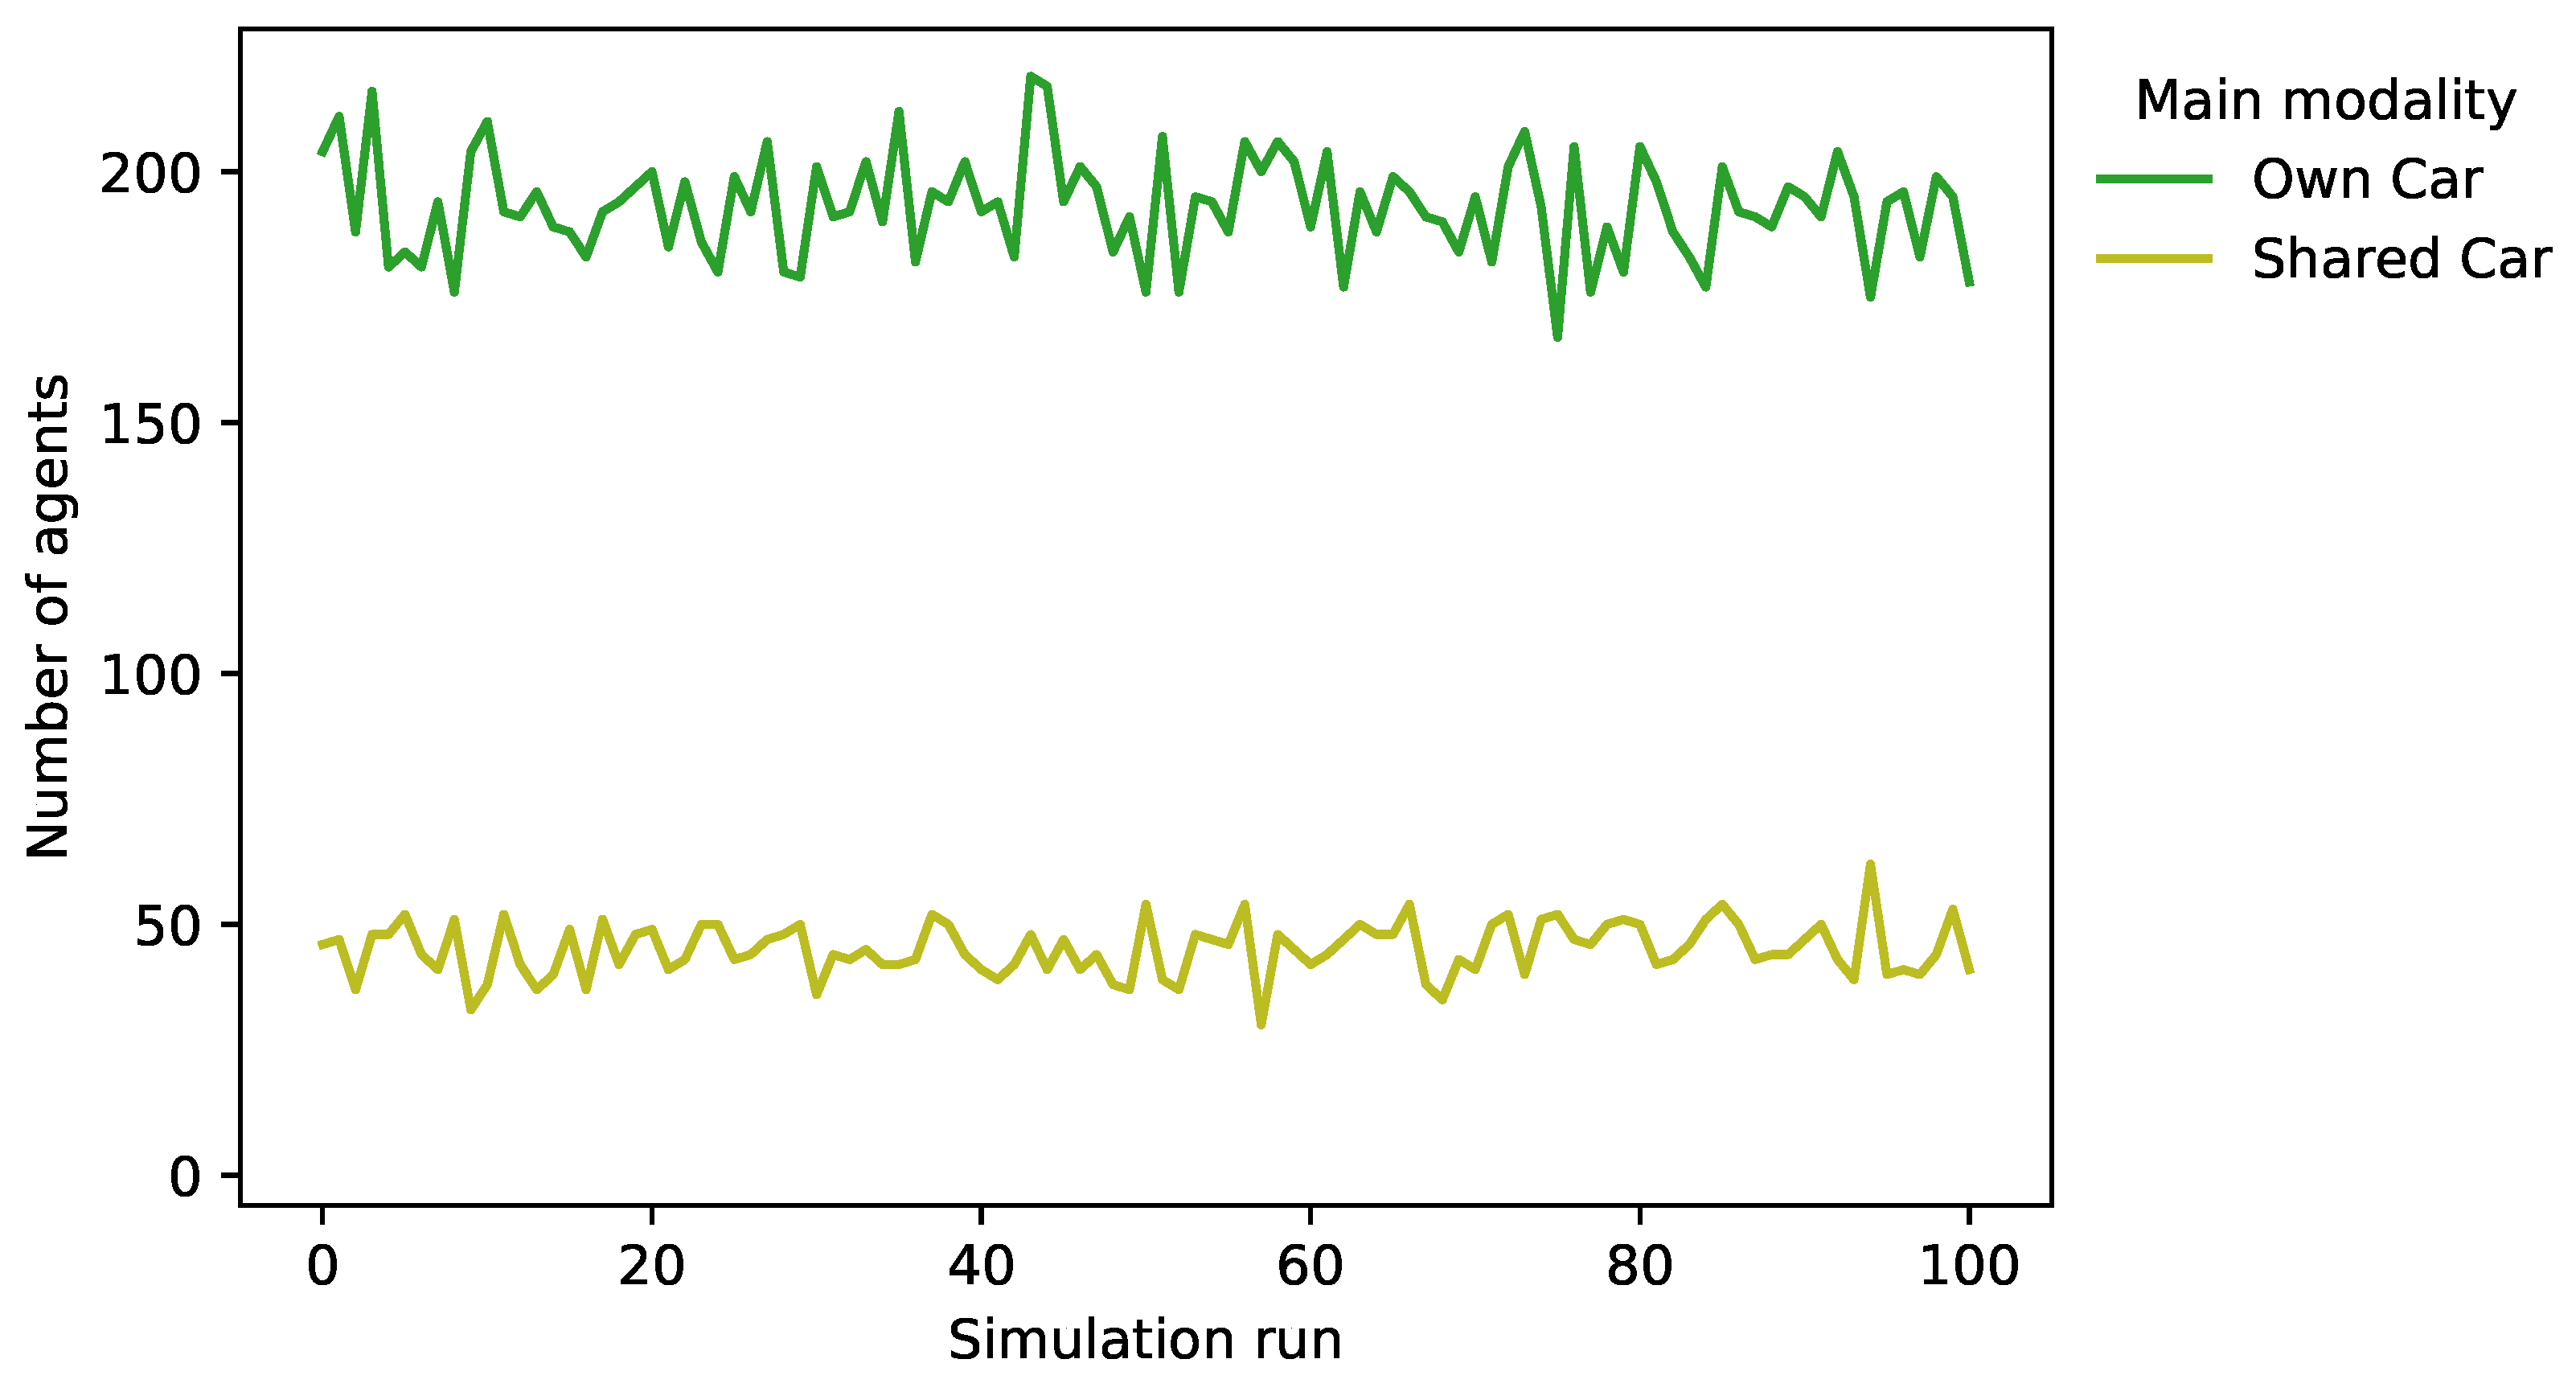
4. Results
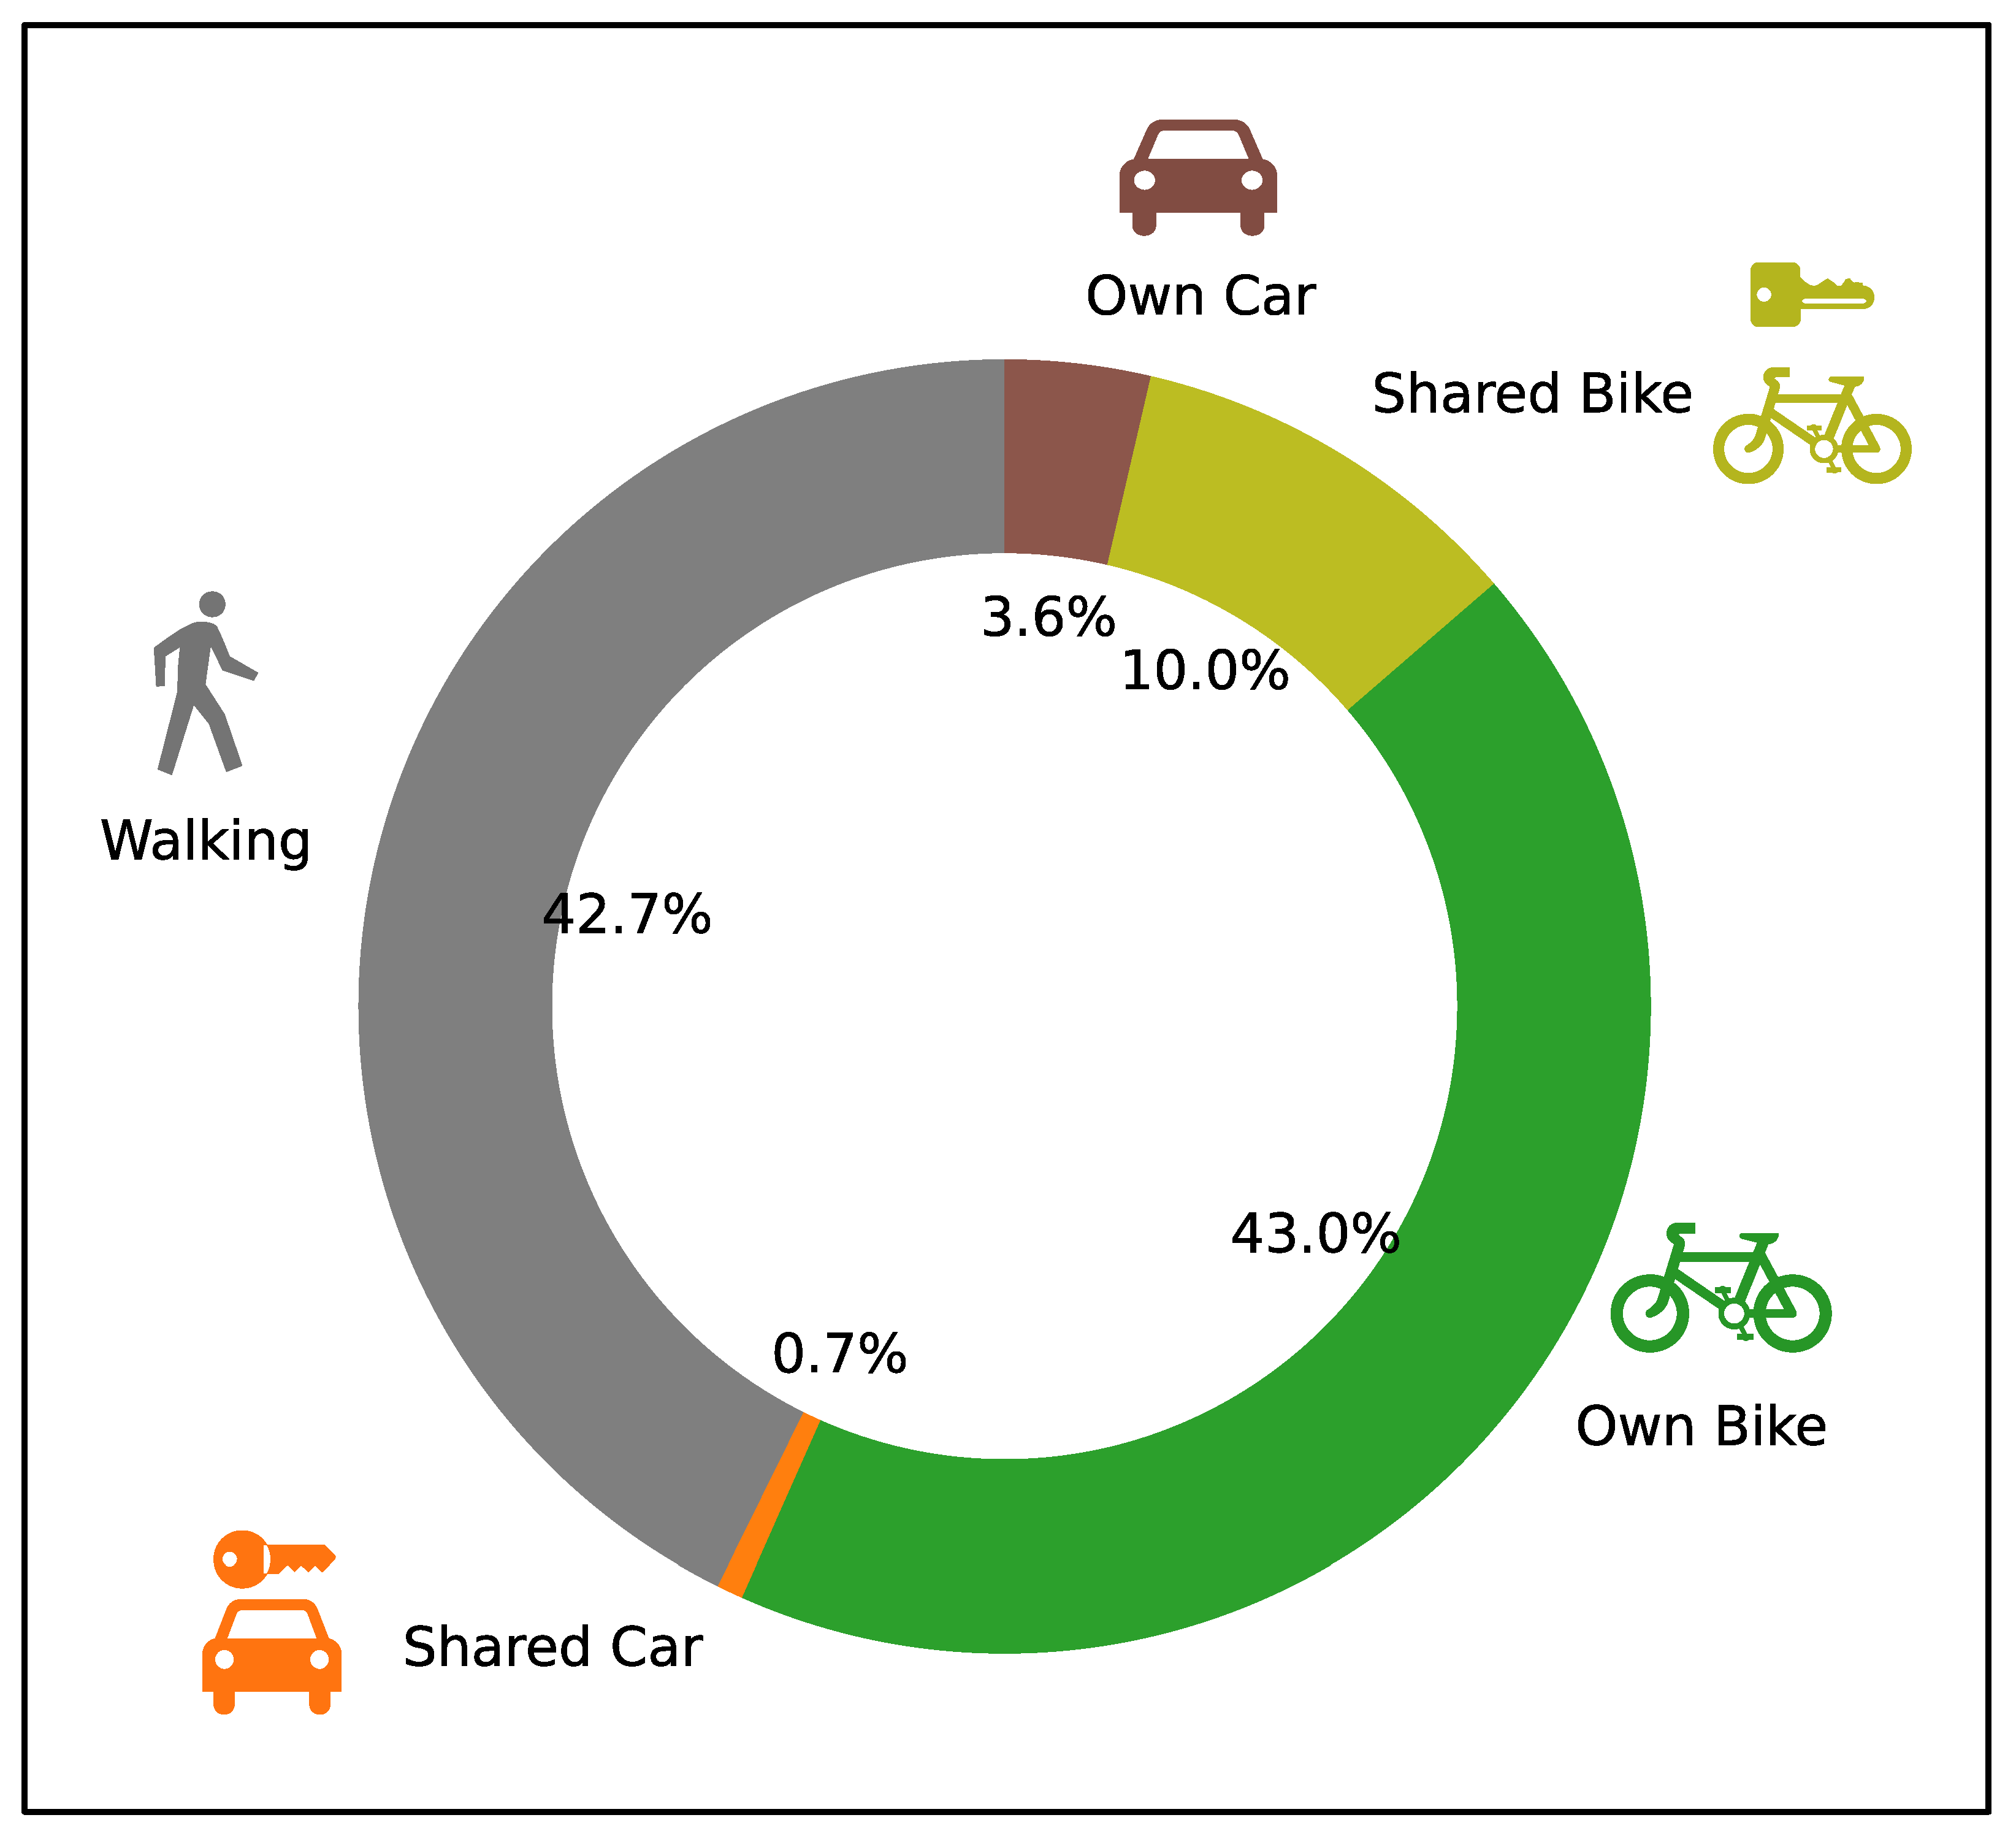
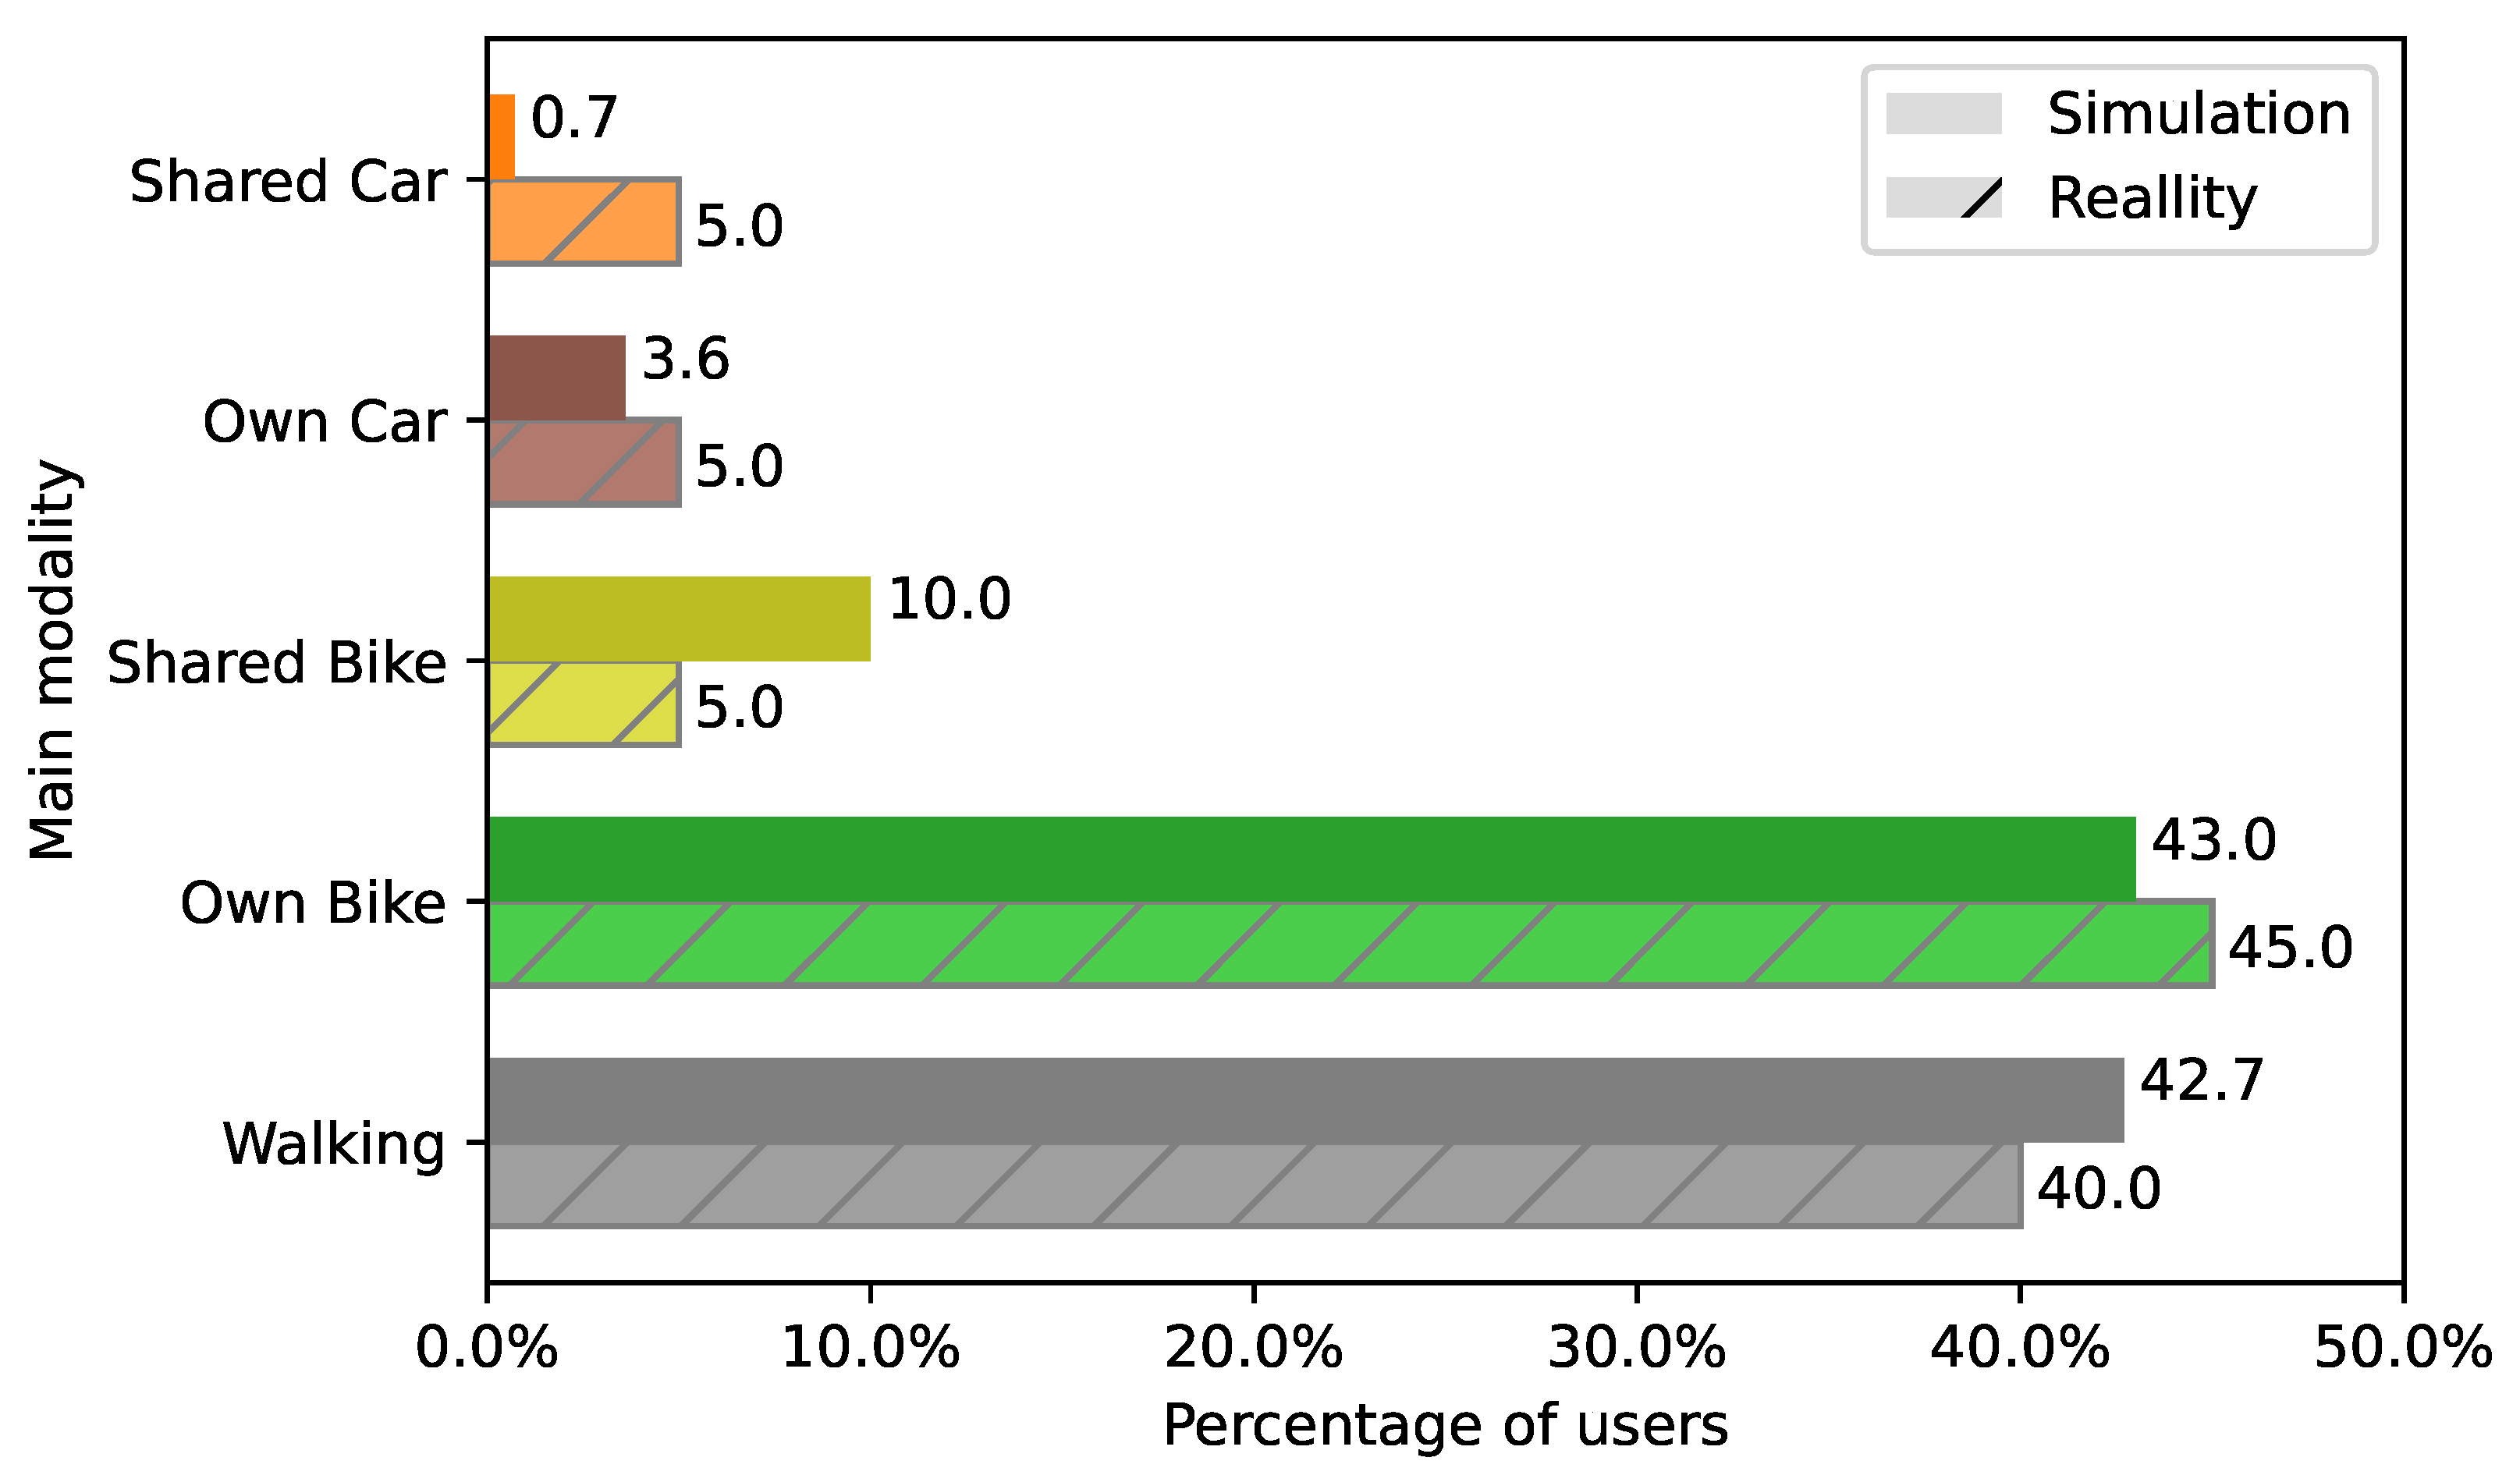
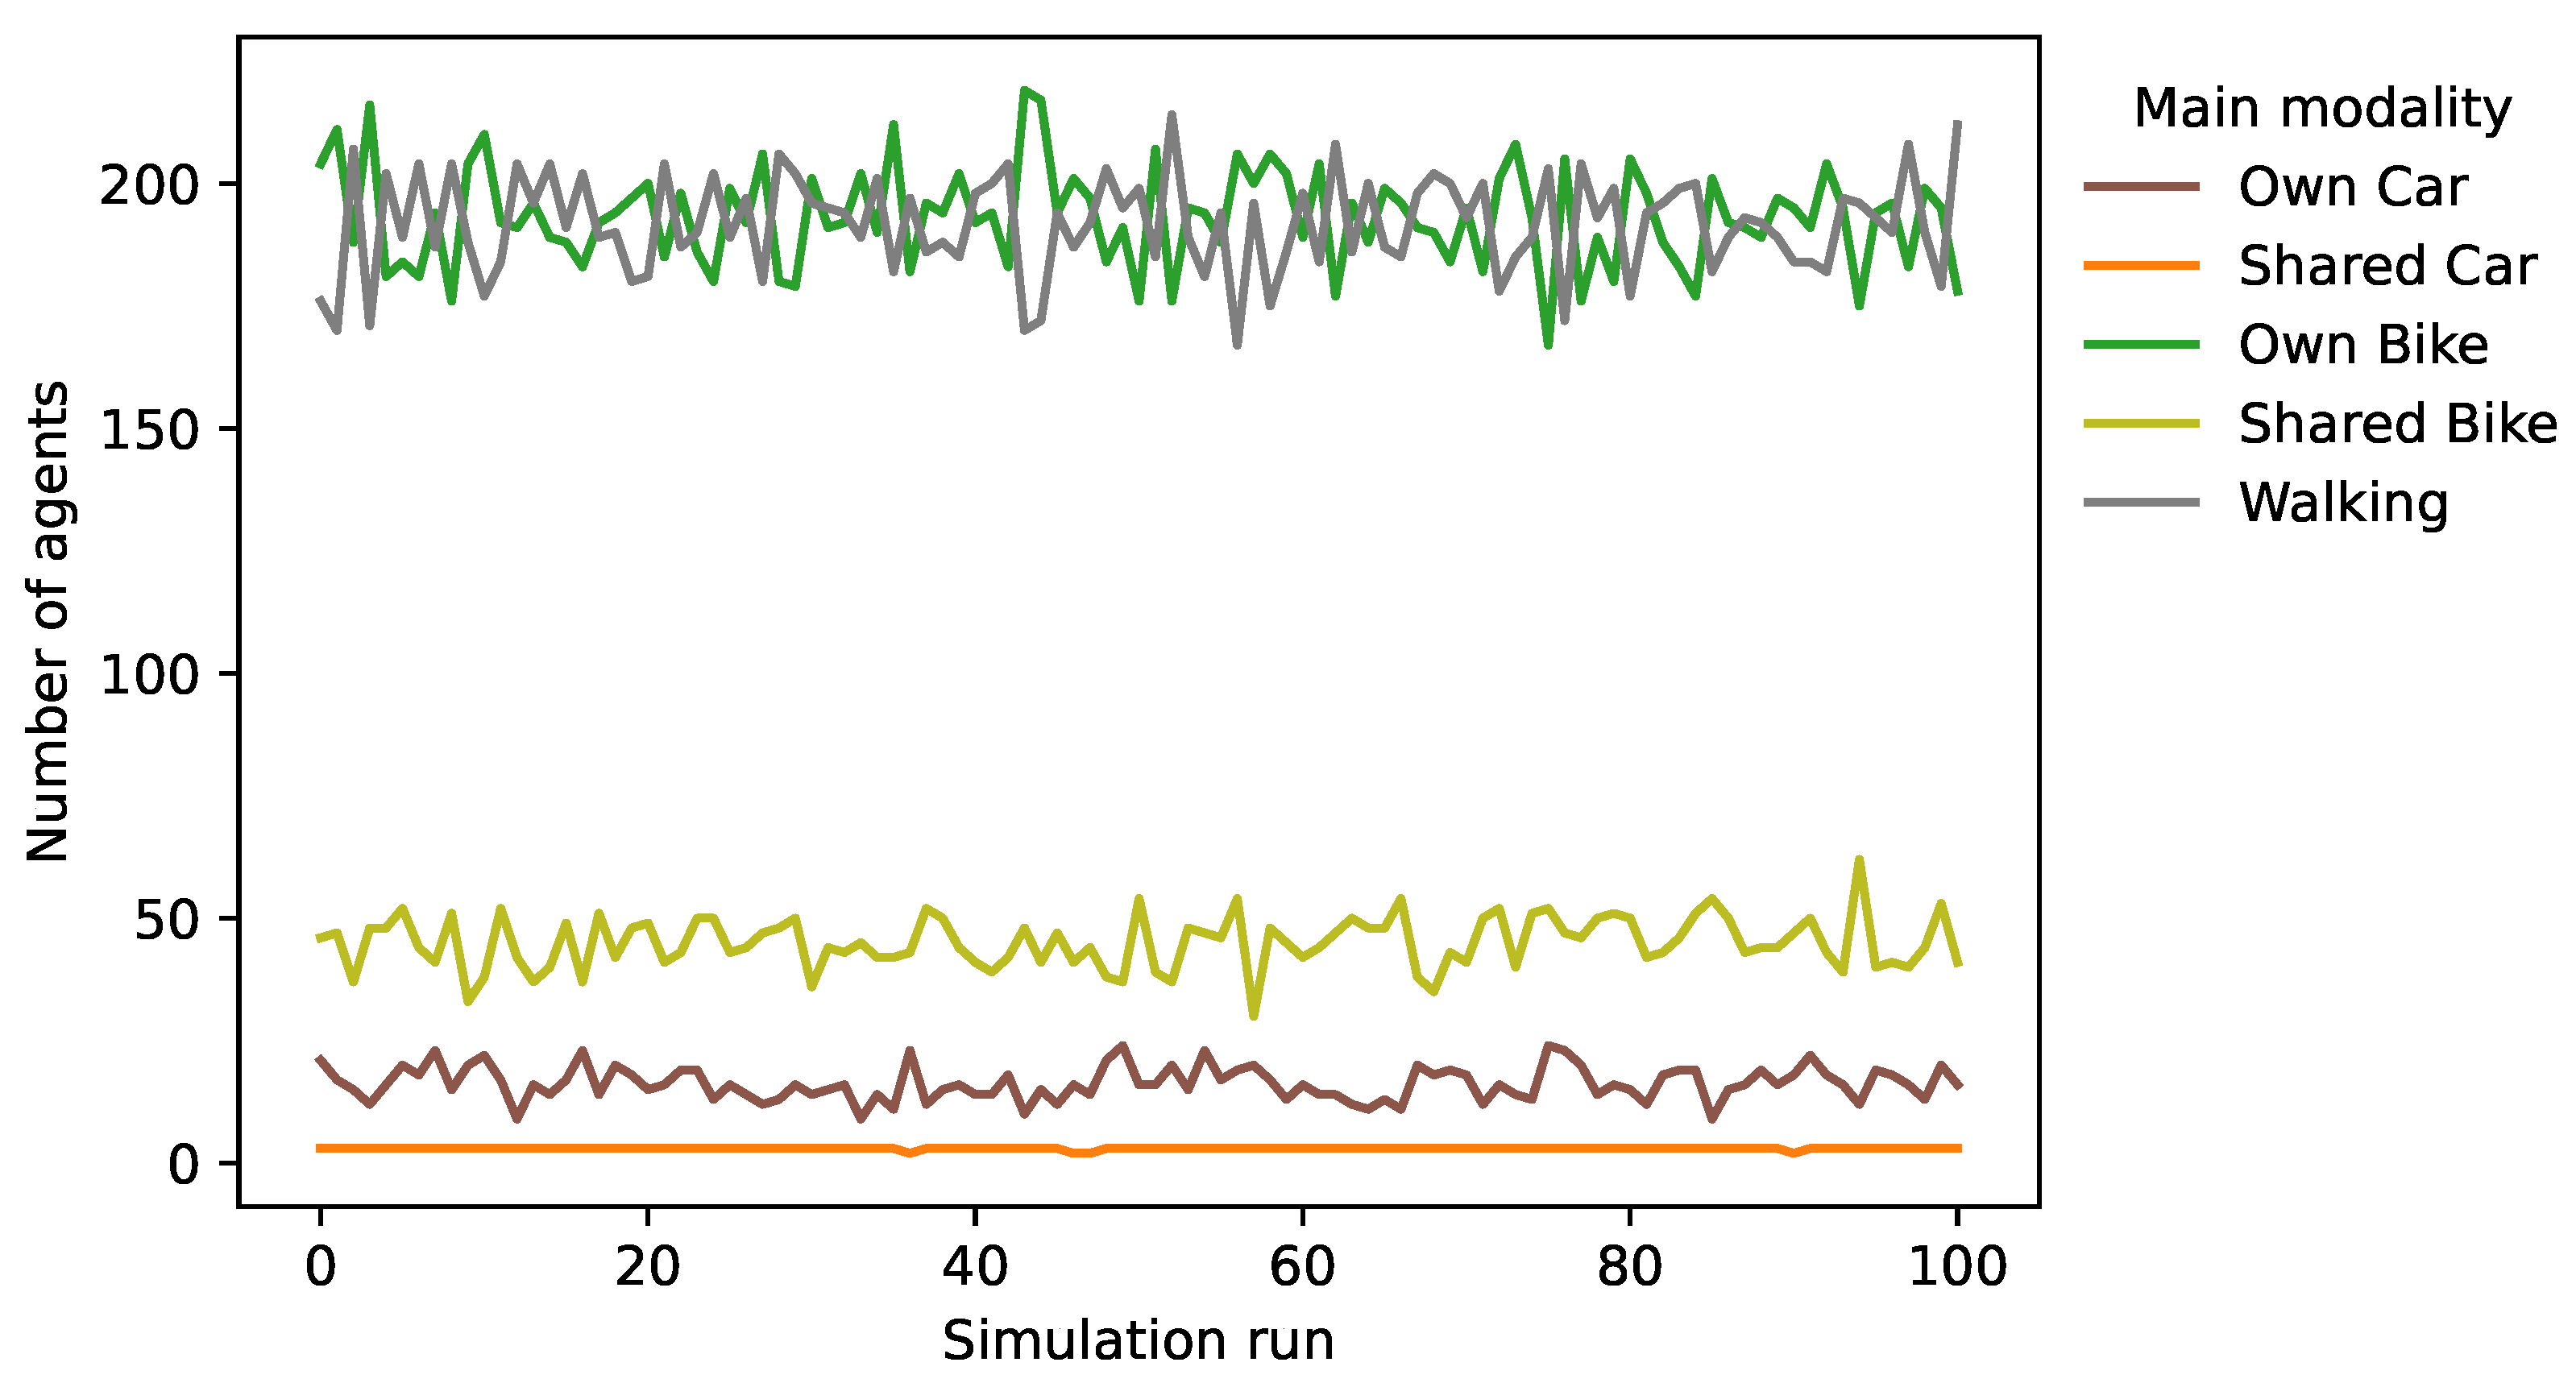
4.1. Overview
4.2. Cycling
4.3. Driving
5. Discussion
6. Conclusions
Author Contributions
Funding
Institutional Review Board Statement
Informed Consent Statement
Data Availability Statement
Acknowledgments
Conflicts of Interest
| 1 | http://www.en.urbandataplatform.hamburg/, accessed on 30 October 2021. |
| 2 | First In-First Out. |
References
- Kandt, J.; Batty, M. Smart cities, big data and urban policy: Towards urban analytics for the long run. Cities 2020, 109, 102992. [Google Scholar] [CrossRef]
- Liu, Y.; Lyu, C.; Liu, Z.; Cao, J. Exploring a large-scale multi-modal transportation recommendation system. Transp. Res. Part C Emerg. Technol. 2021, 126, 103070. [Google Scholar] [CrossRef]
- Cruz, C.O.; Sarmento, J.M. “Mobility as a service” platforms: A critical path towards increasing the sustainability of transportation systems. Sustainability 2020, 12, 6368. [Google Scholar] [CrossRef]
- Kostorz, N.; Fraedrich, E.; Kagerbauer, M. Usage and user characteristics—Insights from Moia, Europe’s largest ridepooling service. Sustainability 2021, 13, 958. [Google Scholar] [CrossRef]
- Farahmand, Z.H.; Gkiotsalitis, K.; Geurs, K.T. Mobility-as-a-Service as a transport demand management tool: A case study among employees in the Netherlands. Case Stud. Transp. Policy 2021, 9. in press. [Google Scholar]
- Hensher, D.A.; Mulley, C.; Nelson, J.D. Mobility as a service (MaaS) – Going somewhere or nowhere? Transp. Policy 2021, 111, 153–156. [Google Scholar] [CrossRef]
- Nikitas, A.; Michalakopoulou, K.; Njoya, E.T.; Karampatzakis, D. Artificial intelligence, transport and the smart city: Definitions and dimensions of a new mobility era. Sustainability 2020, 12, 2789. [Google Scholar] [CrossRef] [Green Version]
- Freie und Hansestadt Hamburg. Digitalisierung des Verkehrs. 2021. Available online: https://www.hamburg.de/contentblob/15389994/c699c2f0f1321f6a264d360172479e7c/data/broschuere-digitalisierung-des-verkehrs.pdf (accessed on 23 September 2021). (In German).
- Wefering, F.; Rupprecht, S.; Buhrmann, S.; Bohler-Baedecker, S. Guidelines—Developing and Implementing a Sustainable Urban Mobility Plan. In Eltisplus; European Commission: Brussels, Belgium, 2013; p. 150. [Google Scholar]
- Cottrill, C.D.; Brooke, S.; Mulley, C.; Nelson, J.D.; Wright, S. Can multi-modal integration provide enhanced public transport service provision to address the needs of vulnerable populations? Res. Transp. Econ. 2020, 83, 100954. [Google Scholar] [CrossRef]
- Lee, J.S.; Filatova, T.; Ligmann-Zielinska, A.; Hassani-Mahmooei, B.; Stonedahl, F.; Lorscheid, I.; Voinov, A.; Polhill, G.; Sun, Z.; Parker, D.C. The complexities of agent-based modeling output analysis. Jasss 2015, 18, 1–26. [Google Scholar] [CrossRef]
- Yang, L.; Hoffmann, P.; Scheffran, J.; Rühe, S.; Fischereit, J.; Gasser, I. An Agent-Based Modeling Framework for Simulating Human Exposure to Environmental Stresses in Urban Areas. Urban Sci. 2018, 2, 36. [Google Scholar] [CrossRef] [Green Version]
- Namoun, A.; Tufail, A.; Mehandjiev, N.; Alrehaili, A.; Akhlaghinia, J.; Peytchev, E. An Eco-Friendly Multimodal Route Guidance System for Urban Areas Using Multi-Agent Technology. Appl. Sci. 2021, 11, 2057. [Google Scholar] [CrossRef]
- Soriguera, F.; Casado, V.; Jiménez, E. A simulation model for public bike-sharing systems. Transp. Res. Procedia 2018, 33, 139–146. [Google Scholar] [CrossRef]
- Ištoka Otković, I.; Karleuša, B.; Deluka-Tibljaš, A.; Šurdonja, S.; Marušić, M. Combining traffic microsimulation modeling and multi-criteria analysis for sustainable spatial-traffic planning. Land 2021, 10, 666. [Google Scholar] [CrossRef]
- Glake, D.; Ritter, N.; Clemen, T. Utilizing Spatio-Temporal Data in Multi-Agent Simulation. In Proceedings of the 2020 Winter Simulation Conference, Virtual Conference. 14–18 December 2020. [Google Scholar]
- Clemen, T.; Ahmady-Moghaddam, N.; Lenfers, U.A.; Ocker, F.; Osterholz, D.; Ströbele, J.; Glake, D. Multi-Agent Systems and Digital Twins for Smarter Cities. In Proceedings of the 2021 ACM SIGSIM Conference on Principles of Advanced Discrete Simulation; Association for Computing Machinery: New York, NY, USA, 2021; pp. 45–55. [Google Scholar]
- Bundesministerium für Verkehr und digitale Infrastruktur. In Mobilität in Deutschland. Tabellarische Grundauswertung; BMVI: Bonn, Germany, 2018.
- Doll, C.; Inninger, W.; Veres-Homm, U.; Fanderl, N.; Otto, T.; Biedermann, N.; Demtschenko, R.; Stegmüller, S.; Nagel, I. Thesen zu Entwicklung und Forschung im Personenverkehr bis 2030; Technical Report; Fraunhofer Verkehr: Dortmund, Germany, 2021. [Google Scholar]
- Vohl, R. HVV Switch Nimmt Fahrt Auf. Press Release. 2020. Available online: https://www.hochbahn.de/de/presse/pressemitteilungen/hvv-switch-nimmt-fahrt-auf-mehr-mobilitaet-per-klick-12624/ (accessed on 30 October 2021).
- Infas. Mobilität in Deutschland—Ergebnisbericht. In Bundesministerium für Verkehr und Digitale Infrastruktur; BMVI: Bonn, Germany, 2018; pp. 1–133. [Google Scholar]
- Tünkers, P.; (SHARE NOW GmbH, Berlin, Germany). Personal communication, 2021.
- Krampe, J.; (P+R Betriebsgesellschaft mbH, Hamburg, Germany). Personal communication, 2021.
- Ritzel, N.; (Deutsche Bahn Connect GmbH, Berlin, Germany). Personal communication, 2021.
- Weyl, J.; Lenfers, U.A.; Clemen, T.; Glake, D.; Panse, F.; Ritter, N. Large-Scale Traffic Simulation for Smart City Planning with Mars. In Proceedings of the 2019 Summer Simulation Conference; Society for Computer Simulation International: Berlin, Germany, 2019; p. 12. [Google Scholar]
- Weyl, J.; Glake, D.; Clemen, T. Agent-Based Traffic Simulation at City Scale with MARS. In Proceedings of the Agent-Directed Simulation Symposium; Society for Computer Simulation International: Baltimore, MD, USA, 2018; p. 9. [Google Scholar]
- Dalski, J.; Hüning, C.; Clemen, T. An Output and 3D Visualization Concept for the MSAAS System MARS. In Proceedings of the 2017 Spring Simulation Multiconference, Virginia Beach, VA, USA, 23–26 April 2017. [Google Scholar]
- Glake, D.; Panse, F.; Ritter, N.; Clemen, T.; Lenfers, U. Data Management in Multi-Agent Simulation Systems—From Challenges to First Solutions. In Datenbanksysteme für Business, Technologie und Web (BTW), 19. Fachtagung des GI-Fachbereichs Datenbanken und Informationssysteme; 2021; in press. [Google Scholar]
- Liu, J.; Li, H.; Gao, Y.; Yu, H.; Jiang, D. A geohash-based index for spatial data management in distributed memory. In Proceedings of the 2014 22nd International Conference on Geoinformatics, Kaohsiung, Taiwan, 25–27 June 2014; pp. 1–4. [Google Scholar]
- Szpankowski, W. Patricia tries again revisited. J. ACM (JACM) 1990, 37, 691–711. [Google Scholar] [CrossRef]
- Viotti, P.; Vukolić, M. Consistency in non-transactional distributed storage systems. ACM Comput. Surv. (CSUR) 2016, 49, 1–34. [Google Scholar] [CrossRef]
- Mitchell, J.S. Geometric Shortest Paths and Network Optimization. Handb. Comput. Geom. 2000, 334, 633–702. [Google Scholar]
- Goldberg, A.V.; Harrelson, C. Computing the Shortest Path: A Search Meets Graph Theory; SODA; Citeseer: Redmond, WA, USA, 2005; Volume 5, pp. 156–165. [Google Scholar]
- Treiber, M.; Hennecke, A.; Helbing, D. Congested traffic states in empirical observations and microscopic simulations. Phys. Rev. E 2000, 62, 1805–1824. [Google Scholar] [CrossRef] [PubMed] [Green Version]
- Wiedemann, R. Simulation des Straßenverkehrsflusses. Ph.D. Thesis, Karlsruher Institut für Technologie (KIT), Karlsruhe, Germany, 1974. [Google Scholar]
- Statistisches Amt für Hamburg und Schleswig-Holstein. Bevölkerungsprognose für Hamburg. Stat. Inf. Nr. 2019, 89, 12–14. [Google Scholar]
- Holtermann, L.; Otto, A.; Schulze, S. Pendeln in Hamburg HWWI Policy. HWWI Policy 2013, 83, 1–35. [Google Scholar]
- Waldrop, M. Free Agents. Science 2018, 360, 144–147. [Google Scholar] [CrossRef] [Green Version]
- Crooks, A.T. Using geo-spatial agent-based models for studying cities. Analysis 2010, 44, 35. [Google Scholar]
- Lu, M.; An, K.; Hsu, S.C.; Zhu, R. Considering user behavior in free-floating bike sharing system design: A data-informed spatial agent-based model. Sustain. Cities Soc. 2019, 49, 101567. [Google Scholar] [CrossRef]
- Lavalle, A.; Teruel, M.A.; Maté, A.; Trujillo, J. Improving sustainability of smart cities through visualization techniques for Big Data from iot devices. Sustainability 2020, 12, 5595. [Google Scholar] [CrossRef]
- Lenfers, U.A.; Ahmady-Moghaddam, N.; Glake, D.; Ocker, F.; Osterholz, D.; Ströbele, J.; Clemen, T. Improving model predictions—integration of real-time sensor data into a running simulation of an agent-based model. Sustainability 2021, 13, 7000. [Google Scholar] [CrossRef]
- Sanchez-Iborra, R.; Bernal-Escobedo, L.; Santa, J. Eco-efficient mobility in smart city scenarios. Sustainability 2020, 12, 8443. [Google Scholar] [CrossRef]


Publisher’s Note: MDPI stays neutral with regard to jurisdictional claims in published maps and institutional affiliations. |
© 2021 by the authors. Licensee MDPI, Basel, Switzerland. This article is an open access article distributed under the terms and conditions of the Creative Commons Attribution (CC BY) license (https://creativecommons.org/licenses/by/4.0/).
Share and Cite
Lenfers, U.A.; Ahmady-Moghaddam, N.; Glake, D.; Ocker, F.; Ströbele, J.; Clemen, T. Incorporating Multi-Modal Travel Planning into an Agent-Based Model: A Case Study at the Train Station Kellinghusenstraße in Hamburg. Land 2021, 10, 1179. https://doi.org/10.3390/land10111179
Lenfers UA, Ahmady-Moghaddam N, Glake D, Ocker F, Ströbele J, Clemen T. Incorporating Multi-Modal Travel Planning into an Agent-Based Model: A Case Study at the Train Station Kellinghusenstraße in Hamburg. Land. 2021; 10(11):1179. https://doi.org/10.3390/land10111179
Chicago/Turabian StyleLenfers, Ulfia Annette, Nima Ahmady-Moghaddam, Daniel Glake, Florian Ocker, Jonathan Ströbele, and Thomas Clemen. 2021. "Incorporating Multi-Modal Travel Planning into an Agent-Based Model: A Case Study at the Train Station Kellinghusenstraße in Hamburg" Land 10, no. 11: 1179. https://doi.org/10.3390/land10111179
APA StyleLenfers, U. A., Ahmady-Moghaddam, N., Glake, D., Ocker, F., Ströbele, J., & Clemen, T. (2021). Incorporating Multi-Modal Travel Planning into an Agent-Based Model: A Case Study at the Train Station Kellinghusenstraße in Hamburg. Land, 10(11), 1179. https://doi.org/10.3390/land10111179