Article

Quantifying Mechanistic Detachment Parameters Due to Humic Acids in Biological Soil Crusts

by
Atheer A. Abbood
1 and
Abdul-Sahib T. Al-Madhhachi
2,*
1
Department of Environmental Engineering, College of Engineering, Mustansiriyah University, Baghdad 10047, Iraq
2
Department of Water Resources Engineering, College of Engineering, Mustansiriyah University, Baghdad 10047, Iraq
*
Author to whom correspondence should be addressed.
Land 2021, 10(11), 1180; https://doi.org/10.3390/land10111180
Submission received: 26 September 2021 / Revised: 30 October 2021 / Accepted: 1 November 2021 / Published: 3 November 2021

Abstract

:
Humic acid (HA) is a material that could be used to decrease erosion and improve soil structure. It is also known that biological soil crusts (biocrusts) have a major role in soil stabilization, but the mechanism is not well understood in the presence of HA, especially with mechanistic soil detachment rate parameters (b0 and b1) of the Wilson model, where b0 is the dimensional soil detachment parameter and b1 is the dimensional soil threshold parameter. Therefore, this study intends to (1) investigate the effect of different humic acid (HA) concentrations (0%, 4%, and 8%) on mechanistic soil detachment rate parameters (b0 and b1,) in the Tigris Riversides of the Gheraiat region, Baghdad City, Iraq, of the crusted versus uncrusted soils using a small scale model of the jet erosion tests (mini-JET) at different curing periods (1 week, 2 weeks, and 3 weeks), and (2) examine the impact of HA on b0 and b1 parameters versus some soil characteristics, such as electrical conductivity, cation exchange capacity, and soil organic matter for uncrusted and crusted soils. Thirty-six undisturbed soil specimens (18 for crusted soils and 18 for uncrusted soils) were acquired from the Tigris Riverbank. On these specimens, the mini-JET was used to determine the mechanistic cohesive soil erodibility parameters b0 and b1. The results showed that the value of b0 decreased up to 60% with an increase in curing times for crusted soils until they reached their optimum values at 2 weeks. There was no consistent pattern for b1 at different curing times. As the concentration of HA increased, the value of b0 decreased up to 86% and 99% for crusted and uncrusted soils, respectively. HA significantly improved electrical conductivity, exchange capacity, and organic matter in the soil and reduced soil erodibility. This study provides the benefits of adding HA to the soils as a soil stabilizer using a low-cost technique, which is the JET instrument.

1. Introduction

Humic acid (HA) is a major constituent of humic substances, which are the key organic components of soil, peat, coal, upland streams, dystrophic lakes, and ocean water. The addition of humic acid to the soil leads to an increase in the absorption of nutrients by the plant, as HA acts as a medium for transferring nutrients from the soil to the plant, especially in the case of soil drought [1,2]. By improving the soil properties and increasing the soil’s ability to hold water, HA increases the number of beneficial microbes in the soil, dismantles heavy soil granules, and enhances its physical, chemical, and biological qualities [3].
A key factor in stabilizing soil aggregates, providing nutrients, and maintaining the microbiological balance of the earth is soil organic matter (SOM) [4]. The dynamics of SOM are motivated by the addition of organic compounds that are transformed by a combination of physical, chemical, and biological factors as time progresses [5,6]. When SOM decomposes, its composition, structure, and functional groupings change. Humic acids are made up of multiple fractions of SOM [7]. Fulvic and humic acids, for example, play a role in the transport of cations between the organic−mineral complexes exchanged [7]. Fulvic and humic acids also have an impact on the soil’s organic cation exchange capacity (CEC) [8,9,10,11]. HAs have a dark color, are hydrophilic, and stable, and their components can vary as follows: 40 to 60% carbon; 30 to 50% oxygen; 0 to 4% nitrogen; 2 to 4% hydrogen; 0 to 2% sulfur [12]. The HA compounds interact with ions to produce complexes with various stabilities and structural properties [13]. All of these characteristics can be used to identify the soil management stage in agricultural areas.
Humic acids have been discovered to be connected with aggregate particle size distribution and soil carbon preservation in order to improve particle cohesion and aggregate stability [4]. By studying the spectrum properties of different fractions of SOM, it can provide significant information on how to improve soil quality [14,15]. The use of species diversity in agricultural management substantially increases the quality of SOM, thus effectively influencing the relationship between soil aggregates [16]. As a result, the chemical composition of the soil changes, and as part of soil quality, HA increases [17]. One technique to decrease erosion is to improve the soil structure by modifying soil qualities such as porosity and structural stability, as well as infiltration and other factors that contribute to increase water absorption in the soil [18]. This method improves soil water absorption. As a result, this reduces surface runoff and prevents soil particles from being eroded [1,2]. HA provides the same benefits as solid organic aggregates and can be used in a variety of irrigation methods [19].
Furthermore, the activity of soil microorganisms is an indicator of soil health because microorganisms contribute to soil fertility in many ecosystems, produce various biologically active substances, and have a higher efficiency in the biosorption of heavy metals [14,17]. Biological soil crusts (biocrusts) are a type of microorganism that may be found all over the world. Biocrusts have a significant influence on the biotic content of soils. Biocrusts are located in the top layer of the soil and have the potential to bind the soil particles together physically and chemically [20]. Biocrusts include bacteria, microalgae, cyanobacteria, fungus, protozoa, viruses, and certain nematodes. Biocrusts serve a variety of ecosystem activities and can also serve as a bioindicator of soil quality. Green algae (Chlorophyte), blue-green algae (Cyanobacteria), yellow-green algae (Xanthophyte), and diatoms are all part of biocrusts [21].
Soil erodibility is a natural process in which the natural erosive agents such as water, wind, gravity, or human-induced artificial processes remove and transport soil. Water erosion in many parts of the world is a serious and ongoing environmental concern that causes decreases in soil production and other soil functions and damages the environment [22,23]. Soil erodibility, in particular, threatens regional and even global ecological safety patterns. The influence of humans on soil erodibility is mainly due to industrial mining, processing, construction, smelting, road construction, and farm reconstruction activities. All of these destroy vegetation cover, increase runoff, and cause erosion. Prevention of soil erodibility is therefore fundamental to natural resource management and conservation [24].
There are a number of methods for determining soil erodibility in the presence of biocrusts caused by surface runoff [20,25,26,27,28]. Using an electronic micro-penetrometer, Drahorad and Henningsen [25] investigated the biocrust stability of two research sites. They came to the conclusion that the micro-penetrometer device can detect areas of altering crust stability in connection to biocrust properties. Xiao et al. [26] measured soil erodibility in manufactured crusts versus bare soils in the field using a V-shaped runoff collection area over an eight-year period. They discovered that artificial crusts grew entirely after 4 years and reduced surface runoff by twenty-seven percent in the first 3 years. In addition, Gao et al. [27] investigated the erodibility of two crusted soils in China using nozzles to simulate rainfall from a height of 16 m onto experimental boxes (containing biocrusts). They found that biocrusts enhanced SOM content and reduced soil detachment and soil loss. Gao et al. [28] used a flume to investigate soil resistance owing to runoff scouring on eight levels of crusted versus uncrusted soils. They discovered that soils with more than 36% moss cover are completely protected from runoff erodibility.
All of the preceding methods were expensive and investigated soil stability or erodibility due to surface runoff in the presence of biocrusts. Hashim et al. [20] used a miniature version of the jet erosion test (mini-JET) device to assess soil erodibility parameters in a convenient manner. The JET device uses a jet of water in submerged conditions. This jet of water is generated by constant water pressure, and it impacts on the soil surface. The jet creates a scour hole on the soil surface by applying a certain shear force [29,30,31,32,33,34,35]. The mini-JET is one of the approaches for determining soil erosion parameters that is gaining popularity [29,30,31,32,33,34,35]. The United States Department of Agriculture’s Research Service (USDA-ARS) in Stillwater, Oklahoma, developed the mini-JET instrument [29]. The mini-JET device is simple to set up and use, it uses less water, and weighs less compared to the other techniques. Hashim et al. [20] utilized mini-JET on the soil specimens of two crusted versus uncrusted soils, collected from the Gheraiat region of Iraq. The specimens were air dried at different water contents to derive the erodibility parameters of the linear model. They found a reduction in erodibility coefficient for both biocrusts, while an increase in erodibility coefficient was observed for uncrusted soil. Hashim et al. [20] found that JET is a useful instrument for simulating rainfall-induced surface runoff. In comparison to prior methods, the JET technique involves less effort, uses less testing time, and is a more economical technique. However, till now, no study has used the JET device to explore the influence of HA on soil erosion parameters of crusted versus uncrusted soils.
There are two approaches for calculating cohesive soil erosion rates: a linear model and a mechanistic soil detachment rate model (nonlinear model). Wilson [36,37] developed the nonlinear mechanistic detachment rate model in 1993, and the dimensional detachment parameter (b0) and the dimensional threshold parameter (b1) are soil erodibility parameters in his model. Any additional forces that effect soil detachment can be incorporated, or considered, in the Wilson model parameters (b0 and b1). The Wilson model was widely utilized by several researchers to determine the rate of soil erosion using the JET device [29,30,31,32,33,34,35]. The nonlinear model parameters (b0 and b1) have never been determined using a JET device in the presence of humic acids for crusted versus uncrusted soils at different curing durations.
The current research exclusively explored the influence of HA on mechanistic soil detachment parameters b0 and b1 in biocrust and uncrusted soils at the Gheraiat region of the Tigris riverbanks of northern Baghdad City, Iraq. The farmers in this area employ HA to improve soil nutrition, resulting in high-quality plant outputs. There has been no previous research in this region or/and in the world to investigate the effect of HA on biocrust and to assess mechanistic soil erodibility parameters (b0 and b1). The behavior of crusted and uncrusted soils in the presence of HA was examined in the current study using varied curing durations. As a result, the major purpose of this work was to investigate how varying humic acid concentrations (0, 4%, and 8%) affected the mechanistic soil detachment parameters b0 and b1 of crusted versus uncrusted soils using the mini-JET at various curing durations (1 week, 2 weeks, and 3 weeks). This research also investigated the influence of HA on b0 and b1 parameters versus some soil characteristics such as electrical conductivity (EC), CEC, and soil organic matter (SOM).

2. Materials and Methods
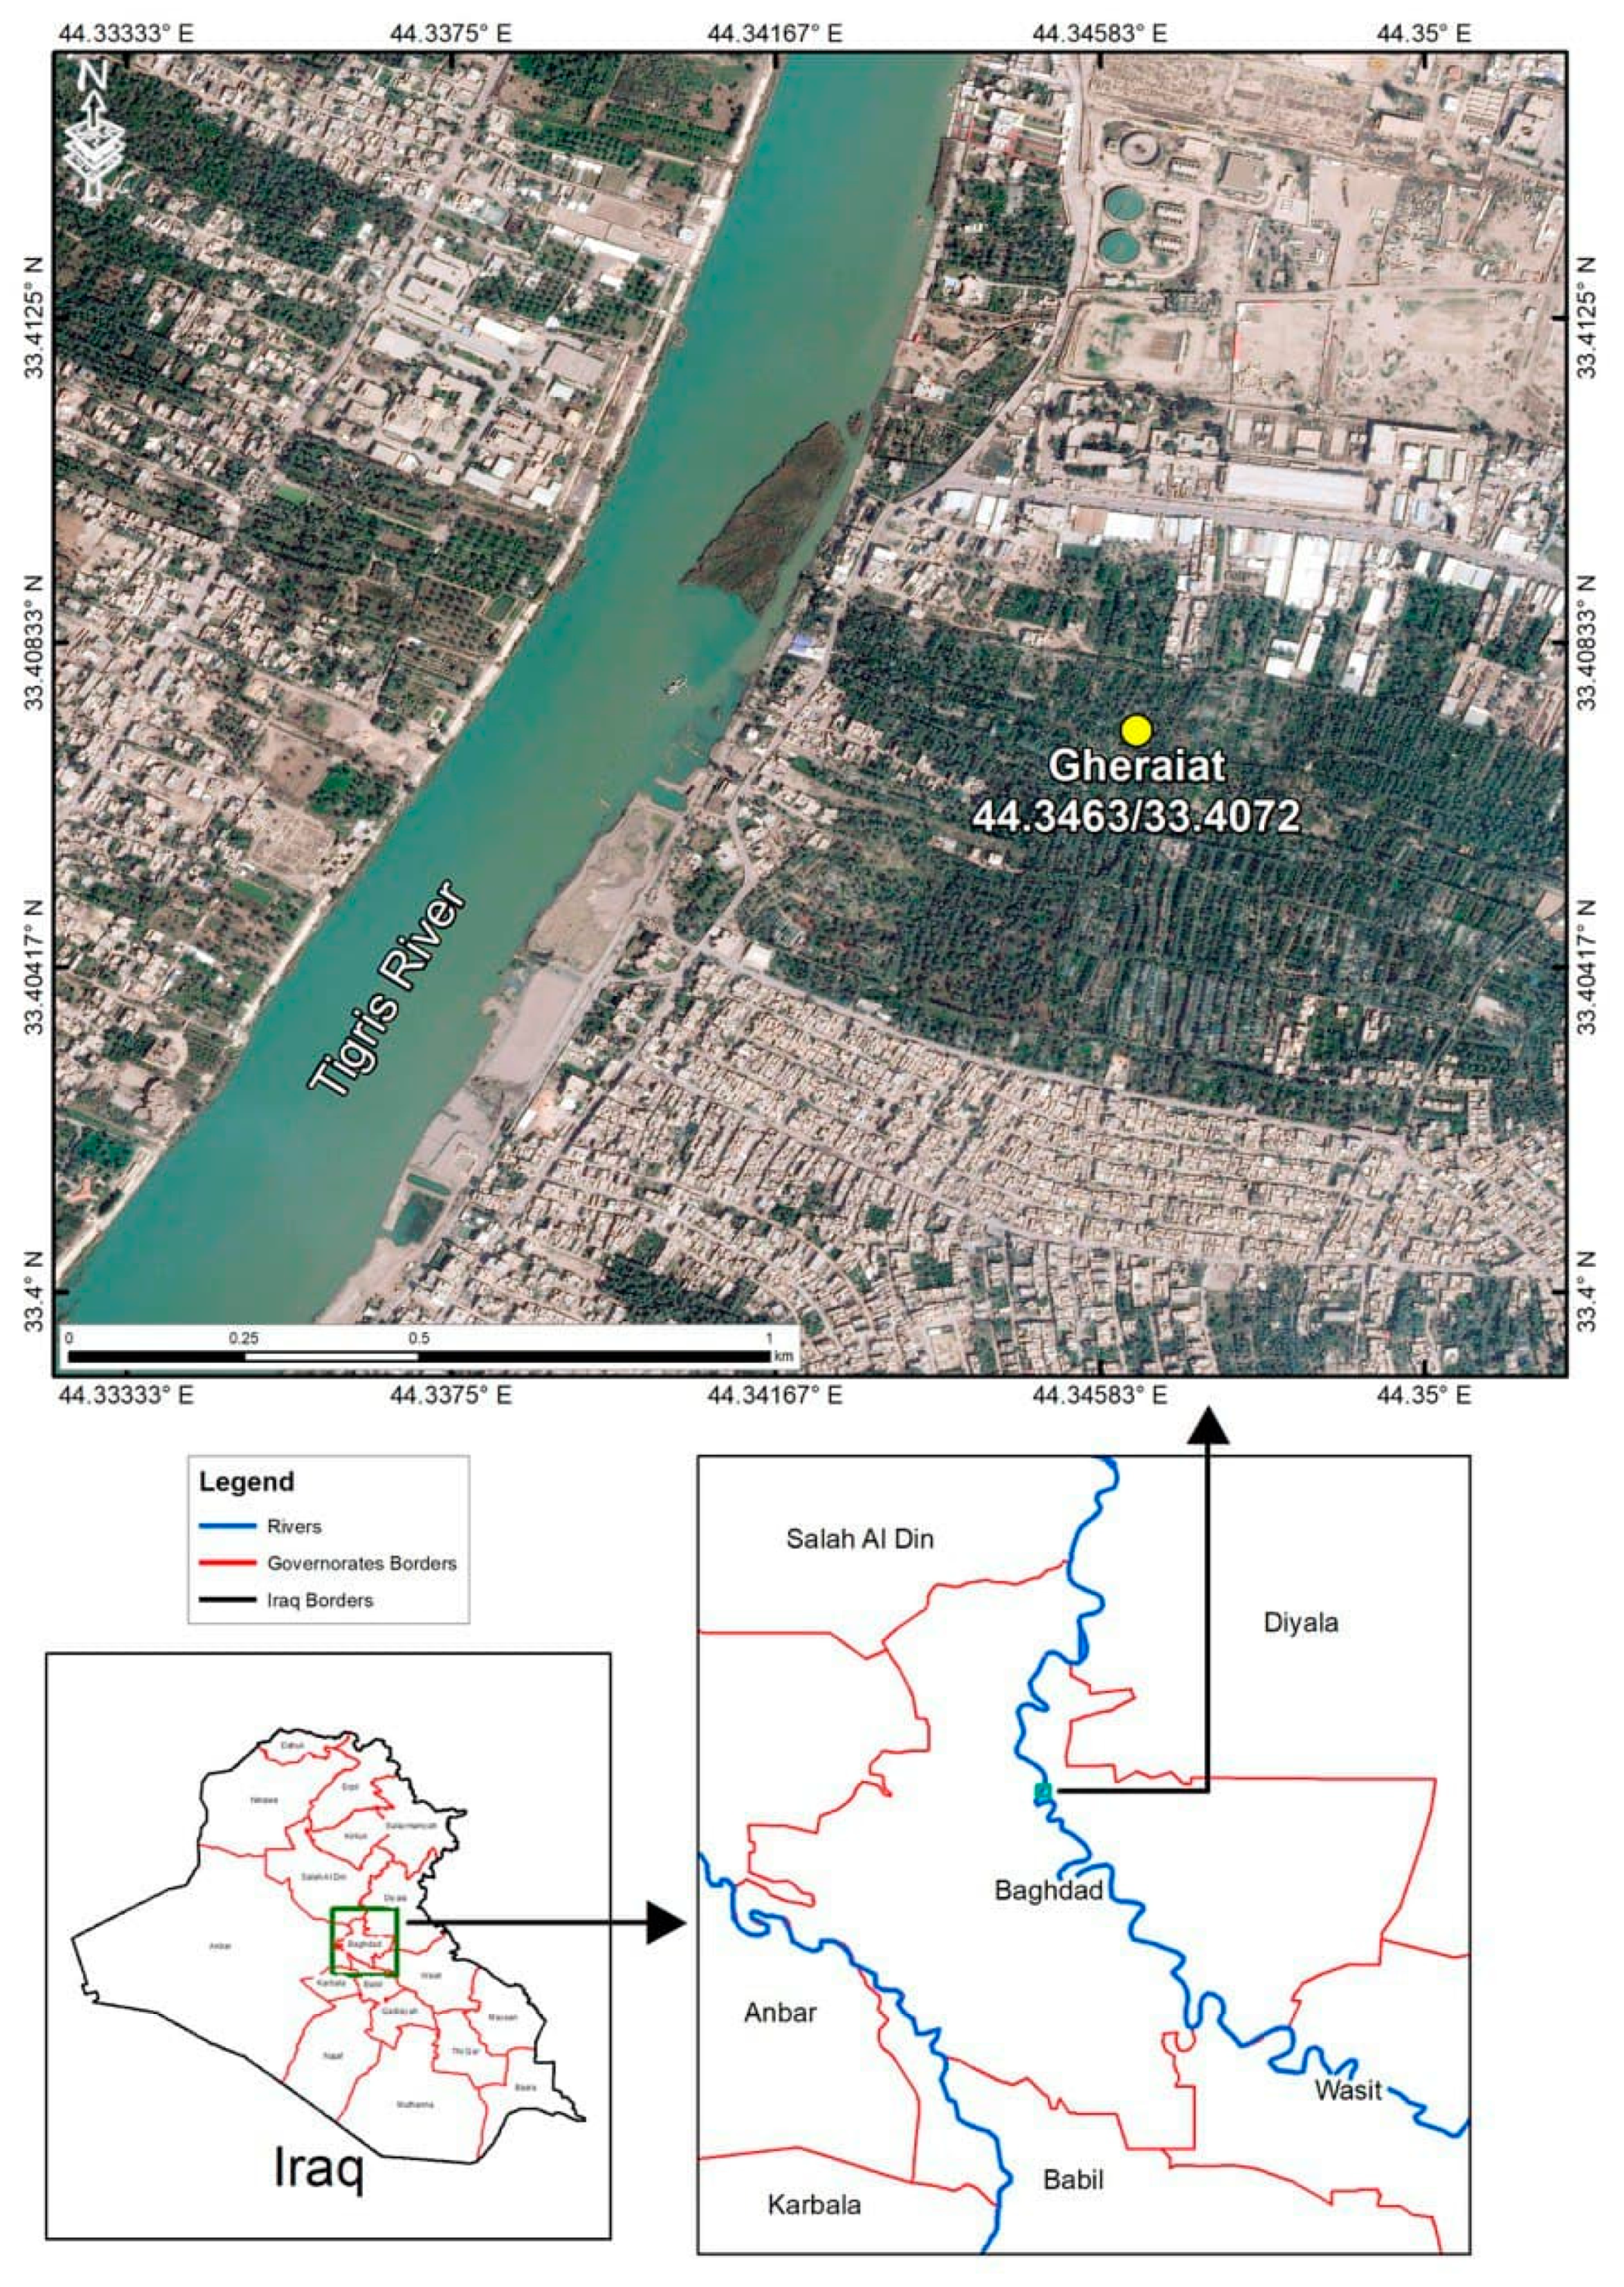
2.1. Study Area

Figure 1 shows the research area, which is located in the region of Gheraiat, Tigris Riversides, Baghdad City, Iraq. The region of Gheraiat is a semiarid region with a large number of biocrusts that spread down the riverside. The high vegetation cover, moderate temperatures (especially in the spring), and wet underlying soils are the key causes for the increased amount of algae developing in this location [20].
The cover of biocrusts increased as a result of this protective plant system, considerably improving the soil environment. Different microenvironments distinguish these crusts. Cyanobacteria algae (blue-green) and Chlorophyte (green) biocrusts are the two main forms of biocrusts found throughout the different areas of the soil surface in the research region. The study region is primarily made up of filamentous Chlorophyte biocrusts, which served as the study’s focus. Eighty five percent of the Chlorophyte biocrust is made up of Zygogonium ericetorum algae, 10% of Spirogyra algae, and 5% of Oedogonium algae. These algae were measured using an optical microscope. The green (Chlorophyte) biocrust was compared to an uncrusted control soil from the same region, which had no impact from vegetation or organic matter. The two types of soil specimens (crusted soil and uncrusted soil) were collected using polyvinyl chloride molds (PVC), as shown in Figure 2.

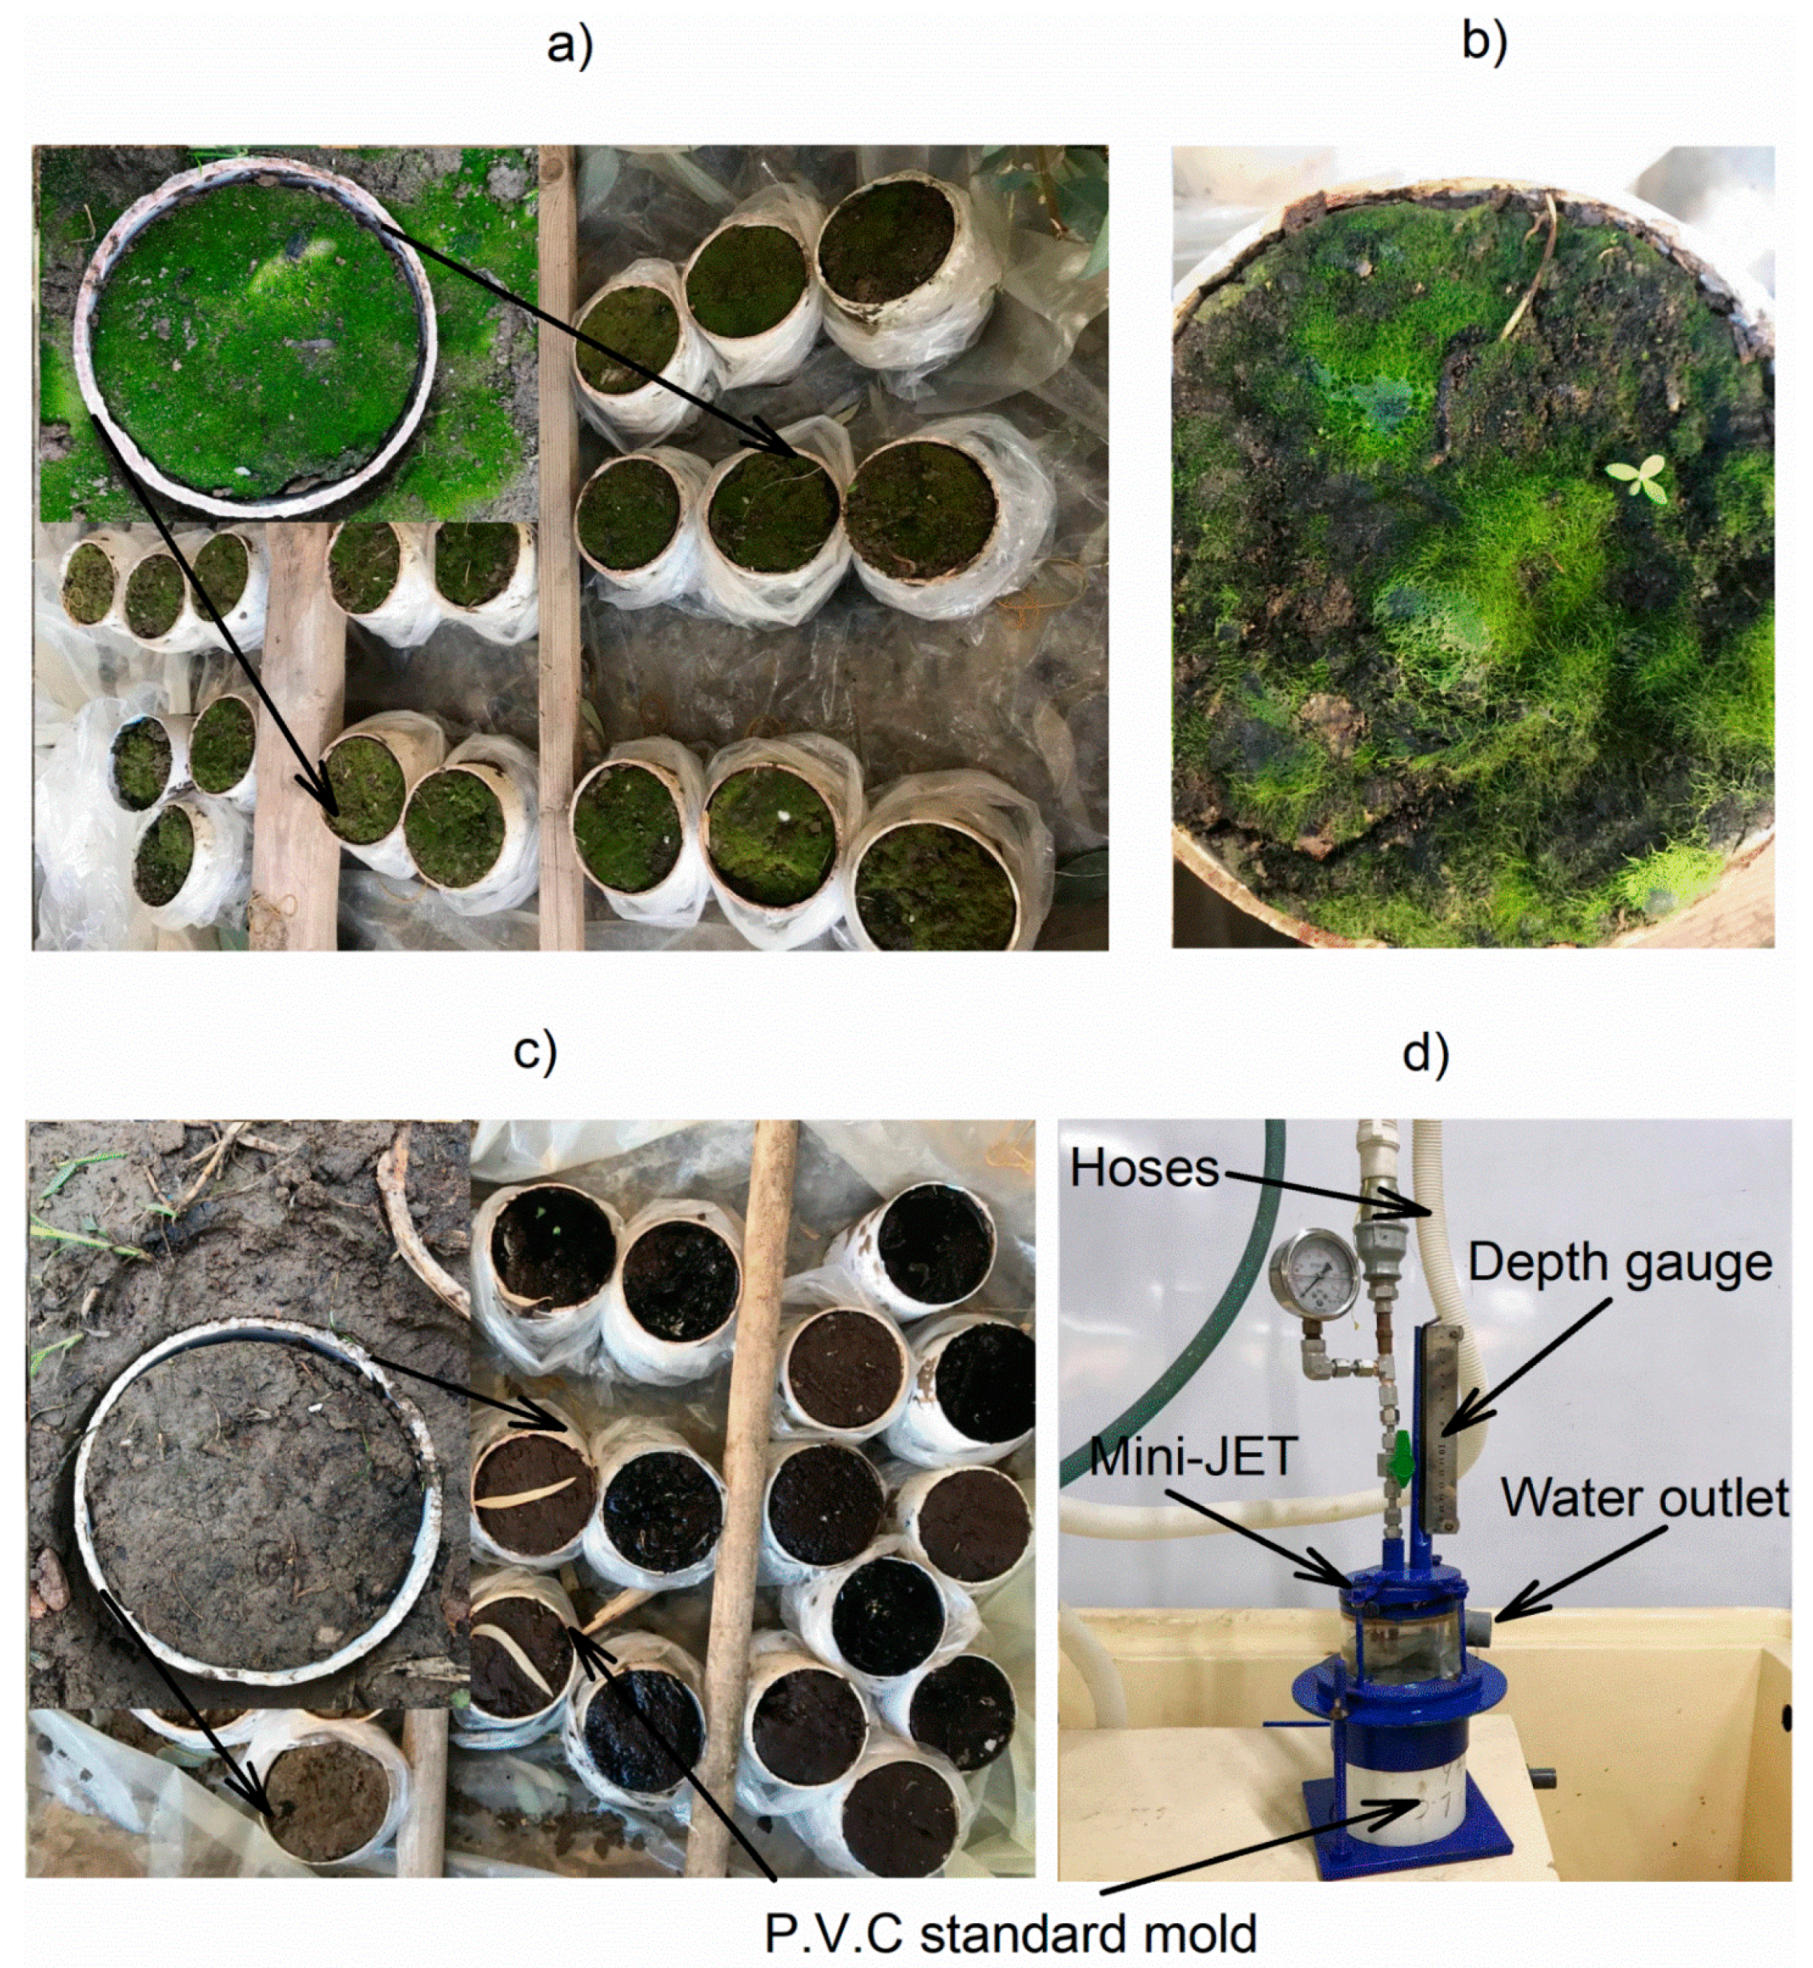
2.2. Humic Acid and Sampling Collection

DELTA K-Humate, made in USA, a brand of humic acid, was used with different concentrations of 0.0%, 4.0%, and 8.0% to be added to the collected soil samples. Organic HA granules are soil conditioners that may enhance nutrient uptake. Agro humic organic is thoroughly mixed with water to produce liquid products. The resulting organic solution is compatible with many liquid fertilizers. Humic acid is 99% sub-bituminous coal and 1% other ingredients. HA is composed of carbon, nitrogen, oxygen, and a small amount of phosphorous and sulfur. The concentration of 0% was just distilled water without humic acid. The concentration of 4% was a mix of 40 g of humic granules dissolved in 1 L of distilled water. The concentration of 8% was a mix of 80 g of humic granules dissolved in 1 L of distilled water. For crusted and uncrusted soil samples, 100 mL of HA concentration was added and distributed on the soil surface for each treatment.
To evaluate the effect of humic acid on soils containing biological crusts and bare soils, specimens were acquired at a moderate temperature during the spring season, when biological crust formation is at its peak. Thirty-six undistributed soil specimens were collected, with eighteen samples containing biological crusts and eighteen samples containing no biological crusts (uncrusted soils). Before extraction, the undisturbed soil specimens were slightly moistened to ensure that the biocrusts remained intact and were less likely to break up throughout the sample gathering process (Figure 2a,c). PVC sample molds were used to collect the undisturbed soil specimens, which had a diameter of 10.1 cm and a height of 11.8 cm. Then, the undisturbed soil specimens were transferred within one hour to the laboratory in a nylon bag inside a closed case (Figure 2). The samples were kept in a glass house to ensure the survival of living organisms. However, by the third week of curing time, the living organisms had died and the soil surface was completely dry.

2.3. Analysis of Soil Physical-Chemical Characteristics

Physical and chemical testing of collected soil specimens was conducted according to ASTM standards [38], as stated in Table 1. The soil was classified as loam soil by the United States Department of Agriculture (USDA). Sieve analysis and hydrometer testing were carried out in accordance with ASTM Standard D422. The ASTM D854 standard was utilized to compute the basic soil gravity. Moisture content and SOM testing were performed in line with ASTM standard D2974. A pH meter and a portable conductivity meter were used to determine the pH and EC, respectively, in a 1:1 soil:water ratio slurry. The volume of CO2 produced by the interaction of hydrochloric acid with soil carbonate was used to calculate the amount of CaCO3. The CaSO4 determination was applied according to [39]. Exchangeable cations (CEC) were determined by the BaCl2 method [40].
In addition, X-ray fluorescence (XRF) analyses were conducted to discover the elements of tested specimens. The Spector X-LAB 2000 XRF device was utilized by preparing tablets (pellets) from samples of the study soil by taking 4 g from the soil with diameters of less than 75 um and adding 0.9 g of a filler of wax for the purpose of the consistency of the model. The sample was then mixed well. The sample was placed in a tablet press machine with the use of air pressure of 15 bar for one minute, after which it was placed inside the XRF machine according to the method used in the laboratory. In this research, the uncrusted and crusted soil samples were analyzed using XRF analysis for a case without humic acid after one week of curing time and a case with humic acid after three weeks of curing time.

2.4. Testing Procedure

The thirty-six undistributed soil specimens (18 for crusted and 18 for uncrusted soils) were arranged and tested as follows. At the time of acquisition, humic acids with concentration levels of 0%, 4%, and 8% were added to each of the two samples of each group (group of six crusted samples and group of six uncrusted soils), as shown in Figure 2b,c. The zero concentration presented the samples with no humic acid. Then, these samples were tested using a mini-JET device (Figure 2d) in the same manner and after one week of humic acid addition, in order to investigate the influence of humic acids on soil samples after one week of curing time. The same procedure was repeated for curing times of two weeks and three weeks. Soil samples were tested at different curing times to investigate the effect of humic acids on mechanistic soil erosion parameters (b0 and b1) for both types of soils (crusted and uncrusted soils) at different soil moisture levels. Three levels of humic acid concentration were used to find the best concentration that could be used to stabilize the soil.

2.5. Deriving of Wilson Model Parameters

Wilson [36,37] created a comprehensive framework for estimating the rate of erosion based on dislodging and stabilizing forces, as well as corresponding moment lengths for particle detachment. Particle separation, according to Wilson [36,37], occurs when the driving force exceeds the resisting moment. Wilson [36] proposed that the time averaged velocity may be used to estimate incipient motion. Wilson [36] used a probability framework for turbulent forces created by Einstein [41] and Partheniades [42] to find the particle detachment. Because there was insufficient information on some parameters of the Wilson model, Wilson [36,37] employed a calibration approach to obtain some of these unknown parameters. Wilson [36,37] proposed a single method for calculating the overall detachment rate by include the effect of particle sizes in the calibration methods indirectly. As a result, the dimensional parameters b0 and b1 are used to express the entire erosion or detachment rate ( ε r ) as follows:
ε r = b 0 τ [ 1 exp { exp ( 3 b 1 τ ) } ]
b 0 = R s G r P e P n P d d ( R s R w )
b 1 = ( π e v 6 ) G r ( P l s + f c ) P o g ( R s R w ) d
where, b0 represents the dimensional soil detachment parameter in g/m.s.N0.5; b1 represents the dimensional soil threshold parameter in Pa; τ is the boundary shear stress in the JET environment in Pa; Rs is a particle density; Rw is the density of water; G r = 2 3 is the spherical particle’s geometry ratio; Pe denotes the lower particle parameter’s exposure; Pn is a composite of particle and fluid properties; Pdd is the detachment distance parameter equal to 2; ev is the coefficient of variation equal to 0.35; Pls is a dimensionless parameter that is affected by particle size, bed orientation, and slope; fc is the dimensionless parameter based on soil cohesion; Po is known as a velocity flow parameter in the Wilson model; and d is an equivalent particle diameter. Al-Madhhachi et al. [29] created a spreadsheet to calculate the parameters b0 and b1 using curve-fitting approaches to reduce the error in these functions when compared to JET erosion data. Al-Madhhachi et al. [29] presented the operation, methodology, parts, description, and function of a mini-JET apparatus. The JET erosion data are the scour depth readings versus different time intervals, with a total test length of 120 min for each test.

2.6. Statistical Analysis

The outcomes of computed statistical differences for mechanistic erosion parameters (b0 and b1) of the two groups (crusted and uncrusted soils) utilizing normality tests (Shapiro−Wilk) of paired t-tests for analysis of variance (ANOVA) were presented. The mean and standard deviation of parameters b0 and b1 at different humic acid concentrations were also reported using a paired t-test ANOVA. The parameters b0 and b1 of crusted and uncrusted soils were also tested using the Tukey test method. When compared to the ANOVA with a significance level of 0.05, this revealed a significant discrepancy. The normalized objective function (NOF) was also used to assess how the predicted Wilson model parameters matched the observed parameters and was expressed as follows:
N O F = j = 1 M ( V i D i ) 2 M M a v
where, Vi is the observed data, Di is the predicted data, M is the observation number, j is an iteration, and Mav is the observed mean data [34].

3. Results

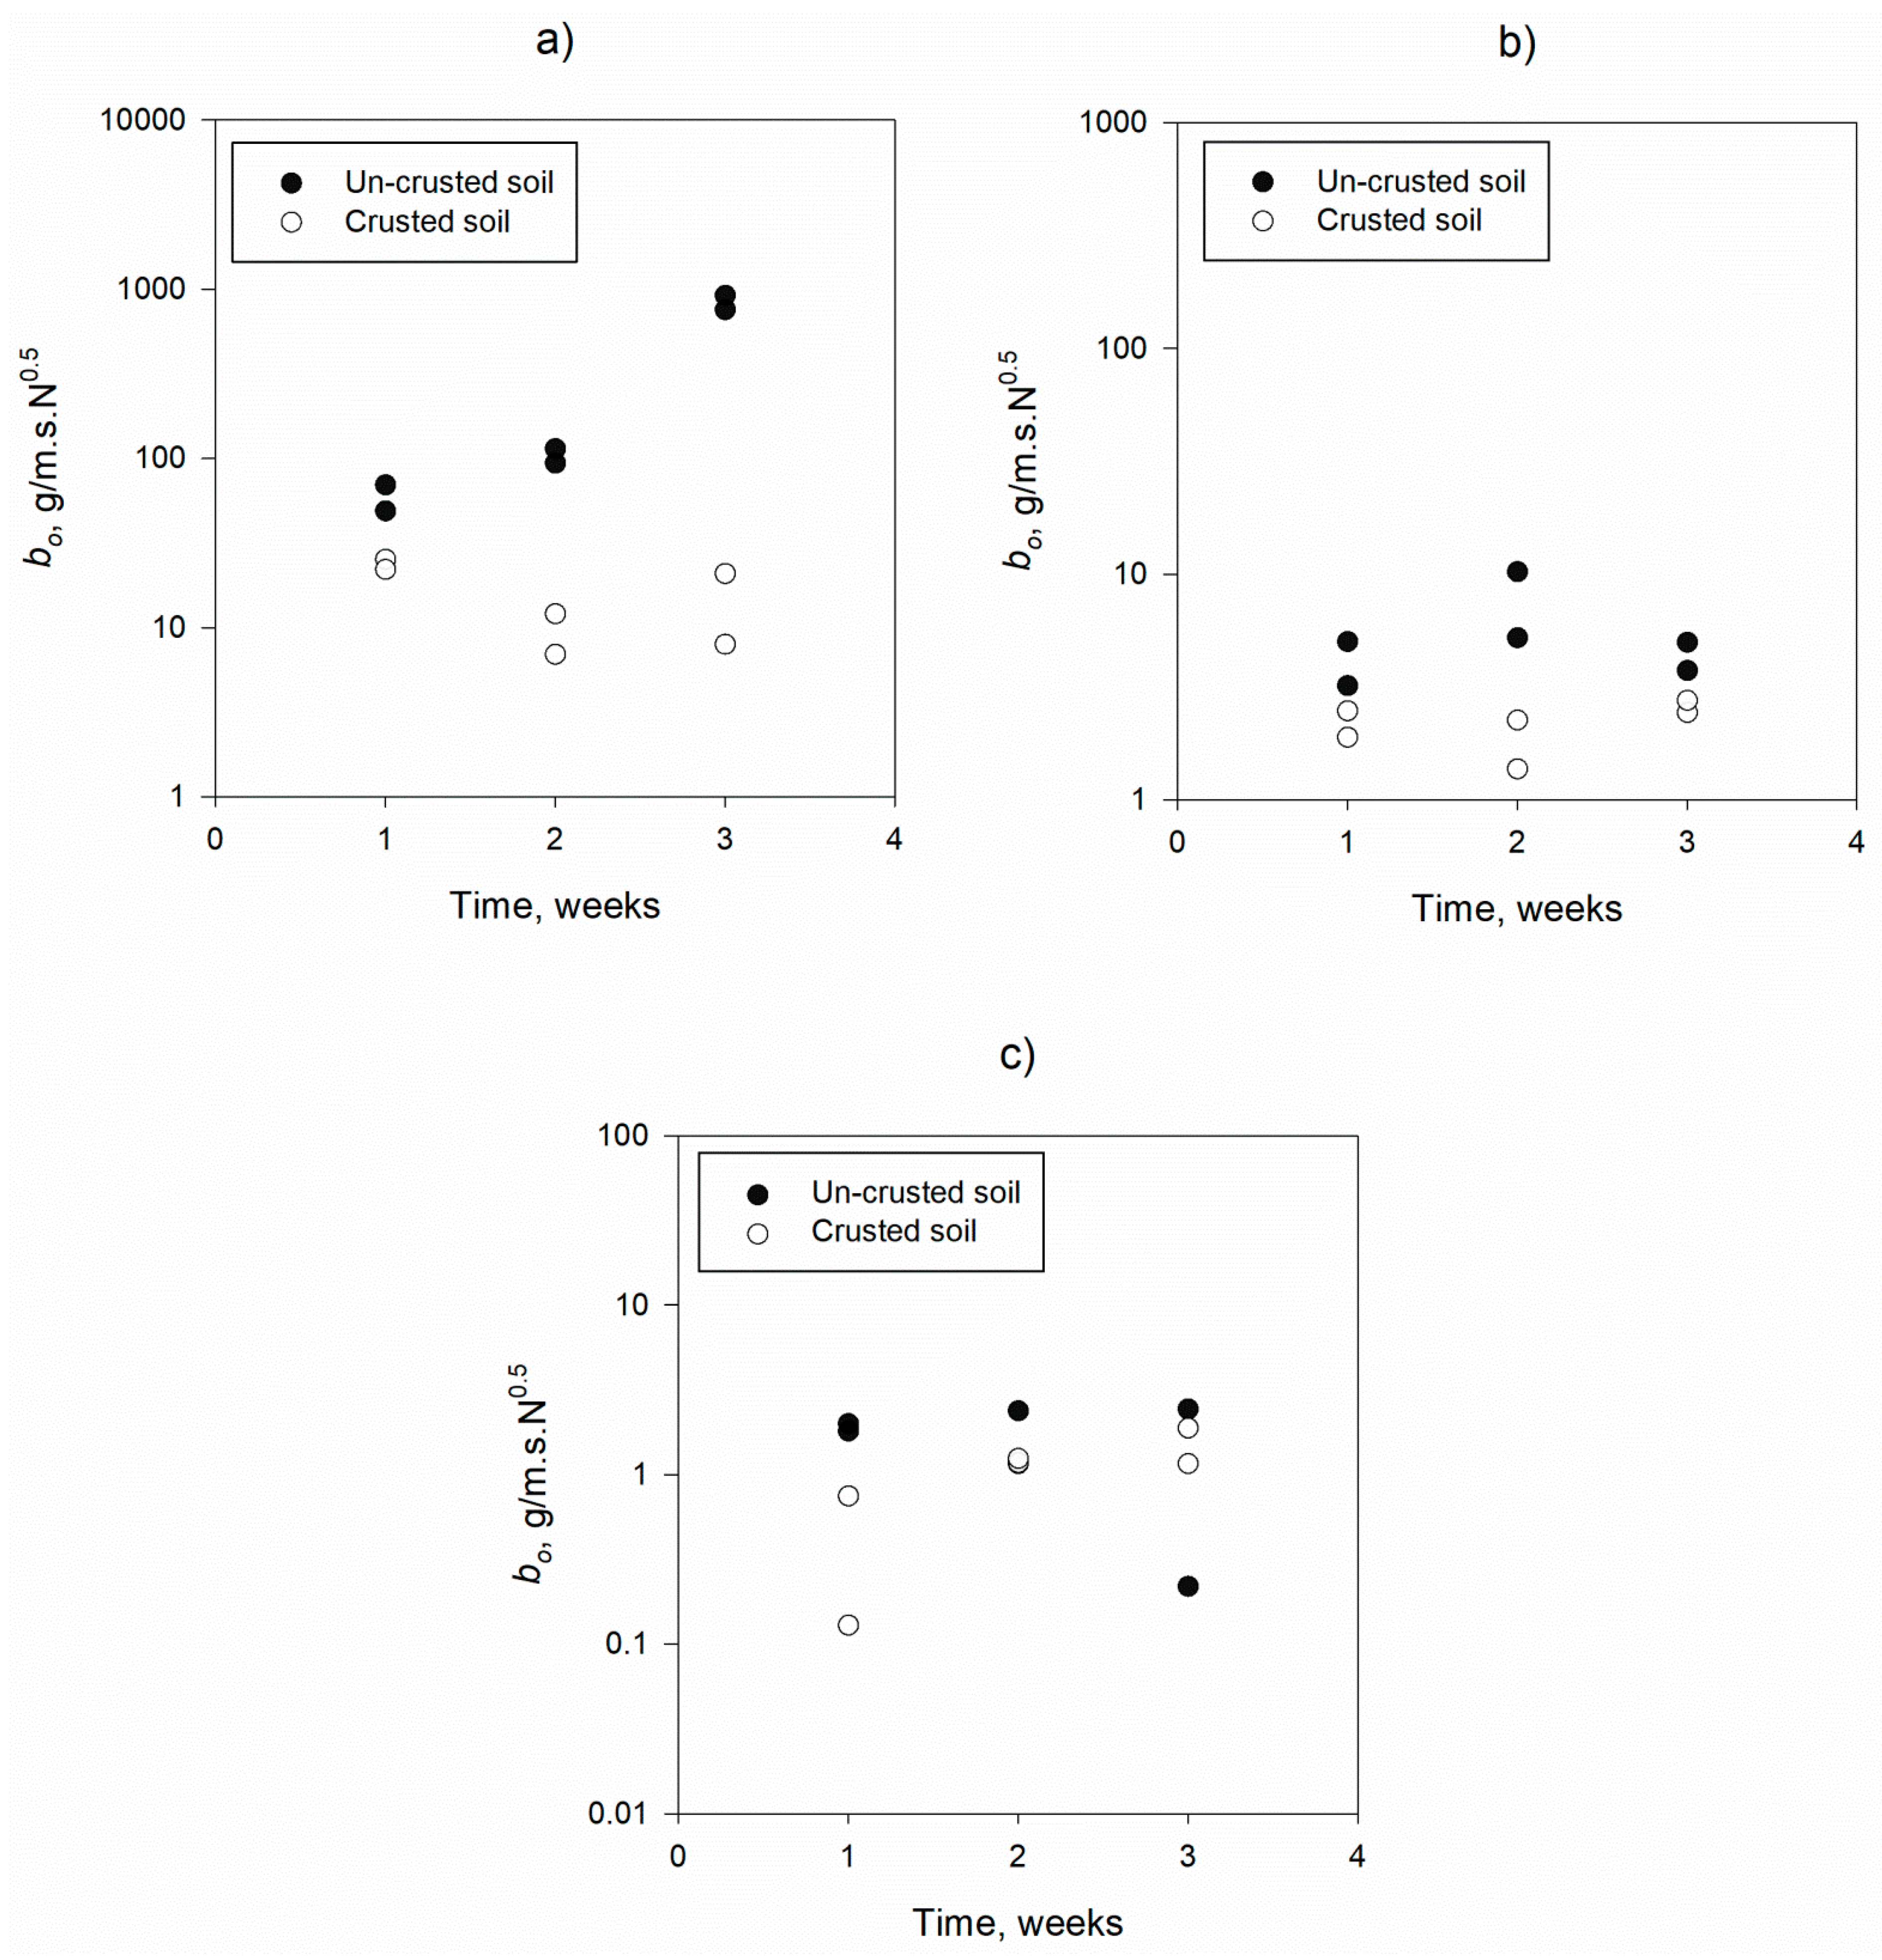
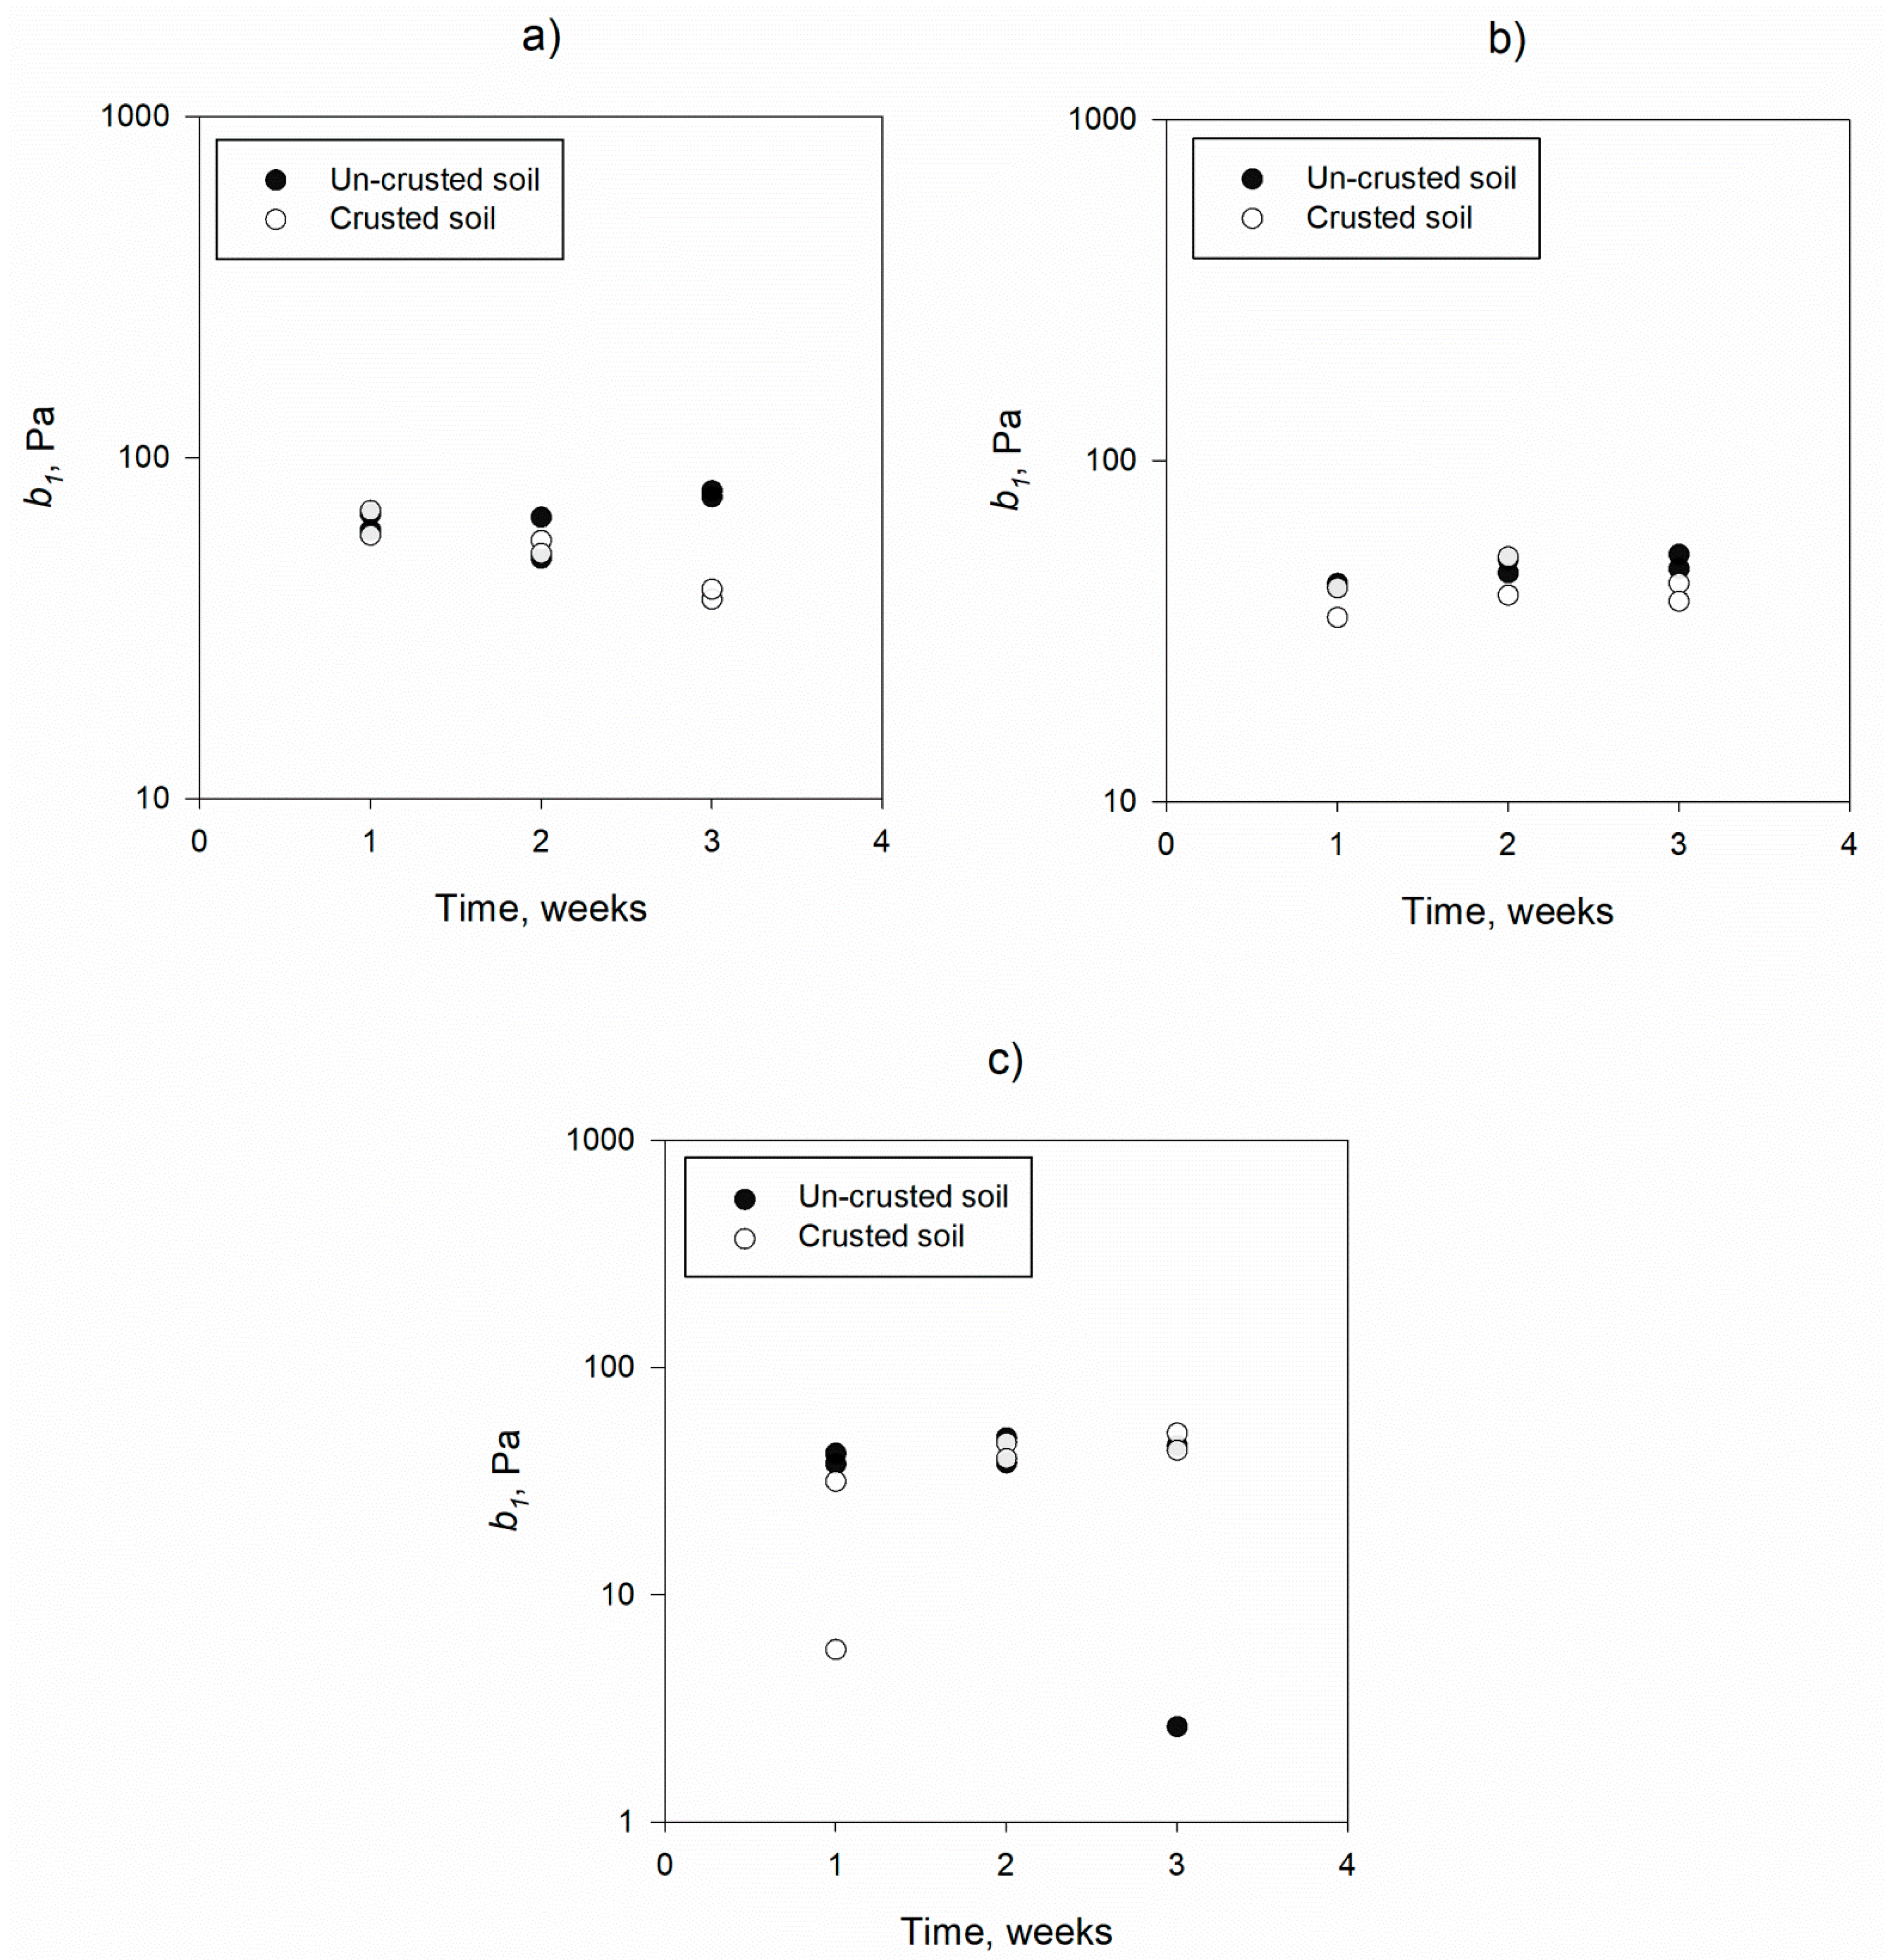
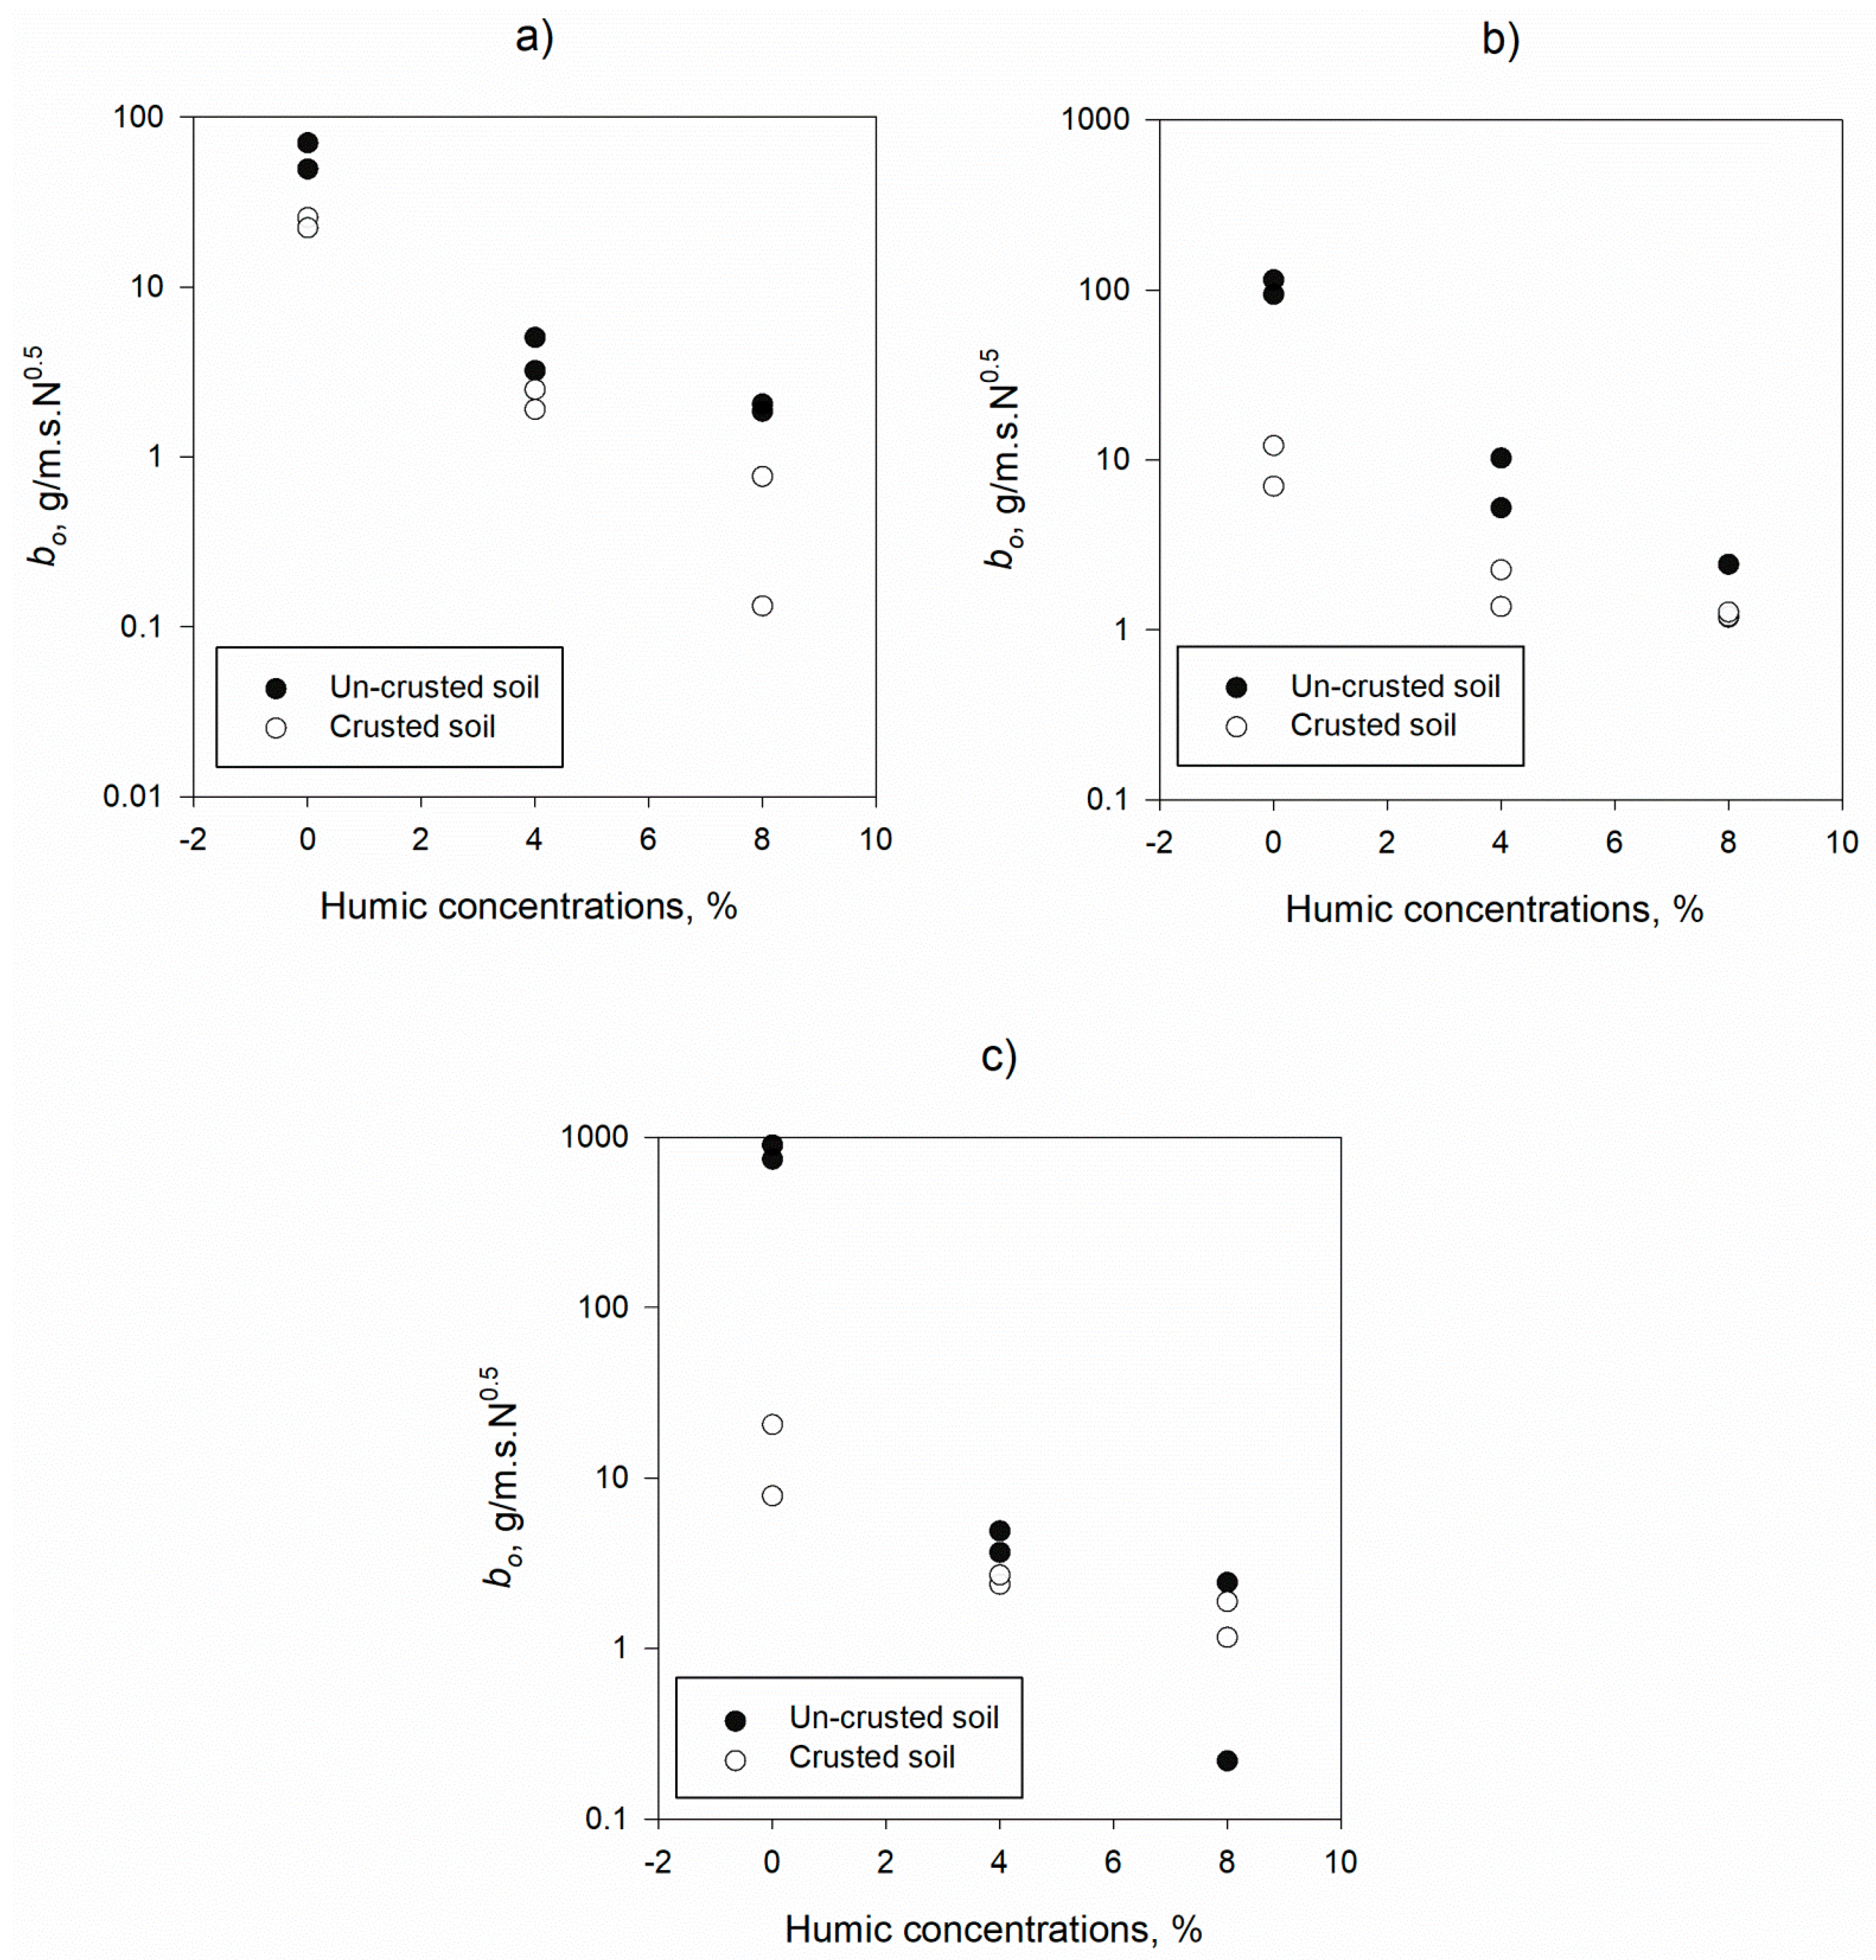
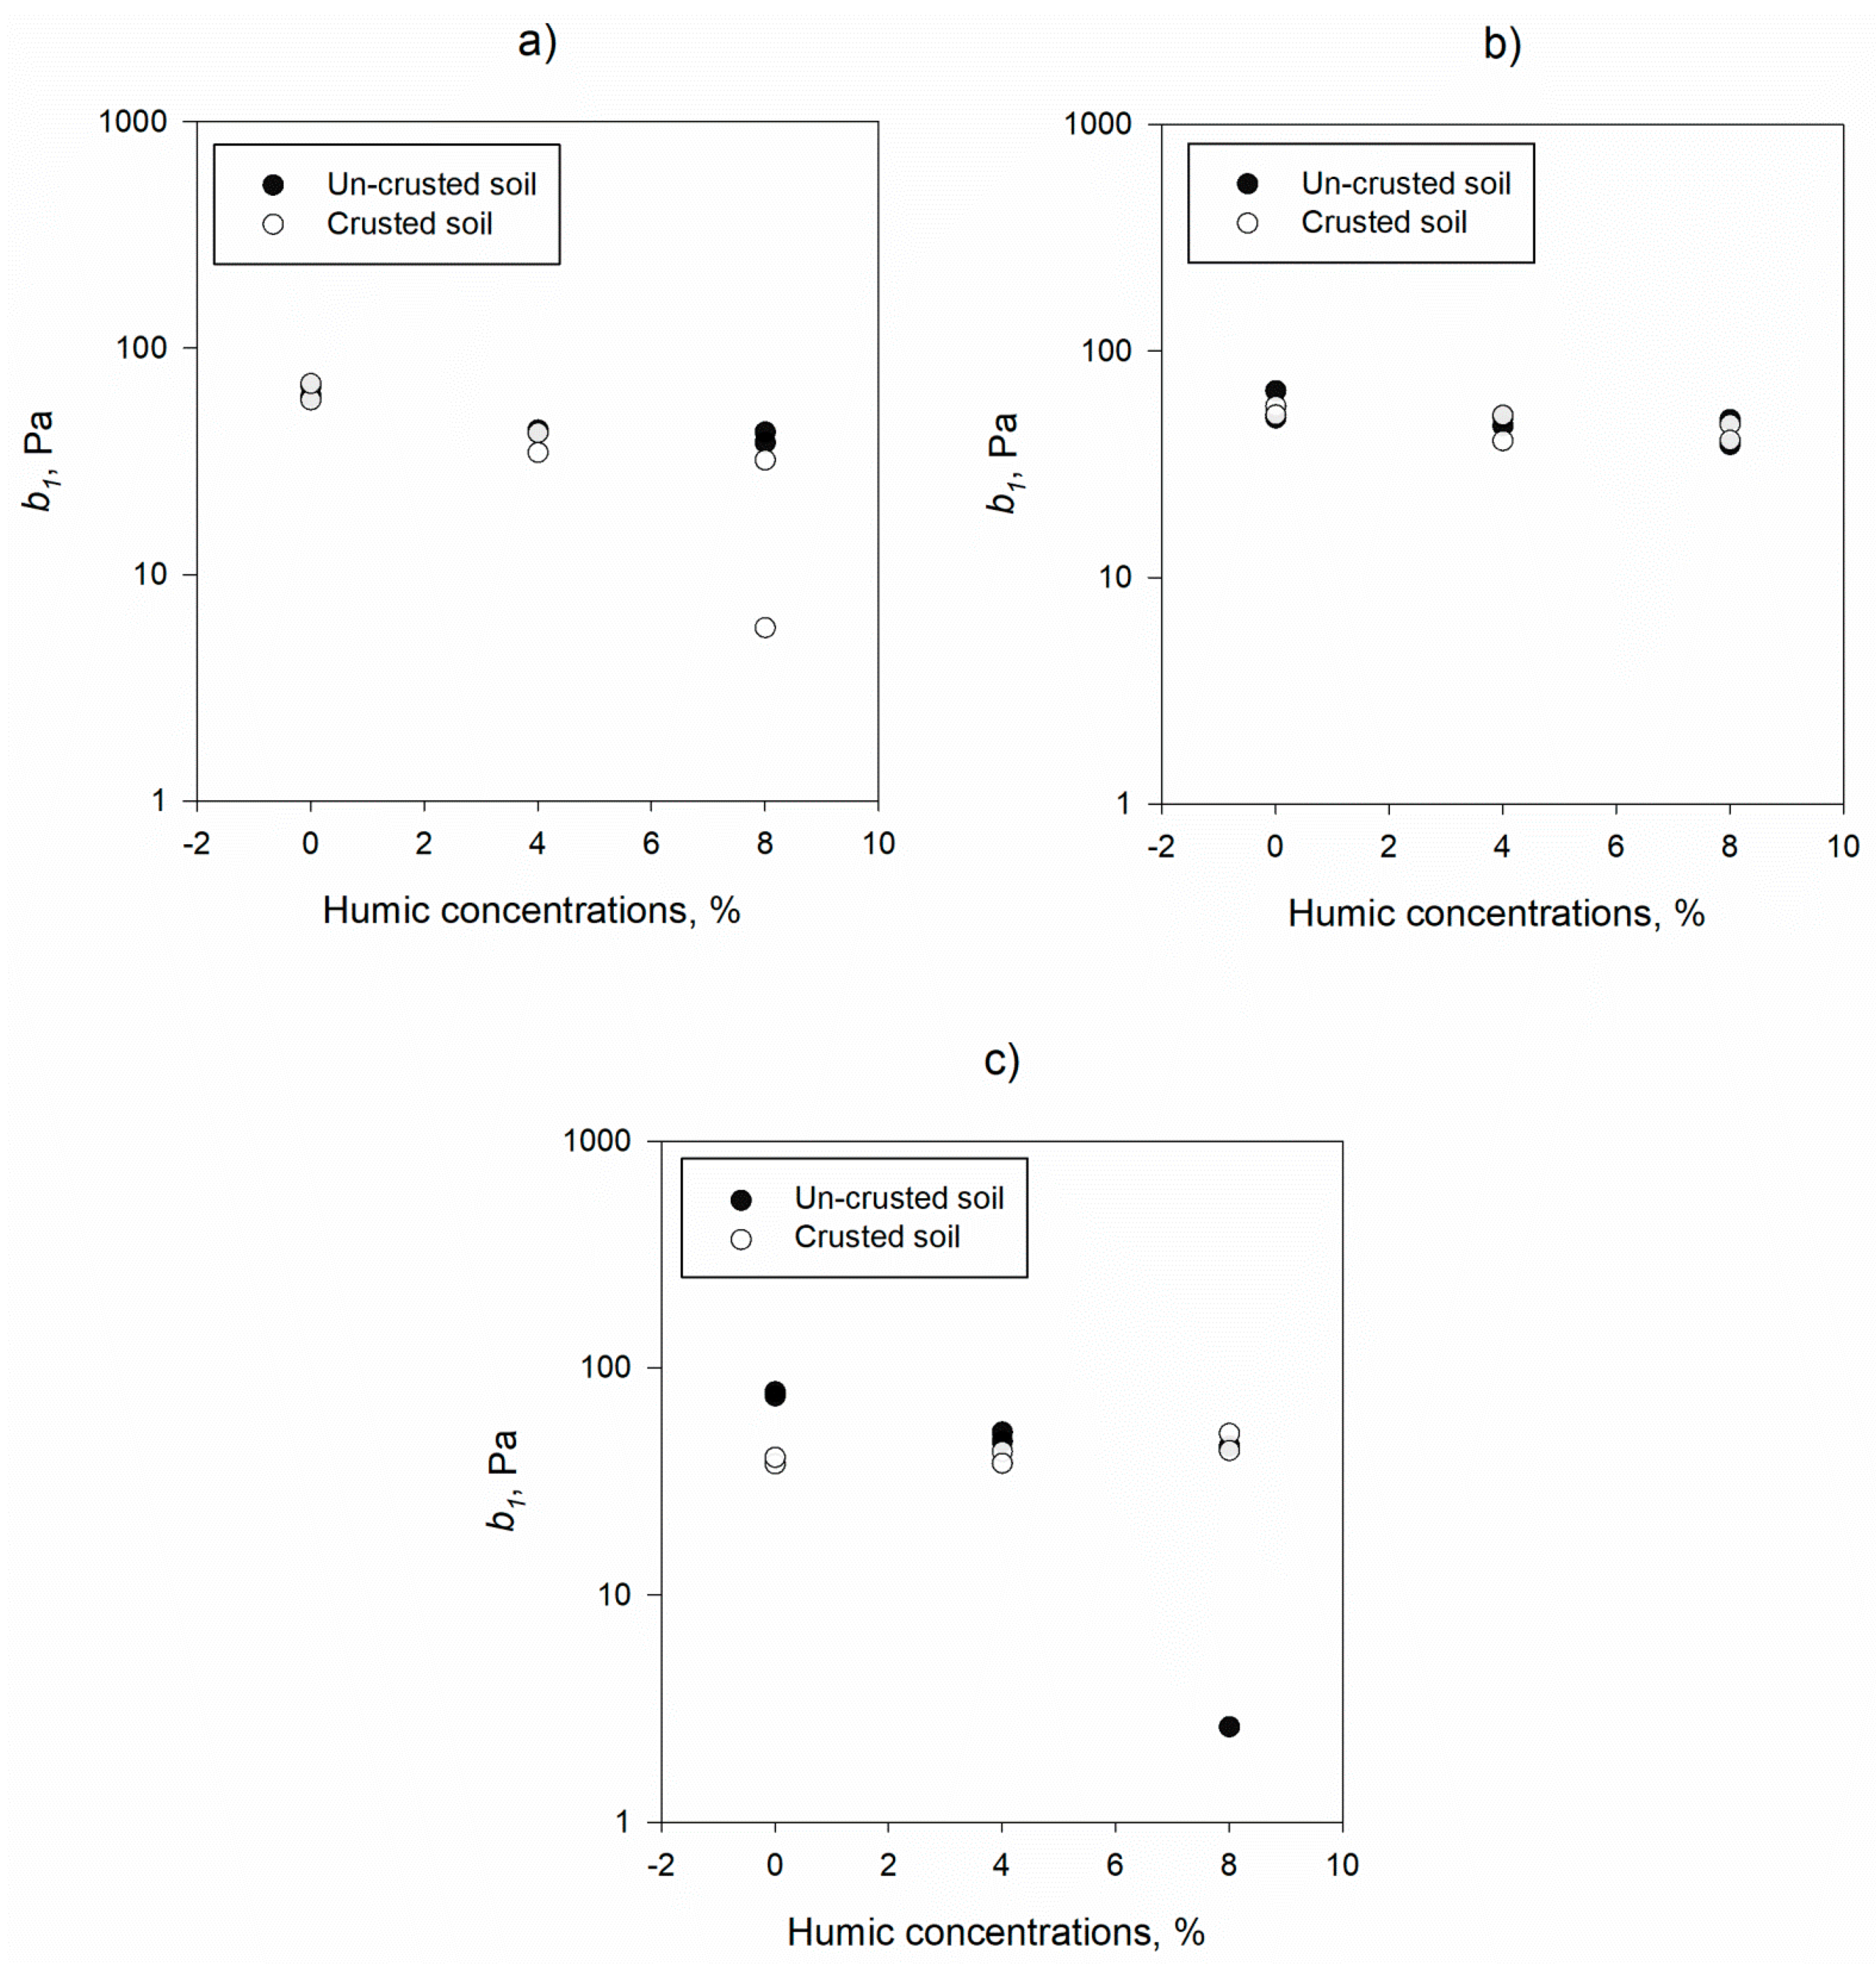
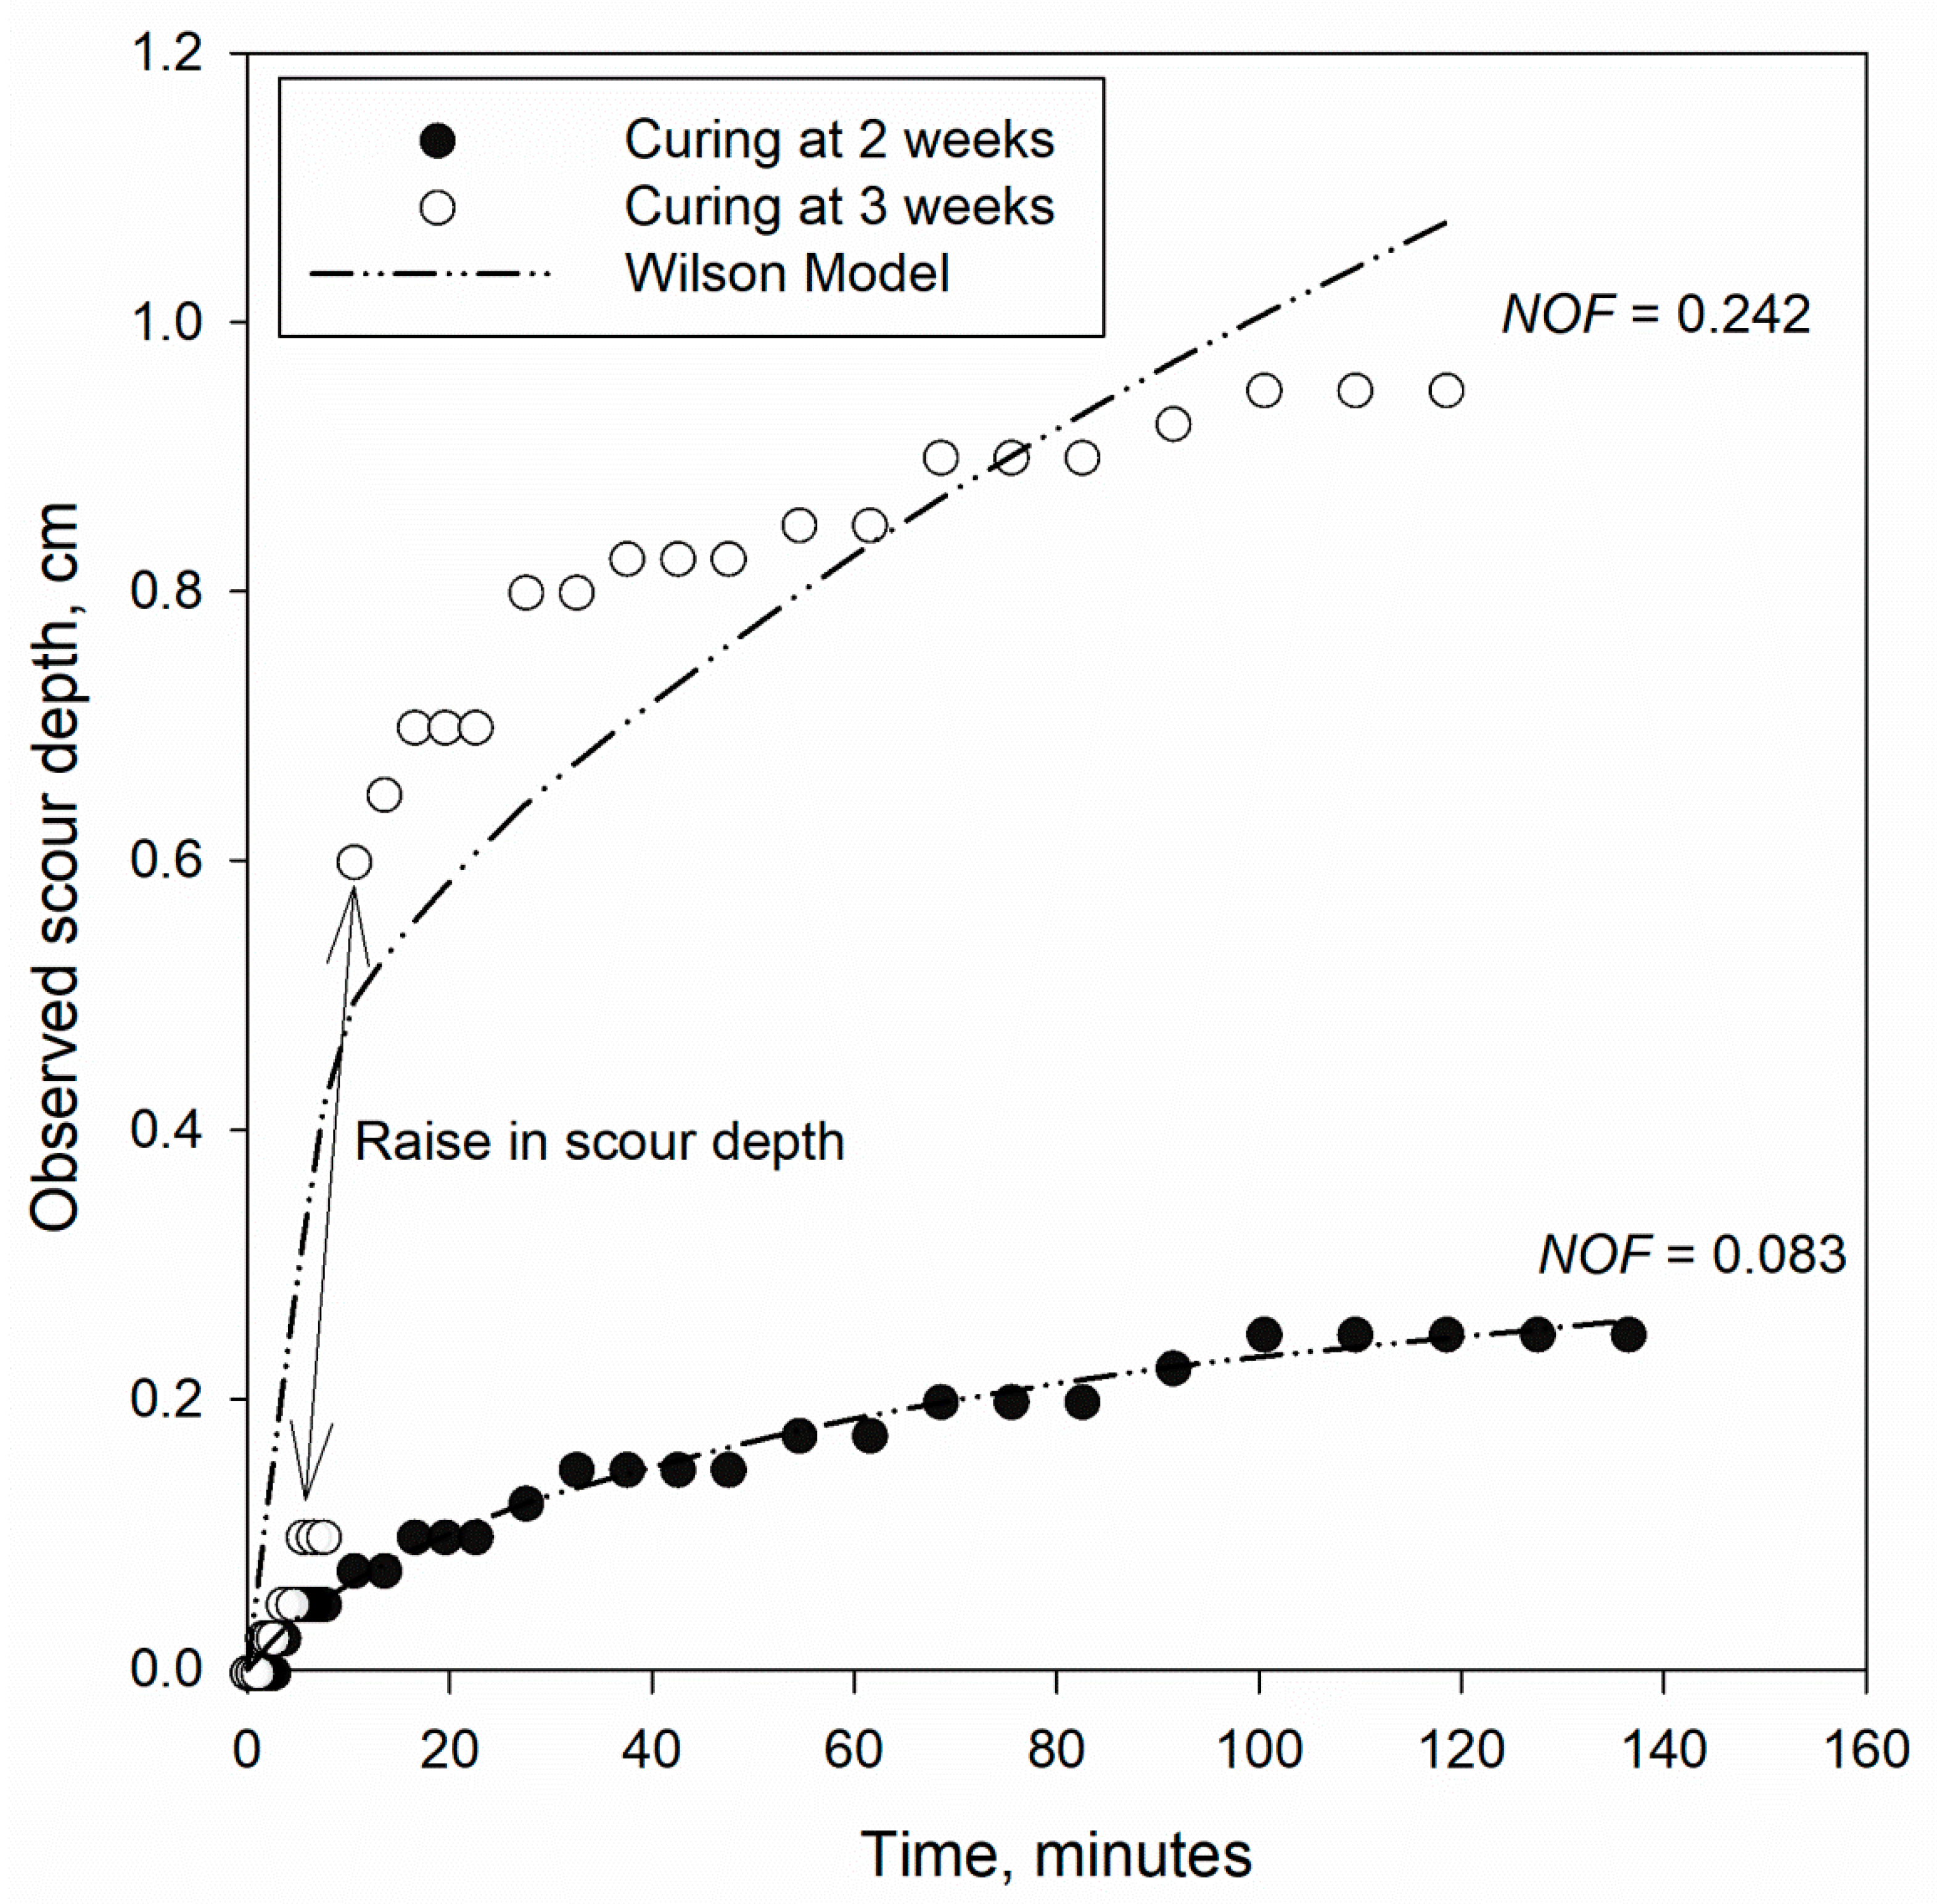
3.1. Mechanistic Detachment Parameters in Presence of Humic Acid

The influence of curing times of 1, 2 and 3 weeks on the dimensional soil detachment parameter (b0) is shown in Figure 3, where the soil samples were measured with different doses of humic acid. For a case without humic acid (Figure 3a) for uncrusted soil, the value b0 increased as curing time increased, whereas for biocrusts, the parameter b0 decreased until it reached its low peak after 2 weeks. The filaments of Chlorophyte, which were able to generate surface aggregates and improve soil stability by creating extracellular polysaccharides, were responsible for the decrease in b0 values of biocrusts.
A reduction in values b0 for crusted and uncrusted soils was observed in the presence of HA at 4% and 8% concentrations, as shown in Figure 3b,c, respectively. At varying curing times and in the presence of HA, there was no consistent behavior of b0. The findings in Figure 3 were confirmed by statistical analysis using paired t-test ANOVA, which compared the mechanistic detachment parameters (b0 and b1) of crusted and uncrusted soils at different humic acid concentrations (Table 2). In the absence of humic acid, there was a statistically significant difference in b0 between uncrusted and crusted soils (p = 0.031). For the cases of humic acid (4% and 8%), the results indicated that there was no statistically significant difference of b0 for uncrusted versus crusted soils (p > 0.050).
Figure 4 shows the effect of curing durations of 1, 2, and 3 weeks on the dimensional soil threshold parameter (b1), which was tested with varied concentrations of humic acid. In the absence of humic acid, there was no consistent behavior of b1 at different curing times for crusted and uncrusted soils (Figure 4a). Hashim et al. [20] found similar results for critical shear stress in a linear model. An occasion with humic acid produced similar outcomes for parameter b1 (Figure 4b,c). Table 2 confirms the findings of b1 values in Figure 4. There was no statistically significant difference between crusted and uncrusted soils for humic acid, and no humic acid cases with a p-value of more than 0.05 (Table 2).
Figure 5 illustrates the behavior of b0 for a case with no HA, a case with 4% HA, and a case with 8% HA, where the soil samples were measured at different curing times, in order to explore the influence of HA concentrations on parameter b0. For both crusted and uncrusted soils, and for all curing durations, Figure 5 indicates that the value b0 declined as HA concentration increased. Statistical analysis using paired t-test ANOVA in Table 2 confirms the findings in Figure 5. There was no statistically significant difference in b0 between uncrusted and crusted soils, except for the case with no humic acid.
The influence of HA concentrations on parameter b1, which were tested with different curing durations, are shown in Figure 6. There was no consistent behavior of b1 for crusted and uncrusted soils at varied curing times in all cases (Figure 6). As mentioned above, Table 2 confirms the findings of b1 values in Figure 6.

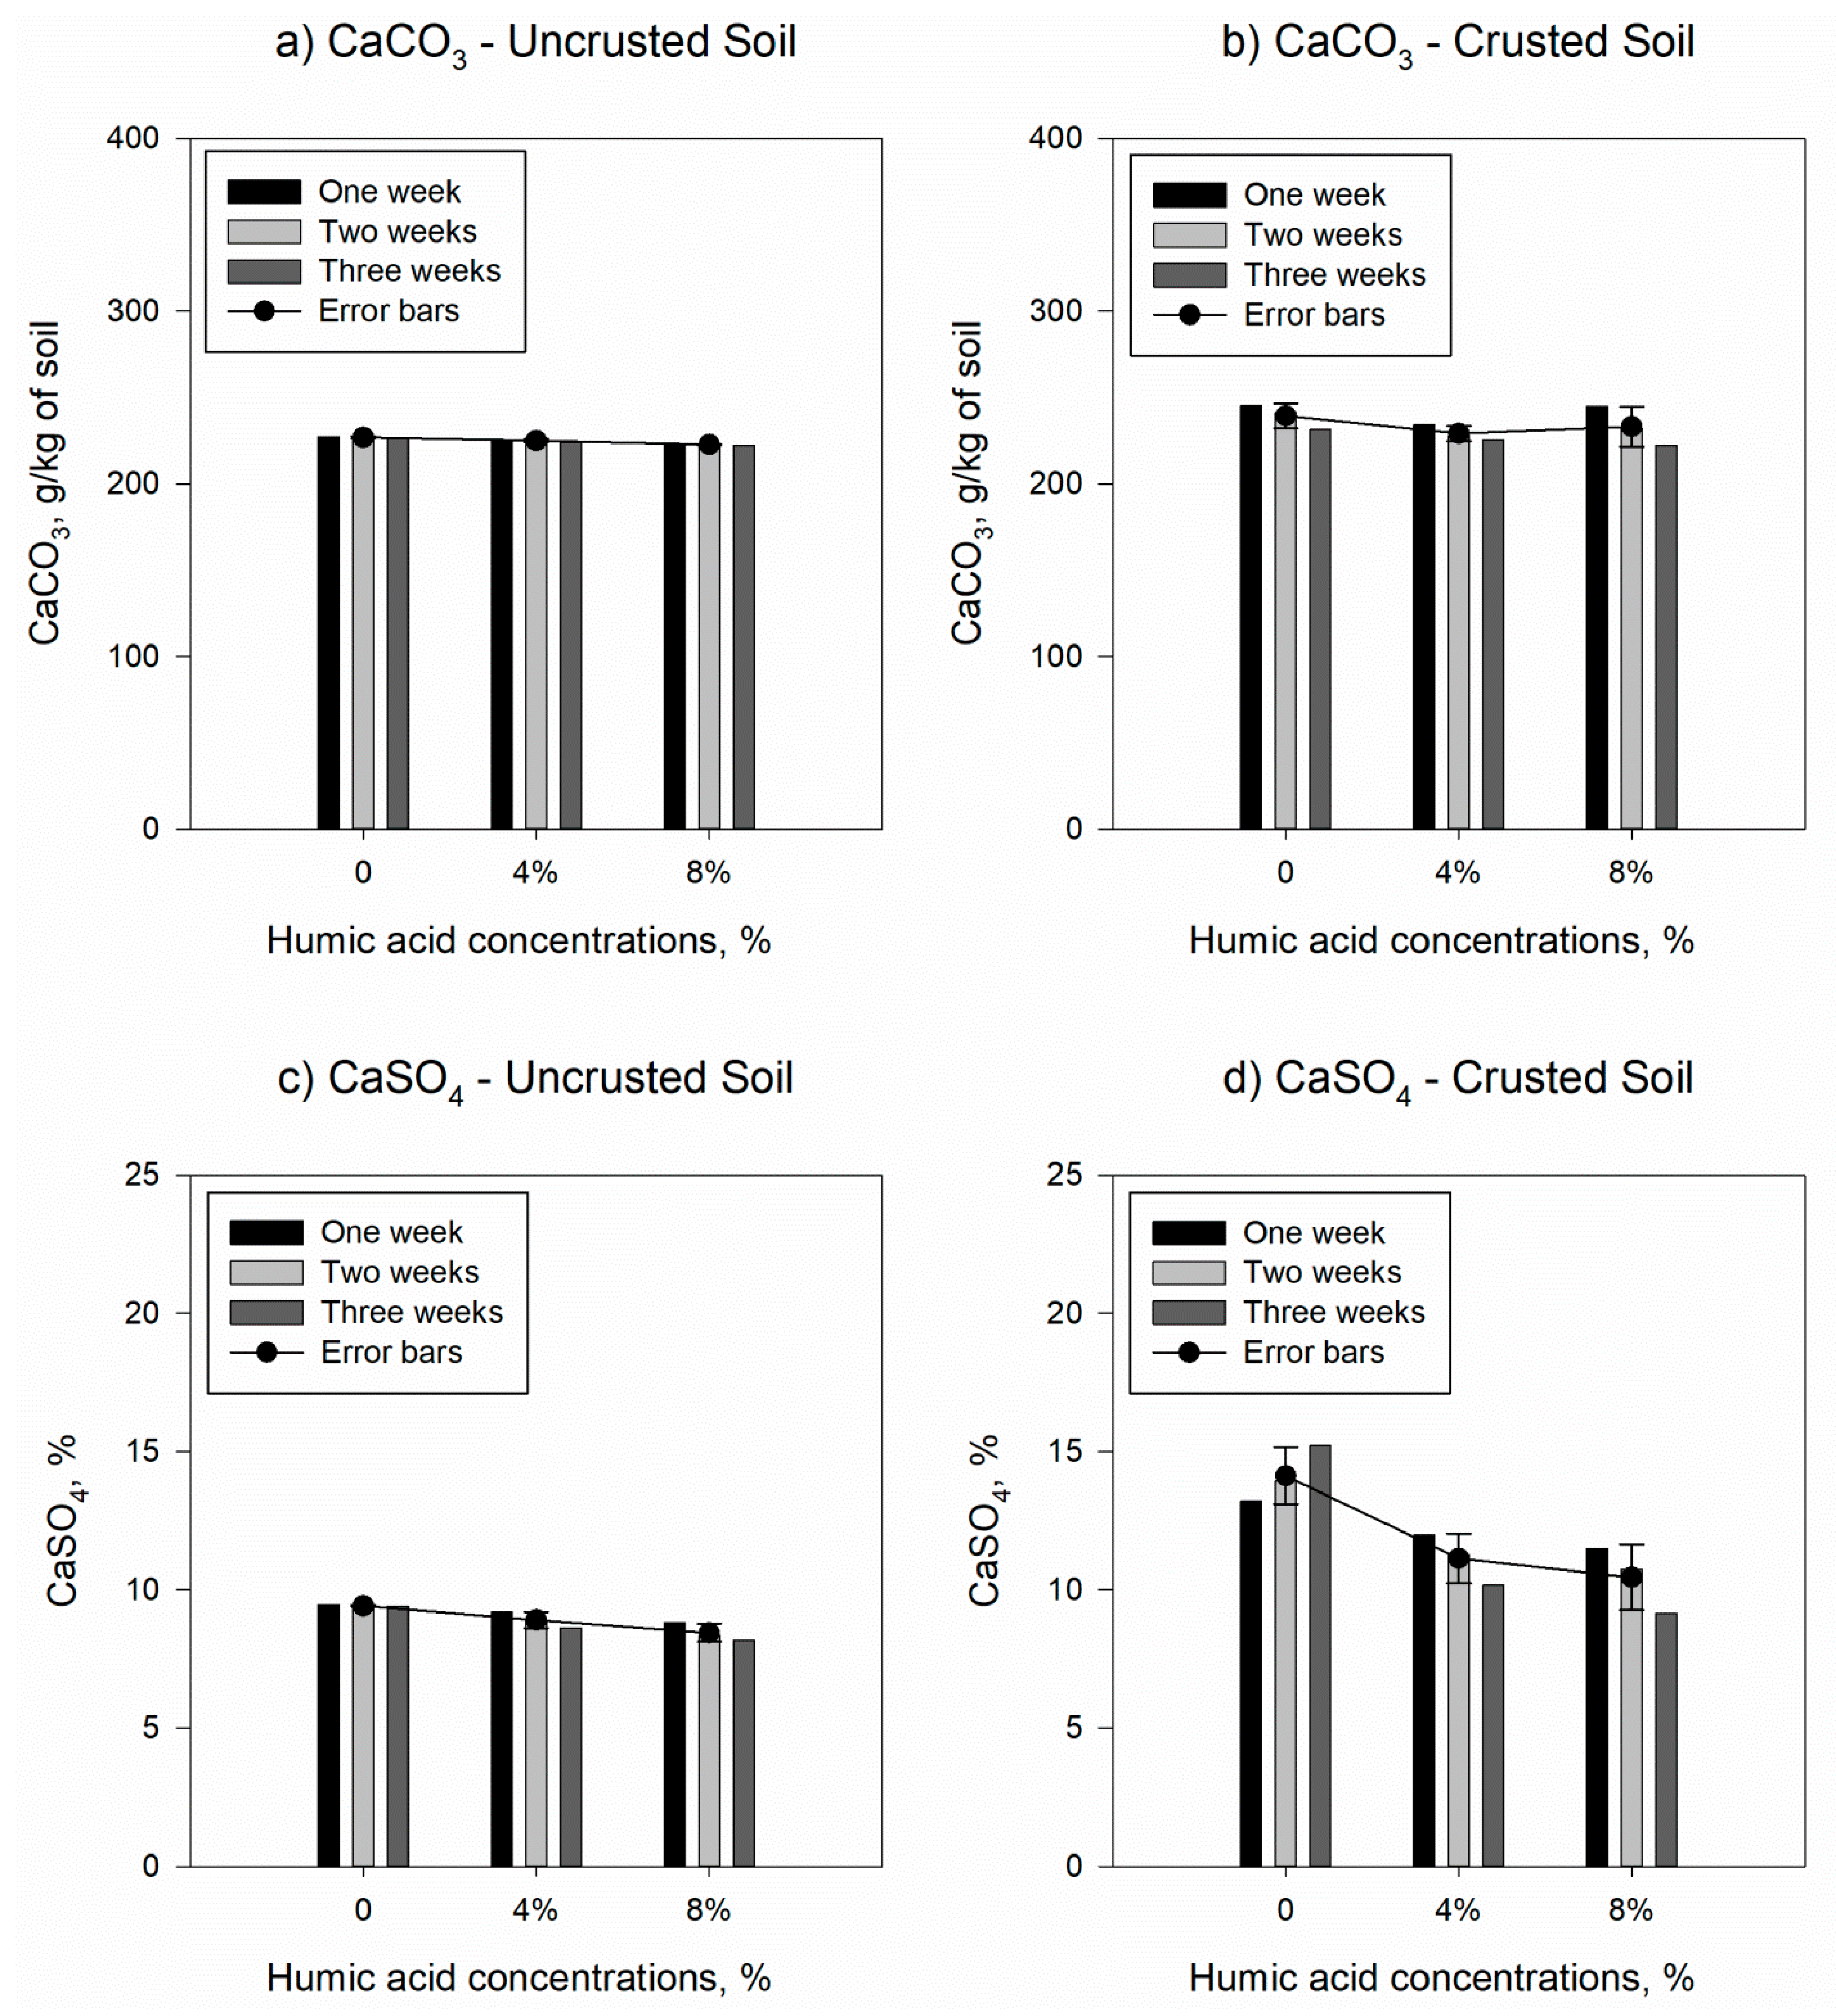
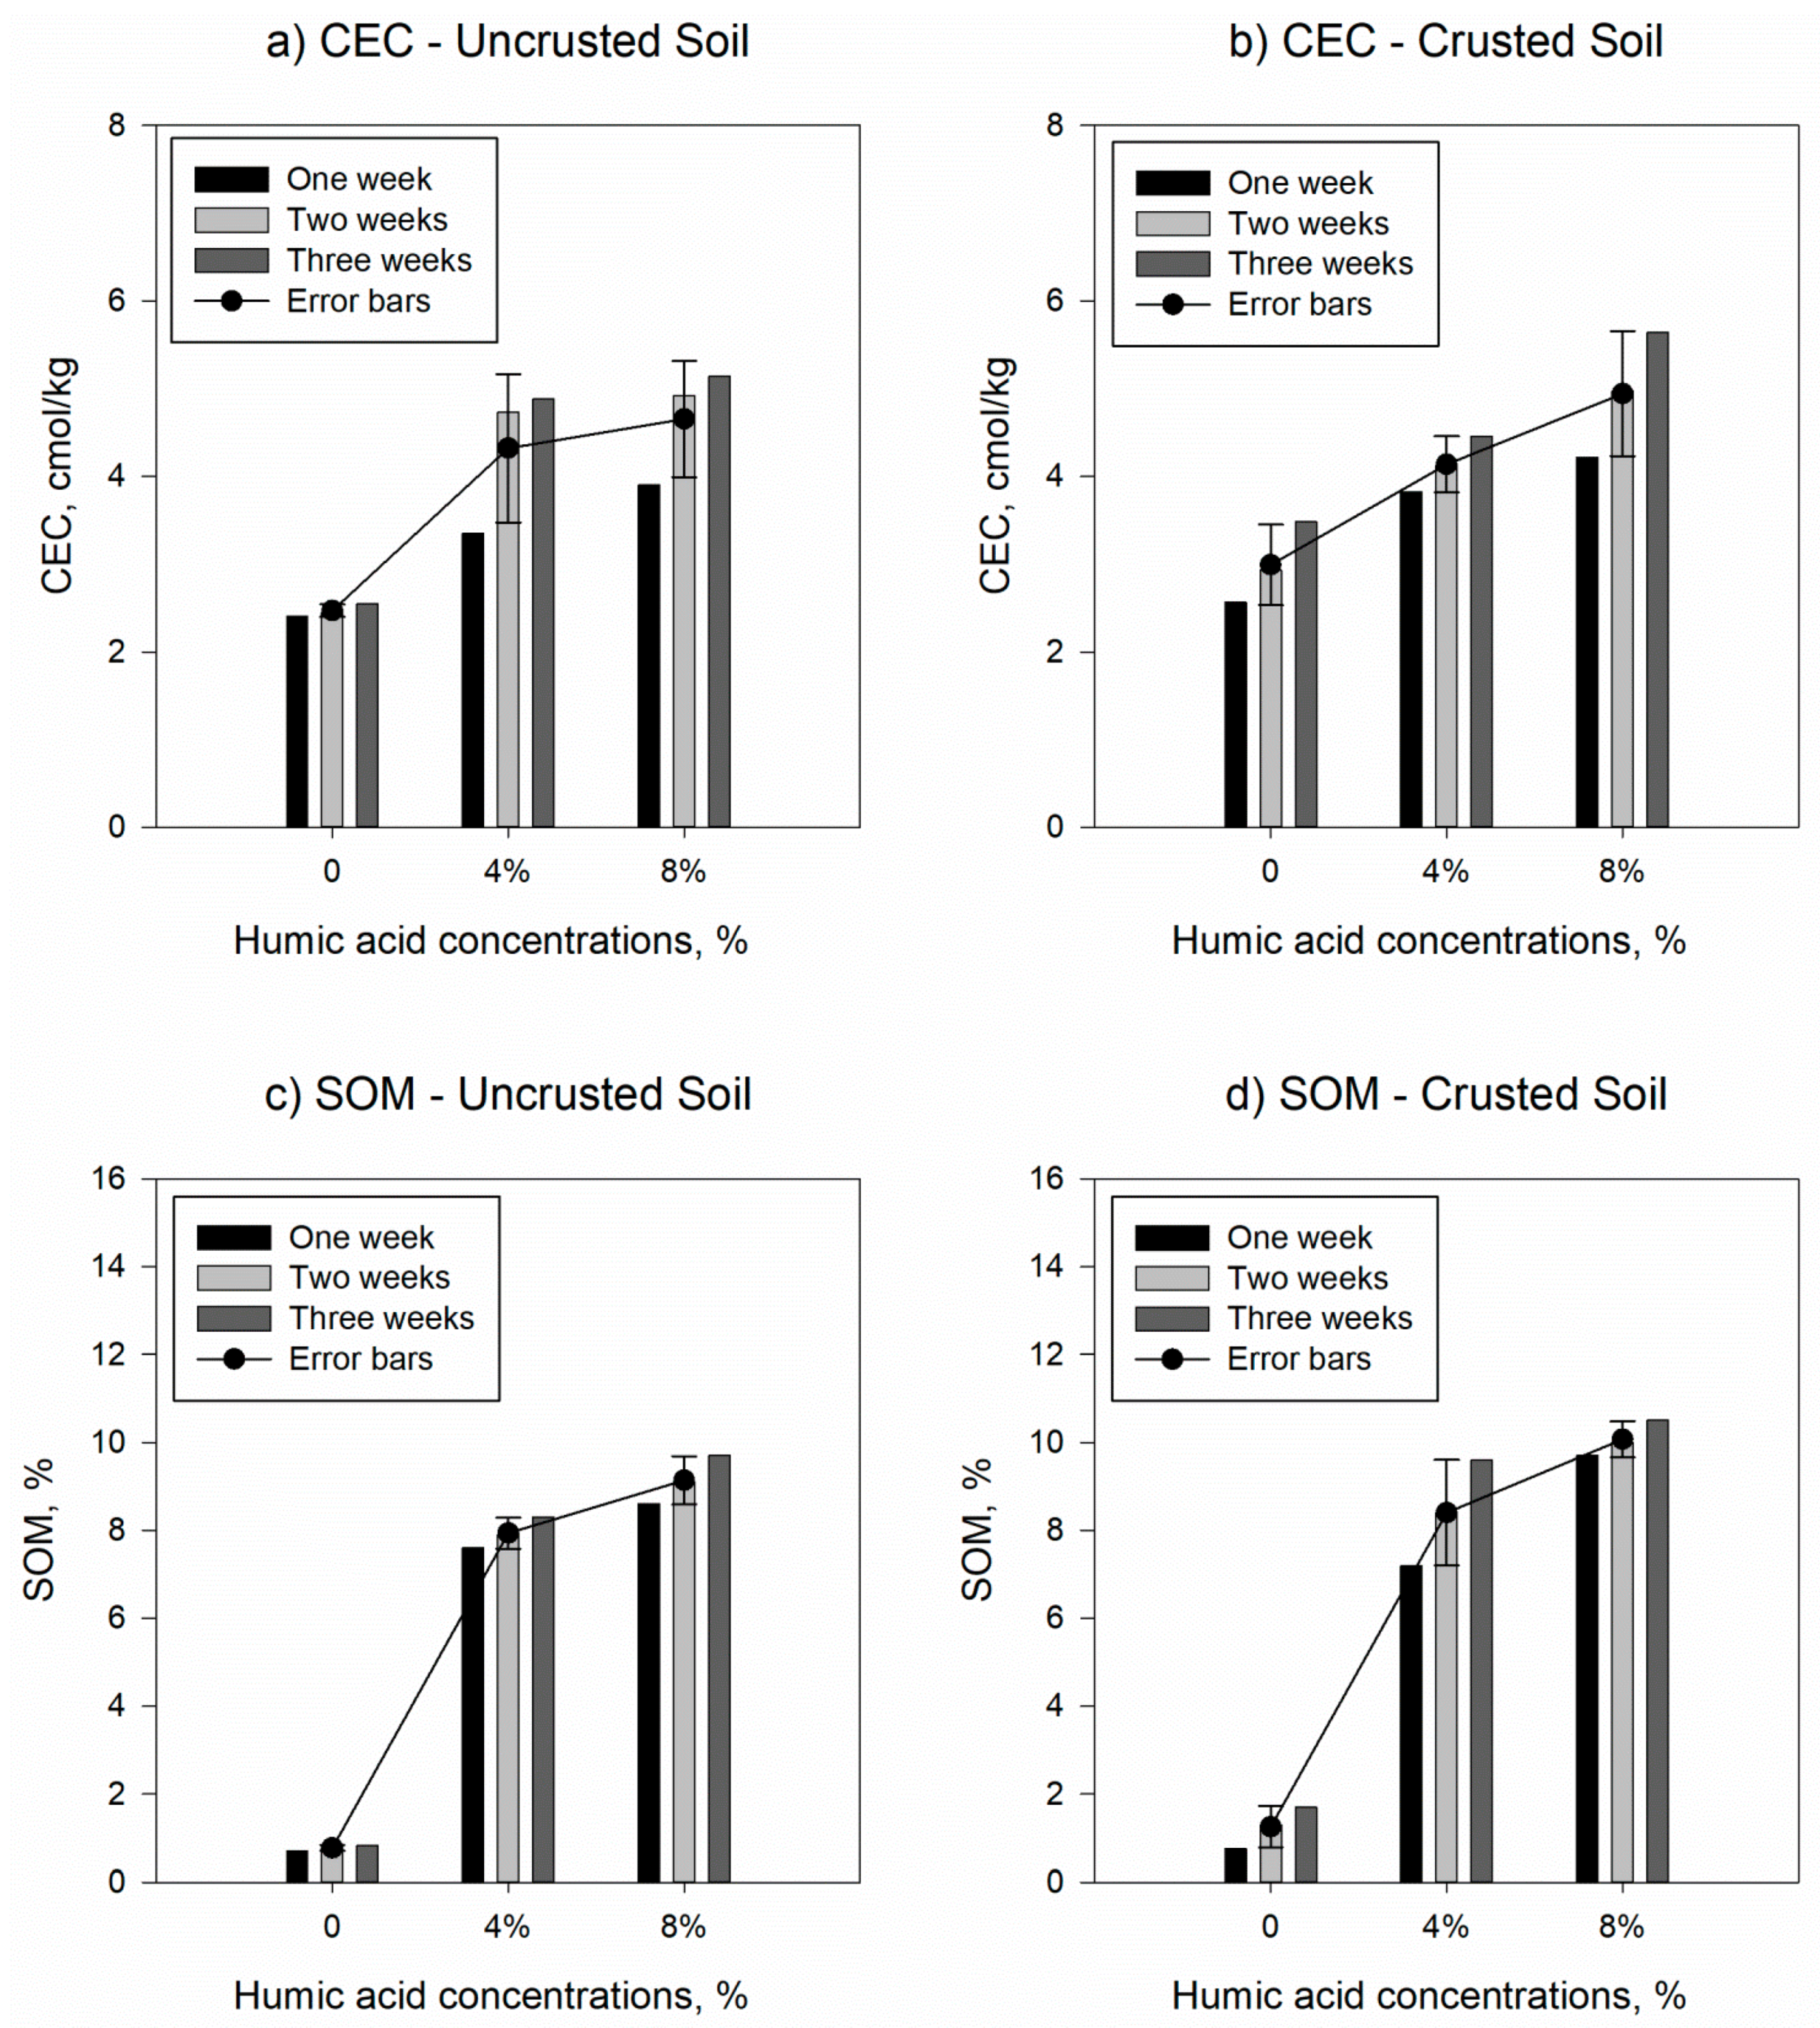
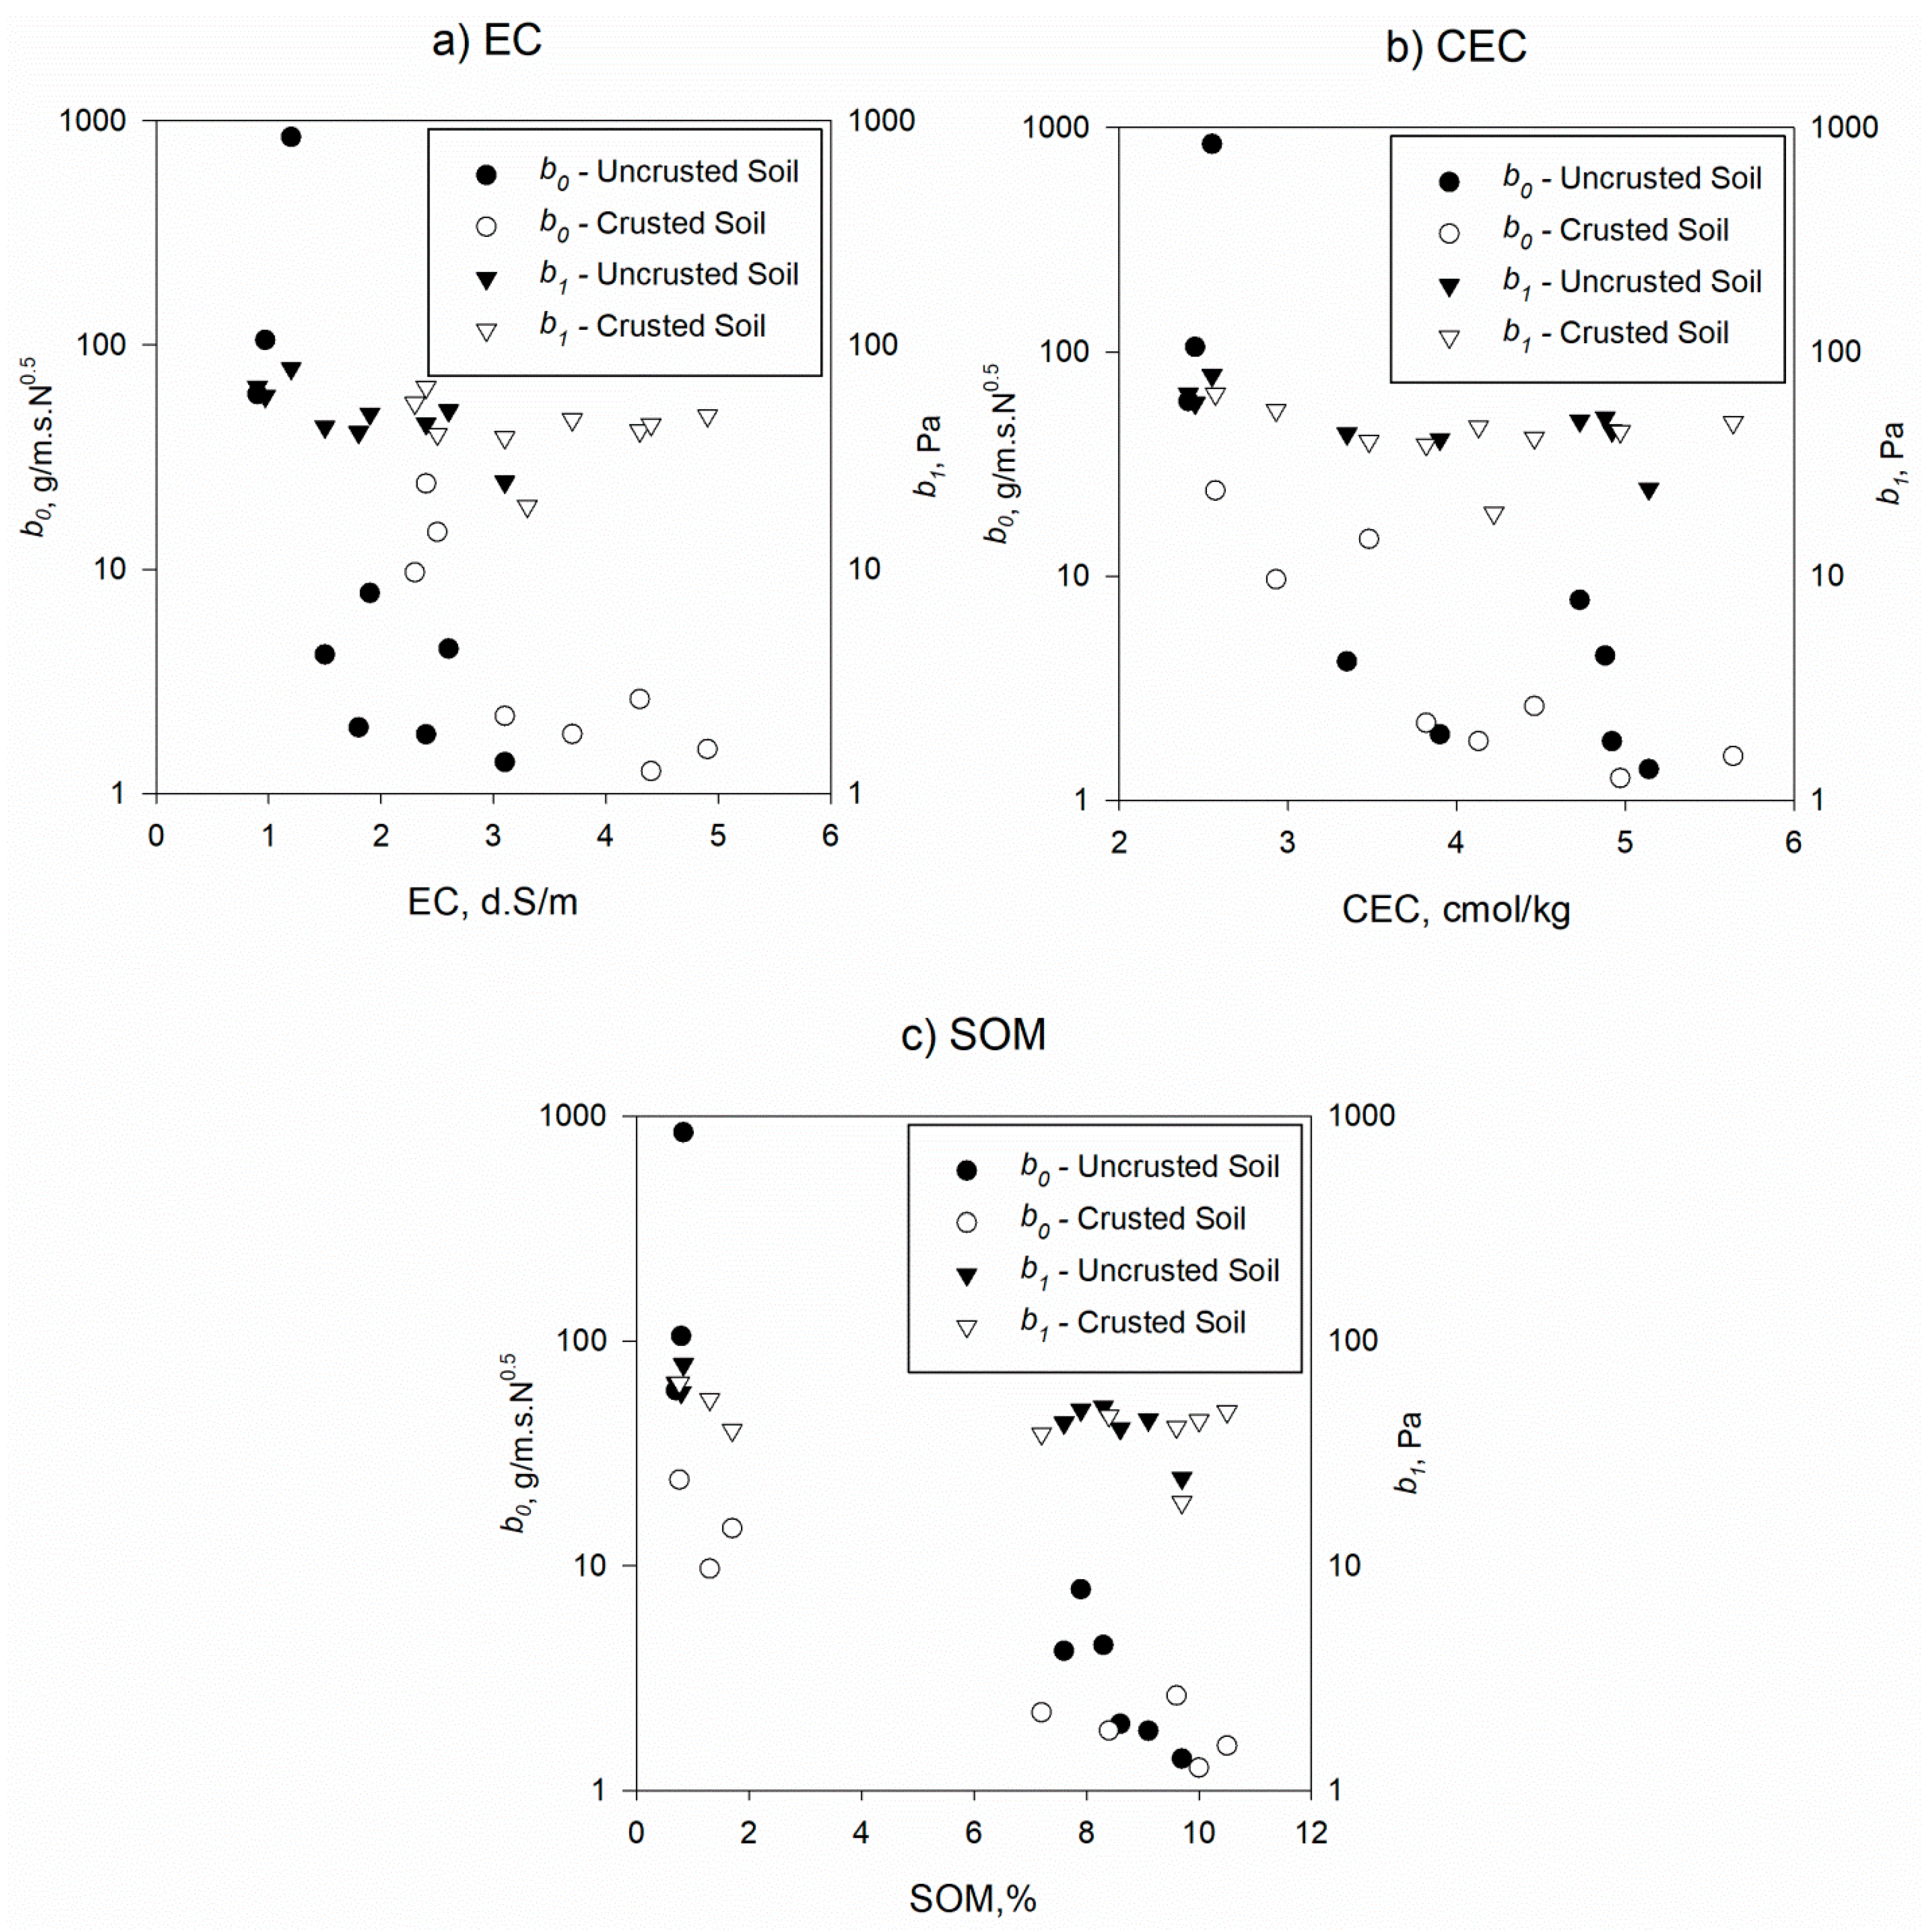
3.2. Influnce of Humic Acids on Soil Charecteristics

In order to investigate the HA influence on soil characteristics, X-ray fluorescence (XRF) analyses were performed to determine the components of tested samples. Table 3 shows that the CaO was found in concentrations ranging from 16.24 to 14.76%, whereas SiO2 was found in concentrations ranging from 39.27 to 34.36% as determined by XRF analysis. This is owing to the calcareous structure of the crust. The average content of Al2O3 was roughly 8.62%, according to an estimate from XRF analysis. Fe2O3 accounted for 5.25% of the total elements. The average MgO content was 4.37%. All of the samples analyzed had simple but substantial changes in their chemical composition (oxides). The CaO and SiO2 concentrations were higher in samples with humic acid than in samples without humic acid, especially with crusted soils.
In order to examine the impact of HA on erosion parameters b0 and b1 versus some soil characteristics, the influence of HA was first investigated on several soil characteristics in order to determine which soil characteristics would be chosen. With crusted soils, the results showed that there was a slight decrease in soil pH of 7.37, 7.10, and 6.98 for a 4% concentration of HA, and 7.09, 6.78, and 6.32 for an 8% concentration of HA, as compared with soil pH with no humic acids of 7.51, 7.49, and 7.45 for one week, two weeks, and three weeks of curing times, respectively (Figure 7b). Different results were observed for uncrusted soils (Figure 7a). Various functional groups in humic acid, which neutralize the soil pH, caused a slight increase in pH. Similar results were reported by SÖNMEZ and Şevket [43] and Çelik et al. [44] for uncrusted soils.
With crusted soil, as shown in Figure 7d, EC(electrical conductivity) values increased significantly in comparison to a high HA application rate. According to a 4% dose of HA, the EC was 1.8, 2.32, and 2.98 d.s/m and for an 8% dose of HA, the EC was 2.5, 3.1, and 3.42 d.s/m as compared with the control sample of 1.5, 1.9, and 2.4 d.s/m for 1 week, 2 weeks, and 3 weeks, respectively. The same results were observed for uncrusted soils, revealing that soil EC linearly increased in response to increments in HA dose. Even higher values of EC for crusted soils in comparison to uncrusted soils (Figure 7c,d). As a result of the present and previous studies, the increase in HA dose is associated with an increase in soil EC level. Experiments with varied dosages of HA may have higher EC values because the HA materials added have some counter ions in solution (such as K+ or Na+) along with negatively charged HA molecules that increase EC organic particles [45].
There is a significant calcium carbonate content (CaCO3) in the soil. The results of the crusted soil in Figure 8b demonstrate a slight decrease in CaCO3 content as the percentage of humic acids increases. After one week, two weeks, and three weeks at 4% HA, the lime content was 229.12, 227.94, and 225.38 g/kg of soil, respectively, and 228.3.1, 226.09, and 222.17 g/kg of soil, respectively, at 8% HA. For soils with no humic acid, the CaCO3 content was 231.23, 241.24, and 248.6 g/kg of soil at one week, two weeks, and three weeks, respectively. This reduction can be explained by the humic acid’s release of carbon dioxide (CO2) from calcium carbonate. As a result, carbon dioxide in the soil solution reacts with water to generate carbonic acid, which subsequently separates into its ions, with the hydrogen ions reducing the soil pH as proposed by SÖNMEZ and Şevket [43]. SÖNMEZ and Şevket [43] gave the same results. For uncrusted soil, there was no influence either of humic acid or of curing times on CaCO3 (Figure 8a). Another key chemical component in soils is calcium sulfate (CaSO4). Both crusted and uncrusted soils showed a decrease in CaSO4 as the humic acid dose increased (Figure 8c,d). In comparison to uncrusted soils, crusted soils had an even higher CaSO4 content.
Figure 9a,b indicate that soil CEC increased as humic acid increased, reaching a peak after three weeks. At three weeks of curing time, the CEC of the control soil (soil with no humic acid) was 3.48 cmol/kg in crusted soil (Figure 9b). The CEC for a 4% HA treatment was 4.46 cmol/kg, and for an 8% HA concentration, it was 5.64 cmol/kg. In comparison to the control soil, HA treatments considerably enhanced CEC. The same results were observed with crusted samples (Figure 9a).
The different concentration treatments of HA significantly affected the soil organic matter content (SOM) based on error bars of standard deviation (Figure 9c,d). The results of the crusted soils (Figure 9d) showed that SOM increased with the concentration of HA. The values of SOM were 7.2%, 8.4%, and 9.6% for the 4% dose of HA, 9.7%, 10%, and 10.76% for the 8% dose of HA, and 2.56%, 2.87%, and 3.12% for no humic acid soil at 1 week, 2 weeks, and 3 weeks, respectively. The same results were obtained for samples without a crust (Figure 9c). It is interesting to note that the level of SOM was the same for uncrusted soil in the case with no HA in comparison to crusted soil. This was due to the absence of biological shell and humic acids.
The results from Figure 7, Figure 8 and Figure 9 indicated that HA had an influence on EC, CEC, and SOM for crusted and uncrusted soils. Accordingly, Figure 10 presents the relationships between mechanistic soil erodibility parameters (b0 and b1) and EC, CEC, and SOM, for crusted and uncrusted soil samples with and without humic acids. Parameter b0 decreased as EC increased, while there was no general trend for parameter b1 (Figure 10a). The EC was 0.9 d.S/m initially at one week of curing time for uncrusted soil (without HA) and reached 4.9 d.S/m at the third week of curing time for crusted soil (with 8% of HA). Similarly, parameter b0 decreased as CEC and SOM increased, while there was no general trend for parameter b1 (Figure 10b,c). The CEC and SOM were 2.41 cmol/kg and 0.7% initially at one week of curing time for uncrusted soil (without HA), and reached 5.64 cmol/kg and 10.5% at the third week of curing time for crusted soil (with 8% of HA), respectively.

4. Discussion

For crusted soils with no humic acid, the erodibility coefficient of the linear model from the Hashim et al. [20] study decreased as curing time increased. In the present research, the parameter b0 of the nonlinear model (Wilson model) behaved similarly to the erodibility coefficient of the linear model until it reached its low peak at 2 weeks, after which the b0 increased (Figure 3a). As a result, the b0 of the nonlinear model behaved similarly to the erodibility coefficient of the linear model at different curing times. Hashim et al. [20] conducted their experiments for a maximum of 12 days of the curing period. The current study, on the other hand, was carried out with a maximum curing time of three weeks. The increase in the parameter b0 after two weeks is due to the breaking down of dead algae, which resulted in an increase in scour depth readings (for a single test by mini-JET) as shown in Figure 11.
Figure 11 shows a comparison of scour depth readings and how the Wilson model fits the observed data at 2 and 3 weeks of curing times. The NOF values were 0.242 for 3 weeks and 0.083 for 2 weeks.
When HA is applied to the soil, it has a considerable impact on soil physical, chemical, and biological features [46]. An increase in SOM content due to humic acid results in increased soil aggregation, water-holding capacity, infiltration rate, and water retention. The effect of HA concentrations on b0 for crusted and uncrusted soils (in the current study) revealed a reduction in b0 with increasing HA dose, with the best stability found at an HA concentration of 8% (Figure 5). These results can be explained by humic acid’s ability to accumulate soil aggregates, resulting in decreased soil erosion. These findings were consistent with those of Khaled and Fawy [47], who discovered that soil stability increased as the HA dose increased. Khaled and Fawy [47] claim that HA reduces soil erosion by enhancing the cohesive forces between soil particles. HA improves the exchange capacity and refining features of soil, as well as its structure and physical properties, to increase the absorption of several elements and make them available to plants. The humic acid improved aggregate stability by creating clay-metal-humic connections, which were facilitated by the O-containing, hydrophilic groups of HA, according to Piccolo and Mbagwu [48,49].
Gümüş and Şeker [50] investigated the stability of soil aggregates with varying HA doses (0, 0.5, 1, 2, and 4%) over three curing periods (21, 42, and 62 days). They found that aggregate stability increased slowly with the HA curing period. The same results were obtained in our study for uncrusted soils (Figure 3 and Figure 5). Incubation periods for different organic amendments were examined by Piccolo and Mbagwu [49] for their effect on aggregate stability. Adding HA to soil after 7 and 15 days resulted in the highest aggregate stability values [43]. Aggregate stability decreased by 79% for HA after 40 days of incubation compared to the 7-day values [49]. Soil efficacy improved after 7 and 15 days of HA treatment, but after 40 days there was no significant difference. As a result, the efficacy of HA alone peaked at 15 days.
In comparison to a high HA dose, Gümüş and Şeker [50] discovered that EC values increased dramatically. Our research yielded the same results, as shown in Figure 7c. Hashim et al. [20] found that the erodibility coefficient of a linear model decreased as salt concentration increased. Similar behavior for parameter b0 was found in the present study (Figure 10a). Drahorad and Henningsen [51] found that the contact points in the biocrusts were cemented between the surface and soil particles as salt concentration increased. According to Hansen et al. [52] and Yu et al. [53], soil CEC increases as humic acid increases, peaking after three weeks in soil samples without crusts. Figure 9a of the current investigation confirmed these findings. Interactions between SOM and clay minerals resulted in higher soil CEC values, according to Yu et al. [53]. The results of Figure 10b found that parameter b0 decreased as CEC increased for crusted and uncrusted soils.
Figure 9c,d showed that differing HA concentrations had a substantial impact on SOM for crusted and uncrusted soils. Humic acid treatments resulted in a considerable increase in SOM. These findings matched those of Sootahar et al. [54]. Gümüş and Şeker [50] discovered similar results, with SOM values increasing dramatically as the amount of HA applied increased. The SOM increased significantly after a 21-day curing period with 0.5% of HA [50]. At 42 and 62 days of curing, the soil SOM increased linearly when the HA dose was increased, with the highest effect at 2 and 4% concentrations of HA. Hashim et al. [20] found that SOM tended to increase in soils containing biocrusts. It was clearly indicated that this increment was due to the application of an algal crust. Hashim et al. [20] reported that the erodibility coefficient of a linear model decreased as SOM increased. Our research reported similar results for parameter b0 related to the values of SOM (Figure 10c). There was a gap in the values of SOM from 2 to 5% related to the influence of HA on parameter b0 and SOM. The soil samples of SOM below 2% are the crusted and uncrusted soil samples without humic acid, while the others above 5% of SOM are the crusted and uncrusted soil samples with humic acid (Figure 10c).

5. Conclusions

A mini-JET apparatus was employed on the undisturbed soil specimens in the presence of humic acids (concentrations of 0 to 8%) of crusted and uncrusted soils acquired from the Gheraiat region of Iraq, and air dried at different curing times (one to three weeks) to determine the mechanistic soil erosion parameters (b0 and b1) of the Wilson model. At two weeks of curing time, the parameter b0 for crusted soils with no humic acid was reduced by 60%, whereas at three weeks, the parameter b0 increased by 90% for uncrusted soil. The breaking down of dead algae caused a slight increase in b0 after two weeks on the crusted soils. For crusted and uncrusted soils, there was no consistent behavior of b1 at varied curing periods. In the presence of humic acid, the reduction in parameter b0 reached 86 and 99% for crusted and uncrusted soils, respectively, in comparison with those without humic acid. These results were confirmed by statistical analysis using paired t-test ANOVA. The EC and CEC were improved by humic acid and even more in crusted soils in comparison to uncrusted soils. This research found that the SOM significantly increased in soils containing humic acid. The soil erodibility decreased as EC, CEC, and SOM increased. This work shows how employing a JET instrument can reduce testing times, save energy, and provide a low-cost method for observing crusted soil stabilization in the presence of humic acids.

Author Contributions

Conceptualization, A.A.A. and A.-S.T.A.-M.; data curation, A.A.A.; formal analysis, A.A.A. and A.-S.T.A.-M.; investigation, A.-S.T.A.-M.; methodology, A.A.A. and A.-S.T.A.-M.; writing—original draft, A.A.A.; writing—review and editing, A.-S.T.A.-M. All authors have read and agreed to the published version of the manuscript.

Funding

This research received no external funding.

Institutional Review Board Statement

Not applicable.

Informed Consent Statement

Not applicable.

Data Availability Statement

Not applicable.

Acknowledgments

The authors thank the instructors and technicians of Mustansiriyah University’s Hydraulic Laboratory, Water Resources Engineering Department, College of Engineering, for their assistance in repairing and maintaining the equipment utilized in this study. The authors also thank the Iraqi Ministry of Science and Technology’s Department of Environment and Water for assisting with some soil property tests for this study. The authors and Mustansiriyah University contributed all of the equipment and supplies utilized in this investigation.

Conflicts of Interest

The authors declare no conflict of interest.

References

  1. Cucunubá-Melo, J.L.; Álvarez-Herrera, J.G.; Camacho-Tamayo, J.H. Identification of agronomic management units based on physical attributes of soil. J. Soil Sci. Plant Nutr. 2011, 11, 87–99. [Google Scholar] [CrossRef] [Green Version]
  2. Tejada, M.; Gonzalez, J.L. Influence of two organic amendments on the soil physical properties, soil losses, sediments and runoff water quality. Geoderma 2008, 145, 325–334. [Google Scholar] [CrossRef]
  3. Huang, S.; Peng, X.; Huang, Q.; Zhang, W. Soil aggregation and organic carbon fractions affected by long-term fertilization in a red soil of subtropical China. Geoderma 2010, 154, 364–369. [Google Scholar] [CrossRef]
  4. Zech, W.; Senesi, N.; Guggenberger, G.; Kaiser, K.; Lehmann, J.; Miano, T.; Miltner, A.; Schroth, G. Factors controlling humification and mineralization of soil organic matter in the tropics. Geoderma 1997, 79, 117–161. [Google Scholar] [CrossRef]
  5. Gude, A.; Kandeler, E.; Gleixner, G. Input related microbial carbon dynamic of soil organic matter in particle size fractions. Soil Biol. Biochem. 2012, 47, 209–219. [Google Scholar] [CrossRef]
  6. Senesi, N.; Miano, T.M.; Brunetti, G. Methods and related problems for sampling soil and sediment organic matter: Extraction, fractionation and purification of humic substances. Quim. Anal. 1994, 13, S26. [Google Scholar]
  7. Santos, G.A.; Camargo, F.A.O. Fundamentos da Matéria Orgânica do sol; Alegre, G.P., Ed.; Metrópole: Porto Alegre, Brazil, 1999; p. 491. [Google Scholar]
  8. Janoš, P. Separation methods in the chemistry of humic substances. J. Chromatogr. A. 2003, 983, 1–18. [Google Scholar] [CrossRef]
  9. De Melo Benites, V.; de Oliveira Moutta, R.; da Costa Coutinho, H.L.; de Carvalho Balieiro, F. Análise discriminante de solos sob diferentes usos em área de Mata Atlântica a partir de atributos da matéria orgânica. Rev. Árvore 2010, 34, 685–690. [Google Scholar] [CrossRef] [Green Version]
  10. Chen, J.; Gu, B.; LeBoeuf, E.J.; Pan, H.; Dai, S. Spectroscopic characterization of the structural and functional properties of natural organic matter fractions. Chemosphere 2002, 48, 59–68. [Google Scholar] [CrossRef]
  11. De Moraes, G.M.; da Silva Xavier, F.A.; de Sá Mendonça, E.; de Araújo Filho, J.A.; de Oliveiram, T.S. Chemical and structural characterization of soil humic substances under agroforestry and conventional systems. Rev. Bras. Ciência Do Solo 2011, 35, 1597–1608. [Google Scholar] [CrossRef] [Green Version]
  12. Clemente, J.S.; Simpson, M.J.; Simpson, A.J.; Yanni, S.F.; Whalen, J.K. Comparison of soil organic matter composition after incubation with maize leaves, roots, and stems. Geoderma 2013, 192, 86–96. [Google Scholar] [CrossRef]
  13. Oades, J.M.; Vassallo, A.M.; Waters, A.G.; Wilson, M.A. Characterization of organic matter in particle size and density fractions from a red-brown earth by solid state 13C NMR. Soil Res. 1987, 25, 71–82. [Google Scholar] [CrossRef]
  14. Rigobello, E.S.; Campos, S.X.; de Azevedo, E.R.; Dantas, A.D.B.; Vieira, E.M. Comparative characterization of humic substances extracted from freshwater and peat of different apparent molecular sizes. Rev. Ambient. Água 2017, 12, 774–785. [Google Scholar] [CrossRef] [Green Version]
  15. Ibraheem, I.M. Cyanobacteria as alternative Biological conditioners for bioremediation of barren soil. Egypt. J. Phycol. 2007, 8, 99–116. [Google Scholar] [CrossRef]
  16. Zhang, G.S.; Chan, K.Y.; Oates, A.; Heenan, D.P.; Huang, G.B. Relationship between soil structure and runoff/soil loss after 24 years of conservation tillage. Soil Tillage Res. 2007, 92, 112–128. [Google Scholar] [CrossRef]
  17. Sarkhot, D.V.; Comerford, N.B.; Jokela, E.J.; Reeves, J.B. Effects of forest management intensity on carbon and nitrogen content in different soil size fractions of a North Florida Spodosol. Plant. Soil 2007, 294, 291–303. [Google Scholar] [CrossRef]
  18. Xiao-Gang, L.; Feng-Min, L.; Rengel, Z.; Zheng-Yan, Z.; Singh, B. Soil physical properties and their relations to organic carbon pools as affected by land use in an Alpine Pastureland. Geoderma 2007, 139, 98–105. [Google Scholar]
  19. Fataftah, A.K.; Walia, D.S.; Gains, B.; Kotob, S.I. A comparative evaluation of known liquid humic acid analysis methods. Spec. Publ. Soc. Chem. 2001, 273, 337–344. [Google Scholar]
  20. Hashim, Z.E.; Al-Madhhachi, A.T.; Alzubaidi, L.A. Behavior of soil erodibility parameters due to biological soil crusts using jet erosion tests. Ecol. Eng. 2020, 153, 105903. [Google Scholar] [CrossRef]
  21. Roper, M.M.; Gupta, V. Management-practices and soil biota. Soil Res. 1995, 33, 321–339. [Google Scholar] [CrossRef]
  22. Bruce, R.R.; Langdale, G.W.; West, L.T.; Miller, W. Surface soil degradation and soil productivity restoration and maintenance. Soil Sci. Soc. Am. J. 1995, 59, 654–660. [Google Scholar] [CrossRef]
  23. Biot, Y.; Lu, X.X. Loss of yield caused by soil erosion on sandy soils in the UK. Soil Use Manag. 2007, 11, 157–162. [Google Scholar] [CrossRef]
  24. Jing, K.; Wang, W.Z.; Zheng, F.L. Soil Erosion and Environment in China; Science Press: Beijing, China, 2020; p. 359. [Google Scholar]
  25. Drahorad, S.; Felix-Henningsen, P.; Eckhardt, K.U.; Leinweber, P. Spatial carbon and nitrogen distribution and organic matter characteristics of biological soil crusts in the Negev desert (Israel) along a rainfall gradient. J. Arid Environ. 2013, 94, 18–26. [Google Scholar] [CrossRef]
  26. Xiao, B.; Zhao, Y.; Wang, Q.; Li, C. Development of artificial moss-dominated biological soil crusts and their effects on runoff and soil water content in a semi-arid environment. J. Arid Environ. 2015, 117, 75–83. [Google Scholar] [CrossRef]
  27. Gao, L.; Bowker, M.A.; Xu, M.; Sun, H.; Tuo, D.; Zhao, Y. Biological soil crusts decrease erodibility by modifying inherent soil properties on the Loess Plateau, China. Soil Biol. Biochem. 2017, 105, 49–58. [Google Scholar] [CrossRef]
  28. Gao, L.; Sun, H.; Xu, M.; Zhao, Y. Biocrusts resist runoff erosion through direct physical protection and indirect modification of soil properties. J. Soils Sediments 2019, 20, 133–142. [Google Scholar] [CrossRef]
  29. Al-Madhhachi, A.-S.T.; Hanson, G.J.; Fox, G.A.; Tyagi, A.K.; Bulut, R. Deriving parameters of a fundamental detachment model for cohesive soils from flume and jet erosion tests. Trans. ASABE 2013, 56, 489–504. [Google Scholar] [CrossRef]
  30. Al-Madhhachi, A.-S.T.; Fox, G.A.; Hanson, G.J.; Tyagi, A.K.; Bulut, R. Mechanistic detachment rate model to predict soil erodibility due to fluvial and seepage forces. J. Hydraul. Eng. 2014, 140, 4014010. [Google Scholar] [CrossRef] [Green Version]
  31. Al-Madhhachi, A.-S.T.; Fox, G.A.; Hanson, G.J. Quantifying the erodibility of streambanks and hillslopes due to surface and subsurface forces. Trans. ASABE 2014, 57, 1057–1069. [Google Scholar]
  32. Daly, E.R.; Fox, G.A.; Al-Madhhachi, A.-S.T.; Storm, D.E. Variability of fluvial erodibility parameters for streambanks on a watershed scale. Geomorphology 2015, 231, 281–291. [Google Scholar] [CrossRef]
  33. Khanal, A.; Fox, G.A. Detachment characteristics of root-permeated soils from laboratory jet erosion tests. Ecol. Eng. 2017, 100, 335–343. [Google Scholar] [CrossRef] [Green Version]
  34. Al-Madhhachi, A.-S.T.; Mutter, G.M.; Hasan, M.B. Predicting mechanistic detachment model due to lead-contaminated soil treated with Iraqi stabilizers. KSCE J. Civ. Eng. 2019, 23, 2898–2907. [Google Scholar] [CrossRef]
  35. Adnan, T.A.; Al-Madhhachi, A.-S.T.; Mohammed, E.A. Relationships of soil erodibility parameters and water quality indices along Tigris Riverbanks, Baghdad City, Iraq. Cogent Eng. 2021, 8, 1917330. [Google Scholar] [CrossRef]
  36. Wilson, B.N. Development of a fundamentally based detachment model. Trans. ASAE 1993, 36, 1105–1114. [Google Scholar] [CrossRef]
  37. Wilson, B.N. Evaluation of a fundamentally based detachment model. Trans. ASAE 1993, 36, 1115–1122. [Google Scholar] [CrossRef]
  38. ASTM Standards. Section 4: Construction. In Annual Book of ASTM Standards; ASTM: Philadelphia, PA, USA, 2006. [Google Scholar]
  39. Food and Agriculture Organization (FAO), Prognosis of Salinity and Alkalinity; FAO: Great Konya Basin, Turkey, 1975; p. 260.
  40. Hendershot, W.H.; Duquette, M. A simple barium chloride method for determining cation exchange capacity and exchangeable cations. Soil Sci. Soc. Am. J. 1986, 50, 605–608. [Google Scholar] [CrossRef]
  41. Einstein, H.A. The Bed-Load Function for Sediment Transportation in Open Channel Flows; Technical Bulletins; US Government Printing Office: Washington, DC, USA, 1950.
  42. Partheniades, E. Erosion and deposition of cohesive soils. J. Hydraul. Div. 1965, 91, 105–139. [Google Scholar] [CrossRef]
  43. SÖNMEZ, F.; Şevket, A.L.P. The Effects of Applications Humic Acids on Macronutrient, Micronutrient, Heavy Metal and Soil Properties. Yüzüncü Yıl Üniversitesi Tarım Bilim. Derg. 2019, 29, 809–816. [Google Scholar] [CrossRef]
  44. Çelik, H.; Katkat, A.V.; Aşık, B.B.; Turan, M.A. Effects of soil applied humic substances to dry weight and mineral nutrients uptake of maize under calcareous soil conditions. Arch. Agron. Soil Sci. 2008, 54, 605–614. [Google Scholar] [CrossRef]
  45. Yilmaz, E. Changes of some soil properties by agricultural processing waste (soybean pulp) amendment. J. Food Agr. Env. 2010, 8, 1057–1060. [Google Scholar]
  46. Quilty, J.; Cattle, S. Use and Understanding of Organic Amendments in Australian Agriculture: A Review. Soil Res. 2011, 49, 1–26. [Google Scholar] [CrossRef]
  47. Khaled, H.; Fawy, H.A. Effect of different levels of humic acids on the nutrient content, plant growth, and soil properties under conditions of salinity. Soil Water Res. 2011, 6, 21–29. [Google Scholar] [CrossRef] [Green Version]
  48. Piccolo, A.; Mbagwu, J.S.C. Humic substances and surfactants effects on the stability of two tropical soils. Soil Sci. Soc. Am. J. 1994, 58, 950–955. [Google Scholar] [CrossRef]
  49. Piccolo, A.; Mbagwu, J.S.C. Role of hydrophobic components of soil organic matter in soil aggregate stability. Soil Sci. Soc. Am. J. 1999, 63, 1801–1810. [Google Scholar] [CrossRef]
  50. Gümüş, İ.; Şeker, C. Influence of humic acid applications on soil physicochemical properties. Solid Earth 2015, 7, 2481–2500. [Google Scholar]
  51. Drahorad, S.L.; Felix-Henningsen, P. Application of an Electronic Micropenetrometer to Assess Mechanical Stability of Biological Soil Crusts. J. Plant. Nutr. Soil Sci. 2013, 176, 904–909. [Google Scholar] [CrossRef]
  52. Hansen, V.; Müller-Stöver, D.; Munkholm, L.J.; Peltre, C.; Hauggaard-Nielsen, H.; Jensen, L.S. The effect of straw and wood gasification biochar on carbon sequestration, selected soil fertility indicators and functional groups in soil: An incubation study. Geoderma 2016, 269, 99–107. [Google Scholar] [CrossRef]
  53. Yu, Z.; Zhang, J.; Zhang, C.; Xin, X.; Li, H. The coupling effects of soil organic matter and particle interaction forces on soil aggregate stability. Soil Tillage Res. 2017, 174, 251–260. [Google Scholar] [CrossRef]
  54. Sootahar, M.K.; Zeng, X.; Su, S.; Wang, Y.; Bai, L.; Zhang, Y.; Li, T.; Zhang, X. The effect of fulvic acids derived from different materials on changing properties of albic black soil in the Northeast Plain of China. Molecules 2019, 24, 1535. [Google Scholar] [CrossRef] [Green Version]
Figure 1. Location of the research area in this study, Baghdad City, Iraq.
Land 10 01180 g001
Figure 2. (a) Undisturbed crusted soil samples, (b) crusted soil samples with humic acids, (c) undisturbed uncrusted soil samples with and without humic acids, and (d) mini-JET device setup at the Hydraulic Lab.
Land 10 01180 g002
Figure 3. The influence of three different curing times of 1 week, 2 weeks, and 3 weeks on the dimensional soil detachment parameter (b0) of the Wilson model derived from the JET instrument achieved on soil specimens of crusted and uncrusted soils in the presence of different humic acid concentrations: (a) 0% (no humic acid), (b) 4%, and (c) 8%. Note that each test was replicated.
Land 10 01180 g003
Figure 4. The influence of three different curing times of 1 week, 2 weeks, and 3 weeks on the dimensional soil threshold parameter (b1) of the Wilson model derived from the JET instrument achieved on soil specimens of crusted and uncrusted soils in the presence of different humic acid concentrations: (a) 0% (no humic acid), (b) 4%, and (c) 8%. Note that each test was replicated.
Land 10 01180 g004
Figure 5. The influence of humic acid concentrations of 0%, 4%, and 8% on the dimensional soil detachment parameter (b0) of the Wilson model derived from the JET instrument achieved on soil specimens of crusted and uncrusted soils for curing times of: (a) one week, (b) two weeks, and (c) three weeks. Note that each test was replicated.
Land 10 01180 g005
Figure 6. The influence of humic acid concentrations of 0%, 4%, and 8% on the dimensional soil threshold parameter (b1) of the Wilson model derived from the JET instrument achieved on soil specimens of crusted and uncrusted soils for curing times of: (a) one week, (b) two weeks, and (c) three weeks. Note that each test was replicated.
Land 10 01180 g006
Figure 7. Influence of humic acid concentrations of 0%, 4%, and 8% on: (a) soil pH of uncrusted soils, (b) soil pH of crusted soils, (c) electrical conductivity (EC) of uncrusted soils, and (d) electrical conductivity (EC) of crusted soils at different curing times. The error bars are the standard deviations from the mean values of different curing times for each HA concentration.
Land 10 01180 g007
Figure 8. Influence of humic acid concentrations of 0%, 4%, and 8% on: (a) CaCO3 of uncrusted soils, (b) CaCO3 of crusted soils, (c) CaSO4 of uncrusted soils, and (d) CaSO4 of crusted soils at different curing times. The error bars are the standard deviations from the mean values of different curing times for each HA concentration.
Land 10 01180 g008
Figure 9. Influence of humic acid concentrations of 0%, 4%, and 8% on: (a) CEC of uncrusted soils, (b) CEC of crusted soils, (c) SOM of uncrusted soils, and (d) SOM of crusted soils at different curing times. The error bars are the standard deviations from the mean values of different curing times for each HA concentration.
Land 10 01180 g009
Figure 10. Relationships between mechanistic soil erodibility parameters (b0 and b1) derived from JET experiments and (a) EC, (b) CEC, and (c) SOM that were performed on crusted and uncrusted soil samples with and without humic acids.
Land 10 01180 g010
Figure 11. Comparison of scour depth readings using the mini-JET device for curing times of 2 weeks and 3 weeks for crusted soils with no humic acid and how the Wilson model fits the observed data.
Land 10 01180 g011
Table 1. Results of examination the physical and chemical properties of the undisturbed crusted and uncrusted soils used in this study.
Soil Physical Characteristics
Soil TextureInitial Natural Compaction
SamplesUSDA classificationSand, %Silt, %Clay, % Bulk density, g/cm3Water content, %Specific gravitypHEC, d.S/cm
Uncrusted soilLoam3426401.7032.122.477.200.90
Crusted soilLoam4424321.6830.512.487.502.40
Soil chemical characteristics, mean (standard errors)
SamplesCaCO3, g/kg of soilCaSO4, %Ca, meq/L *Mg, meq/L *Na, meq/L *SAR, %CEC, cmol/kgSOM, %OC, %
Uncrusted soil227
(0.337)
9.42
(0.018)
6.07
(0.396)
3.88
(0.168)
4.16
(0.370)
1.86
(0.135)
2.47
(0.042)
0.77
(0.038)
0.45
(0.024)
Crusted soil239
(4.129)
14.12
(0.589)
15.77
(1.326)
8.31
(1.087)
3.53
(0.152)
1.02
(0.070)
2.99
(0.265)
1.25
(0.272)
0.73
(0.158)
* The unit of meq/L is mill-equivalents of solute per liter.
Table 2. Statistical analysis of the influence of curing times (1 week, 2 weeks, and 3 weeks) using paired t-test ANOVA on mechanistic detachment parameters (b0 and b1) for undisturbed soil specimens (n = 36) of crusted and uncrusted soils at different humic acid concentrations (0%, 4%, and 8%).
Mechanistic Detachment ParametersHumic Acid ConcentrationsUncrusted SoilCrusted Soil Crusted versus Uncrusted Soils
MeanStd. Dev.MeanStd. Dev.p *
b0, g/m.s.N0.50%337.48398.5116.178.000.031
4%5.482.532.240.500.265
8%1.730.881.100.610.904
b1, Pa0%67.8110.6453.4511.850.141
4%47.954.2242.315.930.783
8%36.7017.2437.3816.890.857
* Note: p-values < 0.05 indicate to there is statistically significant difference.
Table 3. Chemical composition of crusted and uncrusted soil samples with humic acid (at three weeks of curing time) and without humic acid (at one week of curing time) using XRF analysis.
CompoundsUncrusted Soil with No Humic, %Uncrusted Soil with Humic, %Crusted Soil with No Humic, %Crusted Soil with Humic, %
SiO239.2738.7537.7034.36
CaO16.4016.2016.2414.76
Al2O38.989.068.628.13
Fe2O35.875.665.255.31
MgO4.774.854.374.16
K2O1.341.451.342.32
Others3.182.682.822.89
Publisher’s Note: MDPI stays neutral with regard to jurisdictional claims in published maps and institutional affiliations.

