1. Introduction
Sweden is highly dependent on surface water sources; 75% of the national drinking water comes from surface water treatment plants (50%) or from artificial groundwater plants (25%) [
1]. Thus, changes in the water quality of the surface water affect the drinking water production directly. With the increasing color and organic content trends [
2,
3,
4] there is a need to improve the removal of natural organic matter (NOM) more effectively, and the need is becoming more acute. There are many examples where water utilities in Sweden have experienced increasing color and organic content in their raw water sources, which in turn leads to an impending risk of deteriorated drinking water quality. Ringsjö water treatment plant (WTP) in southern Sweden has doubled the coagulant dose over the two past decades due to increased total organic carbon (TOC) concentrations and changing NOM character in the raw water. In turn, this has led to higher costs and bigger sludge production volumes.
By introducing a membrane filtration step, chemical treatment can be partly or entirely replaced in the conventional treatment train. Ultrafiltration, with a molecular weight cut-off (MWCO) bigger than 10 kDa, has little effect on the organic content if not coupled with a chemical pre-treatment [
5,
6]. Nanofiltration, on the other hand, does not require pre-treatment and may remove around 80% of the organics [
7], 90% of the color [
8,
9], and reduce low molecular weight substances by 90% [
10]. Around Europe, these methods have become popular [
11] since they may improve the chemical and microbiological barrier effects [
12], and save space and chemicals [
13]. There are many more examples of reliable drinking water production by nanofiltration [
14,
15,
16,
17] and ultrafiltration with coagulation pre-treatment [
18,
19,
20].
In addition to being a good chemical barrier, membrane technology could improve drinking water safety by introducing an extra microbiological barrier, removing bacteria and viruses [
8,
12,
21]. However, disinfection and cleaning of membranes can be an issue, since many nanofilters are degraded by sodium hypochlorite (NaOCl), which is generally used as an oxidant [
22]. By introducing a hollow-fiber type of membrane, the modules can be made from materials that can sustain cleaning by chlorine containing agents. In addition, the module can be backwashed, a procedure that destroys traditional spiral-wound nanofilters. A new type of hollow-fiber nanofilter (HFNF) has been developed for improved removal of organic matter, safe backwashing and chemical cleaning, and with no requirement for pretreatment other than screening [
23,
24,
25].
Nanofiltration is known to entail extra costs when introduced at a WTP, large initial investment and operation and maintenance costs follow, due to increased energy consumption and replacement of modules [
10,
26,
27,
28]. From an environmental angle, compared to conventional treatments, and other newer treatment methods, the level of environmental impact from nanofiltration is highly dependent on the choice of settings [
29,
30,
31,
32]. There is further dependence on whether the nanofiltration is an additional step in the treatment train [
31] or if it replaces existing steps [
29].
In Lidén and Persson [
33], the HFNF was shown to have the potential to improve the removal of organic matter, and it could even surpass existing treatment methods, while ultrafiltration could replace the chemical treatment,
i.e., the flocculation/sedimentation and rapid sand filtration. The present paper evaluates what such changes would cost for the water utility and what the effects on the environmental impact would be.
2. Method and Materials
Ringsjö WTP, where this study was carried out, is a surface water treatment plant in southern Sweden. Raw water to the WTP was originally taken from the nearby Lake Ringsjön, a relatively alkaline and eutrophic lake with substantial anthropogenic influences. The water demand increased, and the water regeneration in Lake Ringsjön became insufficient. Lake Bolmen is the current raw water source with Lake Ringsjön used as a reserve source only. The raw water from Lake Bolmen travels through a bedrock tunnel, 80 km long, and 25 km pipes to reach Ringsjö WTP. Lake Bolmen is an oligotrophic lake, with a TOC concentration of 10 mg/L. The catchment area of Lake Bolmen is dominated by forest (48%), marshlands (22%), lakes (20%) and a small part cultivated land (9%). As result, the water quality has very little anthropogenic influences.
The treatment processes in Ringsjö WTP are: coagulation with ferric chloride (FeCl3) and pH adjustment by NaOH; flocculation; lamella sedimentation; rapid sand filtration; and slow sand filtration. Before distribution, the water is stabilized by carbon dioxide and liming, and an addition of NaOCl gives a residual disinfectant effect.
2.1. Membranes
Two membranes have been trialed in this study. Both are inside-out hollow fiber membranes, with the same inner diameter of the fibers, 0.8 mm. They are produced by Pentair X-Flow and have the same size of the encasing, making them interchangeable in the pilot plant.
The hollow-fiber ultrafilter (HFUF), Aquaflex, is a porous ultrafilter MWCO of 150 kDa. It is made from polyethersulfone (PES), which is stable to oxidizing substances within the pH range allowed (pH 2–13). One module contains 15,000 fibers, and has a membrane area of 55 m2.
The HFNF, HFW 1000, is a membrane especially developed for high organic retention but low ion retention. The MWCO is 1 kDa, and it is made from modified polyethersulfone (SPES), which is resistant to oxidizing detergents. The membrane area is 40 m2, which is due to a lower amount of fibers per module compared to the HFUF; 11,000.
2.2. Pilot Plant
The pilot plant from Pentair was constructed within a 20 feet (2.4 m × 6.1 m) container with a steering system for an automatic process. Since the pilot plant needed to accommodate the difference between the two membrane processes, the piping system and pumps were adopted accordingly. These differences encompassed a coagulation and pH adjustment pretreatment before the HFUF, which was run as a dead-end process, while the HFNF was run with a crossflow and a bleed flow to decrease the concentration polarization. Both membranes are constructed for vertical orientation, and they were fed from the top.
The cleaning regimes differed between the modules. With the higher flux, coagulation, and dead-end process, the HFUF had to be flushed and backwashed more often than the HFNF. The so-called hydraulic cleans of both membranes were conducted in three steps: a top-down flush; a bottom-up flush with backwash; and a bottom-up flush with backwash and air sparging.
The chemical cleaning of the HFUF was a chemically enhanced backwash (CEB). Water from the permeate tank was pumped into the membrane, with inline dosing of either an acid (hydrochloric acid (HCl)), or an oxidizer (NaOCl) and a base (sodium hydroxide (NaOH)). During 10 min the membrane was let to soak, and then it was backwashed. The first step is the alkali clean with the oxidizer (a concentration of 5.8 mole Cl/m3 and pH 12), which reduces the organic fouling, while the subsequent acidic clean (pH 2) removes the metals from the membrane surface. The oxidizer has the additional effect of disinfecting the system.
The HFNF was cleaned differently through a chemically enhanced forward flush. The system was filled with the oxidizer and pH increased to above pH 11. This mix was circulated over the feed side of the membrane for an hour by a small circulation pump. Afterwards, the membrane was flushed and backwashed to remove chemicals and organics. Depending on the characteristics of the water, it may require a similar acidic clean. However, with these soft waters it was only performed a few times, at pH 2.
In the pilot, the set parameter for the steering system was the flux, from which the transmembrane pressure (TMP) was adapted. Hence, the permeate production could be kept at the desired level. However, in this paper, a normalized flow is presented, to aid comparisons to other studies. All normalized flux are calculated for 20 °C (
:
where
is the operation flux at the water temperature T,
the dynamic viscosity at the water temperature T, and
the dynamic viscosity at temperature 20 °C.
2.3. Methodology
To accomplish the estimation of environmental impact and cost for the membrane processes, the two approaches are compared, based on the results from the pilot studies and the current situation at Ringsjö WTP. Energy and chemical consumption are estimated and presented, and all numbers are calculated for the production of 1 m3 drinking water deliverable to the consumers. The present conditions and costs at Ringsjö WTP have been the basis for the calculations in this paper, and are used to compare the existing process to tentative membrane processes. This comparison is solely based on the operational side. Nevertheless, the membrane modules are included in the operational costs, since they have a shorter lifetime than the constructions. Costs for energy and chemicals were collected for 2015 at Ringsjö WTP, while the costs for the membranes were reported by the retailer.
The environmental impact was estimated from numbers found in the literature. The discussion and calculations are based on the conditions at Ringsjö WTP and the results from the pilot study, both of which are presented in the economic analysis. Climate impact is quantitatively estimated, while other aspects are mainly qualitatively presented and discussed. The methodology is influenced by the life cycle assessment methodology, based on the inputs to, the outputs from, and the consumption by the processes. The environmental impact from the construction of the treatment plant and the supporting equipment is not included.
3. Process Costs and Environmental Impact
In this section, the results from a comparison between the three treatment methods for one unit water, i.e., 1 m3 of deliverable water, is presented. Operational settings are presented and discussed, and chemicals and energy demands are quantified. Costs are then compared based on these results.
3.1. The Existing Process
Today, the treatment process entails operational costs for energy and chemical consumptions. Chemicals used are FeCl3, NaOCl, NaOH and lime.
3.1.1. Recovery
Water losses are small, and the water loss due to cleaning of sand filters, sludge from sedimentation ponds, from the liming process and other maintenance only accounts for less than 0.9% of the incoming water. Hence, current water recovery is 99.1%. This unused water is mainly released into Lake Ringsjön after settling in ponds, except for a fraction that is discharged on a bog together with the sludge that is released to a creek, Rönne Å.
3.1.2. Chemicals
Chemical consumption has increased during the past decades, and doubled since the WTP started dosing FeCl3 instead of aluminum sulfate (alum) in 1996. Currently, the coagulant FeCl3 needs to be dosed at a level of 0.17 mole/m3 drinking water. Since the water from Lake Bolmen has almost no alkalinity, sodium hydroxide is needed to adjust the pH. Currently, at this coagulant level, the pH adjustment requires addition of NaOH at a level of 0.12 mole/m3 drinking water. In addition, in the treatment process lime is added to increase the pH and hardness. This would still be needed if the process train were changed, to ensure stable water in the distribution net. Today, lime is added at the level of 0.452 mole/m3 drinking water. In addition, a residual disinfection by adding NaOCl to a level of 0.032 mole/m3 drinking water, which this year will be supplemented with a UV-disinfection step. Changes in the TOC concentrations at the dosing point of the chlorine could lead to a lower dose needed, however, it is still needed in part to ensure a safe drinking water for the consumers.
3.1.3. Energy
Energy consumption today are mainly from pumps within the WTP, pumps getting the water from the tunnel to the WTP or pumps supplying the distribution system. This energy consumption is 0.29 kWh/m3 drinking water, and most of it would still be needed if the treatment steps were changed into a membrane process.
3.2. HFUF—Costs and Requirements
The pilot study started with a feed forward flux of 50 L/m2h (normalized flux 74.6 L/m2h), which is the gross production, before subtracting the backwash water. After two weeks, it was increased to 60 L/m2h (90.6 L/m2h as normalized flux), and a few days later to 76.5 L/m2h (116 L/m2h as normalized flux). For all fluxes, a hydraulic clean started every 20 min, with a chemical clean four times a day (after 14 filtration cycles). The hydraulic cleans led to little improvements on the TMP and it was mainly the CEB that restored the resistance. The dose of alum was 2.8 mg Al/L and pH 6.1. Granular alum was dissolved in drinking water from Ringsjö WTP prior to filling the chemical tank. Unfortunately, the low temperature led to parts of the alum settling in the chemical tank before dosed into the feed water, and there was no time to change coagulants due to time restrictions.
3.2.1. Recovery and Downtime
The HFUF was run as a dead-end process, thus the water losses were due to the flushes, backwashes and CEBs. For the hydraulic clean, the membrane was flushed with raw water, and permeate was used for the backwashes. The backwash flow was considerably higher than the flush flow, and more permeate than raw water is used for the hydraulic cleans. Naturally, the CEB used permeate, i.e., clean water.
The following numbers are calculated from the flows measured by the pilot plant. Flows were multiplied with the running time, to estimate volumes of permeate and volumes of water for hydraulic cleaning and backwashes. For the running settings (i.e., feed forward flux of 50 L/m2h) the resulting water recovery is 76%, partly because 18% of the produced permeate was used for backwashing and CEB. However, without changing the operation settings, the recovery could be remedied by reusing the backwash water in a secondary membrane treatment step. This would reduce the loss of permeate remarkably, and the total recovery would be 94%, with the remaining losses mainly due to the CEB. With this filtration time and frequency of the CEB, the HFUF had a scheduled downtime of 16% of the total process time.
Other operational settings could improve the recovery, and considering earlier studies, a higher recovery could be expected [
34]. Since it is possible that micro-particles from the coagulant caused the unexpected high frequency of hydraulic cleans and CEBs, it is probable that these frequencies could be increased in a tentative full-scale treatment. An increase of the flux is a plausible alternative to improve the recovery. A feed forward flux of 76.5 L/m
2h would increase the recovery to 83% or 96% (reused backwash). This flux was tested in this study with good results. However, increasing the flux gives no improvement of the scheduled downtime.
As an alternative, decreasing the frequency of the hydraulic cleans and CEB would improve both recovery and downtime. A more feasible setting for Ringsjö WTP, with better conditions for the coagulation, would be two CEBs a day and a filtration cycle of 30 min, considering other studies within this project
. With a feed forward flux of 50 L/m
2h this would give recovery of either 89% or 95% (reused backwash) and a downtime of 9%, which is in level with a previous study [
34]. Combining with a feed forward flux of 76.5 L/m
2h would mean a recovery of 90% or 97% (reused backwash). Hence, it is important to find a coagulant and optimal coagulation conditions that can support a lower frequency of CEB.
3.2.2. Chemicals
The chemical consumption by the HFUF process has two parts: the chemical pretreatment with coagulation and pH-adjustment, and secondly, the CEBs.
Coagulation
In this study, the available coagulant was alum (granulate ALG from Kemira). An optimal dose for the NOM removal in this HFUF process with raw water from Lake Bolmen was found at 2.8 g Al/m3 (0.10 mole/m3). With the recovery of 86%, this dose corresponds to a total consumption of alum (Al2(SO4)3) of 0.060 mole/m3 produced water. This particular raw water has a low alkalinity, below 20 mg HCO3/L (0.3 mmole HCO3/L); thus, the pH needs to be adjusted by addition of NaOH, due to the acid in the coagulant. An estimation of the added NaOH was about 0.15 mole/m3 produced water.
Polyaluminum chloride (PACl) was used at another location within this project, with good results on the water quality [
33]. With PACl, Ekoflock 90 from Feralco, the optimum dose in the pilot study was found to be 4 g Al/m
3, which is equivalent to 0.15 mole Al/m
3 produced water. The optimum pH for NOM removal was found at pH 6.3, which required pH adjustment by HCl, at 0.15 mmole/m
3.
Chemically Enhanced Backwash
The consumption of chemicals is dependent on the level of the flux, intervals between hydraulic cleans and CEBs. Calculating the consumption of the chemicals per produced water, based on the filtration cycle at 50 L/m2h feed forward flux i.e., 74.6 L/m2h as normalized flux and 14 filtrations of 20 min, the chemical consumption of the oxidizing clean is around 0.08 mole NaOCl per m3 produced water, and 0.14 mole NaOH per m3 produced water. The acidic clean required 0.14 mole HCl per m3 produced water. A higher flux of 76.5 L/m2h, and with 23 filtrations of 30 min before a CEB (CEB twice a day), would mean a decrease of the cleaning chemicals and only around 0.018 mole of NaOCl, and 0.033 mole of NaOH and HCl would be required per produced 1 m3 of water.
3.2.3. Energy
Membrane processes are known to be energy demanding processes. However, ultrafiltration, like microfiltration, uses porous membranes, which means relatively low pressures. In addition, with a dead-end ultrafiltration process, only a pressurizing pump is needed. At Ringsjö WTP the mean TMP during ultrafiltration was 0.25 bar, ranging from 0.17 to 0.3 bar. The water was relatively cold during this period (5–6 °C). The energy consumption by the feed pump (
) can be calculated from:
where
[Pa] is the TMP,
is the pump efficiency and the
VR is the volume reduction,
i.e., the recovery. The pump efficiency is assumed to 80%, and the volume reduction set to 86%. At a feed forward flux of 76.5 L/m
2h, the mean TMP was 0.33 bar, and, together with the extra energy required from the backwashes (
was 1.1 bar, VR equals 100%), was 0.02 kWh/m
3 usable permeate. A flux of 50 L/m
2h would require 0.015 kWh/m
3. Lower pH affects the TMP (
Figure 1 shows the corresponding resistance), and the TMP did increase to 0.6 bar on average when pH was lower than pH 6.3. However, considering the average water temperature over the year (10–11 °C) and the pressure needed, the TMP for HFUF treatment of the water from Lake Bolmen is estimated to 0.22 bar. This means an energy demand of 0.014 kWh/m
3, which entails a cost of 0.001 €/m
3 drinking water on average.
3.2.4. Number of Modules and Lifetime
Depending on the choice of flux, the required number of modules differs. The highest number of modules needed is at a feed forward flux of 50 L/m2h, a recovery of 76% and a downtime of 16%. This would mean that the number of modules required, including redundancy for any planned downtime, would be 580 modules for a production of 1000 m3/h. However, with a higher flux and a lower percentage of downtime, the number that is needed decrease. If possible, a flux of 76.5 L/m2h, a recovery of 86% and a downtime of 9% would lower the number to 310 modules. Ringsjö WTP has currently a production of around 5400 m3/h (130,000 m3/day), thus the WTP would need 1670–3120 modules for the same capacity.
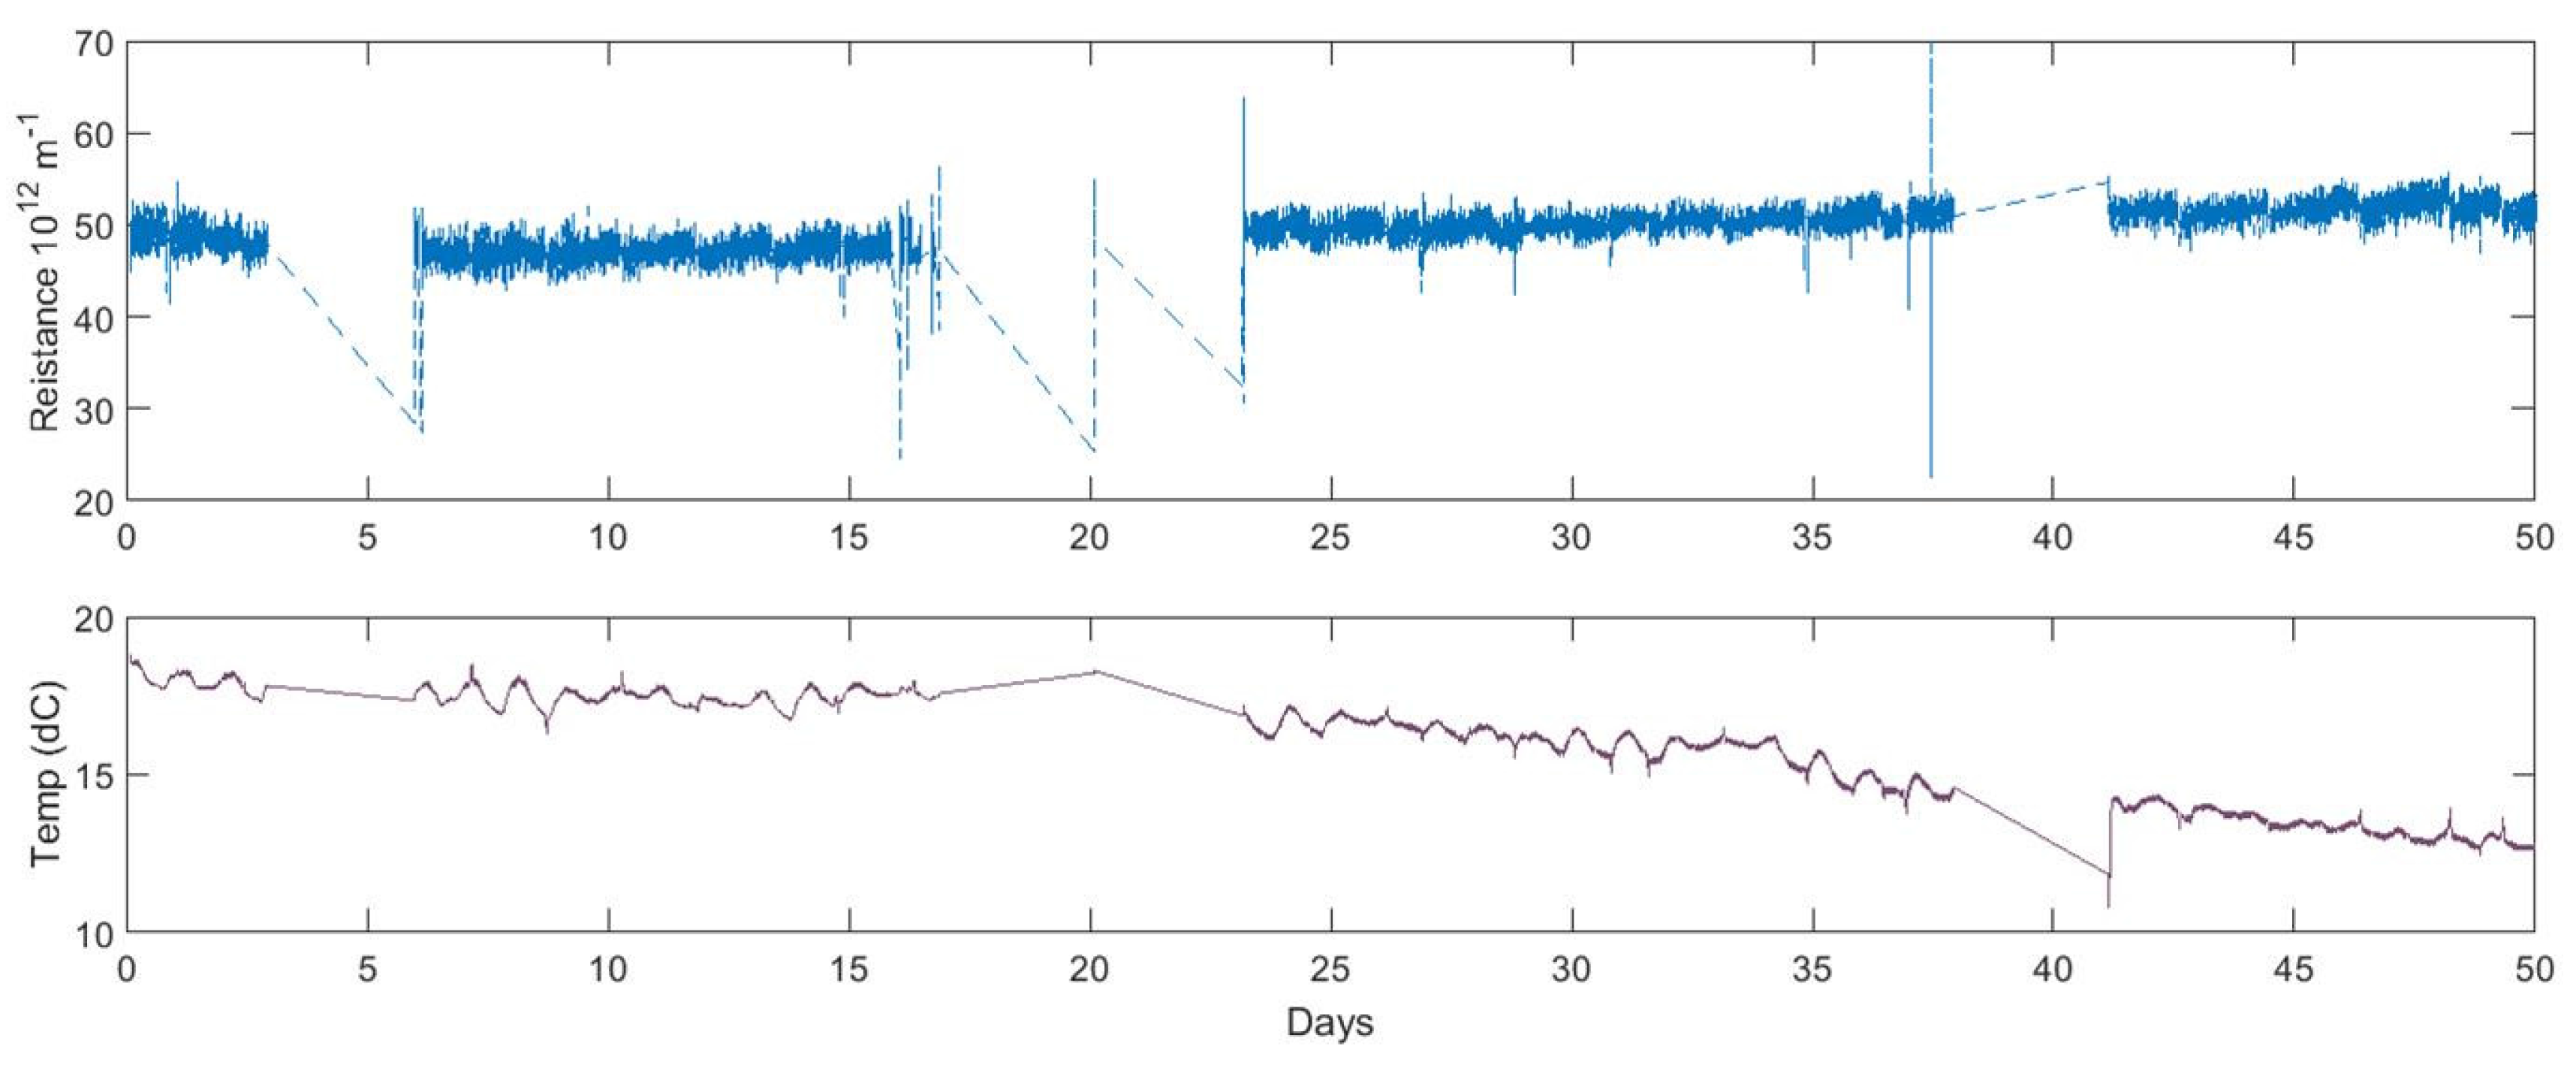
Figure 1 show the resistance of the HFUF membrane, in which pH is successively lowered from Day 8 to Day 24. After Day 24 the pH was adjusted to pH 7.2. A lower pH increased the NOM removal [
33], but it also results in a rapid increase in the membrane resistance. At the lowest level, pH 5.6 at Day 21, the backwashes was prematurely initiated, since the TMP reached the maximum allowed 1 bar. The neutral pH gave a stable pressure over time, but it had a lower NOM removal efficiency. A pH 6.2 would be optimal from both perspectives, below it the operation becomes unstable. However, at any pH, the resistance was restored to the same level after a CEB.
In
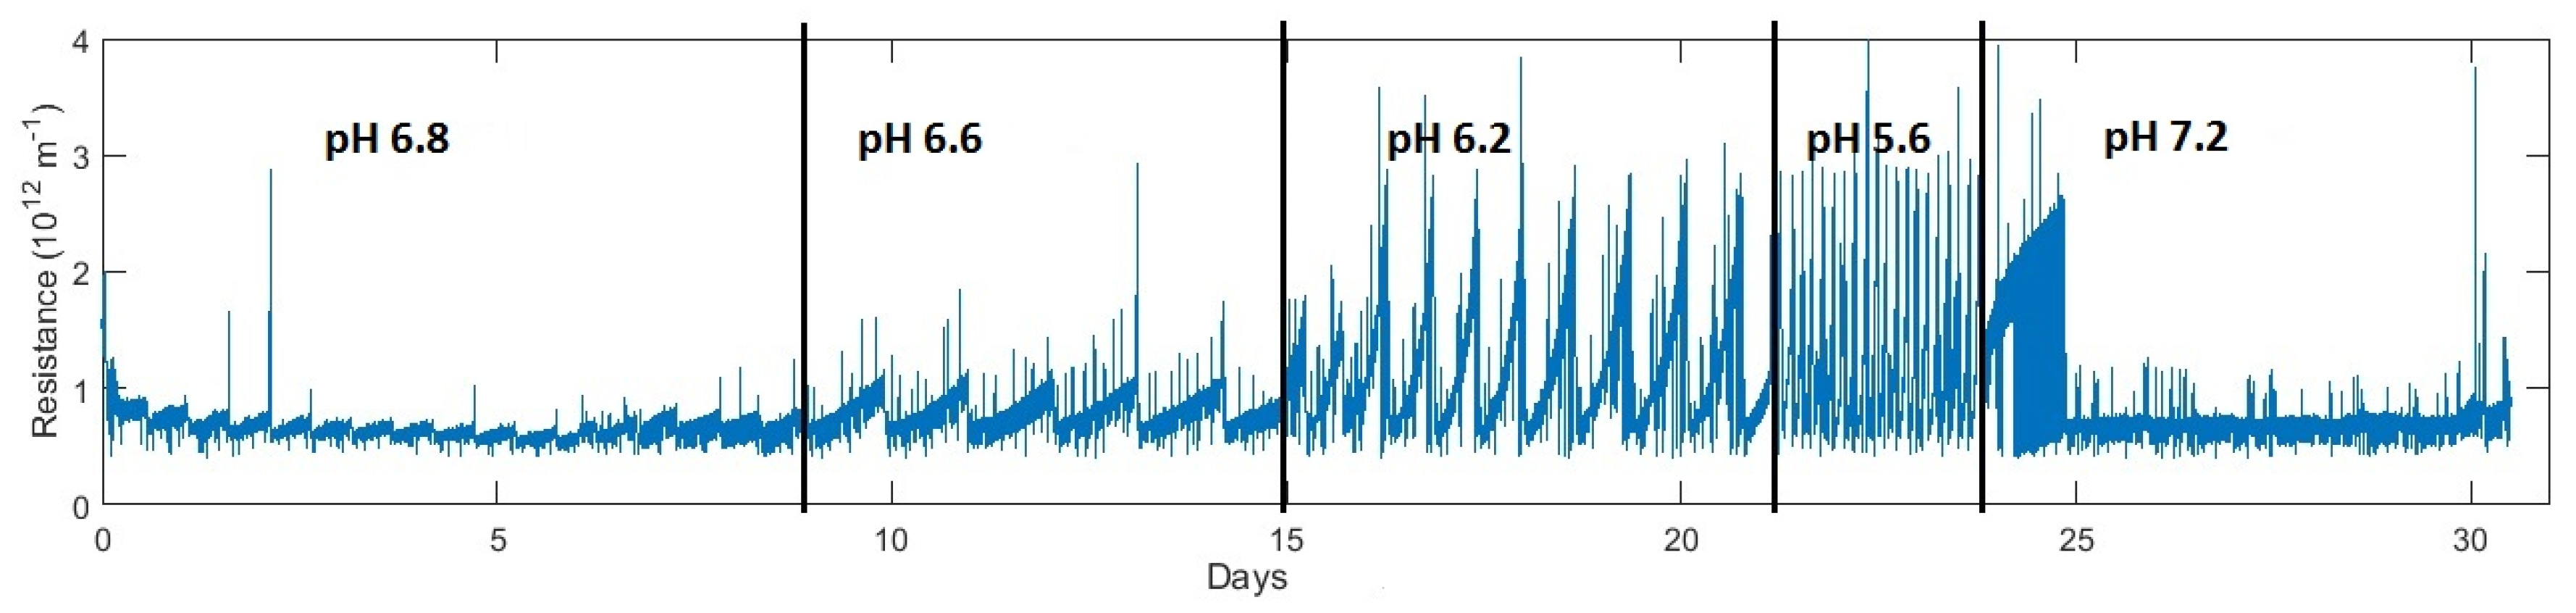
Figure 2, alum was used as a coagulant, and although a CEB restored the membrane to the same resistance every time, the hydraulic clean,
i.e., flush and backwash of the membrane, had hardly any effect on the resistance level, possibly due to the granular alum. With a more suited coagulant, and an optimal mixing of the coagulant into the feed water, the filtration time and interval between CEBs could likely be increased. The flux increase to 60 L/m
2h (normalized flux 90 L/m
2h) had little effect on the resistance and TMP.
During the trial with alum, the hydraulic cleans gave little improvement of the TMP, and the reduction could mainly be seen from the chemical cleans. Hence the fouling was mainly semi-reversible (i.e., could not be backwashed), this could be due to either the choice of coagulant or the raw water character. However, the rise of the TMP was still moderate, between 0.2 and 0.6 bar.
In conclusion, with an operational coagulant and pH, there is no indication of fouling, which could impede a fulfillment of the lifetime of the membrane. From the appearance of
Figure 1, fouling does not give any reason to change the expected lifetime of the membrane from seven years, which is the reported one by the manufacturer.
3.3. HFNF—Costs and Requirements
Below follows a presentation and a discussion on introducing a treatment step with HFNF modules at Ringsjö WTP. Considering the experiences gained in this trial, the settings that would be optimum at Ringsjö WTP would be a feed forward flux of 20 L/m2h, backwash every hour and chemical cleans once every 36 h and the crossflow should be 0.5 m/s. These settings were trialed at Ringsjö WTP during three months.
3.3.1. Recovery and Downtime
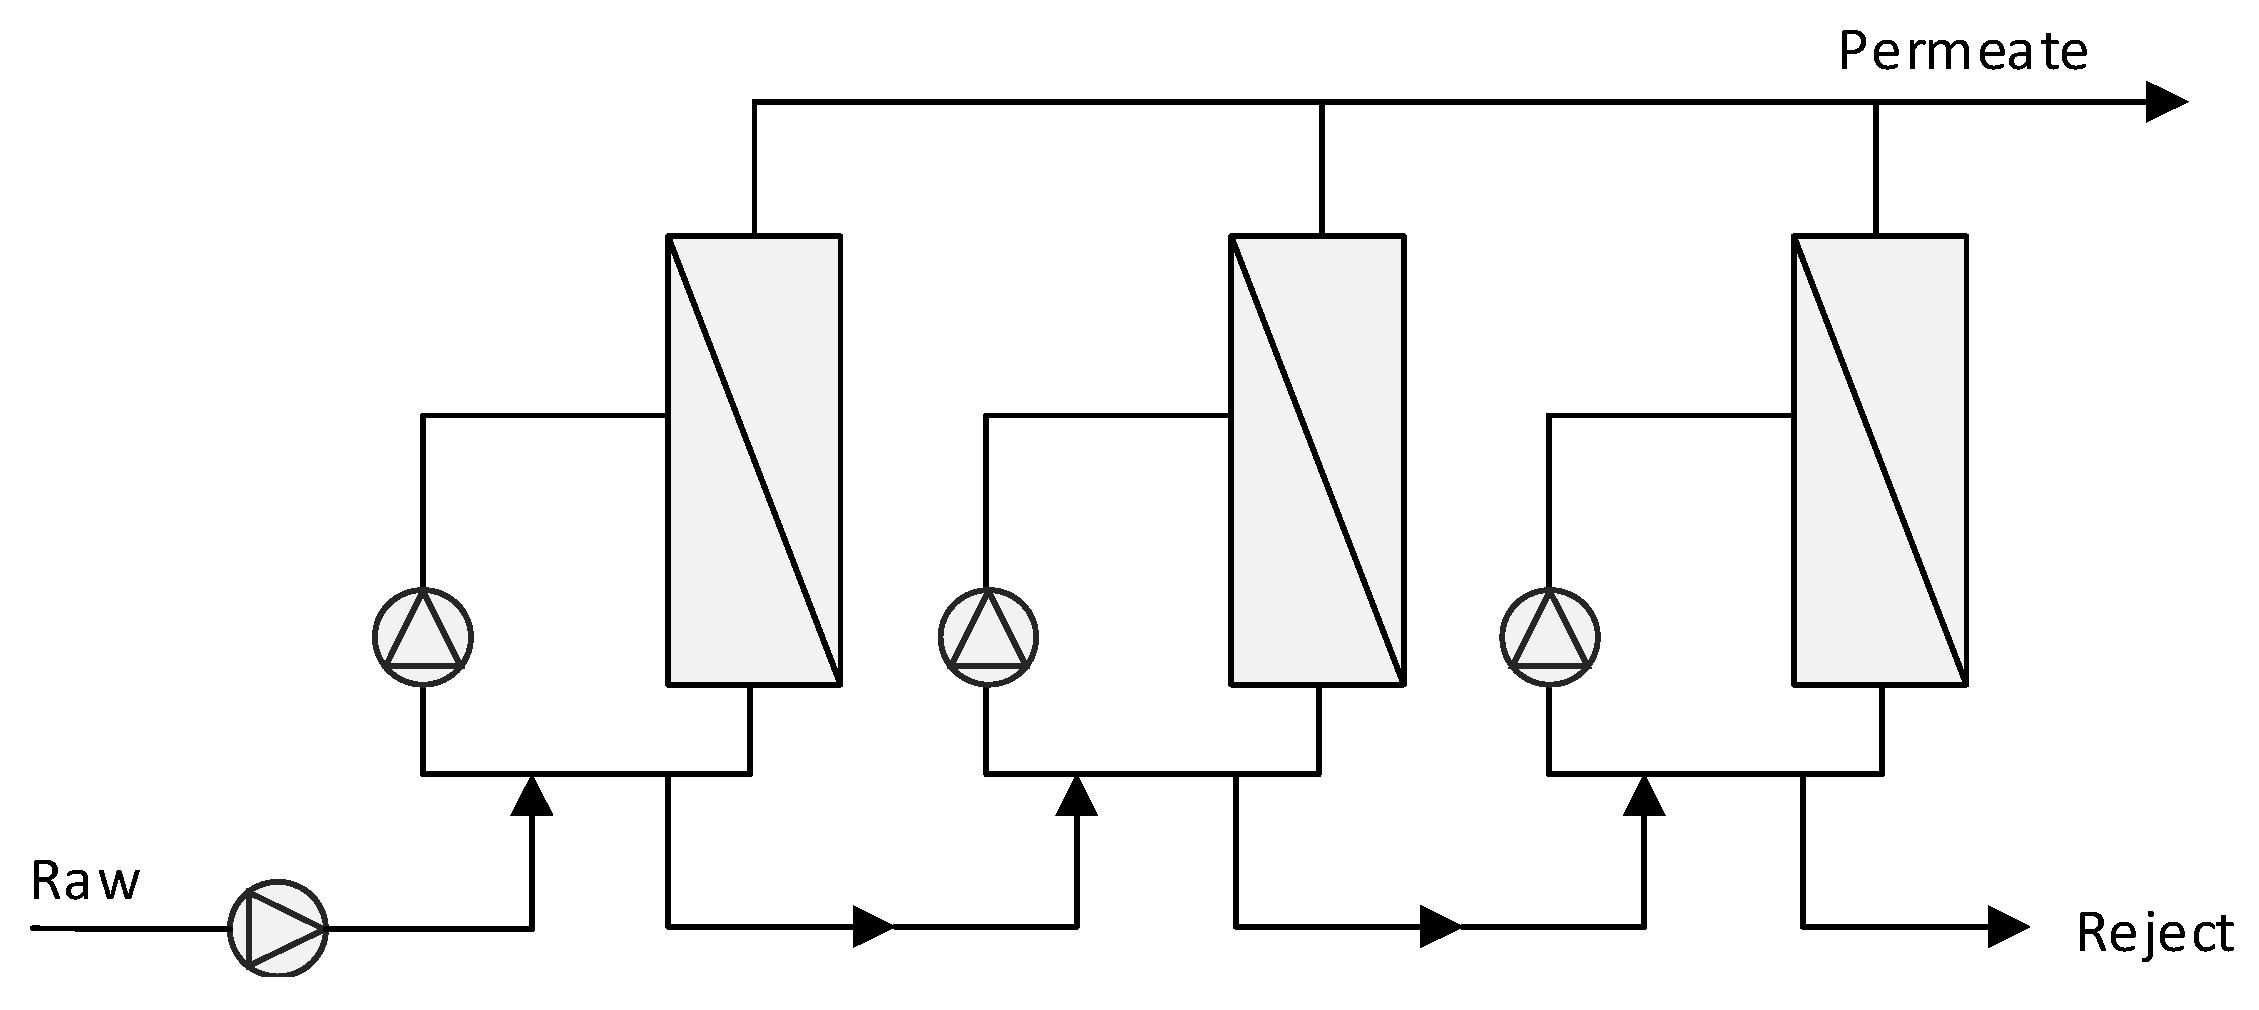
Since one single module has a gross recovery of 50% due to a bleed flow from the circulation, the total recovery is impeded. Including flushing, backwash and chemically enhanced forward flush the recovery for one stage of HFNF is 46.5%. This could be increased by reusing the flush and backwash water, which is as much as 3.4% of the produced permeate. A usual solution to increase the recovery is a multistage, continuous process (
Figure 3). Such process would increase the total recovery to either 83.3%, or to 85.8% with reused backwash/flush.
In this study, the membrane was hydraulically cleaned every hour and chemically cleaned every 36 h without any sign of fouling that could cause problems. From these settings, each membrane has a preset downtime of 5.6%, which is lower than for the HFUF. The percentage downtime can be affected by the number of stages, since the risk of fouling increases down the train due to the higher organic and inorganic load, and the last stage would need cleaning more frequently than the first one. This downtime does not include unplanned disturbances or integrity tests, but if the latter were performed in every filtration cycle, i.e., after every chemically enhanced forward flush (CEFF), the downtime would increase to 5.7%.
3.3.2. Chemicals
The main chemical consumption from the HFNF process occurs during the CEFF. For this process, mainly an oxidizing (basic) chemical clean is needed, since the concentrations of metals are very low in the soft water from Lake Bolmen. The chosen settings required around 0.013 mole NaOCl per m3 produced water, and 0.033 mole NaOH per m3 produced water.
3.3.3. Energy
With decreasing MWCO, energy demand generally increases, due to higher TMP and the addition of a crossflow. Therefore, nanofiltration increases the energy demand compared to ultrafiltration. The high energy demand from nanofiltration comes from a combination of the relatively high pressure, and the circulation pump.
The equation for energy from the circulation pump is:
where
is the friction pressure drop inside one module,
the flow inside one module,
the average flux for one module and the
the membrane area for one module. The average pressure drop of 0.56 bar, and the flow of 0.003 m
3/s (crossflow of 0.5 m/s), gives an energy demand of 0.27 kWh/m
3. The energy demand from the circulation during the CEFF of the membrane is negligible.
In addition to this, there is the energy demand from the pressurizing pump (see Equation (2)). The average TMP for the duration of this trial was 2.9 bar. This corresponds to an energy demand of 0.11 kWh/m
3, from a VR of 86%, which accounts for a continuous process with internal recirculation (
Figure 3), in total this would mean an average energy consumption of 0.39 kWh/m
3 over the year. However, the winter TMP increased to above 4 bar, which increases the energy demand in the winter with almost 50% compared to the average. In this study, the TMP was in general below 3 bar, and it was not until the last month, October, that the TMP increased to significantly higher levels. Unfortunately, the price for the energy is also higher during the winter, which means a double effect on the operational costs during the winter.
In monetary numbers, on average, the energy demand entails a cost of 0.035 €/m3 drinking water. In the summer, the cost is reduced to 0.030 €/m3 drinking water, but during the winter, the cost would temporarily rise to 0.050 €/m3 drinking water.
This HFNF was, however, an early version of the product, and new advances have been made for a more permeable membrane. In addition, raw water from Lake Bolmen presents challenging conditions, which requires a relatively high crossflow and TMP. Experiences presented in Heidfors
et al. [
35] show that a lower TMP, a lower crossflow and a higher recovery can be expected for less challengind conditions. Consequently, presented cost and environmental analyses are site specific, and may even be possible to adjust with a new version of the membrane.
3.3.4. Number of Modules and Lifetime
Including the mentioned downtime, the lost permeate from cleaning, and a flux of 20 L/m2h the number of needed modules is 1370 for a production of 1000 m3/h. Hence, for the same capacity as Ringsjö WTP has today, 7400 modules are needed.
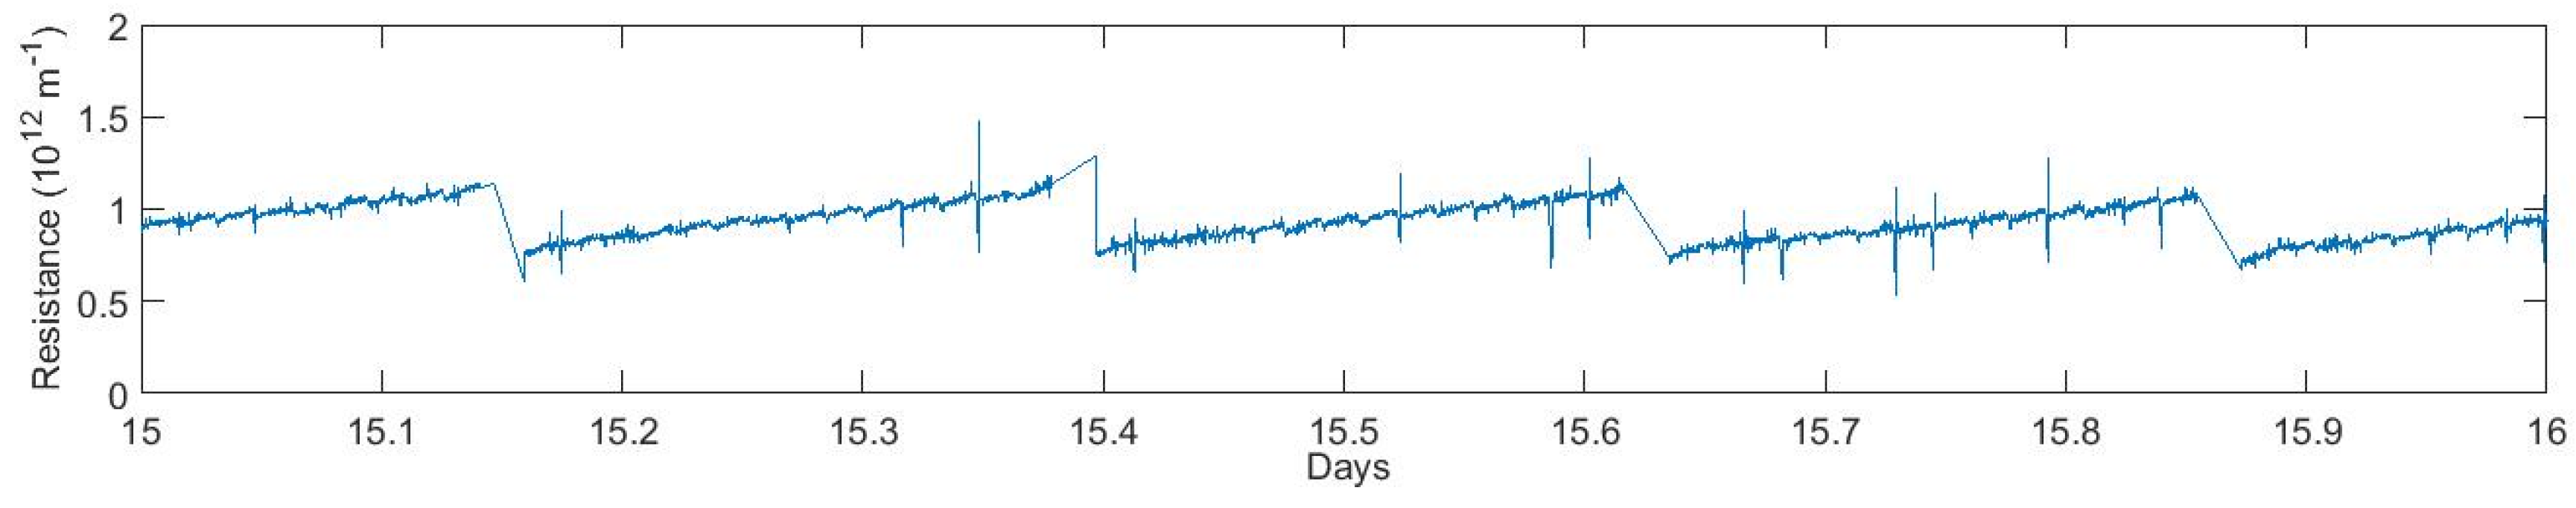
The temperature corrected TMP is relatively constant over time in this study, 2.5–2.8 bar, but the actual TMP increases two-fold for a water temperature difference of 13 °C. Considering the combined membrane and fouling resistance of process,
Figure 4 illustrates the total resistance increase during the HFNF study, from 4.5 × 10
13 to 5.2 × 10
13 m
−1. Both resistance and temperature corrected TMP are calculated considering the difference in viscosity with decreasing temperature. In turn, the resistance is significantly (Spearman
p < 0.001) negatively related to the temperature, although other changes of the feed water quality are small. In addition, the temperature correlated osmotic pressure is not accounted for in this correction factor. Nonetheless, the osmotic pressure should decrease the TMP with lower temperature, and counteract the higher viscosity, thus the osmotic pressure cannot be of any great importance. The increased resistance might be due to the behavior of the solvents on the feed side, affecting the fouling resistance. This will be further discussed in a later work.
An average lifetime of five years per module is assumed, which is guaranteed by the manufacturer. Due to the status of a new product, the lifetime is somewhat unknown. However, there are findings from another study with the same flux and crossflow as in this work, but with lower organic loading and less frequent chemically enhanced forward flushes. After a year, the membrane was examined through an autopsy, and no changes to the membrane surface could be detected between the sampled fibers and the samples taken from virgin fibers [
36].
3.4. Economic Summary
The costs are based on actual prices for Ringsjö WTP for 2015, per tonne chemical or kWh. The costs were calculated in SEK, in which the actual costs were specified, and then converted using the exchange rate 1 € = 9 SEK. In
Table 1, the costs for all the included contributors are presented.
Currently, the costs for producing drinking water at Ringsjö WTP, including all overhead costs, storage and delivery to costumers, is around 0.33 €/m
3. Summarizing the numbers in
Table 1, the total cost of a HFUF process would in total be around 0.35 €/m
3 and the HFNF around 0.43 €/m
3. This would increase the cost for the water with 6% for a HFUF process and with 30% for a HFNF process. However, this is a relatively rough estimation, and other current costs could possibly decrease if a membrane step were introduced.
Most of the increase in the cost for the HFNF compared to the current process, is due to the cost for the membrane modules. However, it is a new and modern technology, and the prices may possibly decrease in the future. This might counteract the increase in cost for a membrane process.
3.5. Assessment of the Environmental Impact
The three methods of water treatment will be compared quantitatively from a climate impact perspective and qualitatively discussed for other environmental factors. The comparison is based on the operation; previous study has shown that 90% of the environmental impact is due to operation and maintenance and the rest from construction [
29,
32]. Therefore, the construction will not be included, since differences in the construction will have minor influence on the results.
The greenhouse gas (GHG) emissions from the general grid in the Northern European (Nordic) countries are 100 g CO
2 eq/kWh [
37]. However, Sweden has high percentage of electricity production from renewal energy, and the GHG emissions are estimated to 20 g CO
2 eq/kWh [
37]. In
Table 2, the GHG for the two types of grids are presented. The ranges of the emissions follow the differences in energy demand between the processes.
The production of the chemicals used in the process also leads to GHG emissions. The GHG emissions are calculated in CO
2-eq/m
3 deliverable water (
Table 3), using data from Alvarez-Gaitan
et al. [
38] for all but HCl that was calculated from Leimkühler [
39].
According to Bonton
et al. [
29], the nanofilter module replacement leads to 3 g CO
2-eq/m
3 drinking water. However, this estimation assumes a lifetime of 8–15 years. A lifetime of 5–7 years is assumed in this work, hence, the replacement of HFNF modules is assumed to release 6 g CO
2-eq/m
3. The HFUF is around three times as efficient per surface area, therefore, 2 g CO
2-eq/m
3 will be assumed.
However, the GHG emissions from the chemicals are calculated in an Australian context, where electricity generation is fossil fuel based. Compared to Nordic grid, the Australian grid releases eight times as much GHGs per kWh. In
Table 4, the GHG emissions have been summarized. The summary includes calculations for both the Nordic grid and the Swedish grid. Since the chemicals used at Ringsjö WTP are principally produced in Sweden, the sensitivity of the analysis is checked by halving the GHG emissions from the chemical production. It is probable that the chemicals produced in Sweden have lower emissions. Note that if the cleaning regime of the HFUF would be changed and use less cleaning chemicals, the GHG emission for the HFUF would decrease with around 20 g CO
2-eq/m
3 (10 g CO
2-eq/m
3 for half impact from the chemicals).
Connected to a grid with a large percentage of renewable sources, the HFNF process has the lowest impact on the climate (
Table 4). HFUF has lower emission than the conventional for all situations. Europe has a grid mix that releases 4.5 times as much GHG than the Nordic, thus this comparison is country specific. However, in Europe, there is a current transformation of the electricity generation, and this will be favorable for the membrane technology. Compared to the lifecycle assessment of HFUF and conventional treatment from Uftec [
40], the numbers are in the same range, although a European grid mix must have been accounted for.
Other impacts on the environments give more perspectives to the environmental impact assessment. It has been shown that a nanofiltration process has lower impact on human health and ecosystem quality than conventional water treatment [
29]. Waste and emissions are produced from the chemical production, and mining and transports have effect on the ecology and human environment. Additionally, coagulants in water treatment are a metal end use, no matter if it is produced from scrap metal or ore. In addition, the chemicals in the sludge from the WTP have effect on the local environment. HFNF has a great advantage since the need for chemicals is very low, and the only consumption remaining is from cleaning of the membrane. Resulting in no surplus metals in the wastewater from the process, the wastewater is easy to treat and only requires removal of residual chlorine and neutralization of the pH.
However, the large volume of bleed water from the HFNF would entail other challenges for Ringsjö WTP. The origin of the raw water is a lake located 100 km away from the treatment plant and the closest water body is Lake Ringsjön. From an aquatic ecological perspective, this is not an option. If the discharge to the bog were kept instead of the thickened sludge, the reject and backwash waste could be released onto the bog. If the water passed through a wetland system before the outlet into the creek Rönne å, the bog could become an environment for increased biodiversity, instead of the current adverse effect. For ultrafiltration, the issue of metal containing wastewater would still remain, but the concentration would be half, and the environmental impact would be lower. The reject from the HFUF process could be handled in the same way, but with a clarification step before. However, the issue of handling the sludge would still remain if the HFUF were chosen.
The environmental impact of the sludge is only local, the concentrations of metals and organics in the outlet into the creek Rönne å has no elevated values. An increase of the water passing through the bog would probably lead to a possible increase in the transportation of organic matter, especially during wet periods. In addition, the flow of the discharge into the creek would increase, but the total wastewater for a process with HFNF equivalent to the current production would only be in the range of 1% of the total flow in the creek.
4. Discussion
There are many aspects to consider regarding costs and environmental impact before choosing a treatment method. In this case, especially with reference to the HFNF, there is no surprise that better drinking water quality and lower environmental impact come with a price. Although there are apparent advantages with HFNF, e.g., better drinking water quality, safer drinking water and lower environmental impact, it would be a challenge to justify a large increase in the price to the consumers, even though, from the perspective of sustainability, the improvements could be worth its cost. Lower emissions from GHG, wastes and sludge advocates for a switch into new methods in the drinking water production.
The issue of environmental impact of the sludge from the drinking water production is not unique for Ringsjö WTP, all WTPs using a metal containing coagulant have similar challenges. Hence, although this example is for the conditions at Ringsjö WTP, the argument for a better local environmental impact is valid at many localities, if substituting the conventional chemical treatment with a filtration step by HFNF. Research on reuse of sludge from WTPs has gained its share of attention [
41], and although possible reuses have been found, such as phosphorous removal [
42], the proportion that can be used is small, and there is still the issue of creating waste, but in a new form. Hence, from a sustainability perspective, a decreased or eradicated concentration of metals in the sludge from the WTPs would be the best option.
Regarding energy demand, nanofiltration is known to have a large demand due to the required pressures and crossflow. From a sustainability perspective, the energy consumption should decrease and not increase, especially considering the climate impact. Nonetheless, there are ways to nuance the discussion. In fact,
Table 4 shows that nanofiltration does not necessarily demand more energy, but instead, the energy consumption moves from the production of chemicals to hydraulic requirements at the WTP. In addition, looking at the current energy consumption and climate impact by an inhabitant of Sweden, the part that can be derived from drinking water production is a fraction of 1%. Thus, it is not reasonable to justify savings in the production of drinking water by a lower climate impact, with resulting impairment on the water quality.
Continuously, changing into a less chemical intense process could increase the water security. Storms and snowy weather may prohibit the transports from reaching the plant, due to its remote location. The storage is limited at the facilities, and decreasing the use of chemicals would increase the number of days the storage volume can support. Fewer loadings of the storage tanks also decreases the number of times the personnel needs to handle harmful and corrosive substances. Reversely, the increased energy demand requires a double capacity for emergency generation of electricity during power outage, which is an existing occurrence in the area. Nevertheless, membrane processes can easily be restarted after a shorter downtime. Reserve storage of drinking water is already in place, so the membrane step in the treatment process may be down for a short period of time without any scarcities.
There are advantages with the HFUF compared to the conventional treatment, especially considering the increased safety, with a better microbiological barrier. However, the mentioned issues regarding the local environmental impacts are merely ameliorated, not solved. Thus, although small, the extra costs for a HFUF is not as easily justified, if compared to the possible improvements from another method exemplified by the HFNF. Certainly, if building a new line, the HFUF can be preferable to a conventional treatment step, due to its space efficiency and microbiological barrier effect. However, the improvement is currently not enough to motivate a replacement of the existing facilities with the aim of improved NOM removal, even considering the possible improvements of the HFUF operation that can be realized from the optimal coagulant choice and settings. Regarding the improved NOM removal, the HFNF is superior to the other two processes, but a better removal and a safer drinking water comes with a price. Considering the importance of a safe drinking water supply, and the trend of changing raw water quality, in time, the increased costs could likely be regarded as necessary.
5. Conclusions
Membrane technology may decrease the environmental impact. The decrease is larger for the HFNF than for the HFUF, especially since the coagulation pre-treatment results in discharge of metals into the ecosystem. In addition, if the electricity has the same character as the Swedish or Nordic mix of energy sources, the HFNF results in lower emissions of greenhouse gases, although it doubles the energy demand. With a Nordic grid and a decreased impact from the chemicals, the greenhouse gas emissions are around 100 g CO2-eq/m3 for all three methods. With a Swedish grid and full emissions from the chemicals, the GHG emissions are cut in half by a HFNF process (83 g CO2-eq/m3), compared to the existing process (161 g CO2-eq/m3), but HFUF would also lower the emissions (127 g CO2-eq/m3) due to lower chemical consumption. However, a better drinking water quality and a lower environmental impact have a higher cost, since a HFNF process costs around 30% more than the total cost for the drinking water company today; the costs would increase from 0.33 €/m3 to 0.43 €/m3. A HFUF process entails a cost of 0.35 €/m3, an increase of 6%, which introduces a good microbiological barrier, but it does not improve NOM removal and the effect on the local ecosystem partly remains.


