Article

Treatment of Liquor Wastewater by an Integration of Anaerobic Digestion, Partial Nitrification/Anammox, and Fenton Process: Performance and Microbial Analysis

1
School of Civil Engineering and Architecture, Wuhan Polytechnic University, Wuhan 430023, China
2
State Key Laboratory of Lake and Watershed Science for Water Security, Institute of Hydrobiology, Chinese Academy of Sciences, Wuhan 430072, China
3
Kweichow Moutai Distillery Co., Ltd., Zunyi 564501, China
4
Central and Southern China Municipal Engineering Design and Research Institute Co., Ltd., Wuhan 430010, China
5
School of Civil Engineering, Wuhan University, Wuhan 430072, China
*
Author to whom correspondence should be addressed.
These authors contributed equally to this work.
Water 2026, 18(10), 1179; https://doi.org/10.3390/w18101179
Submission received: 3 April 2026 / Revised: 3 May 2026 / Accepted: 7 May 2026 / Published: 13 May 2026

Abstract

This study designed an integration of anaerobic digestion, partial nitrification/Anammox (PN/A), and Fenton process to efficiently treat high-concentration organic liquor wastewater (HCLW). Results indicated that when the diluted ten-fold mixture of boiler bottom water and cellar bottom water with the ratio of 5:1 was used as influent, the average concentrations of COD, TN, NH4+-N, NO2-N, and NO3-N in effluent of biological treatment for this process were 180.00, 12.64, 1.74, 0.13, and 2.45 mg/L, respectively. To meet the requirement for direct discharge of HCLW, Fenton oxidation with 600 mg H2O2/L and 300 mg Fe2+/L was used to further reduce the COD concentration. Three-dimensional fluorescence spectra analysis revealed that the process effectively altered the organic molecular structure and degraded some large molecular proteins. Microbial community analysis showed that Methanobacterium (20.98% → 31.52%) and Methanosaeta (9.70% → 19.34%) in AD, Azoarcus (no detected → 10.49%) and Nitrosomonas (1.68% → 6.16%) in PN, and Candidatus_Brocadia (18.80% → 20.31%) and Ignavibacterium (no detected → 5.11%) in Anammox were dominant in this system. This study provided a pioneering industrial solution for the efficient and stable treatment of HCLW.

1. Introduction

Sauce-flavor liquor (SFL) is one of the four basic flavors of liquor and very popular in China [1,2,3]. The liquor wastewater produced in the production process of SFL can be divided into low-concentration organic liquor wastewater (LCLW) and high-concentration organic liquor wastewater (HCLW). HCLW mainly includes raw-material rinsing soaking water, cellar bottom water, and pot bottom water, while LCLW mainly includes cooling water, bottle washing water, and site rinsing water. Although HCLW is only approximately 5% of the total liquor wastewater, it is characterized by complex composition, low pH, high chemical oxygen demand (COD), and high ammonia nitrogen content [4]. Hence, HCLW is generally difficult to treat. In order to avoid the adverse impact of high COD and ammonia nitrogen content on the subsequent wastewater treatment system, it should be collected and treated separately.
Due to complex composition and high organic load, HCLW is usually treated by a combination of biological treatment and deep treatment to meet increasingly stringent discharge standards. The biological treatment (such as anaerobic digestion, activated sludge treatment, and algal-bacterial granular sludge) is to significantly reduce the concentrations of COD and nitrogen content of HCLW by biodegradation [5,6]. The deep treatment (such as activated carbon adsorption, coagulation and precipitation, and Fenton oxidation) is to ensure the wastewater after biological treatment to reach the discharge standard of liquor wastewater [7]. As a high-reliability, low-energy-consumption, and low-cost treatment method, anaerobic digestion (AD) is especially suitable for the treatment of HCLW [5]. However, during the process of degrading organic matter, AD can generate a significant amount of ammonia nitrogen [8], which can impair nitrogen removal efficiency in subsequent biological treatment processes [8,9]. Consequently, particular attention must be given to nitrogen removal in wastewater treatment units following AD for the treatment of HCLW. At present, nitrification-denitrification process or its variant process are the most common biological nitrogen removal technology [10]. But these common biological nitrogen removal technologies have the disadvantage of large energy consumption, high cost, and excessive emissions of N2O [11], which do not meet the demand of low-carbon economy of the Chinese liquor industry. To address this problem, the coupling process of partial nitrification and Anammox (PN/A), as an emerging anammox-centered biological nitrogen removal technology, has garnered significant attention in saving aeration energy, carbon-source dosing, and operational costs [12,13,14,15,16]. In this process, a portion of NH4+-N is oxidized to NO2-N by ammonia-oxidizing bacteria (AOB) within the nitrifying bacterial community. Subsequently, anaerobic ammonium-oxidizing bacteria (AnAOB) utilize the remaining NH4+-N to reduce NO2-N to N2, thereby achieving complete autotrophic biological nitrogen removal [17]. Theoretically, the coupling method of AD and PN/A has efficient effect in nitrogen removal and carbon reduction for HCLW. However, HCLW often contains a certain quantity of nonbiodegradable organic pollutants, which can still remain in effluent after treatment and has potential biological toxicity. Even if the effluent after being treated by coupling method of AD and PN/A can meet the discharge standards, the ecological toxicity risk of the exposure of residual nonbiodegradable organic pollutants cannot be fully determined. Advanced oxidation process (AOPs) uses the oxidation power of hydroxyl radicals (OH·) to quickly and efficiently remove nonbiodegradable pollutants and is one of the most effective methods to deal with nonbiodegradable organic wastewater [18,19,20]. Among the various AOPs, Fenton process is the most widely used for the decomposition of organic pollutants, owing to its powerful oxidizing capability, process simplicity, low reagent cost, and ease of industrialization [21,22,23]. Now, it is reported that the Fenton process as a deep treatment to treat the effluent of Anammox exhibited an excellent removal efficiency of N and COD [24,25]. Nevertheless, the treatment of HCLW by the integration process of AD, PN/A, and Fenton process is seldom reported.
In this study, an integration process of AD, PN/A and Fenton was constructed to treat the pot water and cellar water of a SFL enterprise in southwest China. The primary objectives were to establish an efficient and stable treatment of HCLW. In this integration process, high-efficiency reduction in COD by AD in an up-flow anaerobic sludge bed (UASB) was performed, followed by PN in a sequencing batch reactor (SBR) to oxidate NH4+-N into NO2-N. Then, a part of the effluent from AD reactor and the effluent from PN reactor was mixed to achieve low-carbon nitrogen removal by an Anammox in another UASB. Finally, to meet direct discharge standards and reduce the potential biological toxicity, Fenton as a deep treat method was used. The outcomes of this investigation are expected to develop an efficient treatment technology for HCLW treatment.

2. Materials and Methods

2.1. Seed Sludge and Wastewater

The acclimated anaerobic granular sludge was taken from a laboratory’s long-term acclimated internal circulation (IC) reactor, and its mixed liquid suspended solids (MLSS) concentration was 2565 mg/L. Five hundred mL of activated sludge from an aerobic tank of a wastewater treatment plant in Wuhan was inoculated in a SBR for PN process. Prior to inoculation, it was stored in an anaerobic environment for two days to selectively inhibit nitrite oxidizing bacteria (NOB) and promote the enrichment of Ammonium oxidizing bacteria (AOB), thereby creating favorable conditions for the startup and stable operation of the PN process. The inoculated Anammox granular sludge (AnGS) with a reddish-brown granular shape in this study was sourced from a laboratory’s long-term acclimated Anammox reactor, and its MLSS was 2580 mg/L.
The boiler bottom water and cellar bottom water was taken from Kweichow Moutai Distillery Co., Ltd., Zunyi, China. The influent for AD was the diluted ten-fold mixture of boiler bottom water and cellar bottom water with the ratio of 5:1. The wastewater quality indicators of influent for AD are listed in Table S1 (Supplementary Materials). The NH4Cl concentration of artificially simulated wastewater for PN was set as described in Section 2.3.1. Other components of artificially simulated wastewater for PN are as follows (per L): 70 mg KH2PO4, 25 mg CaCl2,40 mg MgSO4·7H2O, 9 mg FeSO4·7H2O, 6 mg EDTA, and 0.5 mL trace elements. The concentration of NH4Cl and NO2-N for Anammox was set as described in Section 2.3.1. Other components of artificially simulated wastewater for Anammox are as follows (per L): 30 mg KH2PO4, 185 mg MgCl2·6H2O, 135 mg CaCl2, 1 mL trace elements. Trace element (per L): 5 g EDTA-2Na, 0.45 g ZnSO4·7H2O, 0.5 g MnCl2·4H2O, 0.2 g NiCl2·6H2O, 0.015g H3BO4, 0.24 g CoCl2·6H2O, 0.3 g CuSO4·5H2O.

2.2. Equipment and Control Parameters

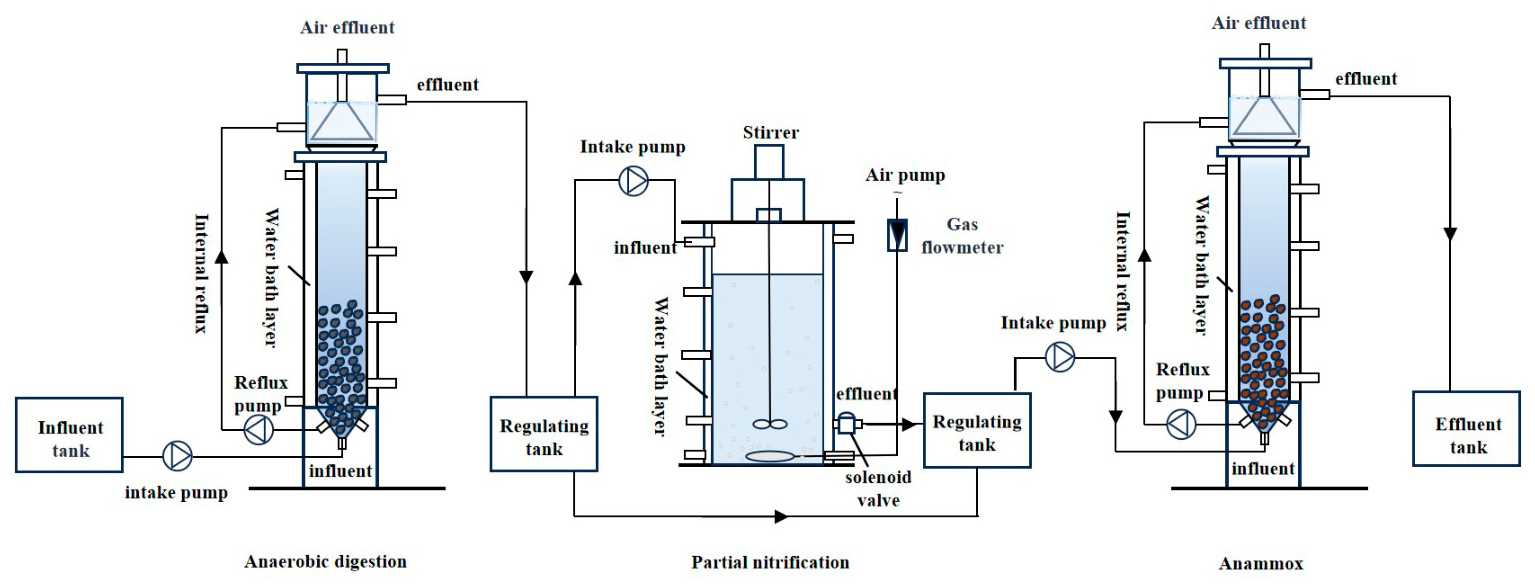
The AD, PN/A system was composed of a UASB for AD, a SBR for PN, and another UASB for Anammox. UASB for AD and Anammox was composed of a double-layer cylinder; the inner layer was the reaction zone, and the outer layer was the water bath layer. The inner diameter, height, and effective volume of UASB was 8 cm, 50 cm, and 2 L, respectively. The water bath layer maintained the temperature of the inner layer at around 32 ± 0.5 °C. There was a three-phase separator at the top, which utilized the density difference in gas–liquid–solid three-phase medium to realize the separation of mud and water. SBR for PN was a double layer cylinder made of plexiglass; the inner layer was the reaction layer, and its inner diameter, height, and effective volume were 18 cm, 35 cm, and 5 L, respectively. The outer layer was the thermal insulation layer to maintain the temperature of the inner layer at around 32 ± 0.5 °C. The operation process of SBR was described in Supplementary Material (Table S2). The system was controlled by peristaltic pumps and solenoid valves for the influent and effluent of SBR, respectively. The inflow time and flow rate were controlled by a timer that managed the peristaltic pump’s on and off states. The operating time of the stirrer and air pump was also regulated by a timer, while the aeration volume within SBR was controlled by a gas flow meter to maintain an OD concentration of approximately 0.6 mg/L. The aeration method adopted in this experiment was micro-hole aeration.

2.3. Experimental Setup and Procedure

The AD, SBR, and Anammox reactor temperature was controlled at 32 ± 0.5 °C, hydraulic retention time (HRT) of 24 h. In order to start smoothly and achieve the stable operation of this process, the divided AD, PN, and Anammox reactors was firstly startup and stably operated. After that, these three stably operating divided reactors were connected in series. Finally, the effluent from the Anammox reactor conducted advanced treatment before being discharged.

2.3.1. Startup and Stable Operation Phase for Three Divided Reactors

AD Startup and domestication phase: The boiler bottom water and cellar bottom water was mixed with the ratio of 5:1, and the mixed solution was diluted 10 times. Then 1 M NaOH was added into the diluted mixture to adjust the pH to 7.0~7.5. Finally the mixture was used as the influent for AD.
The operating parameters for the setup of PN and Anammox are listed in Supplementary Material (Table S3).
PN domestication phase: (1) Domestication phases I (1–10 days): the influent of SRB was the mixture of simulated wastewater and AD effluent with a volume ratio of 3:1; (2) Domestication phases II (11–19 days): the influent of SRB was the mixture of simulated wastewater and AD effluent with a volume ratio of 2:1; (3) Domestication phases III (20–28 days): the influent of SRB was the mixture of simulated wastewater and AD effluent with a volume ratio of 1:1; (4) Domestication phases IV (29–62 days): only AD effluent was used as the influent of SRB.
Anammox domestication phase: (1) Domestication phases I (1–10 days): Firstly, the AD effluent and PN effluent were mixed with a volume ratio of 1:4, then the mixture of AD effluent and PN effluent was mixed again with simulated wastewater used at startup phase III with a volume ratio of 3:1 to utilize as the influent of Anammox; (2) Domestication phases II (11–19 days): Firstly, the AD effluent and PN effluent were mixed with a volume ratio of 1:4, then the mixture of AD effluent and PN effluent was mixed again with simulated wastewater used at startup phase III with a volume ratio of 2:1 to utilize as the influent of Anammox; (3) Domestication phases III (20–27 days): Firstly, the AD effluent and PN effluent were mixed with a volume ratio of 1:4, then the mixture of AD effluent and PN effluent was mixed again with simulated wastewater used at startup phase III with a volume ratio of 1:1 to utilize as the influent of Anammox; (4) Domestication phases IV (28–40 days): the influent of Anammox used only the mixture of AD effluent and PN effluent with a volume ratio of 1:4.

2.3.2. The AD, PN/A Coupling Process

Based on the above stable operation of three divided reactors, three divided reactors were connected in series together as shown in Figure 1. The influent of AD was the diluted ten-fold mixture of boiler bottom water and cellar bottom water with the ratio of 5:1. The effluent from the AD was then used as the influent for PN. Finally, the ratio of the effluents of AD and PN was mixed with a volume ratio of 1:4 to serve as the influent of Anammox.

2.3.3. Fenton Oxidation Process

Fenton oxidation was used for advanced treatment. The operational steps for the Fenton oxidation test are as follows: First, take 500 mL of water sample into a 1 L beaker and adjust the pH to around 3 using 1 M H2SO4. Then the solution was stirred slowly, and a certain amount of FeSO4·7H2O solid powder was added. After 2 min, a certain amount of 30% H2O2 was added. The specific dosage of H2O2 and ferrous ion have been added in Supplementary Material (Table S4). After that, the solution was stirred at 350 rpm for 30 min to ensure thorough Fenton reaction. After stirring, 2 mol/L NaOH solution was added into the water sample to adjust the pH into 7–8 to create suitable conditions for subsequent flocculation. During flocculation, polyaluminum chloride (PAC) and polyacrylamide (PAM) were used as flocculant and coagulant, respectively. First 50 mg PAC was added, and stirred at 350 rpm for 3 min to thoroughly mix it with the water sample. Then, 1 mg PAM was added, and the stirring speed was reduced to 50 rpm for another 3 min.

2.4. Measurement and Analysis

The concentrations of NH4+-N, NO2-N, NO3-N, TN, and COD were measured according to established standard methods [26]. Dissolved organic matter (DOM) three-dimensional fluorescence spectra were used to measure the DOM in the influent and effluent.

2.5. Illumina MiSeq Sequencing Analysis

The microbial community profiles in AD, PN, and Anammox reactors at different stages during this experiment were analyzed on the Illumina MiSeq sequencing 4000 platform (Majorbio Bio-Pharmaceutical Technology Co., Ltd., Shanghai, China). Ten mL sludge samples were collected from the top, middle, and bottom sections of the fiber packing, then mixed and centrifuged, and then stored in an ultra-low-temperature freezer at −80 °C for unified analysis later. The sampling times and corresponding names for each sludge sample are listed in Table 1. These collected sludge samples from different stages of reactor operation were sent to Shanghai Majorbio Bio-Pharmaceutical Technology Co., Ltd. to analyze microbial community structure by 16S rRNA gene sequencing.
Genomic DNA was extracted from the sample communities using the E.Z.N.A.® soil DNA Kit (Omega Bio-tek, Norcross, GA, USA) according to the manufacturer’s instructions. To extract the genomic DNA, DNA concentration was measured using NanoDrop2000 spectrophotometer (Thermo Scientific, Waltham, MA, USA). The region V3-V4 of the bacterial 16S rRNA gene and the region V4-V5 of the archaea 16S rRNA gene were amplified with primer pairs 338F/806R and 515FmodF/806RmodR by T100 Thermal Cycler PCR thermocycler (BIO-RAD, Hercules, CA, USA), respectively. Purified amplicons were pooled in equimolar amounts and paired-end sequenced on an Illumina Nextseq2000 platform (Illumina, San Diego, CA, USA) according to the standard protocols by Majorbio Bio-Pharm Technology Co. Ltd. (Shanghai, China).

2.6. Calculations

Ammonia nitrogen removal rate (ARE) indicates the effect of the reactor in removing NH4+-N. ARE is calculated using Equation (1) as follows:
A R E = C ( N H 4 + N ) i n f C ( N H 4 + N ) e f f C ( N H 4 + N ) i n f × 100 %
In Equation (1), C ( N H 4 + N ) i n f and C ( N H 4 + N ) e f f represent the NH4+-N concentrations in the influent and effluent, respectively.
COD removal rate indicates the effect of the reactor in removing organic matter. COD removal rate is calculated using Equation (2) as follows:
C O D = C ( C O D ) i n f C ( C O D ) e f f C ( C O D ) i n f × 100 %
In Equation (2), C ( C O D ) i n f and C ( C O D ) e f f represent the C O D concentrations in the influent and effluent, respectively.
Nitrite nitrogen accumulation rate (NAR) represents the accumulation effect of NO2-N generated in PN process. NAR is calculated using Equation (3) as follows:
N A R = C ( N O 2 N ) e f f C ( N O 2 N ) e f f + C ( N O 3 N ) e f f × 100 %
In Equation (3), C ( N O 2 N ) e f f and C ( N O 3 N ) e f f represent the NO2-N concentration and the NO3-N concentration in the effluent, respectively.

3. Results and Discussion

3.1. Startup and Domestication Phase for Three Divided Reactors

3.1.1. Startup and Domestication Performance of AD

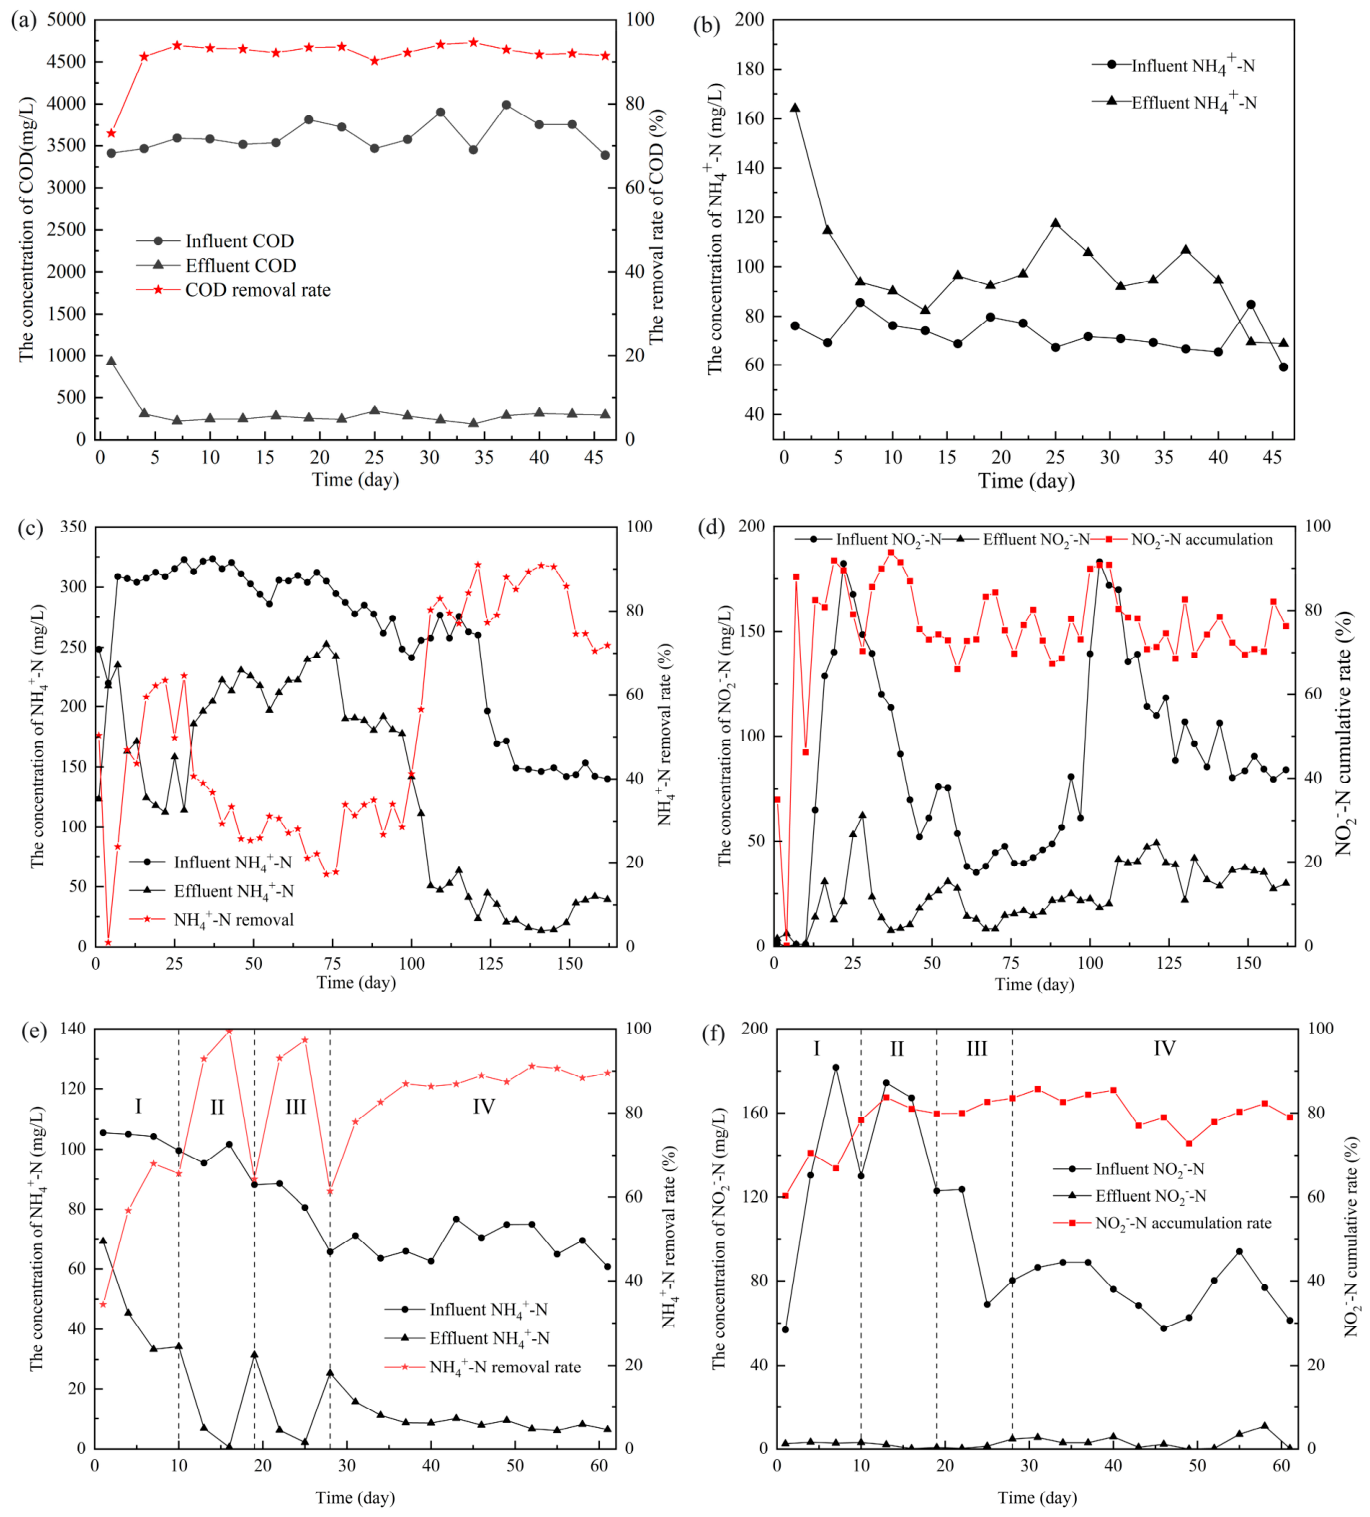
The changes in the concentration of COD in the influent and effluent, as well as COD removal efficiency, are shown in Figure 2a. Due to the activity of anaerobic granular sludge not fully recovered, the effluent concentration of COD and COD removal rate at the beginning was 921 mg/L and 73%, respectively. As the reactor continued to operate, the AD community gradually adapted to the new environment. On the fourth day, the performance of AD significantly improved, and the COD removal rate exceeded 90%, indicating that the inoculated anaerobic granular sludge had strong environmental adaptability and rapid recovery capability. After 45 days, the reactor demonstrated excellent stability; the average concentrations of COD in the effluent and COD removal rate were 267.1 mg/L and 90%, respectively. From Figure 2a, it could be observed that the COD removal rate curve during the entire startup stage exhibited a ‘rapid rise-stable maintenance’ characteristic, which demonstrated that AD was successfully quickly started and reflected a strong adaptability of the anaerobic granular sludge. Additionally, the stability of the effluent COD indicated that a good microbial ecosystem had been established within AD reactor, where various anaerobic microorganisms had formed stable symbiotic relationships.
The variation in NH4+-N concentration during the startup phase of AD was presented in Figure 2b. In the early stages of startup phase, the NH4+-N concentration in the effluent was significantly higher than that of the influent. At 1st day, the effluent NH4+-N concentration reached 125 mg/L, which was approximately 2.08 times higher than the influent concentration (60 mg/L). This phenomenon could be attributed to the partial decomposition of organic nitrogen within the anaerobic granular sludge, where organic nitrogen was converted into NH4+-N under anaerobic conditions. Consequently, the initial effluent exhibited a relatively high NH4+-N concentration. As the reactor continued to operate, the effluent NH4+-N concentration demonstrated a gradual decreasing trend. During days 7–10, the effluent NH4+-N concentration decreased to a range of 70–80 mg/L, indicating the system began to stabilize. After, the effluent NH4+-N concentration fluctuated in the range of 65–75 mg/L, with an average increase of 11.31 mg/L compared to the influent NH4+-N concentration. This suggested that the degradation rate of organic nitrogen and the generation rate of NH4+-N within the system had reached a dynamic equilibrium. After 45 days, the difference between the effluent and influent NH4+-N concentrations stabilized at approximately 10 mg/L. This stability of influent NH4+-N concentration was of great significance for the effective operation of the subsequent PN/A process.

3.1.2. Startup and Domestication Performance of PN

The variations in the concentration and removal rate of NH4+-N during the startup phase of PN are presented in Figure 2c. And the accumulation rate of NO2-N in the effluent during the startup phase of PN are presented in Figure 2d. During days 1–12, despite that the effluent NO2-N concentration was only 1 mg/L, the removal rate of NH4+-N still reached 50%. This might be attributed to the fact that during the early startup phase, AOB had not yet fully stabilized or enriched, and NOB exhibited relatively low activity. Additionally, other microorganisms within the system were likely involved in NH4+-N conversion or participated in alternative biological processes, thereby contributing to the removal of NH4+-N. At the 13th day, the effluent NO2-N concentration rapidly increased to 65.02 mg/L, with an accumulation rate of NO2-N reaching 82%. At the 124th day, the effluent NO2-N concentration fluctuated and dropped below 50 mg/L, indicating that the microbial community was still undergoing dynamic adjustment. During days 125–162, as the influent NH4+-N concentration decreased, the effluent NO2-N concentration stabilized around 80 mg/L, and the NH4+-N removal rate and NO2-N accumulation rate both remained consistently above 70%. This suggested that PN had successfully achieved startup.
The removal efficiency of NH4+-N and the accumulation of NO2-N during the domestication phases of PN are depicted in Figure 2e,f. In domestication phases I, NH4+-N removal rate increased from 33.1% to 55.2%, and the concentration of NO2-N in the effluent also increased from 17.3 mg/L to 54.9 mg/L. In domestication phases II, the NH4+-N removal rate exceeded 90%, and the concentration of NO2-N in the effluent also increased from 40.1 mg/L to 53.3 mg/L, indicating this PN system had a good adaptability. In domestication phases III, NH4+-N removal rate increased from 64.3% to 97.8%, and the concentration of NO2-N in the effluent increased from 38.2 mg/L to 44.2 mg/L. In domestication phases IV, NH4+-N removal rate increased from 62.1% to 89.8%, and the concentration of NO2-N in the effluent eventually stabilized around 22.9 mg/L. As shown in Figure 3c,d, with the increasing of the proportion of actual wastewater, the NH4+-N removal efficiency and the concentration of NO2-N in the effluent decreased. This phenomenon could be attributed to the adverse effect of the high COD concentration in the AD effluent on PN. In domestication phases IV, the average NH4+-N removal rate was 84.8%, while the average NO2-N concentration and average NO2-N accumulation rate in the effluent was about 22.9 mg/L and 80.8%, respectively. Hence, stepwise increasing in the ratio of AD effluent not only ensured stable operation of PN, but also obtained a high NH4+-N removal and NO2-N accumulation rate, which could provide adequate NO2-N substrates for the subsequent Anammox.

3.1.3. Startup and Domestication Performance of Anammox

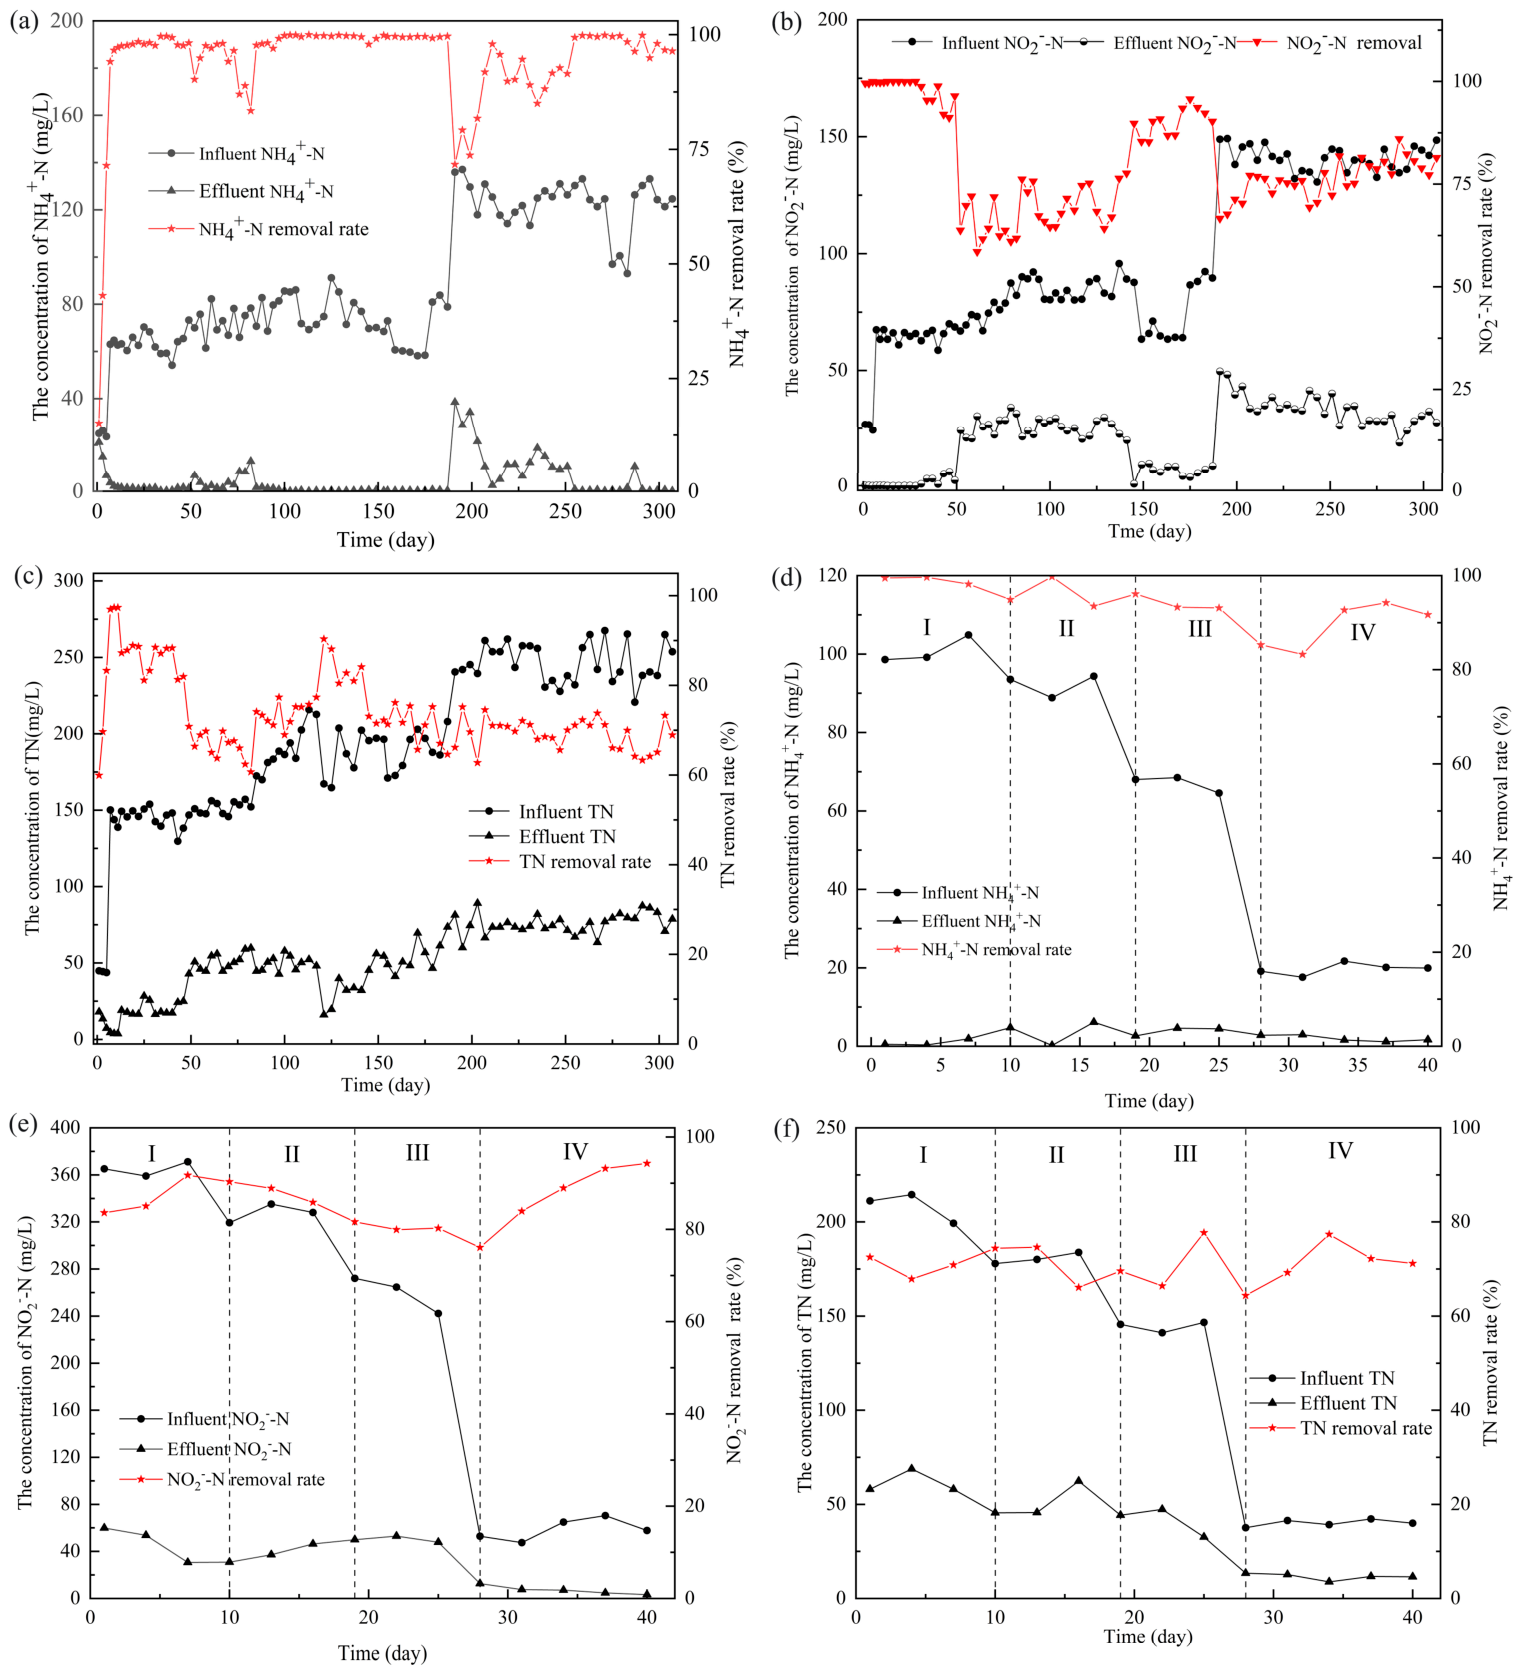
Figure 3a shows the changes in NH4+-N concentration and NH4+-N removal rate during the startup phase of Anammox. At the early startup stage (1-6 days), AnGS needed time to adapt to the new environment, resulting in a low NH4+-N removal rate. After 6 days, AnGS gradually regained its activity, and the NH4+-N removal rate increased to 94%. During days 7-190, the NH4+-N concentration in effluent was raised to 50–60 mg/L, demonstrating a good system stability with minimal fluctuations in NH4+-N removal rates, which were consistently above 95%. During days 191-307, the NH4+-N concentration in influent was further increased to 90–100 mg/L, which caused a decrease in NH4+-N removal rates. But, after about 20 days, AnGS gradually adapted to the high NH4+-N concentration environment, and ultimately the NH4+-N removal rate achieved a high level of 96%.
The removal rate of NO2-N during the startup phase of Anammox is shown in Figure 3b. As shown in Figure 3b, it was observed that during 1 to 50 days, the removal rate of NO2-N remained consistently above 90%. However, subsequently, the removal rate dropped to around 70%, which might be caused by the changes in the microbial community structure within the reactor. During the changes in the microbial community structure, the proliferation of other microorganisms could reduce the utilization of NO2-N by AnGS, thereby affecting the NO2-N removal rate. During days 191-307, the significant increase in the NO2-N concentration in the influent had an adverse effect on AnGS, which needed some time to adapt to the new environment. Hence, the NO2-N removal rate dropped to 70%. As operation time extended, AnGS gradually adapted to the high-load environment, leading to a steady improvement in denitrification performance, ultimately stabilizing the NO2-N removal rate at approximately 80%. This process also demonstrated that the Anammox had certain shock resistance and self-repair capabilities.
Figure 3c describes the change in TN concentration during the startup phase of Anammox. At the early startup stage (1–6 days), the influent nitrogen load was low; as microbial activity recovered and environmental adaptability improved, the effluent TN concentration gradually decreased from 18 mg/L to 5 mg/L, with TN removal efficiency increasing from 60% to 90%, indicating that the denitrification capacity of the system gradually increased. During days 7-190, the influent TN concentration increased to 150 mg/L, resulting in noticeable fluctuations of TN concentration. Due to the significant increase in influent nitrogen load, a dynamic adjustment in microbial community structure and activity occurred. The TN removal efficiency fluctuated between 60% and 90%. During days 191-307, the influent TN concentration rose further to approximately 250 mg/L, with the TN removal efficiency ultimately stabilizing at around 70%.
Figure 3d–f shows the changes and removal rate of NH4+-N, NO2-N, and TN concentrations during the domestication phase of Anammox. As shown in Figure 3d, with the gradual increase in the ratio of the mixed actual wastewater, the influent NH4+-N concentration decreased from 120 mg/L in the domestication stage I to 17 mg/L in the domestication stage IV. Although the nitrogen load significantly decreased, due to the complex quality of the actual wastewater, the NH4+-N removal efficiency of the system exhibited some fluctuations, especially at the beginning of the domestication phase IV. When only mixed actual wastewater was used as the influent, microbial activity was affected by water quality changes, causing the NH4+-N removal rate drop from 93% to 83%. After a period of adaptation, system performance gradually recovered, and the NH4+-N removal rate rose back above 90%. Figure 3e indicates that throughout the domestication phase, the NO2-N removal rate showed a trend of initially decreasing and then increasing. NO2-N removal rate gradually declined from 83% in the early phases to 76% at the beginning of the domestication phase IV, and then rose again to 94% at the end of the domestication phase IV. This trend might be related to the microbial adaptation process to the changes in influent NO2-N concentration. As the influent NO2-N concentration gradually decreased, relevant microorganisms adjusted their metabolic activity to adapt to new conditions, ultimately achieving more efficient NO2-N removal. As shown in Figure 3f, the TN concentration in the influent decreased from 210 mg/L in the domestication phase I to 40 mg/L in the domestication phase IV, while the corresponding TN concentration in the effluent decreased from 62 mg/L to around 10 mg/L. Despite significant changes in the quality of influent, Anammox still demonstrated a good stability and maintained a TN removal rate of about 70%. The aforementioned results demonstrated that the stepwise transitional acclimation strategy by progressively increasing the proportion of mixed effluent had significantly enhanced the adaptability of Anammox to actual wastewater. This approach not only guaranteed the stable performance of Anammox, but also facilitated a seamless transition to the treatment of actual wastewater.

3.2. The Performance in the AD, PN/A Coupling Process

3.2.1. The COD Removal in the AD, PN/A Coupling Process

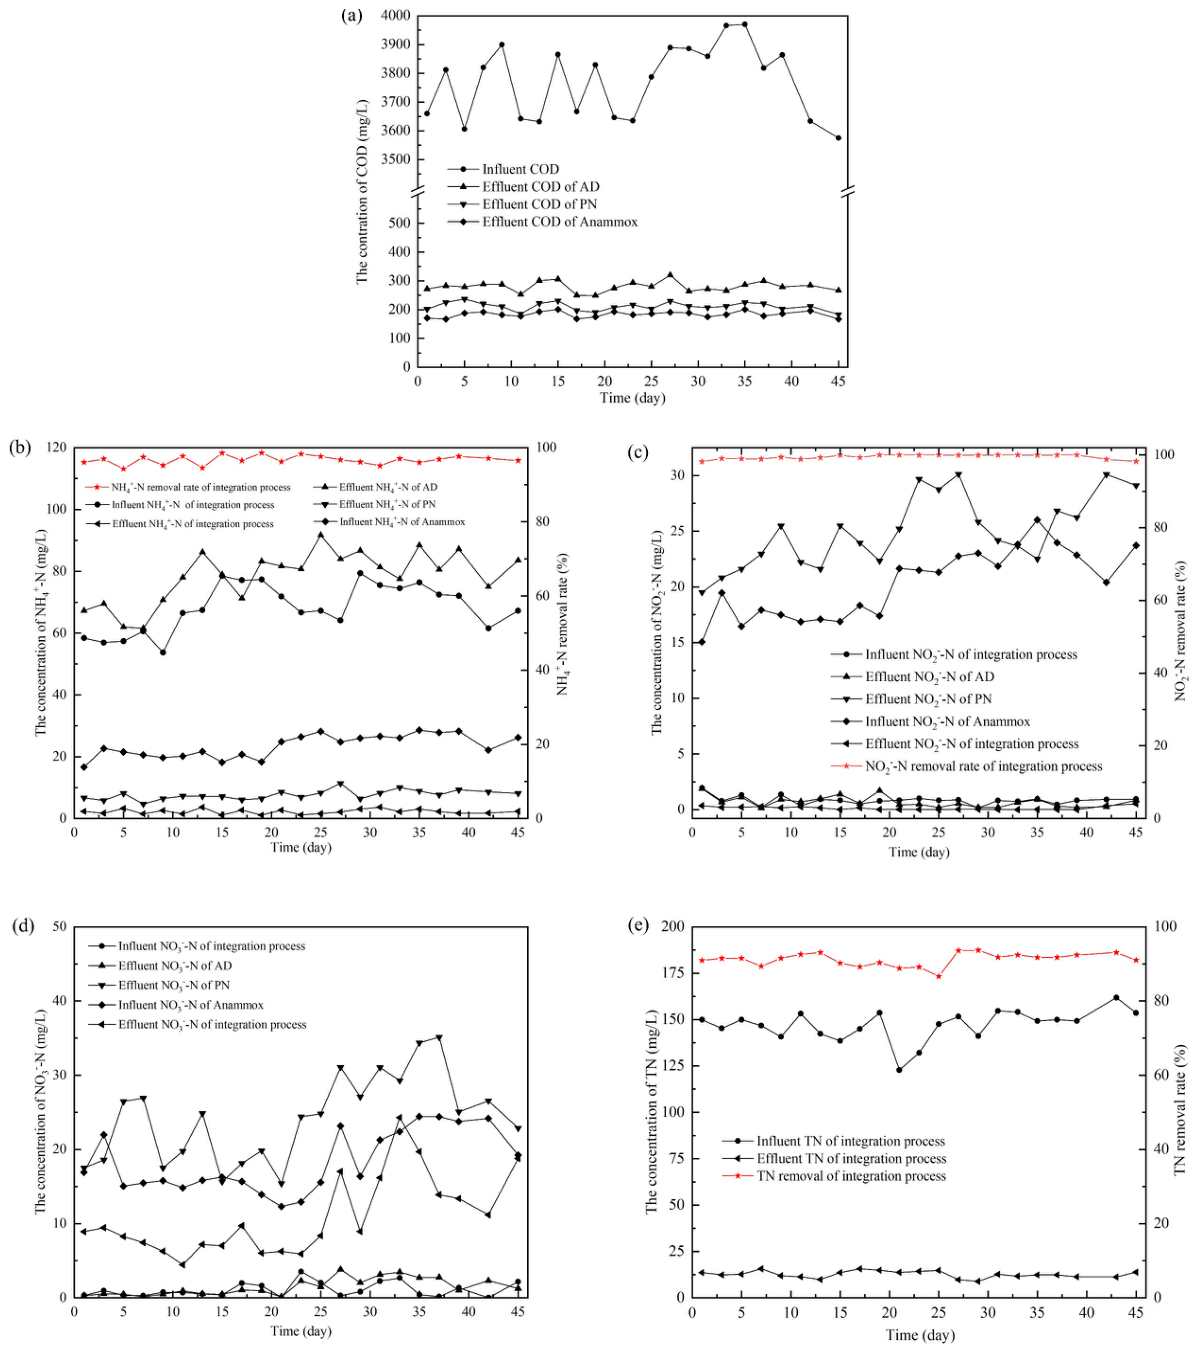
The variation in COD concentration in the effluent for the coupling process is shown in Figure 4a. As shown in Figure 4a, the average effluent COD concentrations of AD, PN, and Anammox coupling process were around 280.0 mg/L, 211.0 mg/L, and 180.0 mg/L, respectively. In this coupling process, AD played the main role in COD degradation and contributed 92.45% to COD removal, while the COD removal rate of PN and Anammox were relatively weak, accounting for 1.9% and 0.78%, respectively. The above results manifested that this coupling process exhibited an excellent COD removal for HCLW. However, the COD concentration in the effluent of this coupling process was 180 mg/L, which did not meet the discharge requirement (COD ≤ 150 mg/L) of wastewater by the “Discharge standard of Water pollutants for fermentation alcohol and distilled spirits industry” (GB 27631-2011).

3.2.2. The Nitrogen Removal in the AD, PN/A Coupling Process

The changes in NH4+-N, NO2-N, NO3-N, and TN concentrations in this coupling process are shown in Figure 4b–e, respectively. As shown in Figure 4b, the average NH4+-N concentration in effluent was 1.74 mg/L, and NH4+-N removal rate remained stable at over 94%. The large amounts of organic nitrogen compounds (such as proteins, amino acids, and peptides) in cellar bottom water and pot bottom water could be decomposed by anaerobic microorganisms into smaller molecules and release NH4+-N in AD. Hence, the average effluent NH4+-N concentration was higher than that of influent in AD. In PN process, about 90.18% of the NH4+-N in effluent from AD was converted into NO2-N. The NH4+-N in the effluent from the AD and NO2-N in the effluent from PN was consumed and transformed into N2 by AnGS in Anammox reactor. Ultimately, the NH4+-N concentration in effluent of this coupling process was 1.74 mg/L, achieving high-efficient NH4+-N removal capability.
Because there was almost no nitrogen in the form of NO2-N or NO3-N in HCLW, the influent concentrations of NO2-N and NO3-N in AD were extremely low. The primary function of AD was to decompose organic matter rather than remove NO2-N and NO3-N. Therefore, the concentrations of NO2-N and NO3-N fluctuated little in the AD process. In the PN process, part of the NH4+-N was converted to NO2-N, and a small amount of NO2-N further oxidized to NO3-N. Thus, the average effluent concentrations of NO2-N and NO3-N from PN were 24.92 mg/L and 5.39 mg/L, respectively. The NO2-N accumulation rate for PN was about 82%, which provided sufficient NO2-N for the subsequent Anammox. The Anammox uses NO2-N and NH4+-N to directly produce N2 under anaerobic conditions, which is a key step for nitrogen removal. The average concentrations of NO2-N and NO3-N in the influent for Anammox were 20.25 mg/L and 4.22 mg/L, respectively, while the average concentrations of NO2-N and NO3-N in effluent for Anammox were 0.13 mg/L and 2.45 mg/L, respectively. The average TN concentration in the influent for this coupling process was 146.95 mg/L, while the TN concentration in effluent and the TN removal rate was 12.64 mg/L and 91.35%, respectively. This illustrated that the coupling process could effectively remove nitrogen from HLCW.
The average concentrations of TN, NH4+-N, NO2-N, and NO3-N in the effluent of this coupling process were 12.64, 1.74, 0.13, and 2.45 mg/L respectively. Hence, this coupling process not only could effectively remove nitrogen from HLCW, but also meet the requirements (TN ≤ 15 mg/L and NH4+ ≤ 5 mg/L) for discharge of wastewater by the “Discharge standard of Water pollutants for fermentation alcohol and distilled spirits industry” (GB 27631-2011).

3.3. The Performance of Fenton Process

3.3.1. COD Removal in Fenton Process

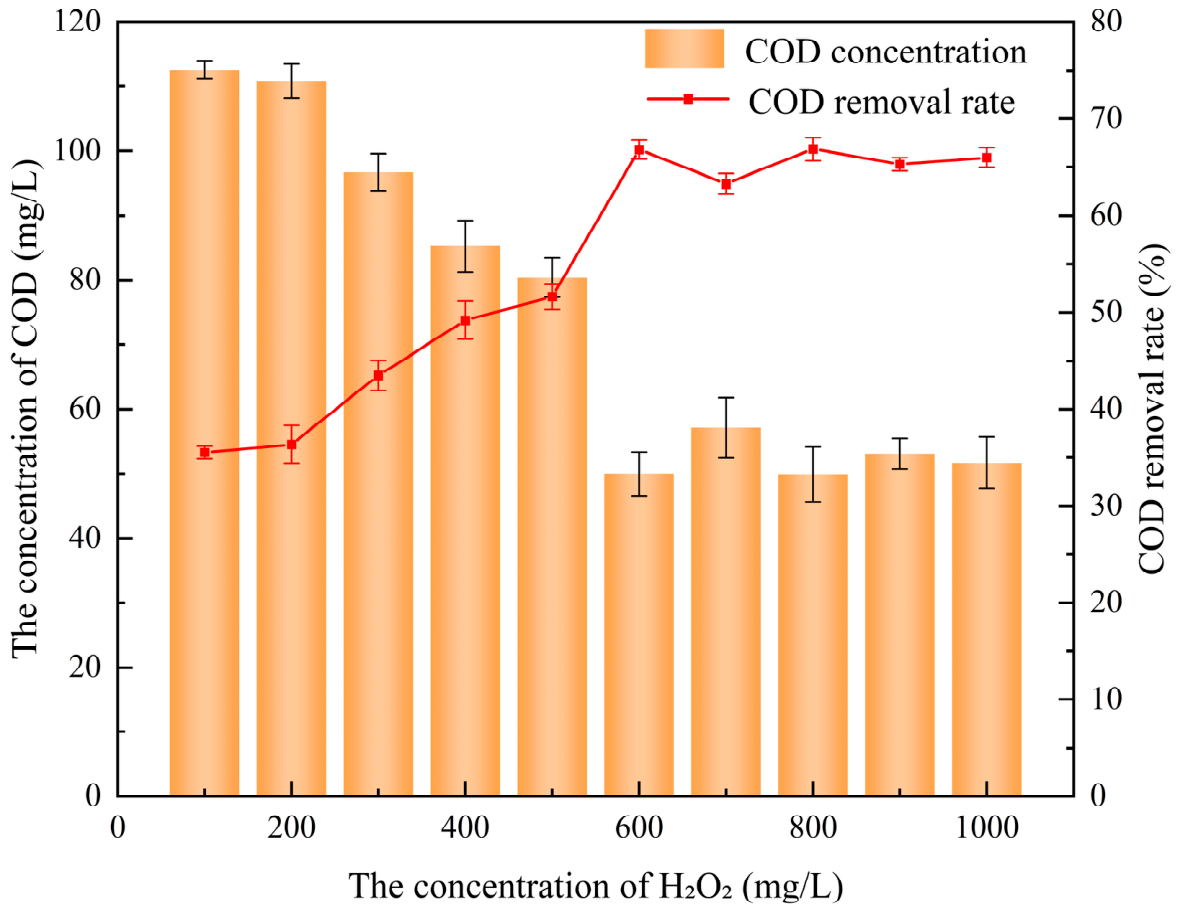
To further reduce the COD concentration of the effluent from the coupling of AD, PN/A process, and make the effluent meet the discharge standards, the Fenton process was adopted as the advanced treatment to further remove the residual organic pollutants. The COD concentration of the effluent from Fenton process with different dosage of H2O2 is shown in Figure 5.
It can be seen from Figure 6 that when the dosage of H2O2 was within the range of 100–600 mg/L, the COD removal effect gradually increased with the increasing of the dosage of H2O2, and the COD removal rate increased from 35.54% to 51.64%. However, when the dosage of H2O2 increased to 700–1000 mg/L, the COD removal tended to be stable, and the COD removal rate remained at about 65%. It was worth noting that when the dosage of H2O2 was 600 mg/L, the COD removal rate was 66.59%, and the COD concentration in the effluent was 49.8 mg/L. The effluent with 600 mg H2O2/L had achieved a relatively good treatment effect. When the dosage of H2O2 was further increased to 800 mg/L, the COD removal rate slightly increased to 66.89%, and the corresponding effluent COD concentration was 49.5 mg/L. However, compared with the addition of 600 mg H2O2/L, the increasing in the COD removal with the addition of 800 mg H2O2/L was relatively small.

3.3.2. NH4+-N and TN Removal in Fenton Process

The NH4+-N, NO2-N, NO3N, and TN concentration of the effluent from Fenton process with different dosage of H2O2 is depicted in Supplementary Materials (Figure S1). As shown in the Figure S1, the dosage of H2O2 had a relatively small effect on the nitrogen concentration. The concentrations of NH4+-N, NO2-N, NO3N, and TN in each group were within 5 mg/L, 0.04 mg/L, 9 mg/L and 15 mg/L, respectively. And the concentrations of NH4+-N, NO2-N, NO3N, and TN in the effluent all met the discharge standards. Comprehensively considering the COD removal effect and economy, it was more ideal to choose the condition that the dosage of H2O2 was 600 mg/L and the dosage of Fe2+ was 300 mg/L. It could not only facilitate the effective progress of the Fenton process and achieve a higher COD removal rate, but also avoid the reagent waste caused by excessive addition of H2O2, optimizing the economic efficiency of the treatment process.

3.4. The DOM Change in Influent and Effluent in the Integration of AD, PN/A and Fenton Process

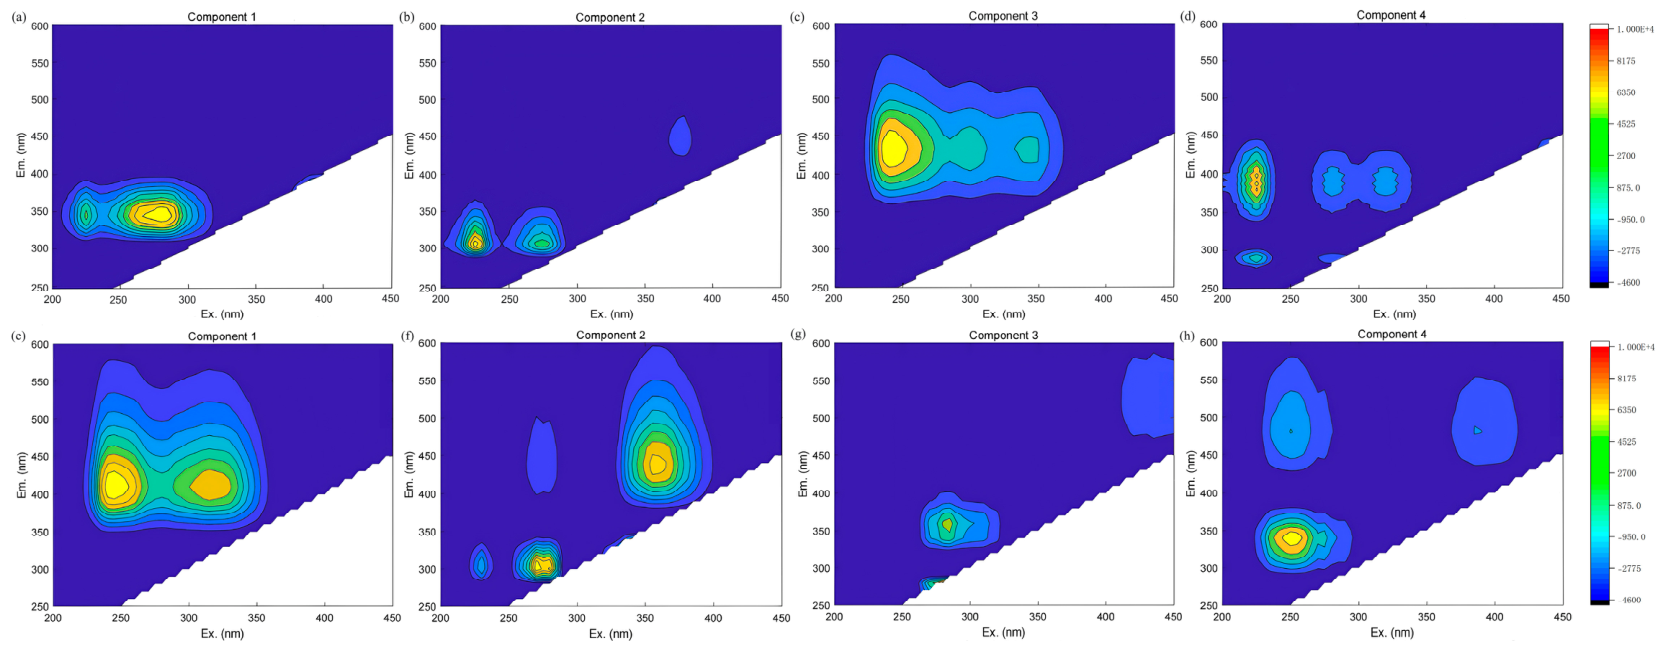
Dissolved organic matter (DOM) usually comes from components such as microbial degradation products in organic wastewater, dissolved organic nitrogen, and organic carbon in the wastewater, and they have a profound impact on water quality. Using parallel factor (PARAFAC) analysis of the DOM three-dimensional fluorescence spectra, four fluorescent components of DOM for the influent and effluent of the integration of AD, PN/A and Fenton process are shown in Figure 6. The characteristics of the DOM three-dimensional fluorescence spectra of the influent for the integration of AD, PN/A and Fenton process are listed in Table 2.
From Figure 6a–d, it can be seen that the four fluorescent components of the influent were closely related to the raw material composition, microbial metabolism, and fermentation environment during the process of baijiu brewing. Component C1 showed a single emission peak with an excitation peak at 280 nm and an emission peak at 350 nm (Peak B), which represented tyrosine-like proteins [27]. These substances mainly originate from protein degradation products in the raw materials and nitrogen-containing organic compounds produced during microbial metabolism. Component C2 included three characteristic peaks. Two excitation peaks were located at 250 nm and 285 nm, with a common emission peak at 310 nm (Peak T). Additionally, a weaker emission peak was observed around 440 nm. These peaks in C2 represented tryptophan-like proteins [27,29], which are important byproducts of microbial activity during baijiu fermentation. Tryptophan and its degradation products are associated with the formation of baijiu flavor. Component C3 exhibited a broad and dispersed peak shape, with the main excitation peak at 250 nm and the main emission peak at 430 nm (Peak A), and a secondary excitation peak at 350 nm (Peak A). These peaks in C3 indicated humic-like substances [27,29], possibly originating from the degradation products of long-term accumulated organic matter in the cellar bottom. Component C4 had multiple peaks, with primary and secondary excitation peaks at 240 nm and 320 nm (Peak T), respectively, and an emission peak at 380 nm, along with a weaker peak between 290–300 nm (Peak A). This peaks in C4 suggested that it was a mixture of protein-like and humic-like substances [27,29], reflecting the complex organic transformation processes during fermentation. In summary, the fluorescent components in the influent mainly included protein-like (C1, C2) and humic-like (C3) substances, as well as their mixtures (C4).
Compared with the influent of the integration of AD, PN/A and Fenton process, the four fluorescent components of the effluent exhibited different characteristics. As shown in Figure 6e–h, Component C1 included 250 nm and 310 nm two excitation peaks and one 420 nm emission peak in the effluent, which corresponded to peak A and peak B, respectively. These peaks corresponded to humic-like substances [27,29], indicating that humic-like substances still existed in the effluent after Fenton oxidation treatment. Component C2 had multiple characteristic peaks; the main excitation peak and the emission peak were at 280 nm and 310 nm (peak T), respectively. These peaks manifested the presence of tryptophan-like proteins [27,29], which might be intermediate products of large-molecule proteins degraded by microorganisms during the treatment process. Components C3 and C4 both exhibited protein-like characteristics [27,29]. Component C3 showed a single characteristic peak with an excitation peak at 280 nm and an emission peak at 360 nm (peak B); Component C4 had an excitation peak at 280 nm and an emission peak at 340 nm (peak B). These peaks in C3 and C4 certified that the effluent contained a certain number of protein-like substances that were not completely degraded. In general, the fluorescent components of DOM for the effluent mainly included humic-like substances (C1) and protein-like substances (C2, C3, C4). Comparing the components of DOM for the influent and effluent of the integration of AD, PN/A and Fenton process, the peaks of humic-like substance component changed from typical Peaks A and C in the influent to broader peaks in the effluent. This change in humic-like substances suggested that humic-like substances could be degraded by this integration process and form new humic-like intermediate products. The protein-like components in the influent were primarily in the form of tyrosine-like (C1) and tryptophan-like (C2) substances, but the protein-like components in the effluent became two independent protein-like components, and the tryptophan-like protein characteristics were still present. This indicated that the integration process partially degraded large-molecule proteins and generated new protein-like intermediate products.
These changes proved that this integration process successfully degraded some large-molecule organic substances in the influent, but some difficult-to-degrade humic-like and protein-like substances still remained. Hence, the COD removal rate remained at about 50%, and even the addition of H2O2 increased from 600 mg H2O2/L to 800 mg H2O2/L.

3.5. Microbial Community Analysis

3.5.1. Microbial Community Analysis in AD

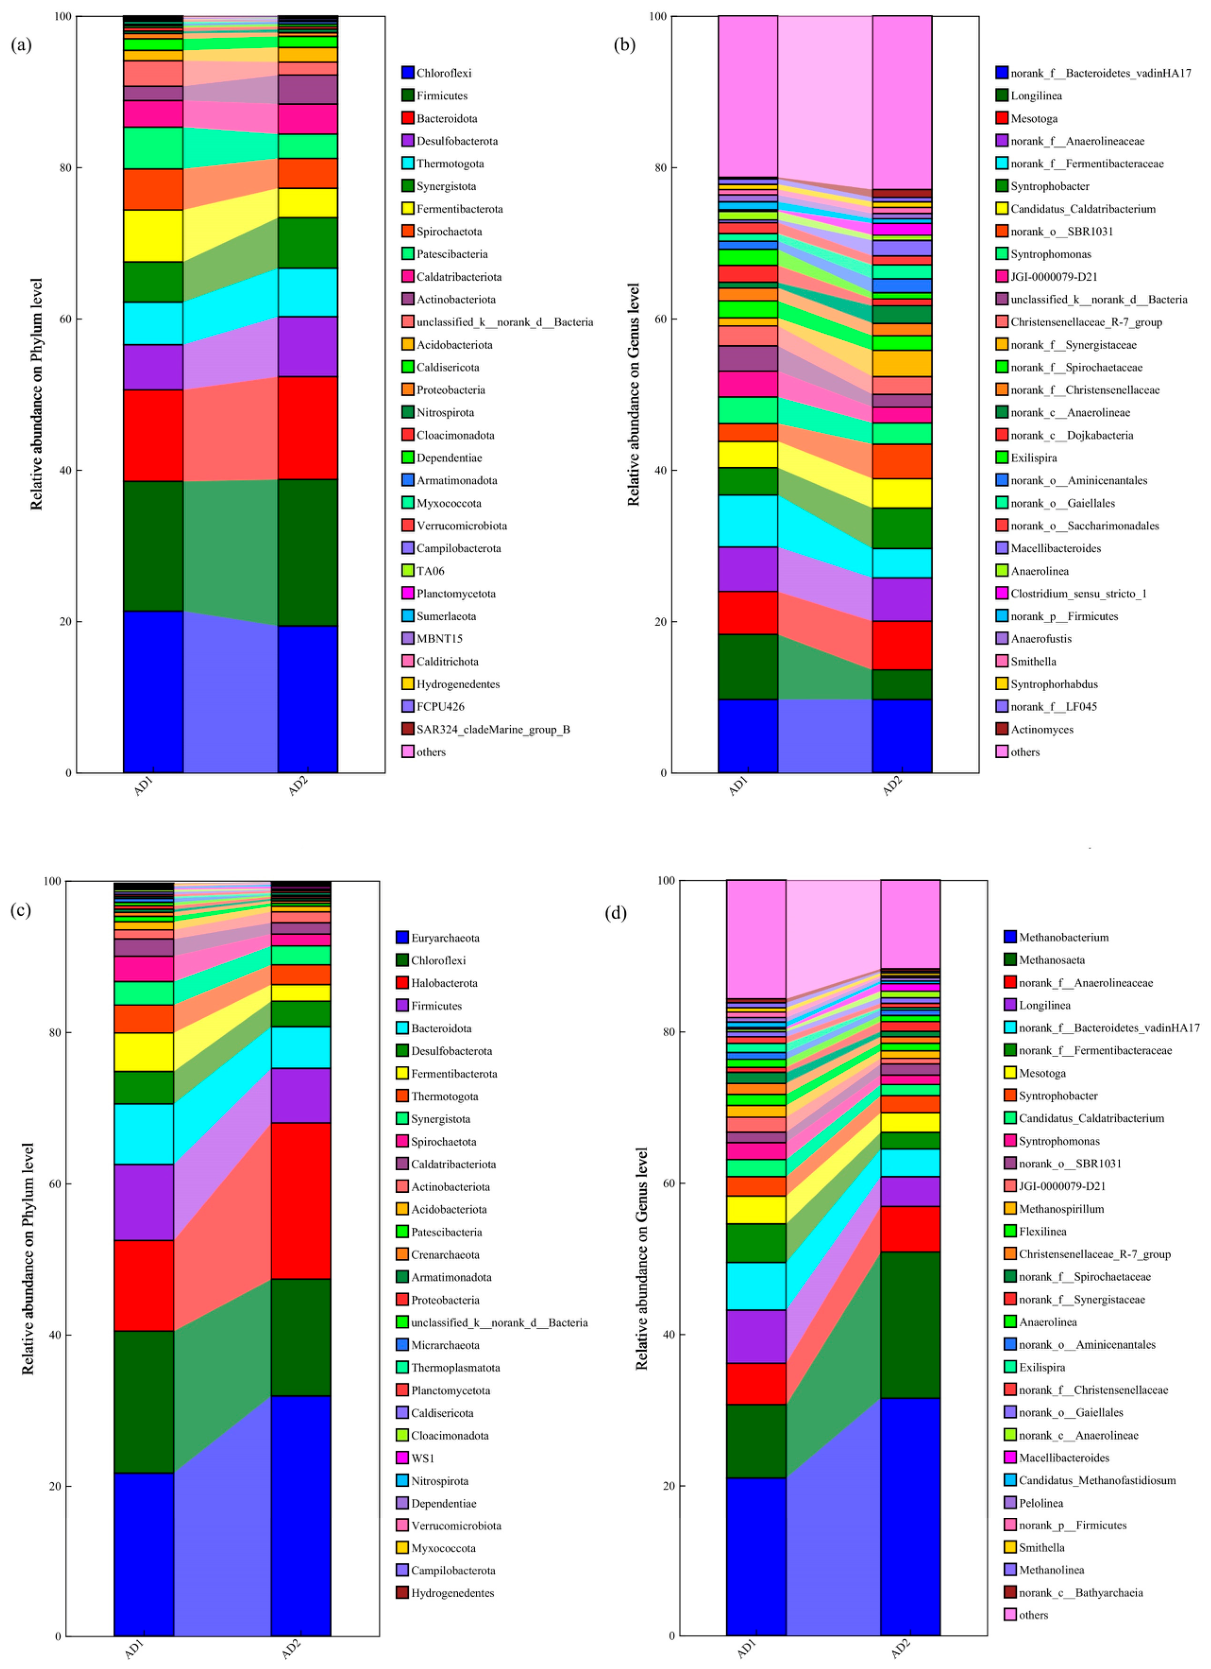
Changes in the bacterial community structure at the phylum and genus level were shown in Figure 7a,b, respectively. At the phylum level, the dominant bacterial groups were mainly Chloroflexi, Firmicutes, Bacteroidetes, and Desulfobacterota, which were beneficial for degradation of macromolecular organic substances, such as lignocellulose and protein. As shown in Figure 7a, the total relative abundance of these dominant bacterial groups at AD1 was higher than that in AD2, indicating that macromolecular organic substances were rapidly decomposed by microorganisms in the integration stage. Chloroflexi had the highest relative abundance in two samples. It is a common hydrolytic bacterium and particularly good at maintaining its abundance by utilizing refractory organic matter [30]. The genera Longilinea under the Chloroflexi phylum play a key role in the preliminary degradation of complex organic matter, providing important intermediate products for AD. The relative abundance of the genus Longilinea decreased from 8.63% to 3.94%, which might be attributed to the complex composition of the cellar water and the boiler water. Bacteroidota is the main proteolytic bacteria, involved in degrading protein products and converting them into volatile acids and ammonia [31]. The relative abundance of the genus norank_f__Bacteroidetes_vadinHA17 under Bacteroidota phylum was the highest. The enrichment of this genus could significantly increase the enzyme activities involved in the generation of lactic acid and propionic acid [32]. The Firmicutes could produce a variety of extracellular metabolic enzymes, and promote the hydrolysis of organic substances and the production of acids [33]. Its relative abundance increased from 17.17% to 19.39%, indicating that the bacteria had higher activity in the integration phase. In addition, the relative abundance of Syntrophobacter and Mesotoga increased from 3.59% and 5.63% in the initial AD1 to 5.34% and 6.41% in the coupling stage AD2, respectively. Syntrophobacter belongs to the Proteobacteriota phylum and is a propionic acid mutual-oxidizing bacterium. It is responsible for the degradation of propionic acid in anaerobic digestion and forms mutual-symbiosis with hydrogen-trophic methanogenic archaea. Mesotoga belongs to the Thermotogae phylum and converts organic substances such as sugars and amino acids into organic acids through fermentation. Hence, the increasing of relative abundance of norank_f__Bacteroidetes_vadinHA17, Syntrophobacter and Mesotoga in AD was helpful to promote the degradation of organic matter and improve the removal rate of COD.
The structural composition and abundance changes of the archaea community in AD reactor at the phylum and genus level are depicted in Figure 7c,d, respectively. At the phylum level, Euryarchaeota dominated at two samples, and its relative abundance increased significantly from 21.69% in AD1 to 31.89% in AD2. As the primary group of methanogenic archaea, the dominance of the Euryarchaeota phylum indicated that the system possessed an efficient methane production capacity [34]. Although the proportion of Chloroflexi decreased from 18.78% in AD1 to 15.45% in AD2, it still remained at a relatively high level. Chloroflexi is capable of degrading complex organic matter and providing substrates for methanogenesis [35]. Halobacterota (Halobacterota phylum) is a type of halophilic archaea that performs heterotrophic metabolism under high-salt conditions, and its relative abundance increased from 11.97% in AD1 to 20.63% in AD2. This suggested that the system had adapted to the high-salt environment and enhanced its tolerance to salt stress. Firmicutes not only produce hydrogen, but also ferment various organic substances, playing a crucial role in maintaining system stability [36]. Firmicutes maintained a stable abundance level in AD. The genera Methanobacterium and Methanosaeta constituted the core functional groups responsible for methanogenesis [37]. The relative abundance of Methanobacterium and Methanosaeta increased from 20.98% and 9.70% in AD1 to 31.52% and 19.34% in AD2. Among them, Methanobacterium can generate methane using H2, CO2 and formic acid produced by norank_f__Bacteroidetes_vadinHA17, Syntrophobacter and Mesotoga [38]. Moreover, Methanobacterium exhibits strong adaptability to environmental conditions and can grow within a wide pH range, contributing to the system’s ability to maintain stable methane production under varying operational conditions. Methanosaeta is an acetotrophic methanogen, and its filamentous form can promote sludge granulation and improve system stability [39]. Hence, the increase in the relative abundance of Methanobacterium and Methanosaeta enhanced the removal efficiency of COD within this system.
The synergistic interaction between norank_f__Bacteroidetes_vadinHA17, Syntrophobacter, Mesotoga, Methanobacterium, and Methanosaeta created an optimal microbial environment, enabling AD to achieve the highest COD removal performance during the HLCW treatment process.

3.5.2. Microbial Community Analysis in PN

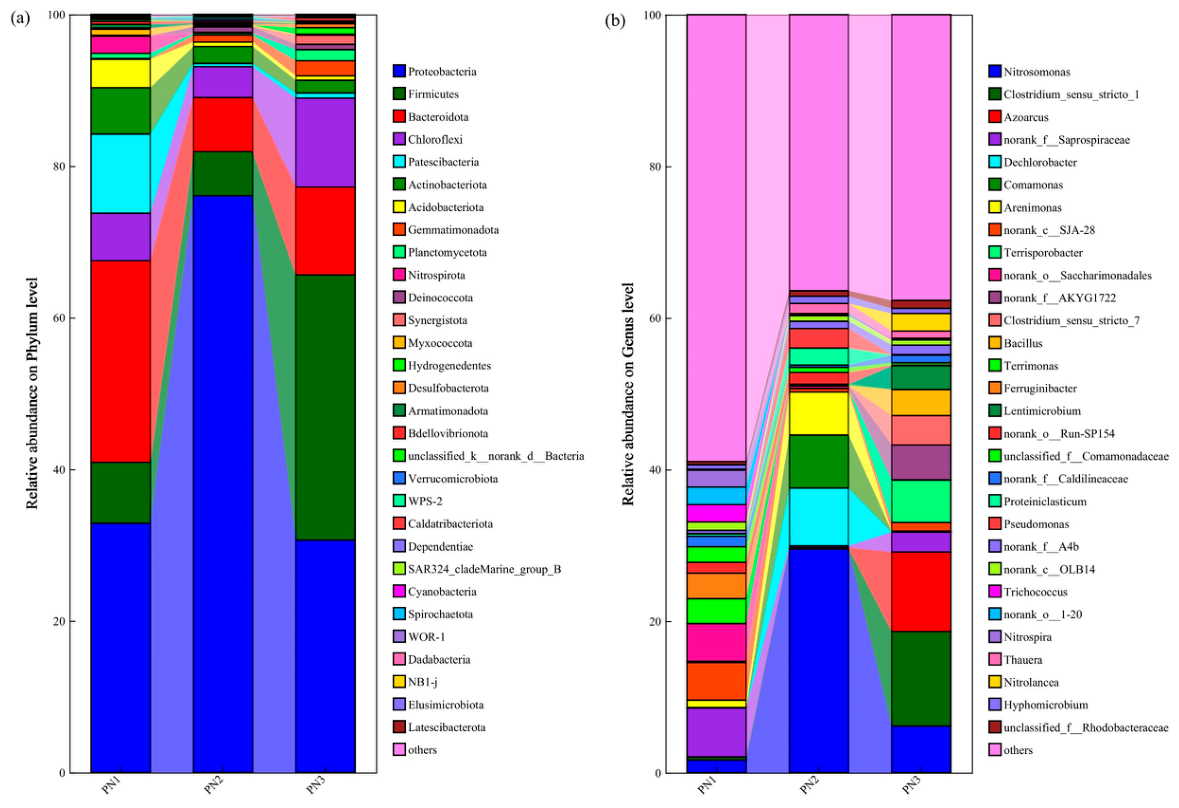
The composition and relative abundance of microbial communities in PN reactor at the phylum and genus level during different operational stages are shown in Figure 8a,b, respectively. PN1, PN2, and PN3 represented the three stages of PN reactor, as follows: the initial startup phase of artificial water addition, the stable period of artificial water addition, and the system coupling phase.
Proteobacteria was the most dominant bacterial group, and its abundance rose from 32.87% in PN1 to 76.08% in PN2, and then decreased to 30.65% in PN3. Proteobacteria include most of the functional bacteria involved in denitrification and nitrification [40]. This change in its abundance may be due to variations in influent conditions, as follows: initially, Proteobacteria gradually adapted to the environment of artificial water addition, and their activity increased; later, with the increasing of the proportion of the effluent from AD reactor, more complex organic compounds were introduced into PN, and substrate competition among different functional bacterial groups was intensified, so its abundance decreased. The relative abundance of Firmicutes was 8.05%, 5.83%, and 34.99 in PN1, PN2, and PN3, respectively. Firmicutes could ferment various organic substances [33,36]. Hence, the simpler substrates in PN2 maybe decline its abundance; with the input of more complex organic compounds in the coupling phase, its abundance rose again. Moreover, Bacteroidetes can participate in the hydrolysis of organic matter [41]. Therefore, a similar change was observed between the relative abundance of Firmicutes and Bacteroidetes.
At genus level, Nitrosomonas is a typical AOB (ammonia-oxidizing bacteria, AOB), which converts NH4+-N to NO2-N [42]. Initially, the relative abundance of Nitrosomonas was about 1.68% in PN1 and reached 29.51% in PN2, indicating that a stable PN had been achieved by artificially simulated wastewater. However, the relative abundance of Nitrosomonas decreased to around 6.16% in PN3, suggesting that actual wastewater had some inhibitory effect on this bacterial group. However, compared with PN1, the relative abundance of Nitrosomonas was still higher. Moreover, Azoarcus is a core partial denitrification bacteria [40]. The relative abundance of Azoarcus increased from not detected (abundance < 0.1%) to 10.5% in PN3. The presence of Azoarcus was beneficial to enhance the denitrification ability of the PN reactor.
The PN reactor developed distinct community structures at different operational stages. The significant enrichment of AOB in PN2 established a stable PN pathway, while the diverse microbial community structure during the fully coupled phase reflected the system’s adaptability to HLCW.

3.5.3. Microbial Community Analysis in Anammox

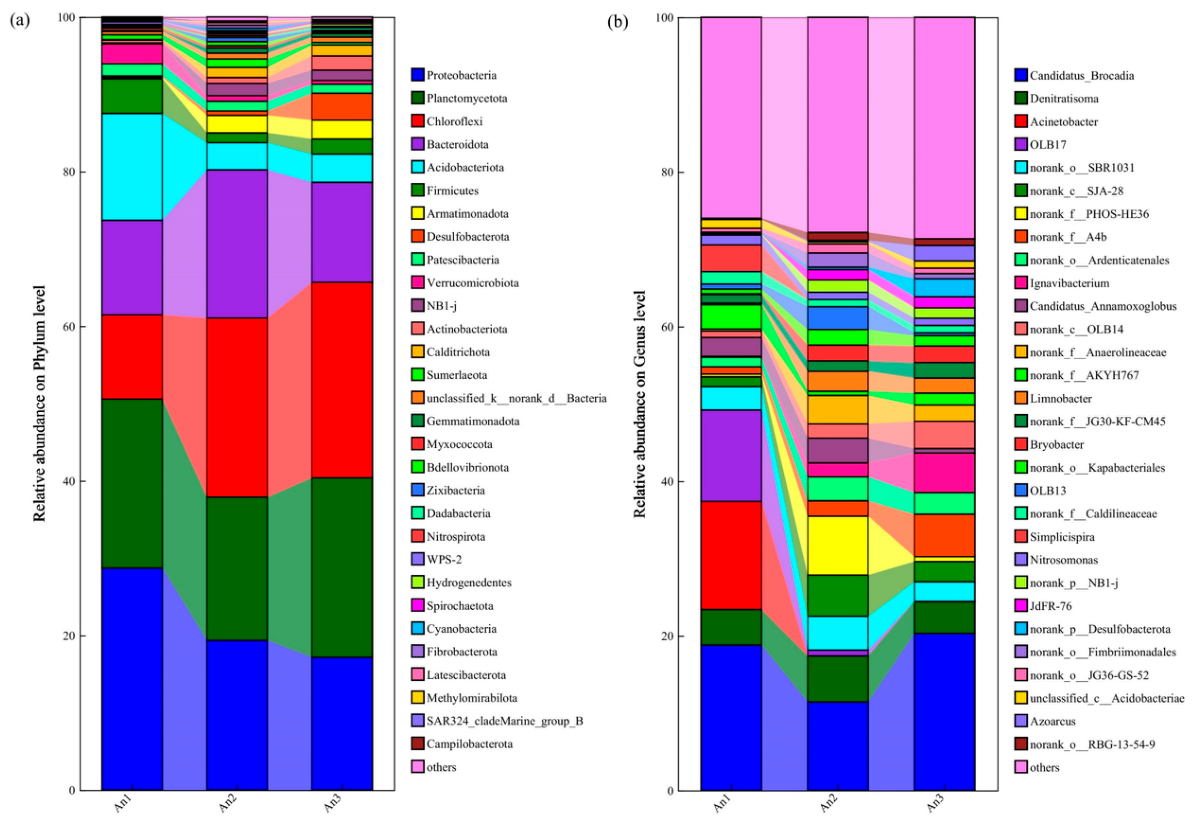
The change in microbial community composition and relative abundance in the Anammox reactor at the phylum and genus level during different operational stages is shown in Figure 9a and Figure 9b, respectively. At the phylum level, Proteobacteria, Planctomycetota, Chloroflexi, and Bacteroidota constituted the main dominant bacterial groups, accounting for more than 70% of the total microbial population across all three stages. Among them, Proteobacteria promote the activity of AnAOB, while Chloroflexi provide sticky extracellular polysaccharides for the aggregation of AnAOB [43]. Proteobacteria had the highest abundance initially, but its dominance decreased in the subsequent two stages with the increase in the proportion of the effluent from PN and AD reactor. As representatives of AnAOB, Planctomycetota showed higher relative abundance in both An1 and An2. Candidatus Brocadia belong to Planctomycetota phylum and can convert NH4+-N and NO2-N into N2 [10]. Hence, Candidatus Brocadia within this phylum played a crucial role for nitrogen removal in the system. Additionally, Acidobacteriota increased in abundance in An3, possibly due to its ability to adapt to complex influent conditions. Changes at the genus level better reflected the succession patterns of functional microbial communities. As primary AnAOB, the abundance of Candidatus_Brocadia decreased from 18.80% in An1 to 11.44% in An2, and then rose to 20.31% in An3, indicating that Candidatus_Brocadia was stable and exhibited strong adaptability to HLCW. Ignavibacterium is a chemoheterotrophic bacteria, which can participate in protein degradation, nitrate reduction to nitrite, and other processes, providing a substrate for Anammox [44]. The abundance of Ignavibacterium in An1 was not detected, but the abundance of Ignavibacterium in An2 and An3 increased to 1.79% and 5.11%, respectively. Therefore, the high proportion of Ignavibacterium enhanced the nitrogen removal efficiency and the stability of Anammox [45]. OLB14 is classified as a bacterium for partial denitrification and prevalent in Anammox bioreactors [46]. It reported that OLB14 could reduce nitrate produced from Anammox and form a nitrite cycle together with AnAOB. The abundance of OLB14 increased from not detected to 1.85% and 3.51% in An2 and An3, respectively. The synergistic interaction between Candidatus_Brocadia, Ignavibacterium, and OLB14 created an optimal microbial environment, enabling Anammox to achieve the highest nitrogen removal performance during the HLCW treatment process.

4. Conclusions

This study designed an integration of AD, PN/A and Fenton process to achieve the goal of nitrogen removal, COD removal, and standard direct discharge of HLCW. The average concentrations of COD, TN, NH4+-N, NO2N, and NO3-N in effluent of the biological treatment for this integration process were 180.00, 12.64, 1.74, 0.13, and 2.45 mg/L, respectively. Among these effluent quality indicators, COD failed to meet the requirement for direct discharge of wastewater by the “Discharge standard of Water pollutants for fermentation alcohol and distilled spirits industry” (GB 27631-2011). Fenton oxidation with 600 mg/L of H2O2 was used to further reduce the effluent COD to 49.8 mg/L, while the concentrations of TN, NH4+-N, NO2N, and NO3-N in effluent after Fenton oxidation was 10.70, 0.89, 0.03, and 8.30 mg/L, respectively. Three-dimensional fluorescence spectra analysis revealed that the integration process effectively altered the organic molecular structure and degraded some large molecular proteins. Microbial community analysis showed that the abundance of typical functional microorganisms, such as Methanobacterium and Methanosaeta in AD, Azoarcus and Nitrosomonas in PN, and Candidatus_Brocadia and Ignavibacterium in Anammox, increased in the integration system, which was beneficial to the removal of COD and nitrogen pollution of this integration process for HCLW.

Supplementary Materials

The following supporting information can be downloaded at: https://www.mdpi.com/article/10.3390/w18101179/s1, Table S1: Characteristics of liquor wastewater; Table S2: The operation process of SBR for PN; Table S3: The operating parameters for the setup of PN and Anammox; Table S4: Parameters of Fenton process; Figure S1: The NH4+-N (a), NO2-N (b), NO3-N (c) and TN (d) concentration of the effluent from Fenton process with different dosage of H2O2.

Author Contributions

J.Z.—Conceptualization; Data curation; Formal analysis; Investigation; Validation; Visualization; Writing—original draft; Writing—review & editing; H.W. (Hui Wang)—Conceptualization; Project administration; Resources; Supervision; Y.X.—Conceptualization; Investigation; Validation; Visualization; J.W.—Conceptualization; Project administration; Resources; Supervision; Q.L.—Conceptualization; Formal analysis; Investigation; Resources; B.C.—Project administration; Resources; H.W. (Hongyu Wang)—Conceptualization; Resources; Q.Z.—Conceptualization; Funding acquisition; Resources; Project administration; Supervision. All authors have read and agreed to the published version of the manuscript.

Funding

This work was supported by the Guizhou Provincial Science and Technology Major Program (Qian Ke He [2024] 006); the Enterprise Authorized Project from the Kweichow Moutai Distillery Co., Ltd. (GFJS20230888); the Guiding Project of the Scientific Research Program of the Education Department of Hubei Province (No. B2024060); the National Natural Science Foundation of China (No. 52170049, 52370048).

Data Availability Statement

The original contributions presented in this study are included in the article. Further inquiries can be directed to the corresponding author.

Acknowledgments

We thank Xiaoling Hu of School of Civil Engineering, Wuhan University for her assistance in the cultivation of Anammox sludge.

Conflicts of Interest

The funder was not involved in the study design, collection, analysis, interpretation of data, the writing of this article, or the decision to submit it for publication. Authors Hui Wang and Bi Chen were employed by the company Kweichow Moutai Distillery Co., Ltd. Qi Liu was employed by the company Central and Southern China Municipal Engineering Design and Research Institute Co., Ltd. The remaining authors declare that the research was conducted in the absence of any commercial or financial relationships that could be construed as a potential conflict of interest.

References

  1. Huang, R.T.; Huang, Q.; Wu, G.L.; Chen, C.G.; Li, Z.J. Evaluation of the antioxidant property and effects in Caenorhabditis elegans of Xiangxi flavor vinegar, a Hunan local traditional vinegar. J. Zhejiang Univ. Sci. B 2017, 18, 324–333. [Google Scholar] [CrossRef]
  2. Zhang, C.L.; Ao, Z.H.; Chui, W.Q.; Shen, C.H.; Tao, W.Y.; Zhang, S.Y. Characterization of volatile compounds from Daqu-a traditional Chinese liquor fermentation starter. Int. J. Food Sci. Technol. 2011, 46, 1591–1599. [Google Scholar] [CrossRef]
  3. Chen, X.; Wu, Y.X.; Zhu, H.; Wang, H.G.; Lu, H.Y.; Zhang, C.N.; Li, X.T.; Xu, Y.Q.; Li, W.W.; Wang, Y. Turning over fermented grains elevating heap temperature and driving microbial community succession during the heap fermentation of sauce-flavor. LWT Food Sci. Technol. 2022, 172, 114173. [Google Scholar] [CrossRef]
  4. Nie, W.K.; Lin, Y.; Wu, X.; Wu, S.H.; Li, X.; Cheng, J.J.; Yang, C.P. Chitosan-Fe3O4 composites enhance anaerobic digestion of liquor wastewater under acidic stress. Bioresour. Technol. 2023, 377, 128927. [Google Scholar] [CrossRef] [PubMed]
  5. Zahedi, S.; Solera, R.; Pérez, M. An eco-friendly way to valorize winery wastewater and sewage sludge: Anaerobic co-digestion. Biomass Bioenergy 2020, 142, 105779. [Google Scholar] [CrossRef]
  6. Luo, Q.; Li, J.; Zhang, Z.; Liu, G.; Chen, J.; Chen, Y.; Zhao, Z. Formation and adaptation of algal–bacterial granular sludge in real Chinese liquor brewing wastewater treatment. J. Environ. Chem. Eng. 2024, 12, 112288. [Google Scholar] [CrossRef]
  7. Luo, B.; Yu, J.; Huang, W.; Zhou, X.; Li, J.; Zhang, Q.; Ning, H.; Wang, J.; He, H.; Yan, Y.; et al. Experimental research of combined ozone/hydrogen peroxide oxidative degradation of chemical oxygen demand in sauce-flavored liquor wastewater. Water Resour. Ind. 2025, 34, 100312. [Google Scholar] [CrossRef]
  8. Li, Z.W.; Li, D.N.; Cheng, S.W.; Ma, Y.J.; Liu, F.Y.; Gao, X.L.; Zhang, K.Q.; Liu, R.; Yang, J.Q.; Du, L.Z. Unveiling the synergy of volatile fatty acids and ammonia nitrogen in optimizing methane production during dry anaerobic digestion of pig manure and corn straw. Chem. Eng. J. 2024, 496, 153988. [Google Scholar] [CrossRef]
  9. Tang, T.T.; Zhao, Z.Y.; Wang, Y.; Zhao, X.L.; Zhu, R.X.; Wu, J.L.; Yang, S.M.; He, M.L. Internal mechanism of microbial nitrogen removal under prolonged low-temperature stress: A focus on microbial communities, metabolic pathways, and microbial function. Chem. Eng. J. 2024, 500, 157522. [Google Scholar] [CrossRef]
  10. Fu, J.R.; Liao, H.; Wang, Z.L.; Xiao, Y.X.; Zhang, Y.; Bai, G.L.; Zhang, J.; Wang, H.Y.; Lu, H.J.; Dong, Y.Q.; et al. Effect of simultaneously addition of Fe3+ and reed straw biochar on nitrogen removal efficiency and GWP for Anammox. Chem. Eng. J. 2025, 506, 160090. [Google Scholar] [CrossRef]
  11. Qu, J.H.; Wang, H.C.; Wang, K.J.; Yu, G.; Ke, B.; Yu, H.Q.; Ren, H.Q.; Zheng, X.C.; Li, J.; Li, W.W.; et al. Municipal wastewater treatment in China: Development history and future perspectives. Front. Environ. Sci. Eng. 2019, 13, 88. [Google Scholar] [CrossRef]
  12. Liu, J.X.; Zhang, J.N.; Huang, Y.; Cai, Y.Y.; Yang, H.N.; Wang, W.G.; Deng, L.W. Nitrogen removal and performance deterioration in digested effluent treatment by partial nitrification-anammox (PNA) process based on aeration sedimentation integrated microaerobic reactor (ASIMR). Chem. Eng. J. 2024, 481, 148310. [Google Scholar] [CrossRef]
  13. Wu, L.A.; Zhang, Y.L.; Yin, J.; Luo, A.T.; Tian, Y.H.; Liu, Y.F.; Xu, J.Y.; Peng, Y.Z. Achieving advanced nitrogen removal from mature landfill leachate in continuous flow system involving partial nitrification-anammox and denitrification. Bioresour. Technol. 2024, 399, 130553. [Google Scholar] [CrossRef]
  14. Yan, J.; Wu, L.Y.; Ye, W.Z.; Zhou, J.L.; Ji, Q.X.; Gomez, M.A.; Hong, Y.G.; Lin, J.G.; Zhang, H.G. Ferric and sulfate coupled ammonium oxidation enhanced nitrogen removal in two-stage partial nitrification—Anammox/denitrification process for food waste liquid digestate treatment. Bioresour. Technol. 2024, 398, 130533. [Google Scholar] [CrossRef] [PubMed]
  15. Yang, P.; Wang, Z.Z.; Zhang, C.G.; Zhu, J.X.; Peng, Y.Z. Engineering application on the combination of simultaneous partial nitrification and denitrification and anammox for advanced nitrogen removal from landfill leachate. Bioresour. Technol. 2025, 423, 132257. [Google Scholar] [CrossRef] [PubMed]
  16. Li, S.; Chen, X.; Gong, H.; Yang, J.; Guo, Q.; Wang, X.K.; Wang, H.; Zhu, D.Y.; Zhang, Y.Y.; Zhou, S.Y.; et al. Influence of influent suspended solids concentration on a two-stage partial nitrification/anammox process treating liquid digestate of kitchen waste: Nitrogen removal performance and microbial community analysis. J. Environ. Chem. Eng. 2025, 13, 115452. [Google Scholar] [CrossRef]
  17. Deng, Z.; Sun, C.; Ma, G.; Zhang, X.; Guo, H.; Zhang, T.; Zhang, Y.; Hu, Y.; Li, D.; Li, Y.-Y.; et al. Anaerobic treatment of nitrogenous industrial organic wastewater by carbon–neutral processes integrated with anaerobic digestion and partial nitritation/anammox: Critical review of current advances and future directions. Bioresour. Technol. 2025, 415, 131648. [Google Scholar] [CrossRef]
  18. Johnson, I.; Krishnan, C.; Kumar, M. Enhancing nutrient bioavailability in distillery wastewater through electrochemical oxidation for microalgal growth: Insights on biomass yield, nutrient utilisation, and VFA-assisted carbon capture. Algal Res. 2024, 83, e103734. [Google Scholar] [CrossRef]
  19. Rayaroth, M.P.; Aravindakumar, C.T.; Shah, N.S.; Boczkaj, G. Advanced oxidation processes (AOPs) based wastewater treatment-unexpected nitration side reactions-a serious environmental issue: A review. Chem. Eng. J. 2022, 430, 133002. [Google Scholar] [CrossRef]
  20. Lu, J.Y.; Bu, Z.Q.; Lei, Y.Q.; Wang, D.; He, B.; Wang, J.; Huang, W.T. Facile microwave-assisted synthesis of Sb2O3-CuO nanocomposites for catalytic degradation of p-nitrophenol. J. Mol. Liq. 2024, 409, 125503. [Google Scholar] [CrossRef]
  21. Lin, R.Y.; Li, Y.; Yong, T.Z.; Cao, W.X.; Wu, J.S.; Shen, Y.F. Synergistic effects of oxidation, coagulation and adsorption in the integrated fenton-based process for wastewater treatment: A review. J. Environ. Manag. 2022, 306, 114460. [Google Scholar] [CrossRef]
  22. Wang, Z.; Wang, R.; Yuan, H.; Zhu, N. A novel strategy for high efficiency of anaerobic digestion of waste activated sludge by using a Fe-Cu microelectrolysis method: Performance, electron transfer, key enzymes and microbial community. Water Res. 2025, 287, 124322. [Google Scholar] [CrossRef]
  23. Jiang, F.; Zhang, Y.; Xu, X.; Mao, Y.; Wang, M.; Yang, B.; Zhang, C.; Feng, X.; Meng, H.; Guo, F.; et al. Application of cysteine with Cu2+ to strengthen Fenton-based treatment of coking wastewater used ferric sludge as a source of iron catalyst: Cl-removal and Fe3+/Fe2+ cycling. J. Environ. Chem. Eng. 2025, 13, 117556. [Google Scholar] [CrossRef]
  24. Duc, L.V.; Ito, H.; Hama, T.; Kim, J.; Kawagoshi, Y. A novel reactor combining anammox and Fenton-like reactions for the simultaneous removal of organic carbon and nitrogen at different organic carbon to nitrogen ratios. J. Environ. Manag. 2020, 271, 110832. [Google Scholar] [CrossRef] [PubMed]
  25. Anfruns, A.; Gabarró, J.; Gonzalez-Olmos, R.; Puig, S.; Balaguer, M.D.; Colprim, J. Coupling anammox and advanced oxidation-based technologies for mature landfill leachate treatment. J. Hazard. Mater. 2013, 258, 27–34. [Google Scholar] [CrossRef] [PubMed]
  26. Gilcreas, F.W. Standard methods for the examination of water and waste water. Am. J. Public Health Nations Health 1966, 56, 387–388. [Google Scholar] [CrossRef] [PubMed]
  27. Stedmon, C.A.; Markager, S. Resolving the variability in dissolved organic matter fluorescence in a temperate estuary and its catchment using PARAFAC analysis. Limnol. Oceanogr. 2005, 50, 686–697. [Google Scholar] [CrossRef]
  28. Stedmon, C.A. Tracing dissolved organic matter in aquatic environments using a new approach to fluorescence spectroscopy. Mar. Chem. 2003, 82, 3–4. [Google Scholar] [CrossRef]
  29. Chen, W.; Westerhoff, P.; Leenheer, J.A.; Booksh, K. Fluorescence excitation-emission matrix regional integration to quantify spectra for dissolved organic matter. Environ. Sci. Technol. 2003, 37, 5701–5710. [Google Scholar] [CrossRef]
  30. Chen, Z.; Fang, J.; Wei, W.; Ngo, H.H.; Guo, W.; Ni, B.-J. Emerging adsorbents for micro/nanoplastics removal from contaminated water: Advances and perspectives. J. Clean. Prod. 2022, 371, 133676. [Google Scholar] [CrossRef]
  31. Cardinali-Rezende, J.; Rojas-Ojeda, P.; Nascimento, A.M.A.; Sanz, J.L. Proteolytic bacterial dominance in a full-scale municipal solid waste anaerobic reactor assessed by 454 pyrosequencing technology. Chemosphere 2016, 146, 519–525. [Google Scholar] [CrossRef] [PubMed]
  32. Wang, R.M.; Li, C.X.; Lv, N.; Pan, X.F.; Cai, G.J.; Ning, J.; Zhu, G.F. Deeper insights into effect of activated carbon and nano-zero-valent iron addition on acidogenesis and whole anaerobic digestion. Bioresour. Technol. 2021, 324, 124671. [Google Scholar] [CrossRef] [PubMed]
  33. Goswami, R.; Chattopadhyay, P.; Shome, A.; Banerjee, S.N.; Chakraborty, A.K.; Mathew, A.K.; Chaudhury, S. An overview of physico-chemical mechanisms of biogas production by microbial communities: A step towards sustainable waste management. 3 Biotech. 2016, 6, 72. [Google Scholar] [CrossRef]
  34. Liu, C.M.; Wachemo, A.C.; Tong, H.; Shi, S.H.; Zhang, L.; Yuan, H.R.; Li, X.J. Biogas production and microbial community properties during anaerobic digestion of corn stover at different temperatures. Bioresour. Technol. 2018, 261, 93–103. [Google Scholar] [CrossRef]
  35. Speirs, L.B.M.; Rice, D.T.F.; Petrovski, S.; Seviour, R.J. The Phylogeny, Biodiversity, and Ecology of the Chloroflexi in Activated Sludge. Front. Microbiol. 2019, 10, 2015. [Google Scholar] [CrossRef]
  36. Nguyen, T.V.; Trinh, H.P.; Park, H.-D. Genome-based analysis reveals niche differentiation among Firmicutes in full-scale anaerobic digestion systems. Bioresour. Technol. 2025, 418, 131993. [Google Scholar] [CrossRef] [PubMed]
  37. Zhao, S.; Guo, H.; Klitzsch, N.; Liu, X.; Li, G.; Xu, X. The role of biodegradable plastics in lignite anaerobic digestion: Changes of organics transformation and metabolic pathway. Bioresour. Technol. 2025, 419, 132021. [Google Scholar] [CrossRef] [PubMed]
  38. de Bok, F.A.M.; van Leerdam, R.C.; Lomans, B.P.; Smidt, H.; Lens, P.N.L.; Janssen, A.J.H.; Stams, A.J.M. Degradation of methanethiol by methylotrophic methanogenic archaea in a lab-scale upflow anaerobic sludge blanket reactor. Appl. Environ. Microbiol. 2006, 72, 7540–7547. [Google Scholar] [CrossRef]
  39. Ros, M.; Franke-Whittle, I.H.; Morales, A.B.; Insam, H.; Ayuso, M.; Pascual, J.A. Archaeal community dynamics and abiotic characteristics in a mesophilic anaerobic co-digestion process treating fruit and vegetable processing waste sludge with chopped fresh artichoke waste. Bioresour. Technol. 2013, 136, 1–7. [Google Scholar] [CrossRef]
  40. Yan, Y.; Liang, H.; Wang, Z.; Wu, D.; Zhou, J.; Peng, Y. Attaining superior nitrogen removal from integrated mature landfill leachate and kitchen waste digestion liquid via a two-stage partial nitrification/anammox (PN/A) process. Chem. Eng. J. 2024, 480, 148352. [Google Scholar] [CrossRef]
  41. Wu, Y.; Zhang, Y.; Chen, Y.; Li, J.; Chen, Z.; Li, Y.; Wang, X. Advanced nitrogen removal from low-strength municipal sewage by partial nitritation–anammox (PN-A) process: Zeolite-driven nitritation mechanism and microbial community analysis. J. Water Process Eng. 2025, 74, 107860. [Google Scholar] [CrossRef]
  42. Zhang, Y.; Li, J.; Chen, Y.; Yang, J.; Chen, Z.; Wang, X. Rapid start-up and stable operation of pilot scale denitrification-partial nitritation/anammox process for treating electroplating tail wastewater. Bioresour. Technol. 2024, 409, 131192. [Google Scholar] [CrossRef] [PubMed]
  43. Zhao, Y.; Liu, S.; Jiang, B.; Feng, Y.; Zhu, T.; Tao, H.; Tang, X.; Liu, S. Genome-Centered Metagenomics Analysis Reveals the Symbiotic Organisms Possessing Ability to Cross-Feed with Anammox Bacteria in Anammox Consortia. Environ. Sci. Technol. 2018, 52, 11285–11296. [Google Scholar] [CrossRef] [PubMed]
  44. Zhao, M.; Li, Y.; Ruan, W.; Huang, Z.; Ren, H. ANAMMOX performance, granulation, and microbial response under COD disturbance. J. Chem. Technol. Biotechnol. 2015, 90, 139–148. [Google Scholar] [CrossRef]
  45. Antwi, P.; Zhang, D.; Luo, W.; Xiao, L.W.; Meng, J.; Kabutey, F.T.; Ayivi, F.; Li, J. Performance, microbial community evolution and neural network modeling of single-stage nitrogen removal by partial-nitritation/anammox process. Bioresour. Technol. 2019, 284, 359–372. [Google Scholar] [CrossRef]
  46. Zhao, Q.; Li, X.; Zhang, L.; Li, J.; Jia, T.; Zhao, Y.; Wang, L.; Peng, Y. Partial denitrifying phosphorus removal coupling with anammox (PDPRA) enables synergistic removal of C, N, and P nutrients from municipal wastewater: A year-round pilot-scale evaluation. Water Res. 2024, 253, 121321. [Google Scholar] [CrossRef] [PubMed]
Figure 1. AD, PN/A coupling process.
Water 18 01179 g001
Figure 2. Changes in the concentration of COD (a) and NH4+-N (b) during the startup phase of AD; changes in the concentration of NH4+-N (c) and the accumulation rate of NO2-N (d) during the startup phase of PN; changes in the concentration of NH4+-N (e) and the accumulation rate of NO2-N (f) during the domestication phases of PN.
Water 18 01179 g002
Figure 3. Changes in the concentration of NH4+-N (a), NO2-N (b) and TN (c) during the startup phase of Anammox; changes in the concentration of NH4+-N (d), NO2-N (e), and TN (f) during the domestication phase of Anammox.
Water 18 01179 g003
Figure 4. Changes in COD (a), NH4+-N (b), NO2-N (c), NO3-N (d), and TN (e) concentrations in the AD, PN/A coupling process.
Water 18 01179 g004
Figure 5. The COD concentration of the effluent from Fenton process with different dosage of H2O2.
Water 18 01179 g005
Figure 6. DOM three-dimensional fluorescence spectra of influent (ad) and effluent (eh) for the integration of AD, PN/A, and Fenton process.
Water 18 01179 g006
Figure 7. Changes in the bacterial community structure at the phylum (a) and genus (b) level for AD; Changes in the archaea community structure at the phylum (c) and genus (d) level for AD.
Water 18 01179 g007
Figure 8. Changes in the microbial community structure at the phylum (a) and genus (b) level for PN.
Water 18 01179 g008
Figure 9. Changes in the microbial community structure at the phylum (a) and genus (b) level for Anammox.
Water 18 01179 g009
Table 1. The sampling times and corresponding names for each sludge sample.
ReactorTimeName
AD1st day at the startup stageAD1
40th day at the coupling stageAD2
PN1st day at the startup stagePN1
62nd day at the domestication stagePN2
40th day at the coupling stagePN3
Anammox1st day at the startup stageAn1
40th day at the domestication stageAn2
40th day at the coupling stageAn3
Table 2. Characteristics of the DOM three-dimensional fluorescence spectra of influent and effluent for the integration of AD, PN/A and Fenton process.
ComponentsComponent Typeλexem/nmFluorescence PeakRefs.
influentC1Tyrosine-like protein280/350B[27]
C2Tryptophan-like proteins250/310
285/310
T[27]
C3Humus-like substances250/430
350/430
A
C
[27]
C4A mixture of protein-like and humus-like substances240/380
320/380
T
A
[27,28]
effluentC1Humus-like substance250/420
310/420
A
C
[27]
C2Tryptophan-like proteins280/310T[27]
C3Protein-like substances280/360B[28]
C4Protein-like substances280/340B[28]
Disclaimer/Publisher’s Note: The statements, opinions and data contained in all publications are solely those of the individual author(s) and contributor(s) and not of MDPI and/or the editor(s). MDPI and/or the editor(s) disclaim responsibility for any injury to people or property resulting from any ideas, methods, instructions or products referred to in the content.