Article

Analytical Method for Polyelectrolytes in Sludge Condensation (Centrate) Units of a Wastewater Treatment Plant

1
Institute of Natural and Applied Sciences, Department of Environmental Engineering, Yıldız Technical University, 34220 İstanbul, Türkiye
2
Faculty of Civil Engineering, Department of Environmental Engineering, Yıldız Technical University, 34220 İstanbul, Türkiye
*
Author to whom correspondence should be addressed.
Water 2025, 17(6), 825; https://doi.org/10.3390/w17060825
Submission received: 19 January 2025 / Revised: 1 February 2025 / Accepted: 13 February 2025 / Published: 13 March 2025

Abstract

:
Polyelectrolytes (PEs) have a wide range of applications in various industrial processes, including water and wastewater treatment, cosmetics, and the textile industry. They remain irreplaceable as flocculants, particularly in wastewater treatment and sludge dewatering. Due to the variability in the pollutant parameters of wastewater over time, residual polyelectrolytes from the sludge dewatering process are inevitable. These residues can alter the physical and chemical properties of water, potentially causing an environmental hazard. Polyelectrolyte residues are a critical concern in wastewater treatment processes, and their concentration measurements represent one of the most essential steps in ensuring process efficiency. This study investigates the use of UV-VIS spectrophotometry to determine the concentrations of PEs used in water and wastewater treatment. The absorbance spectra of two different cationic polyelectrolytes (PEs) were tested in the wavelength range of 190–300 nm. A linear increase in absorbance values was observed with increasing polyelectrolyte concentrations, with R2 > 0.99 at 190 nm wavelengths. The lowest detection limits were determined as 0.05 mg/L in distilled water and 0.085 mg/L in centrate water. For wastewater samples collected from sludge dewatering units, detection limits ranged from 0.08 mg/L to 0.013 mg/L, depending on the type of polymer. The method was successfully applied to determine polymer concentrations in centrate samples collected from two different wastewater treatment plants. It is thought that this study will assist in research on polyelectrolyte analysis in wastewater.

1. Introduction

Polyelectrolytes are polymers that carry ionic groups along their long molecular chains [1]. These ionic groups enable polyelectrolytes to dissolve in water and interact with other charged surfaces. Polymer lengths have been reported to reach up to 6 million monomer units [2]. Polyelectrolytes can be classified as anionic (negatively charged), cationic (positively charged), or zwitterionic (carrying both positive and negative charges) [2,3].
In water treatment processes, polyelectrolytes facilitate the aggregation of sludge particles into larger clusters (flocculation), aiding in water clarification [4]. Polyelectrolytes are used as flocculants in wastewater treatment to enhance the efficiency of sludge thickening and dewatering processes, as well as in drinking water treatment to remove suspended solids [5]. However, due to the variability in the pollutant parameters of wastewater over time, the presence of insufficient or excessive doses of polymers can affect treatment efficiency.
Therefore, determining and applying the optimal dosage is of critical importance [6]. Additionally, it has been reported that polymers may exhibit toxic effects on aquatic ecosystems and potentially possess carcinogenic properties, emphasizing the need to avoid their excessive use [7,8]. The detection of polymers, particularly at low concentrations (0–10 mg/L), during the final monitoring of wastewater before discharge into the environment is of great importance. However, this process poses several challenges. The low concentrations of polymers strain the sensitivity of analytical methods. The presence of various types and molecular weights of polymers in wastewater complicates the ability to detect all polymers using a single analytical method. Additionally, the complex matrix of wastewater can affect analytical results, leading to potential false positives or negatives.
Anionic and nonionic polyacrylamides are generally considered to have low toxicity [9]. These polymers generally exhibit less toxicity than cationic polyelectrolytes in toxicity tests on aquatic organisms. This is due to the large molecular size and low bioaccumulation potential of these polymers. Cationic polyacrylamides have higher toxicity than anionic or nonionic polymers, and their adverse effects on aquatic organisms are more pronounced [9,10]. It has been reported that cationic PAMs can disrupt cellular functions by adhering to cell membranes and irritating the gills of aquatic organisms. It has been reported that they adhere to the gills of fish, making respiration difficult and causing suffocation due to a lack of oxygen [11]. Cationic PAMs are particularly toxic to small organisms, such as the water flea (Daphnia Magna), and exhibit toxic effects even at concentrations as low as 0.22 mg/L [12]. This toxic effect is ten times higher for fish. This situation shows that the sensitivity of different organisms to polymers is different. A study has shown that the toxic effect of cationic polyelectolites on living organisms starts at 0.19 mg/L and although the polyelectrolyte at a concentration of 0.19 mg/L has a toxic effect on Daphnia magna, this toxic dose varies among living species and is 0.35 mg/L in the Salmo gairdnerii species [13]. In a study investigating the acute toxicity of two different cationic polymer groups (epichlorohydrin/dimethylamine polyamines and quaternary amine copolymers) on aquatic organisms, it was determined, as a result of static bioassays, that the LC50 values of these polymers varied between 271 μg/L and 1.733 μg/L [7]. These results constitute an important starting point for evaluating the potential effects of these polymers on aquatic environments. These results indicate that such polymers may pose potential environmental risks if discharged into aquatic environments. However, these risks need to be better assessed with more comprehensive ecotoxicology studies.
Sensitive analytical methods are required to accurately determine the presence of polyacrylamides (PAM), which are widely used in various technological processes, at low concentrations. The detection of trace amounts of PAM molecules in solutions enables the optimized use of these polymers and provides a better understanding of their behavior in different applications. To enhance the efficiency of PAM in various industrial processes and assess its environmental impacts, reliable methods for low-level PAM analysis must be developed.
The study was carried out with samples taken from two Istanbul wastewater treatment plants with different capacities (620,000 m3/day and 132,155 m3/day). Since parameters such as flow rate, suspended solids, chemical oxygen demand, biological oxygen demand, total nitrogen, total phosphorus, and other pollutants in the wastewater entering the wastewater treatment plants are different from each other, a different polyelectrolyte is used in each treatment plant. Therefore, it is necessary to conduct separate research for each plant. In this study, the Ataköy Advanced Biological Treatment Plant, which receives wastewater from industrial facilities after pretreatment, and the Büyükçekmece Advanced Biological Treatment Plant, which does not receive industrial water, were selected compared to wastewater treatment plants in other regions. In this way, the effect of different wastewater characteristics on polyelectrolyte dosage was examined for a better understanding. Zetag™ 8185 and Neu Floc 7331 polyelectrolytes used in the study are products currently used in the relevant wastewater treatment plants. Therefore, it is thought that it would not be appropriate to directly apply the calibration curves obtained from a different industrial wastewater matrix to the wastewater in this study.
This study provides a detailed evaluation of the performance and sensitivity of a UV-Vis spectrophotometer used to monitor polymer contamination in water and wastewater treatment processes. Through the analyses, the lowest detectable concentrations of cationic polyelectrolytes used in wastewater treatment plants were statistically determined using the UV-Vis spectrophotometric method for centrate samples collected from two different facilities, as well as for distilled water.
Accurate determination of PAM (polyacrylamide) and other polyelectrolytes remaining in wastewater or process liquids (residue) is of great importance. Various analytical methods are used for the detection and quantification of PAM and polyelectrolytes. These methods include size-exclusion chromatography (SEC) [14], fluorescence spectroscopy [15], two-phase titration [16], tannic acid titration [17,18], polarography [19], injection analysis flow systems [20], the starch-triiodide method [21], and UV-Vis spectrophotometry [8,22,23]. Each of these methods is used to determine different properties of PEs, such as molecular weight, electrical charge, and concentration [8,23,24,25]. According to studies, the UV-Vis spectral detection method is a versatile and effective tool in the analysis and quality control of water resources. UV-Vis spectral detection has been introduced in many areas, including drinking water, river, wastewater, and sewage systems, disinfectant residuals, and disinfection by-products (DBPs) [26,27,28,29,30]. UV-Vis spectrophotometers are becoming popular options for online water quality monitoring and process control because they do not contain reagents, do not require sample pretreatment, and can provide continuous measurements. The advantages of online UV-Vis sensors are that they can capture events and respond faster to water quality changes compared to traditional water quality monitoring. The sample preparation and analysis process is relatively fast. It can detect polymers at low concentrations and is generally more economical than other techniques. In this way, pollution in water resources can be detected more quickly [31].
The study specifically aimed to determine the detection limits of various polymers at low concentrations in different water matrices and to examine the factors influencing these limits (e.g., dilution). To mitigate the effects of the matrix, standard addition methods were employed for evaluation. The results highlight the potential and limitations of the spectrophotometric method for water quality monitoring.

2. Materials and Methods

2.1. Chemicals and Instruments

In this study, Zetag™ 8185 (Neuchem Headquarters, Sparks, NV, USA) and Neu Floc 7331(Solenis LLC, Wilmington, DE, USA) cationic polymers, which are commonly used in sludge dewatering, were utilized. The properties of these polymers are given in Table 1. These polymers are representative of those used for sludge conditioning and were selected to have different ranges of molecular weight and cationic charge. Since parameters such as flow rate, suspended solids, chemical oxygen demand, biological oxygen demand, total nitrogen, total phosphorus, and other pollutants in the wastewater entering the wastewater treatment plants are different from each other, a different polyelectrolyte is used in each treatment plant.
The pH of the solutions was determined using a Thermo Scientific Orion 5-Star pH meter (Agilent Technologies, Inc. Headquarters, Santa Clara, CA, USA). Samples and standard solutions were mixed using an FC6S jar test apparatus (Velp Scientifica, Usmate Velate MB, Italy). Prior to analysis, the samples were filtered through a membrane filter paper. Absorbance measurements were conducted using a photoLab 6600 UV-Vis spectrophotometer (Xylem Analytics Germany Sales GmbH & Co., WTW, Weilheim, Germany).
During the experimental procedure, 0.1 N HCl (37% purity, Merck KGaA, Darmstadt, Germany) and 0.1 N NaOH (98% purity, Merck KGaA, Darmstadt, Germany) were used for pH adjustment. Distilled water was used for all experiments.

2.2. Preparation of Stock Polymer Solution

Cationic polyelectrolytes were prepared as a stock solution at a concentration of 0.05% (500 mg/L). The prepared stock solution was homogenized using a jar test device (Velp Scientifica) by stirring at 200 rpm for 5 min, followed by 125 rpm for 55 min. After mixing, the solutions were allowed to settle for 1 h. This stock solution was stirred at 200 rpm for 5 min and then continued to be stirred at 125 rpm for 55 min to prepare a homogeneous intermediate stock polymer solution at a concentration of 0.01%. Following the initial 1-h mixing, the solutions were left to settle for another hour before use in experiments. The required working concentration ranges were prepared using this stock solution [8,22,23].
Standard polyacrylamide solutions were prepared in three different concentration ranges. After the resting period of the cationic polymer stock solutions, each standard polymer solution was prepared in triplicate at concentration ranges of 0.05–1 mg/L, 1–5 mg/L, and 0–1 mg/L.
In the study, three different concentration ranges (0.05–1 mg/L, 1–5 mg/L, and 0–1 mg/L) were selected to examine the behavior of the polymer at different concentrations. The main purpose of selecting different concentration ranges was to determine the most suitable linear working range for absorbance measurements of the polymer and to cover the concentrations that may be encountered in different application areas. The 0.05–1 mg/L range was used to evaluate the sensitivity at low concentrations, while the 1–5 mg/L range was used to examine the linearity of the system at higher concentrations. The 0–1 mg/L range is the intersection of these two ranges and allows the comparison of the results obtained with different methods.
In addition, different concentration ranges allowed us to examine how matrix effects change at different concentrations. Especially at low concentrations, the effect of interferences caused by matrix components may be more pronounced. Therefore, the 0.05–1 mg/L range was selected to evaluate these effects.
In polyelectrolyte solutions prepared in the concentration range lower than 1 g/mL, the mixture of polymers is more homogeneous and tends to form stable colloids [32]. At low concentrations, the system is considered to be in a kinetically controlled regime.

2.3. Water Samples

The experiments utilized distilled (pure) water and centrate wastewater samples taken from the dewatering units of two different advanced biological wastewater treatment plants (the names of the facilities are withheld). To ensure absorbance values remained within the spectrophotometer’s measurement range, the samples were diluted at a 1:10 ratio before analysis [8,22,23].
Standard solutions containing different concentrations of PE were prepared in pure water. Centrate samples taken from the wastewater treatment plants were filtered using a vacuum filtration apparatus. The filtered wastewater samples were prepared for analysis by applying the standard addition method [32,33,34]. Using a UV-Vis spectrophotometer, the samples were scanned across wavelengths of 190–800 nm to confirm whether these polymers could be directly detected.
One of the wastewater treatment plants from which the centrate samples were taken uses the Zetag 8185 polymer in the treatment processes, while the other uses the Neu Floc 7331 polymer. Therefore, these two samples differ in terms of their characteristic features. Therefore, filtration process was applied to remove suspended solids. In order to minimize matrix effects, the standard addition method was preferred. In this way, the effects of other components in the sludge matrix on the polymer analysis were eliminated and more reliable results were obtained. The type of polymer used in both plants, its dosage and application method, differs. It is thought that this situation will affect the results obtained.

2.4. Measurement of Residual Polymer Concentration

The polymer concentration in centrate residual water samples was determined by measuring the sample absorbance as in previously reported studies [8,22,23]. All of the absorbance measurements were carried out between 190 and 800 nm. Since no significant absorbance was detected above 240 nm, the measurements were carried out in the wavelength range of 190–300 nm.
The studies were carried out by scanning absorbance spectra at long wavelengths, and as seen in the graphs, since significant absorbance values were not observed, long-wavelength spectra were not included in the article, and only parts up to 300 nm were shown. Gibbons and Örmeci [23] confirmed in their studies that there was no change in absorbance measurements between 300 and 800 nm [23]. In the study by Al Momani and Örmeci [22], absorbance values were measured between 191.5 and 750 nm, and it was shown that no significant absorbance was detected in polymer samples above 260 nm [22].

Absorbance Measurements

The PE concentration in the samples was detected by measuring absorbance using a UV-Vis spectrophotometer (WTW PhotoLab 6600 UV-Vis Spectrophotometer, Xylem Analytics Germany Sales GmbH & Co., WTW, Weilheim, Germany) with 1 cm quartz cuvettes. Distilled water was used as a blank (control) during calibration.
Two different polyelectrolytes were tested in two different water matrices to characterize their UV absorbance spectra and detection limits. Initial absorbance measurements conducted between 190 and 800 nm revealed no variation in absorbance values within the 300–800 nm range during the initial scans. As a result, subsequent spectral scans in the experiments were limited to the 190–300 nm wavelength range. To enhance the reliability and accuracy of the experiments, each set of experiments was repeated at least three times, and the reported absorbance values represent the average of these three repetitions.
Polymer concentrations were first tested in pure water, followed by measurements in the supernatant of filtered wastewater samples subjected to a 10-fold dilution.

3. Results and Discussion

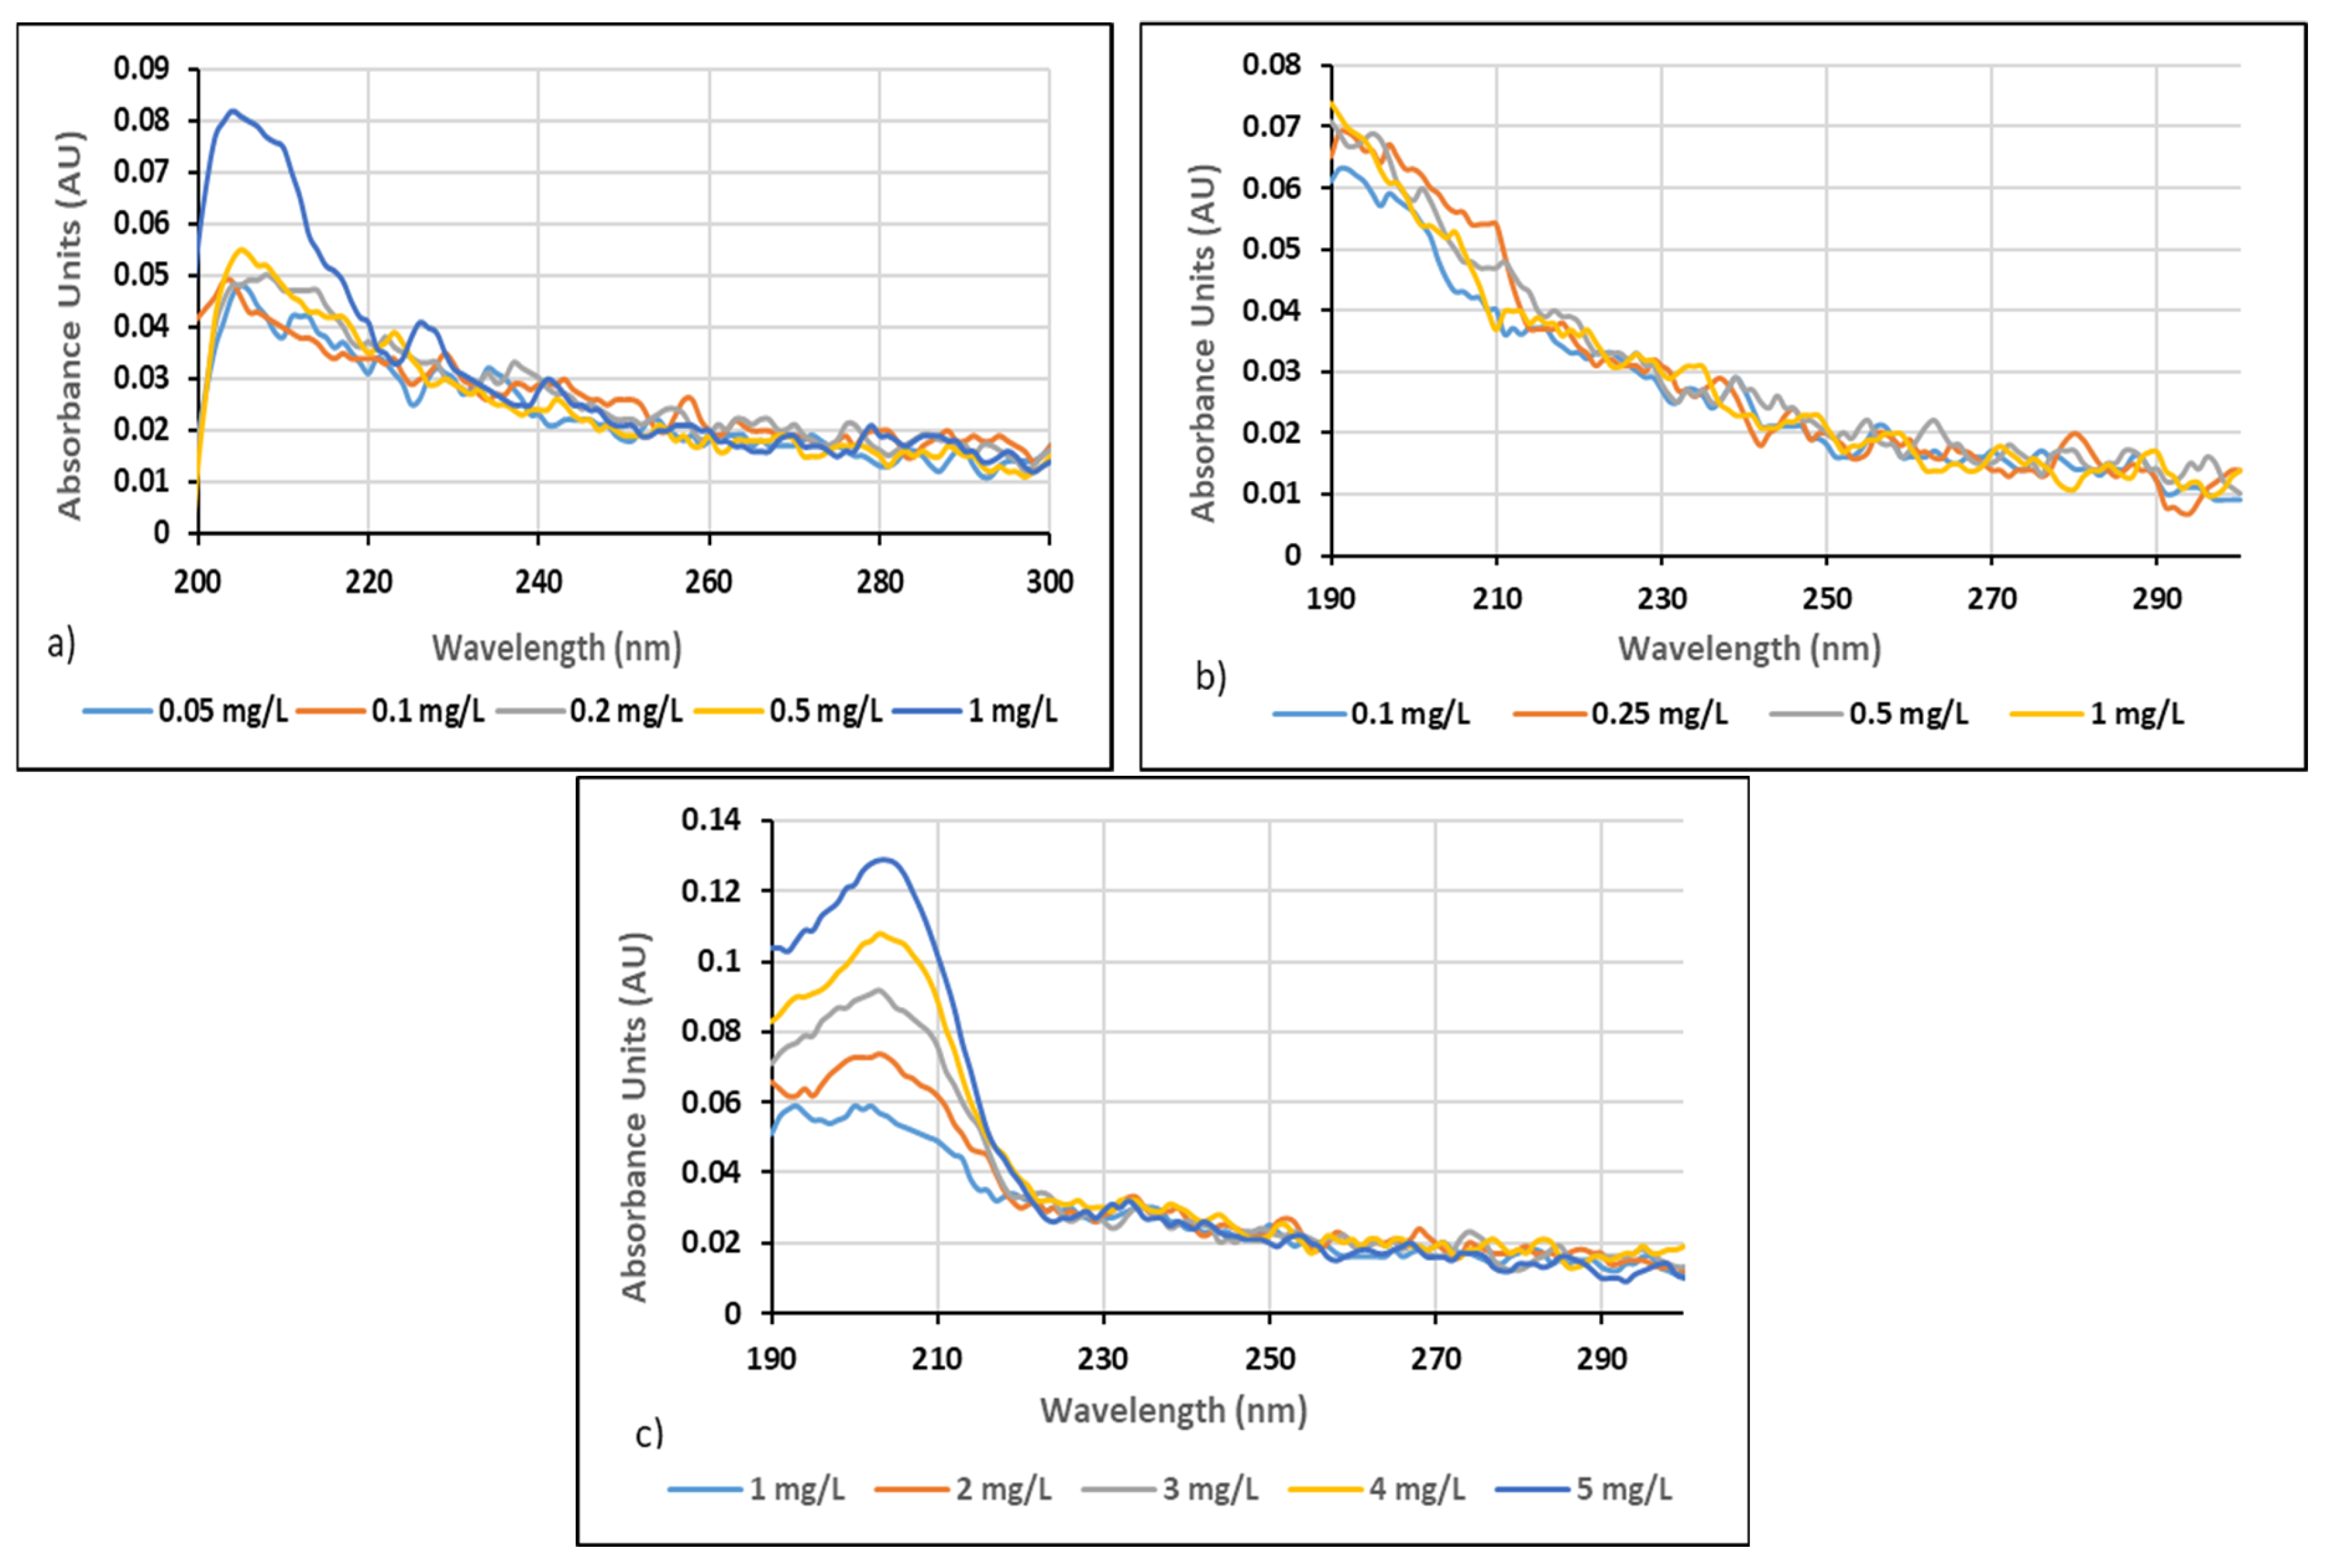
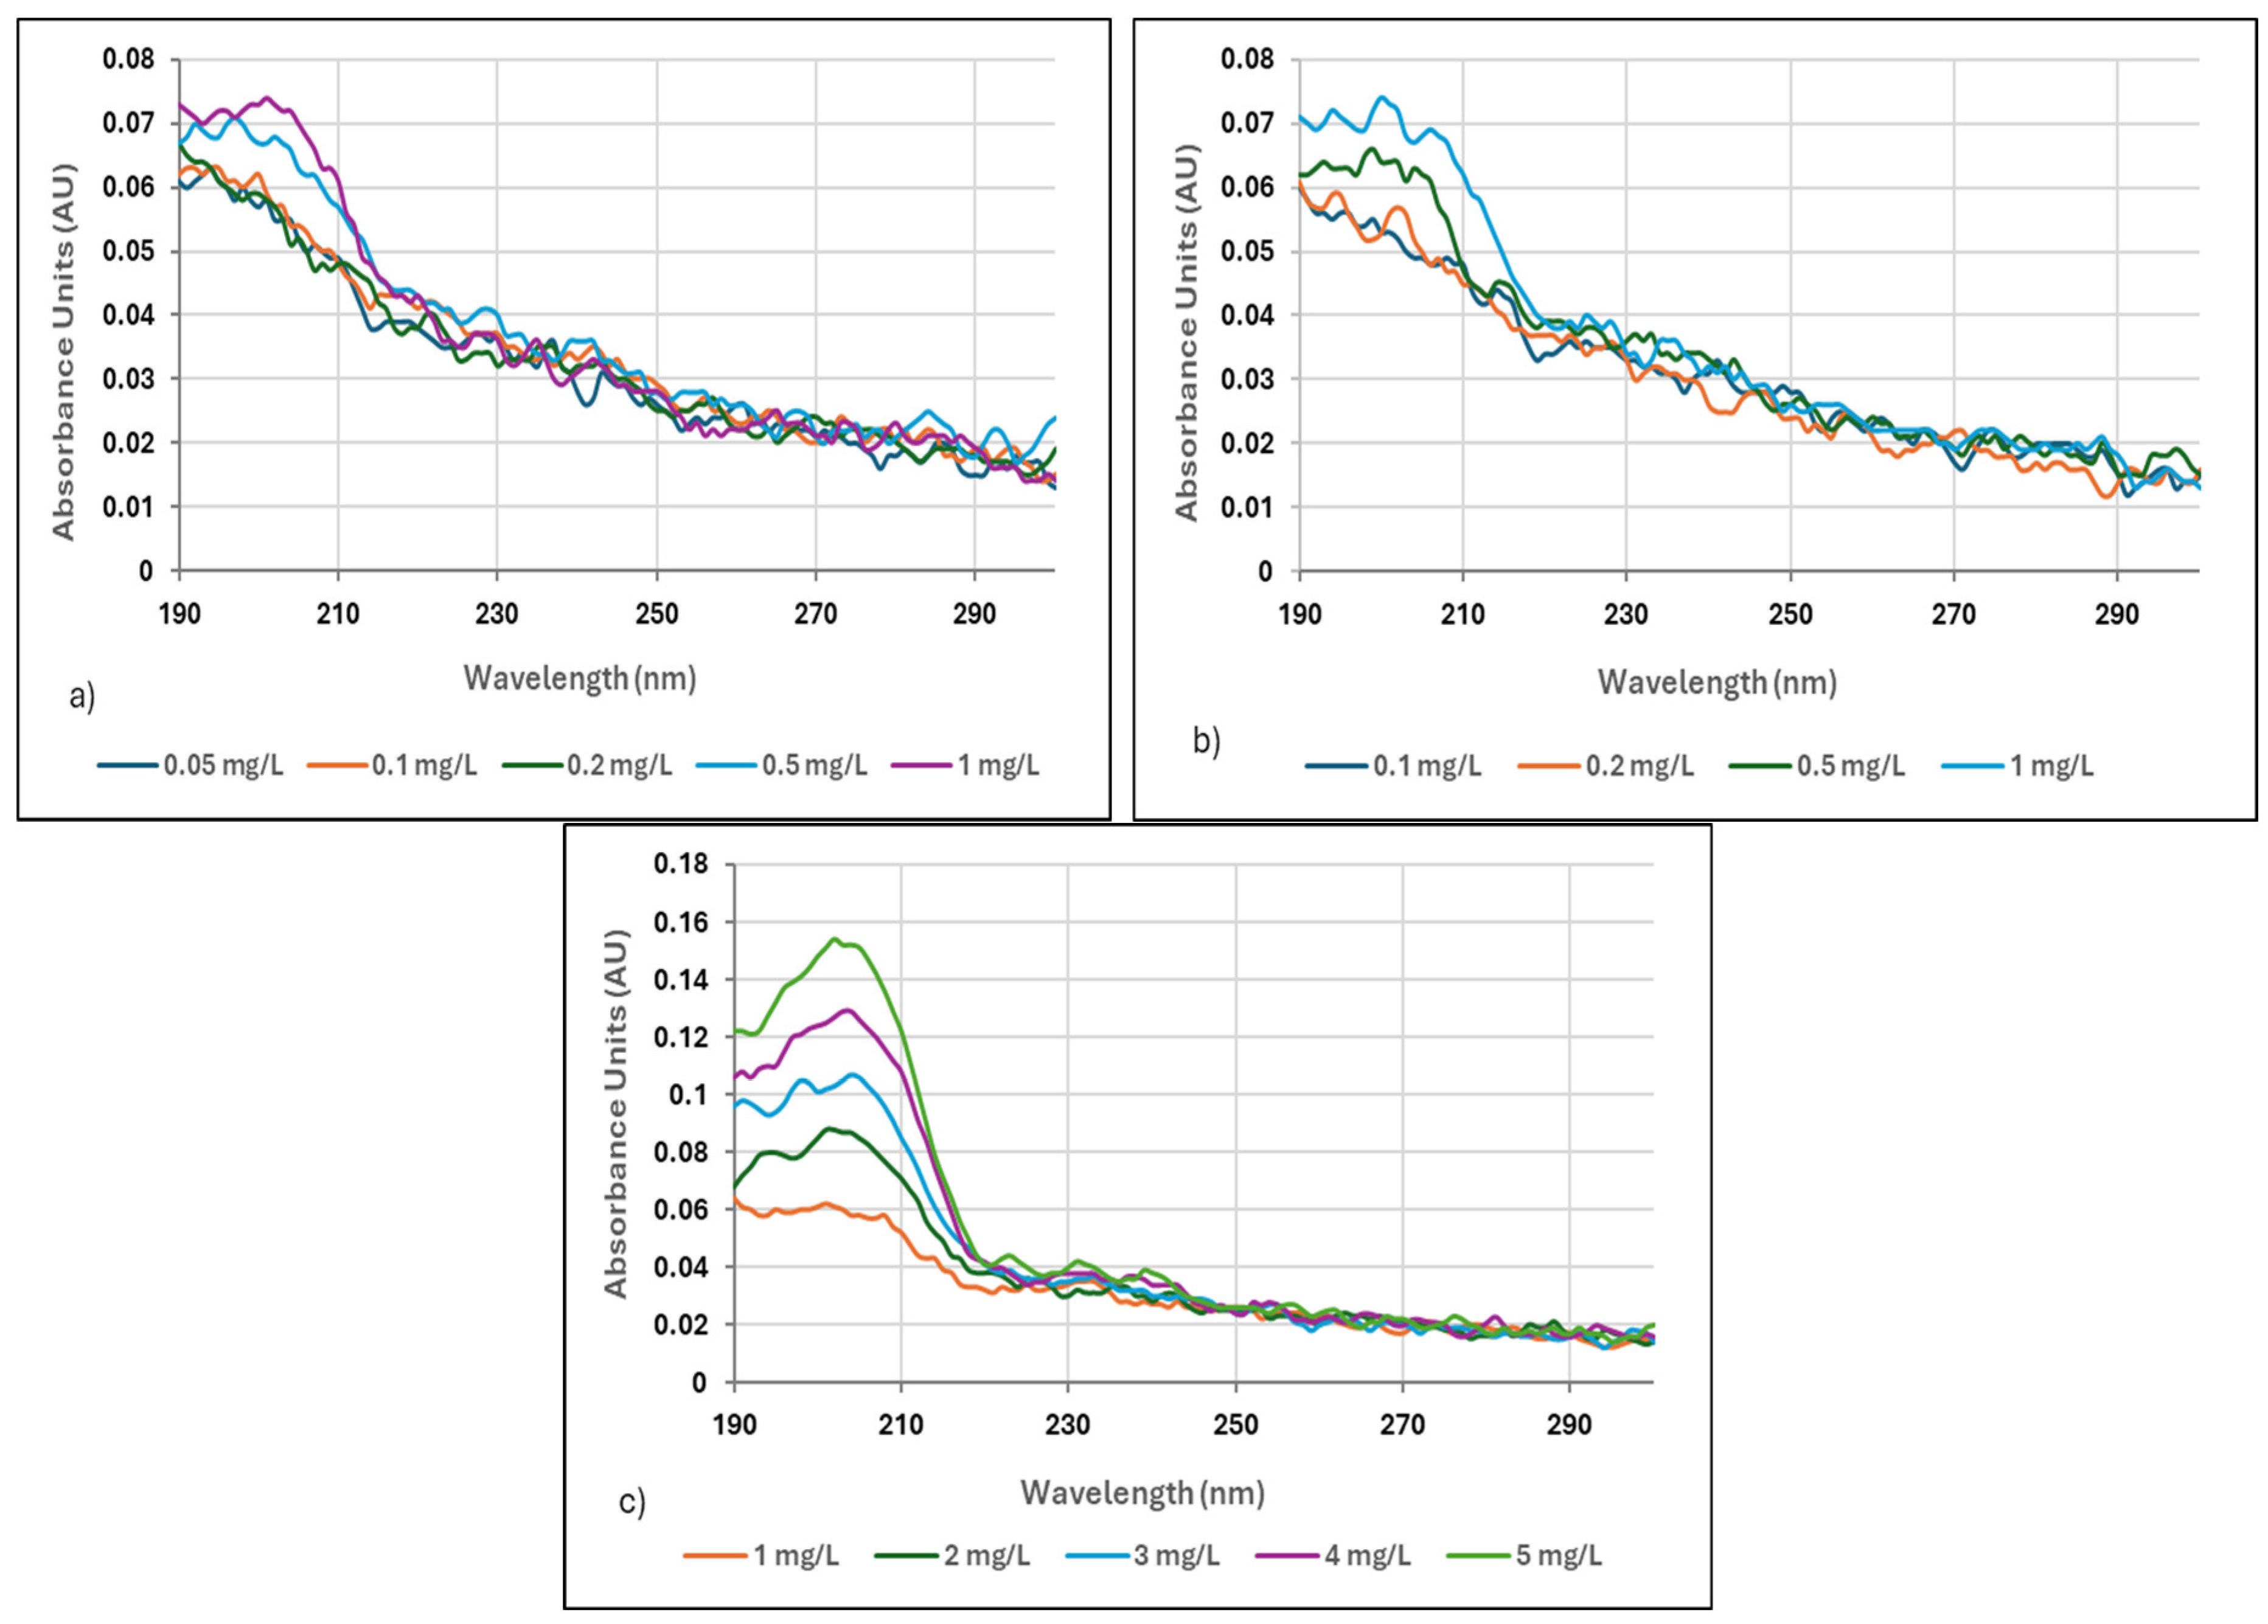
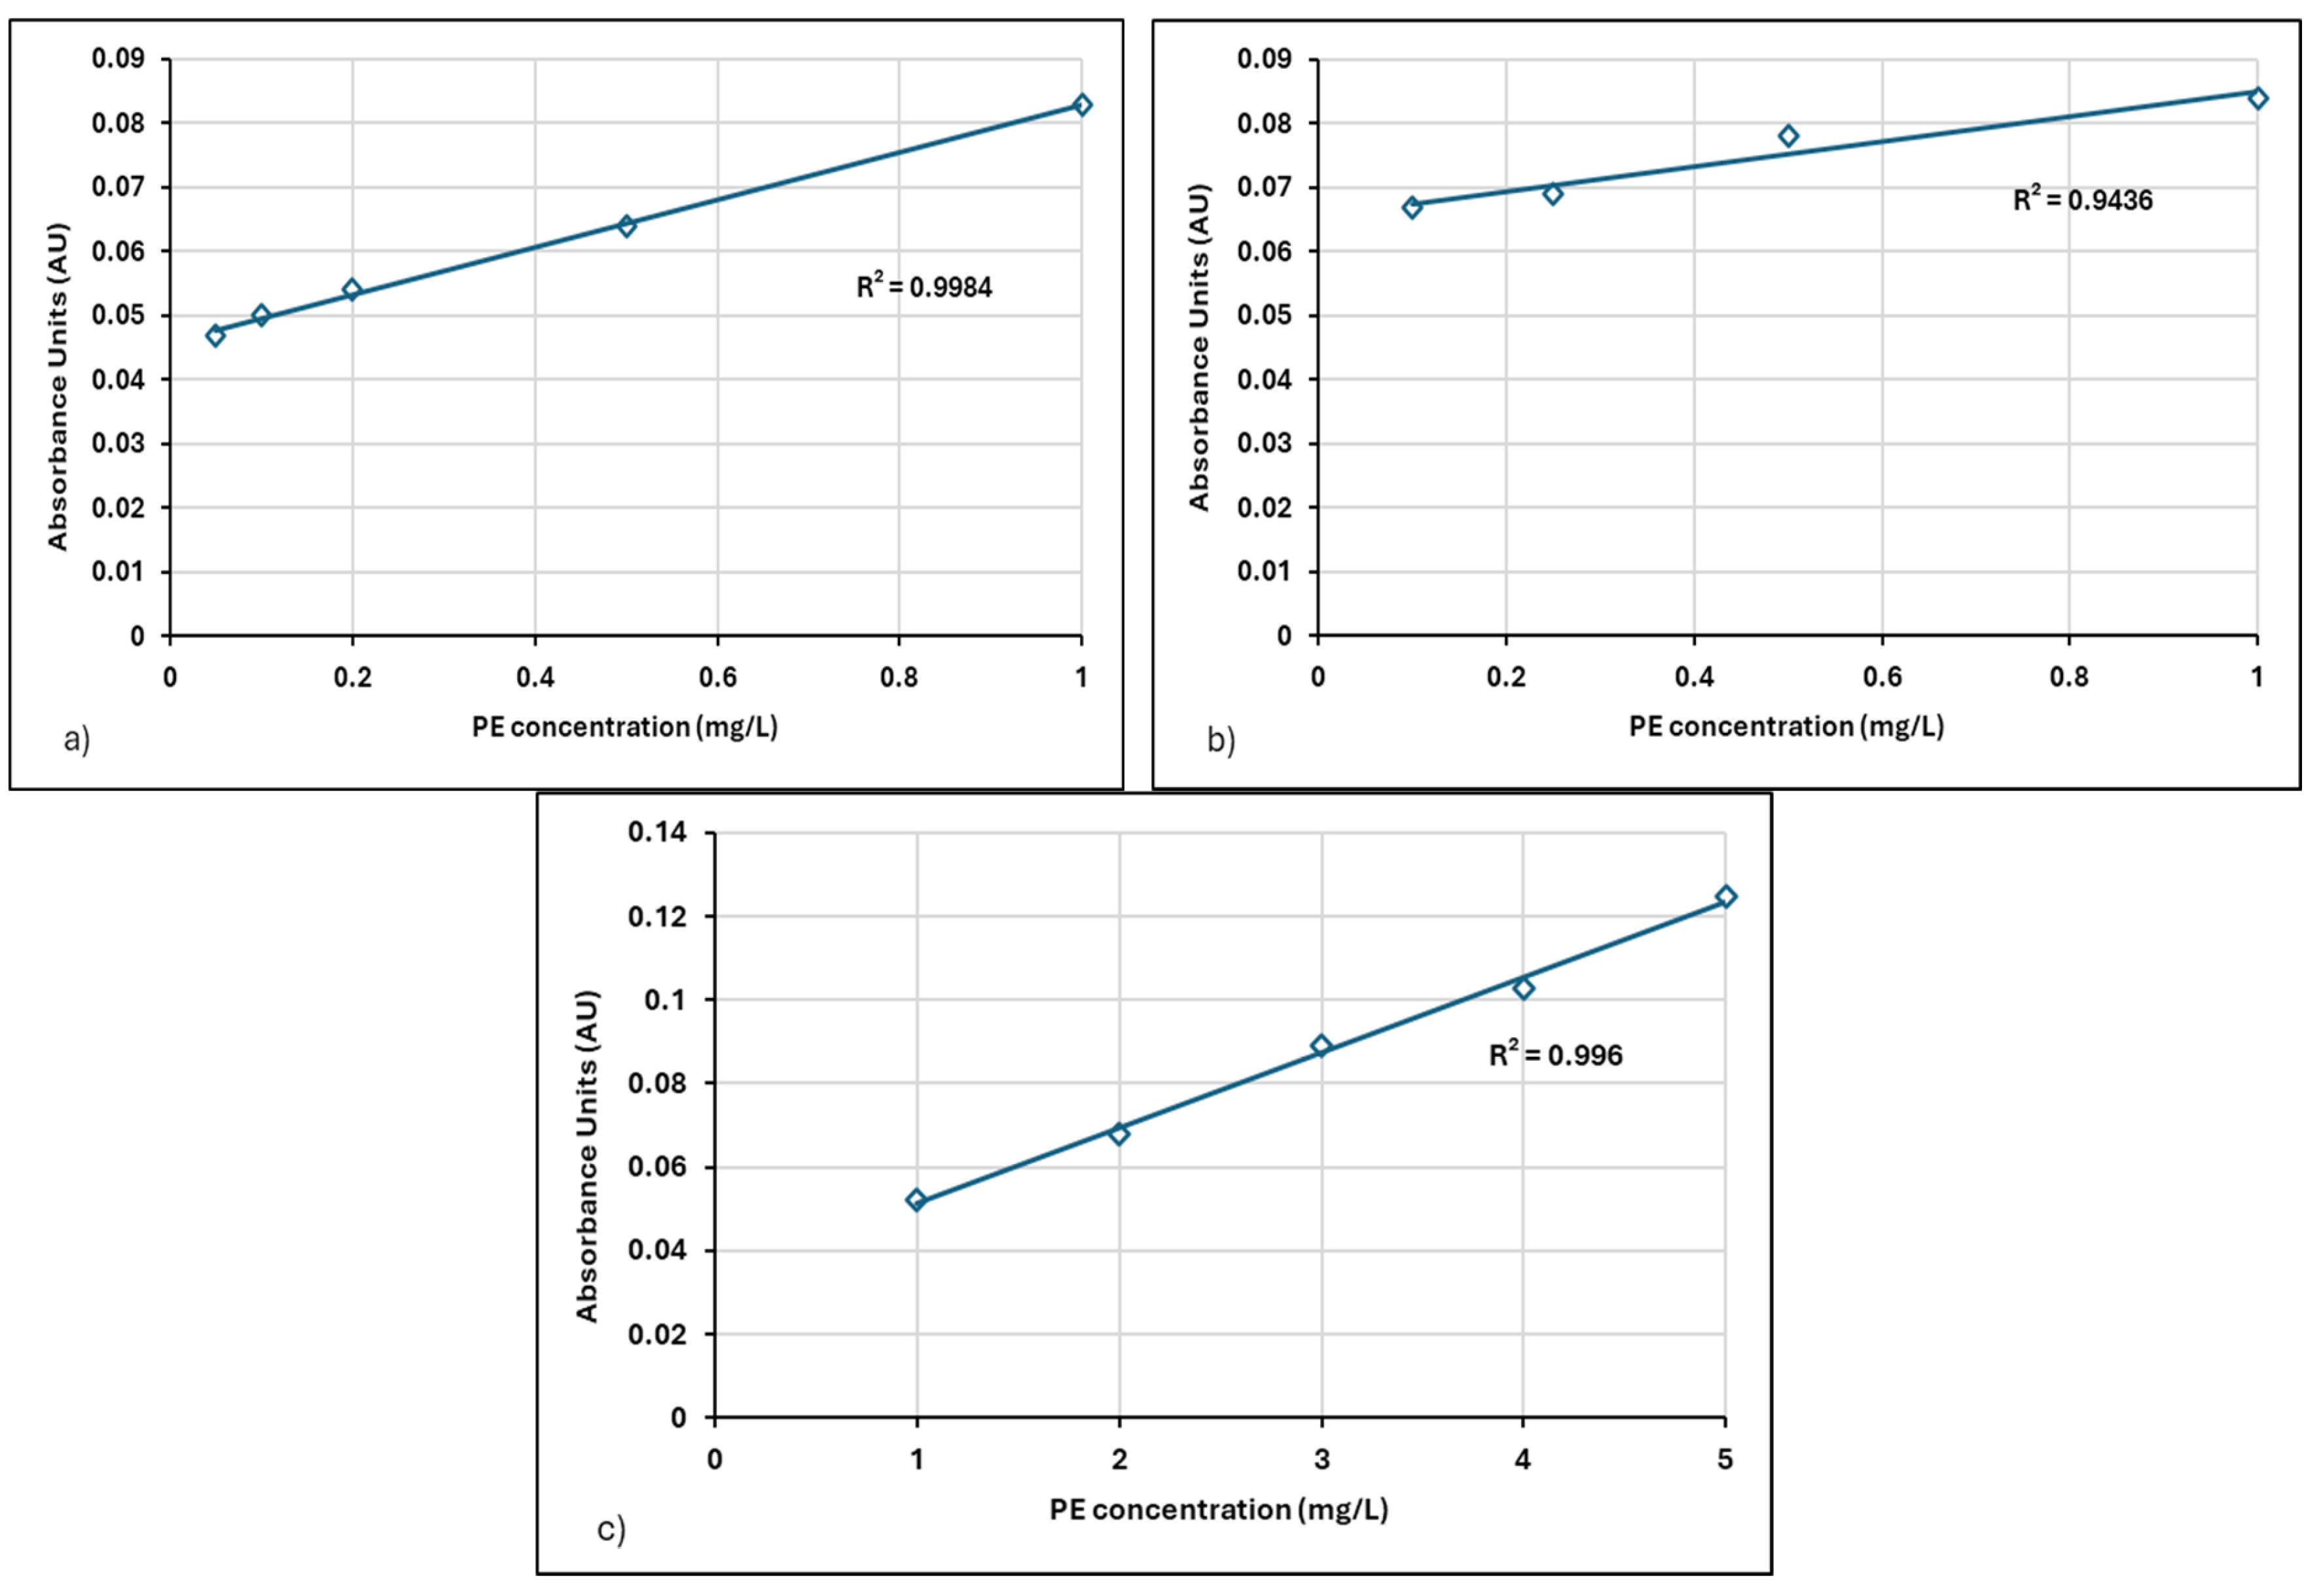
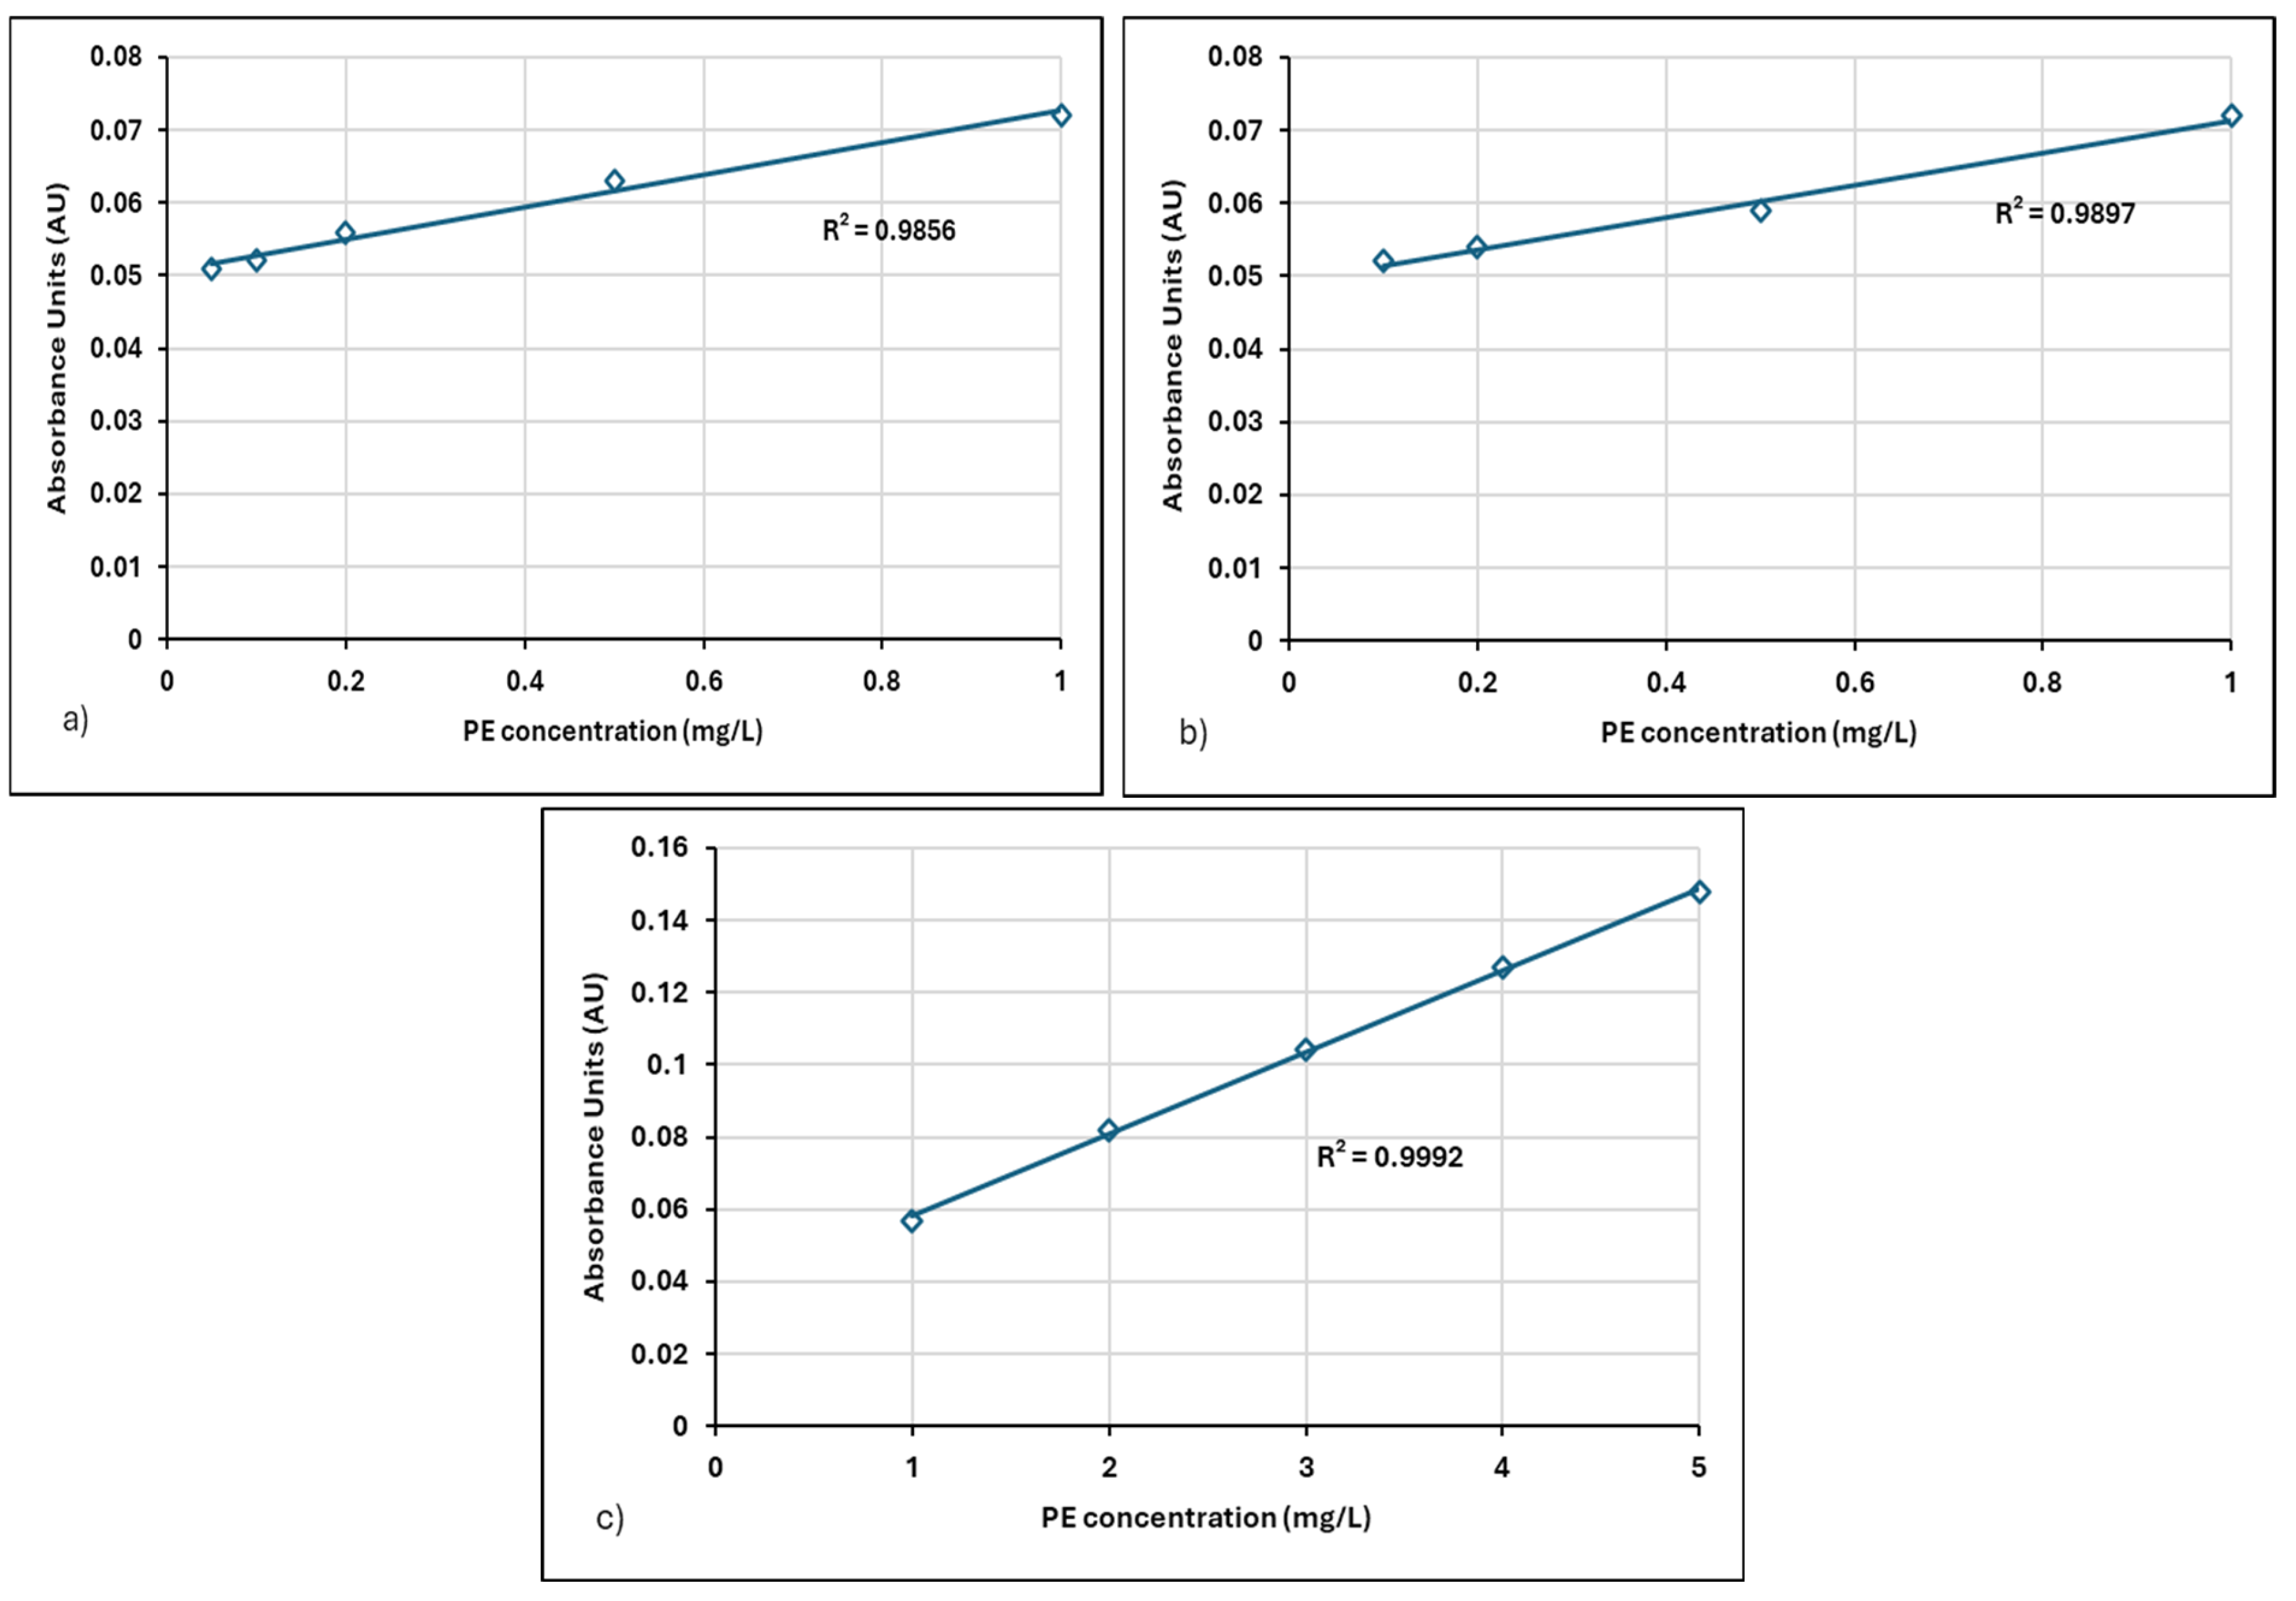
3.1. The Calibration Spectrum of Polymers in Distilled Water

The calibration spectra prepared using pure water are presented in Figure 1. Figure 1a–c display the absorbance spectra of the Neu Floc 7331 polymer in distilled water at concentration ranges of 0.05–1 mg/L, 0.1–1 mg/L, and 1–5 mg/L, respectively. Similarly, Figure 2a–c show the absorbance spectrum of the Zetag 8185 polymer in distilled water at the same concentration ranges.
For polymer solutions with different concentrations, light at specific wavelengths was transmitted through the samples, and the amount of light absorbed was measured.
As polymer concentrations increased, absorbance values also increased. Absorbance measurements were performed in the range of 190 to 300 nm, with the maximum absorbance for the Neu Floc 7331 polymer observed at 203 nm and for the Zetag 8185 polymer at 202 nm. It was noted that absorbance values decreased at higher wavelengths, indicating that the polymers absorb light more effectively at specific wavelengths.
The absorbance spectra of different polymers showed variations, reflecting differences in their chemical structures and their ability to absorb light at varying wavelengths. As polymer concentration increased, absorbance values generally followed a corresponding increase. This behavior aligns with the Beer-Lambert law and is an expected result.
The main reason for the different behaviors of different polyelectrolytes is their molecular structure and sensitivity to environmental conditions. These differences play an important role in determining the application areas of polymers. Differences in the chemical structures of different polyelectrolytes significantly affect the properties of the complexes formed. For example, in the study conducted by Gärdlund et al. (2007) [35], it was stated that complexes formed by two seemingly structurally similar polyanions, such as polyacrylic acid and polymethacrylic acid, with the same polycation showed significant differences in properties such as size. This situation shows how factors such as the type and distribution of functional groups in the polymer chain and molecular weight can affect complex formation and properties.
In the measurements conducted, the absorbance values for Neu Floc 7331 were found to be 0.074 (AU) in the polymer concentration range of 0.1–1 mg/L, 0.082 (AU) in the range of 0.05–1 mg/L, and 0.129 (AU) in the range of 1–5 mg/L.
For Zetag 8185, the absorbance value was determined to be 0.074 (AU) in the polymer concentration range of 0.1–1 mg/L, 0.073 (AU) in the range of 0.05–1 mg/L, and 0.154 (AU) in the range of 1–5 mg/L.
Differences in the molecular structures of the two polymers caused slight variations in their absorbance spectra.

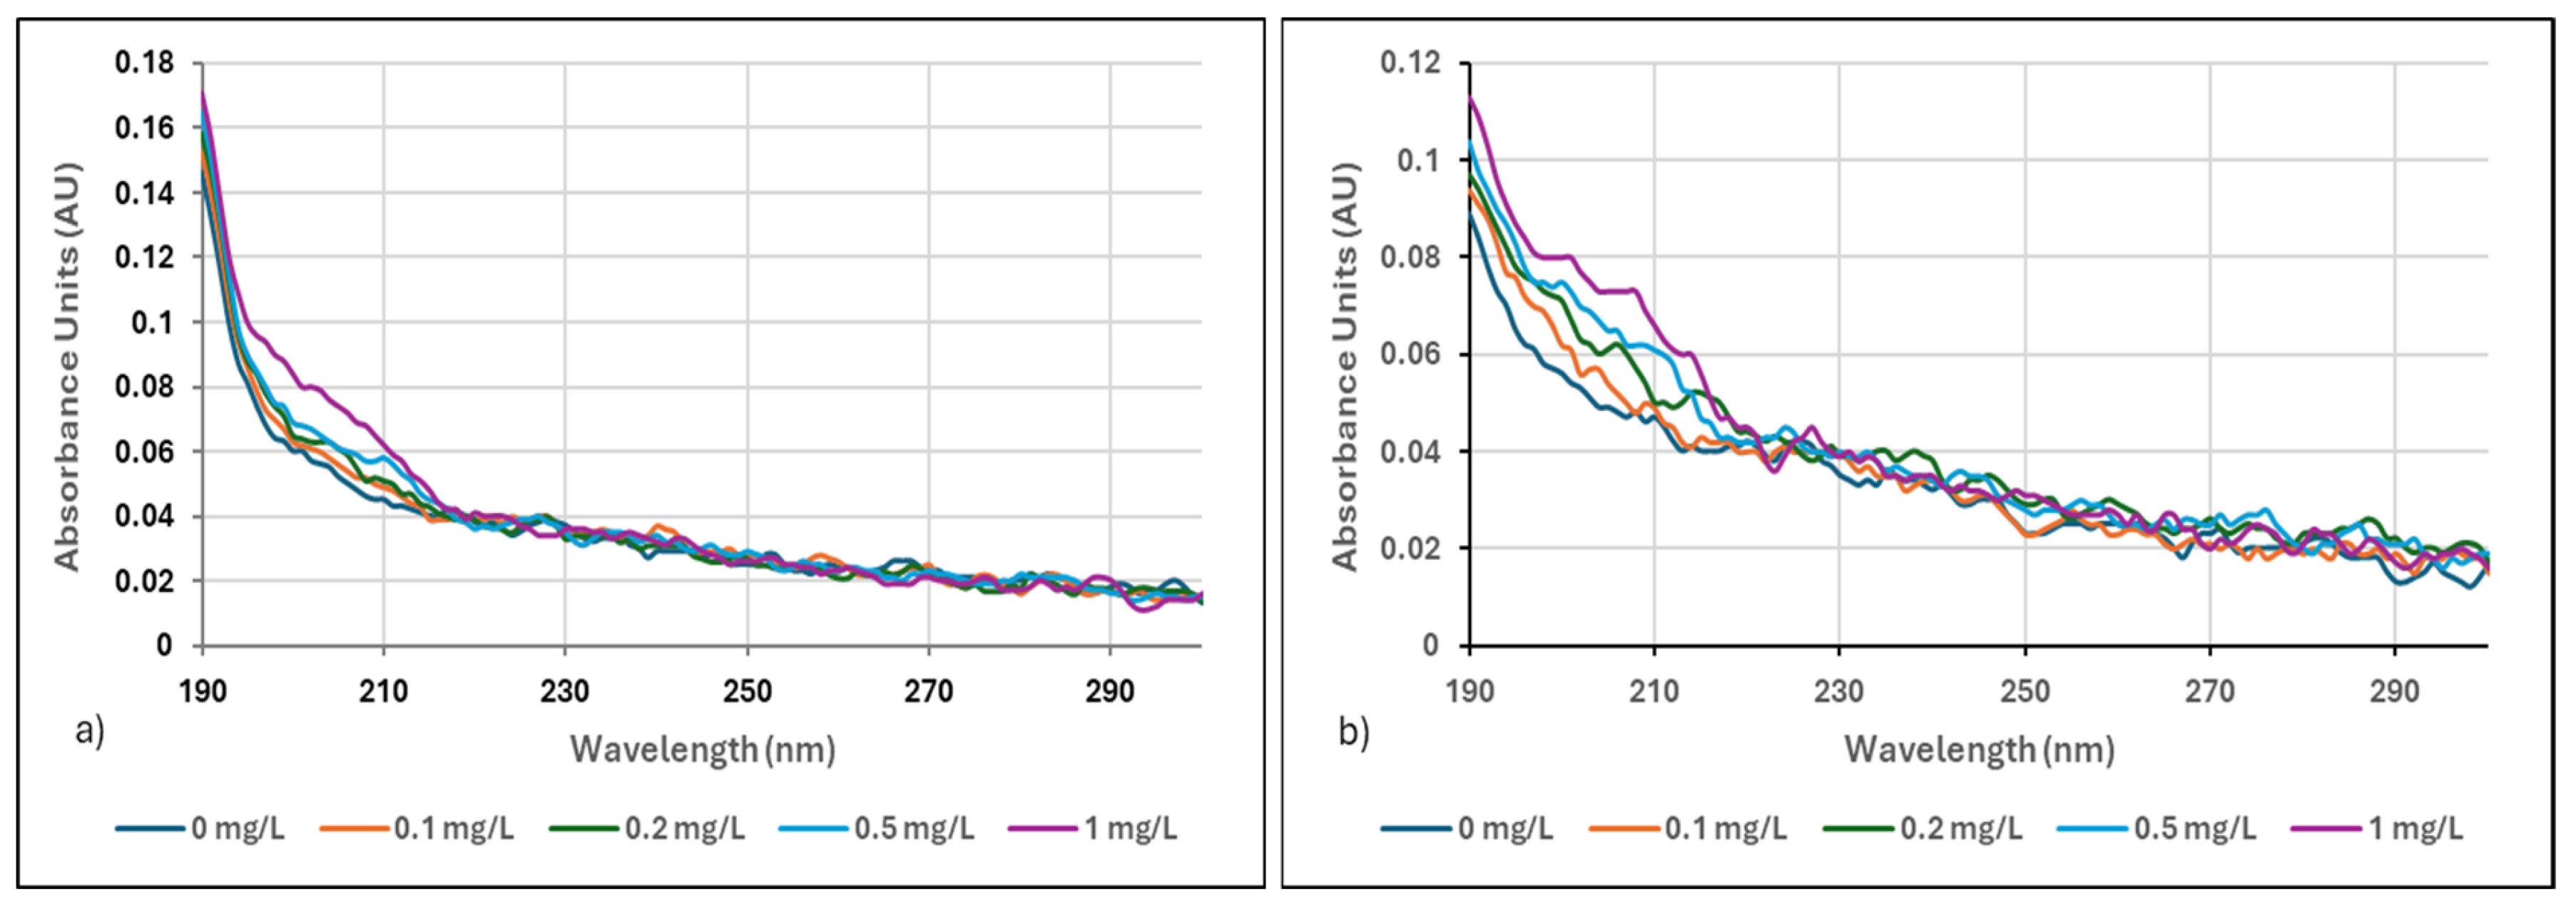
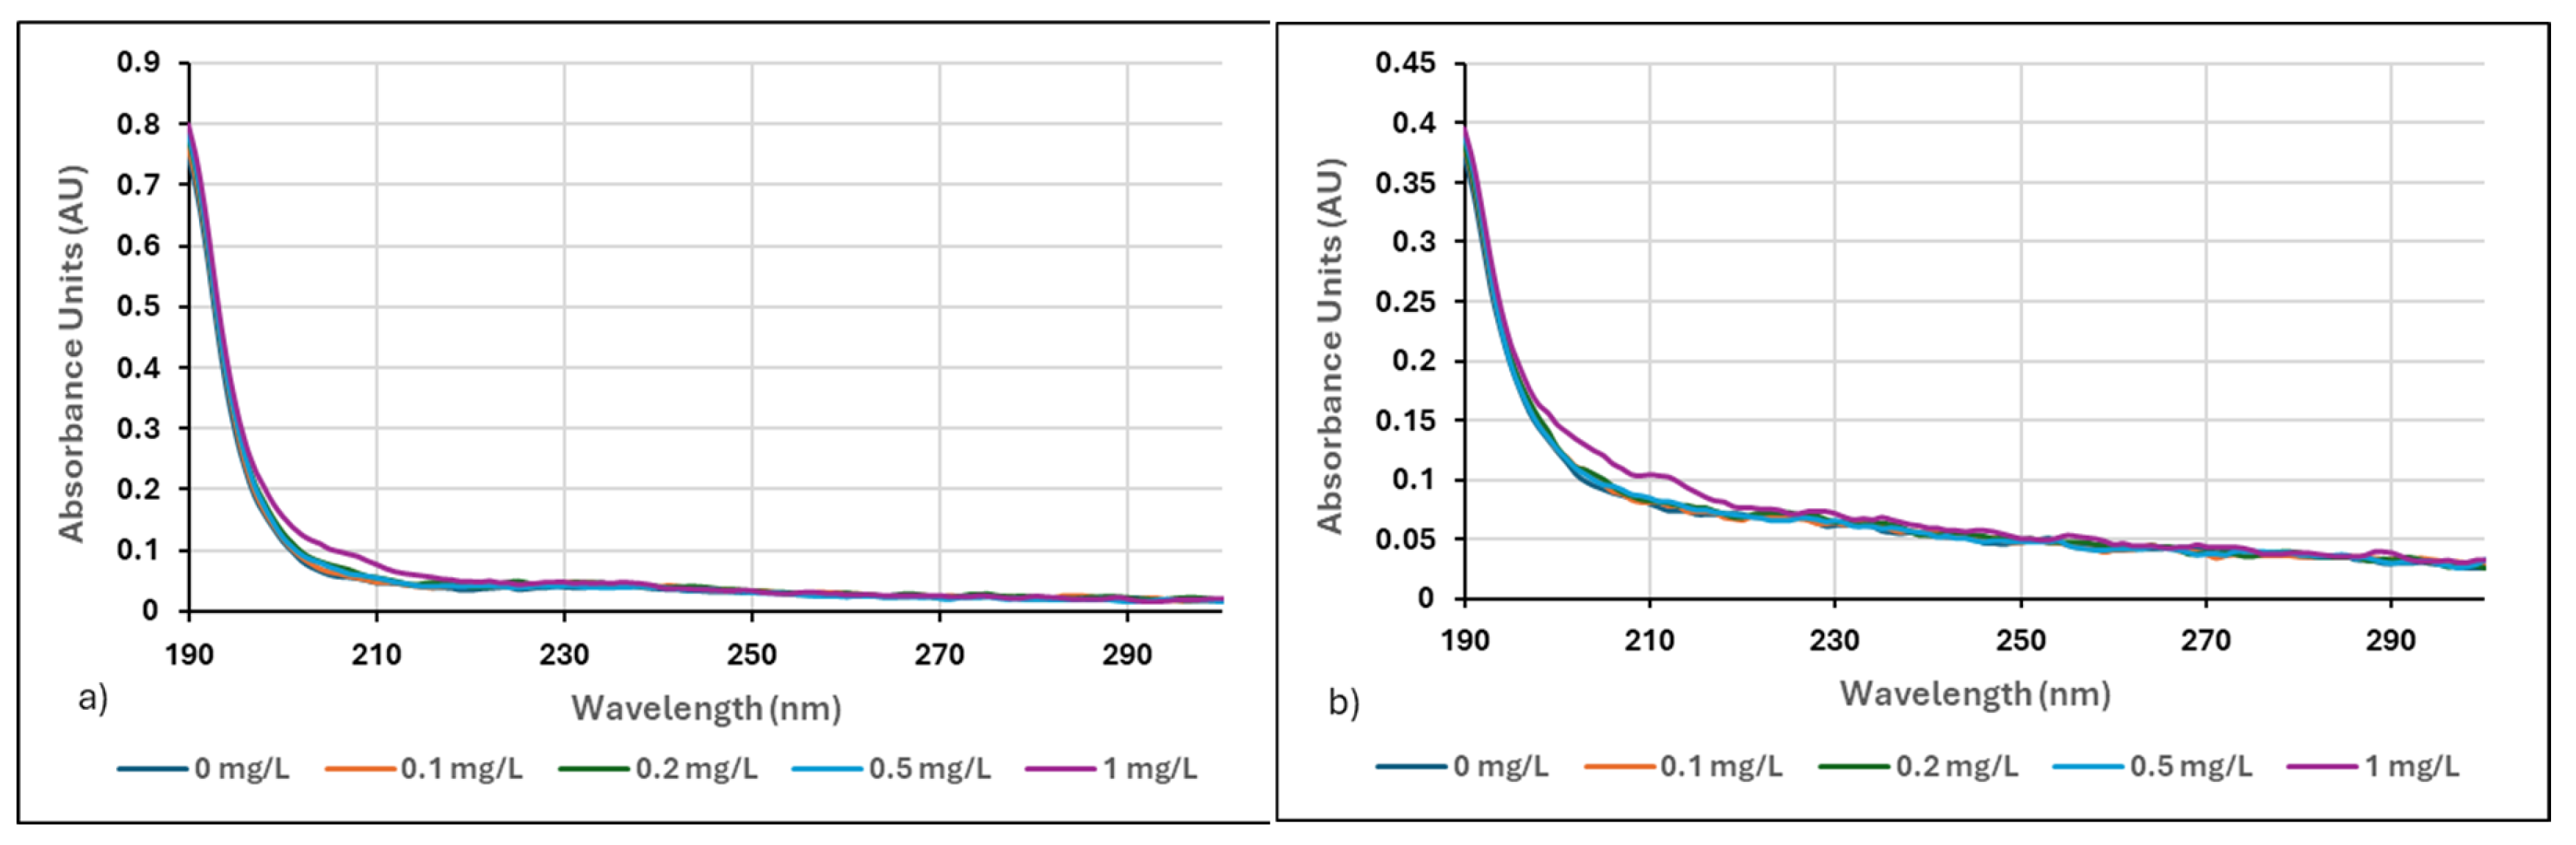
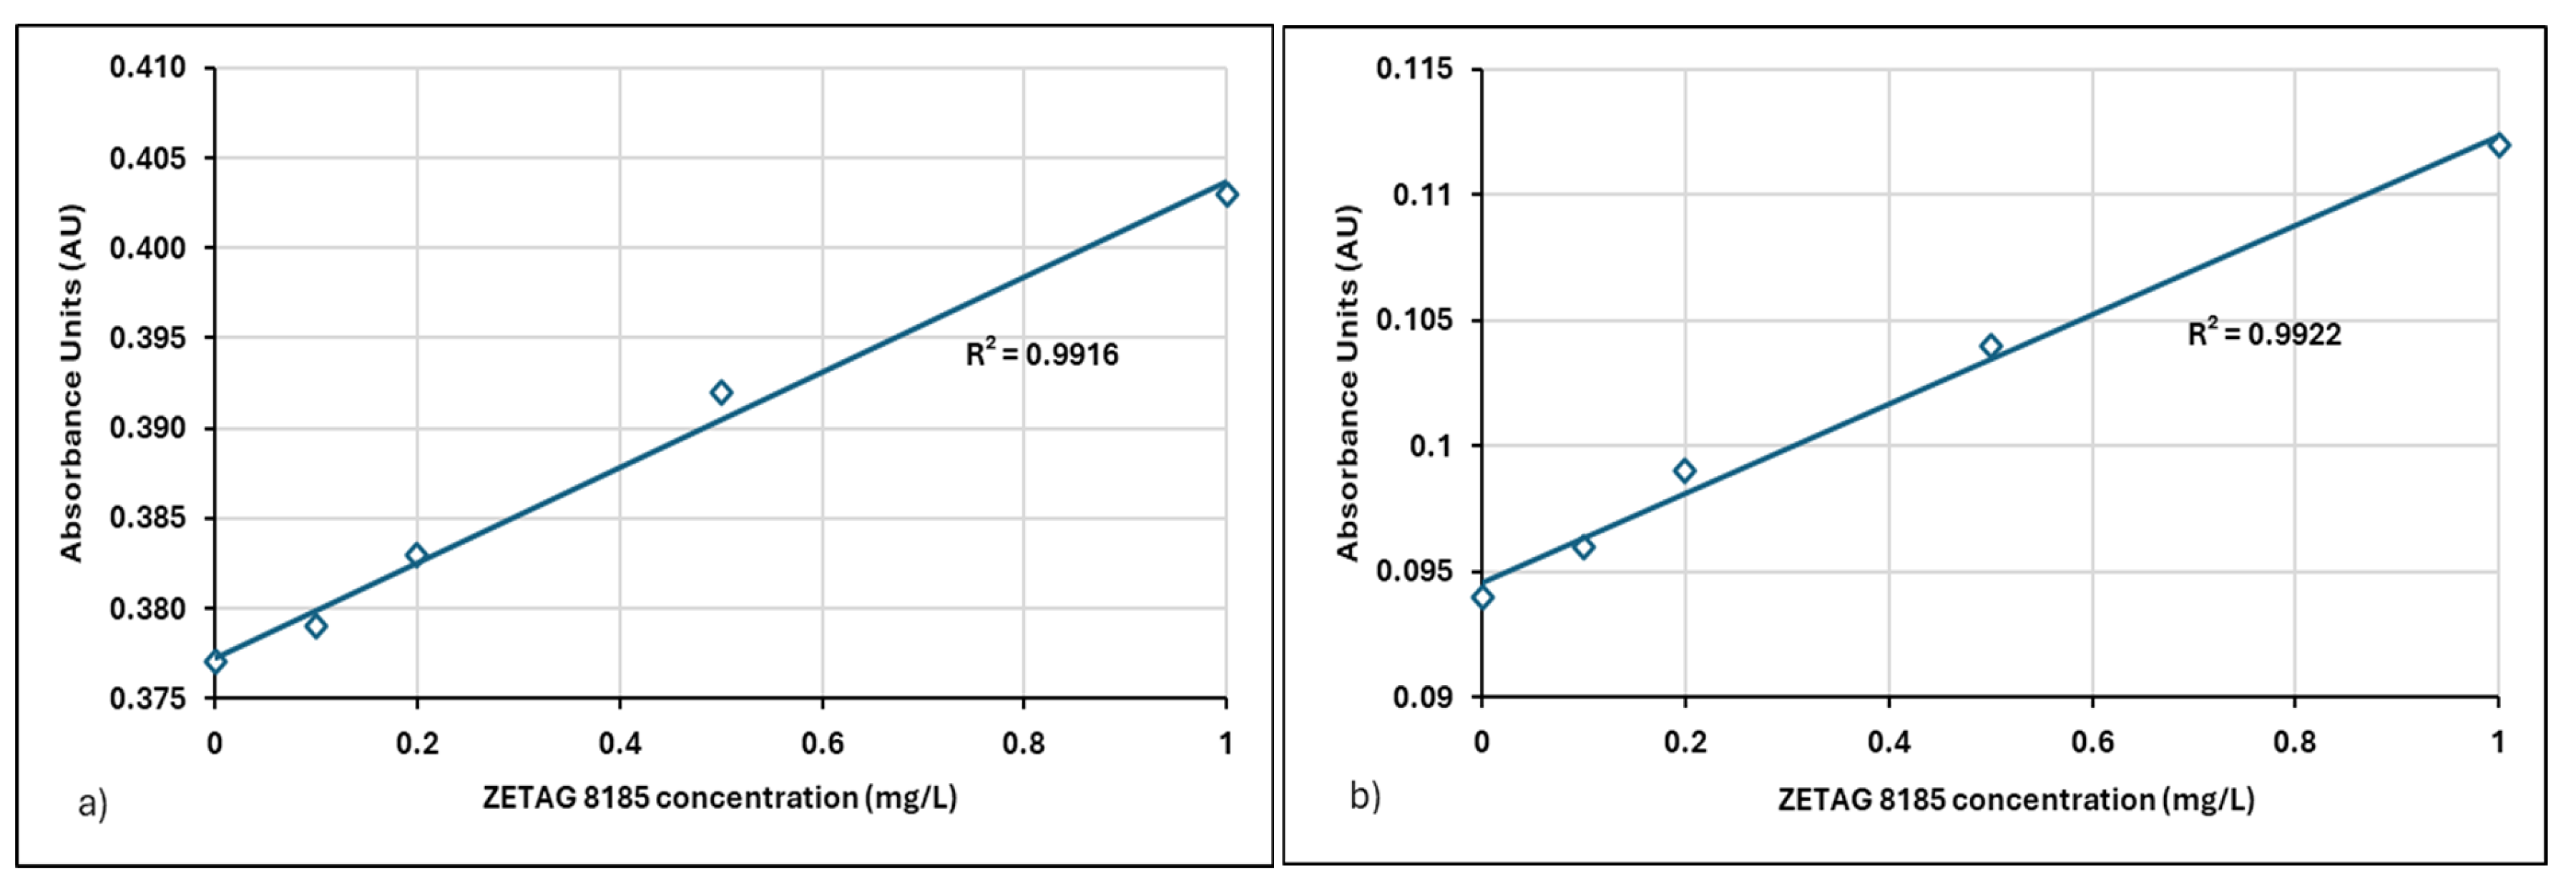
3.2. Polyelectrolyte Absorbance Spectra in Centrate Samples

The method was also carried out using centrate water samples collected from the sludge dewatering units of major advanced biological wastewater treatment plants in Istanbul. Centrate water samples were chosen because they represent a high-concentration and dense wastewater matrix. Due to the high absorbance signal from the sludge solution, which could cause detector saturation, the samples were filtered under aseptic conditions using a membrane filtration system. Before enrichment with polymers, the samples were diluted 10-fold and prepared for measurement.
To best demonstrate the sensitivity of the method, a very low concentration range of 0–1 mg/L was selected, which is ideal for showcasing the ability of the method to detect even minimal amounts of polyelectrolytes. The absorbance scans obtained for the filtered and 10-fold diluted centrate samples are presented in Figure 3a,b relative to the original solution.
As the polymer dose increased, the measured absorbance values also increased, with the highest absorbance observed at a wavelength of 190 nm. Dissolved organic matter in the sludge solution generally tends to absorb UV light around 254 nm. However, measurements conducted at 190 nm indicated that the presence of organic matter in the sludge solution did not interfere with the polymer absorbance measurements [22,23,36].
Previous studies have shown that other pollutants do not interfere in the wavelength ranges we used in our study. Dissolved organic matter and polymers have different UV absorption spectra. Dissolved organic matter strongly absorbs UV light around 254 nm [23], which is unlikely to interfere with polymer absorbance measurements made at 190–205 nm. Aghamir Baha (2014) [36] clearly emphasized in the study that although an increase in the amount of dissolved organic matter in river water was observed, this did not affect the detection limit of the UV-Vis absorbance method. He stated that this was due to the fact that wavelengths such as 254 nm, where organic matter showed maximum absorbance, were outside the wavelength range used for polymer detection. Particles such as suspended solids and bacteria in the solution were removed by vacuum filtration. This is especially important for particles that cause turbidity and affect measurements by light scattering. The dilution rate was carefully determined to both reduce interference and keep the signal at a measurable level. Excessive dilution weakens the signal of the target analyte. Therefore, it will cause a decrease in sensitivity.
Figure 4a,b illustrate the absorbance spectra of Neu Floc 7331 and Zetag 8185 polymers at a concentration range of 0.1–1 mg/L in filtered centrate water samples.
The absorbance value of Zetag 8185 polymer at a 5 mg/L concentration (1.54 A.U.) was higher than the absorbance value of Neu Floc 7331 polymer (0.129 A.U.). It was shown that the chemical structures, functional groups, and structural features of the two polymers significantly affected their UV-Vis absorptions. However, the operating conditions of the device were insufficient to fully define the spectral differences. If it is studied in conjunction with other methods such as IR, mass, NMR, and elemental analysis, the identification of the polymers will be easier. The molecular structure of Zetag 8185 polymer showed stronger light absorption properties. The amount of adsorption depends on the polymer’s molecular weight. Holmberg et al. (2002) confirmed that a high molecular weight polymer showed greater adsorption than lower molecular weight polymers [37]. Additionally, at very low polymer concentrations, i.e., when sufficient surface area is available for all polymers, this results in very strong adsorption [36]. This situation was also observed in our study. In the low concentration range of 0.05–1 mg/L, the absorbance spectrum for Neu Floc 7331 polymer was found to be 0.082 A.U. higher than that of Zetag 8185 polymer.
In the filtered and diluted (10-fold) centrate sample using Neu Floc 7331 polymer, the absorbance spectrum was found to be 0.171 A.U., while in the centrate sample using Zetag 8185 polymer, the absorbance spectrum was found to be 0.113 A.U. The molecular weight of polyelectrolytes and their concentration in solution are important factors affecting absorbance values. Low molecular weight polyelectrolytes can show significant absorbance values even in dilute solutions. This is due to the ionic and molecular interactions of polyelectrolytes in solution. It is thought that the low molecular weight Neu Floc 7331 polymer moves more freely in solution compared to the Zetag polymer, which causes the increase in absorbance values.

3.3. Determination of Detection Limits

The linear regression graphs for absorbance-concentration data of Neu Floc 7331 polymers prepared in pure water are shown in Figure 5a–c. Similarly, the linear regression graphs for absorbance-concentration data of Zetag 8185 polymers prepared in distilled water are presented in Figure 6a–c.
The increase in the concentration of different cationic polymers caused a linear increase in absorbance values. Calibration curves were constructed at wavelengths of 190 nm for the 0.1–1 mg/L concentration range, 205 nm for the 0.05–1 mg/L concentration range, and 203 nm for the 1–5 mg/L concentration range.
At varying concentrations, the conformation of the polymer in the solvent may change, which can result in different effects on absorbance at different wavelengths.
For the Neu Floc 7331 polymer, the wavelength for the 0.05–1 mg/L concentration range was determined to be 205 nm, whereas for the Zetag polymer, it was 200 nm. This difference may be attributed to variations in the molecular structures of the polymers.
For the Neu Floc 7331 polymer, the slope of the calibration curve prepared in the 1–5 mg/L concentration range was found to be 0.0181. This slope is the lowest among the three ranges, indicating that the rate of increase in absorbance slows down at higher concentrations.
For the Zetag 8185 polymer, the slope values in Figure 6a,b were 0.0221, while the slope of the calibration graph for the 1–5 mg/L concentration range was 0.0227. The similarity of slope values across different concentration ranges suggests that the concentration range has minimal impact on the slope. This implies that the Zetag polymer exhibits homogeneous behavior within this concentration range.
Further studies conducted over a broader concentration range or under varying experimental conditions could provide more detailed insights into the behavior of the Zetag polymer.
In Figure 6a, a very strong linear relationship is determined between absorbance and PE concentration. This is supported by an R2 value of 0.9856. The closer the R2 value is to 1, the better the model explains the data. In this case, it can be stated that the model explains 98.56% of the variability.
There is a positive correlation between absorbance and PE concentration, meaning that as the PE concentration increases, the absorbance value also increases. This is an expected result, as the amount of substance in the solution increases, so does the amount of light absorbed [38]. These results are only valid for the specified concentration range and experimental conditions. Results may vary under different concentrations or solution conditions. Measuring at a low wavelength, such as 200 nm, enhances the selectivity of the analysis by minimizing the influence of other substances in the solution. The obtained linear calibration curve can be used to determine unknown concentrations of Zetag 8185.
In Figure 6b,c, the calibration curve prepared for the 0.1–1 mg/L concentration range yielded an R2 value of 0.9897, while for the 1–5 mg/L range, the R2 value was 0.9992 (Table 2). These results indicate that the model explains nearly all the variability within these ranges. The high regression values obtained in our research reveal the applicability of the analysis method.
Given the consistently high R2 values obtained across all concentration ranges, it can be concluded that the model effectively captures the relationship between the absorbance and concentration of Zetag 8185 polymer.
The difference in the slopes of the two lines indicates that the molar absorptivity coefficients (ε) of the polymers are different. The molar absorptivity coefficient (ε) is a constant that expresses how strongly a substance absorbs light [33,38].
The Beer-Lambert law establishes a relationship between absorbance (A), concentration (C), and the molar absorptivity coefficient (ε), given by the equation:
A = ε × C × b
where:
  • A: Absorbance,
  • Ε: Molar absorptivity coefficient (L·mol−1·cm−1),
  • C: Concentration (mol·L−1),
  • b: Path length of the cuvette (cm).
Relationship Between Slope and ε: As evident from the equation above, the slope (A/C) is directly related to the molar absorptivity coefficient (ε). In fact, the slope of the line is equal to the molar absorptivity coefficient (slope = ε), provided that the path length of the cuvette (b) is 1 cm. This relationship allows the molar absorptivity coefficient to be determined directly from the slope of the calibration curve under these conditions, further emphasizing the significance of linear regression in spectrophotometric analyses.
Different slopes indicate that different substances, or the same substance under varying experimental conditions, exhibit distinct behaviors. In this study, a strong linear relationship was determined between absorbance values and concentrations for both investigated polymers. This suggests that the quantity of both polymers can be effectively determined using spectrophotometric methods.
The slope of the calibration curves is directly related to the molar absorptivity coefficient. The larger the slope, the more strongly the substance absorbs light. In Figure 7b and Figure 8b, the samples were diluted at a 1:10 ratio. Consequently, the slopes are lower compared to Figure 7a and Figure 8a, as the same amount of polymer in the diluted solution produces less absorbance.
Factors such as dilution and matrix effects should be considered for their impact on the slope and intercept. Table 3 provides the linear regression relation between filtered and diluted centrate samples obtained from different treatment plants.
When the relationship between absorbance values and polymer concentrations was examined, a linear relationship was observed for both filtered and diluted centrate samples. The R2 values at 190 nm were found to be 0.9963 and 0.9907 for the Neu Floc polymer and 0.9916 and 0.9922 for the Zetag polymer, respectively (Table 3). These results indicate that the method can be applied to centrate samples even after vacuum filtration and dilution processes.
The relationship with absorbance spectra and polymer concentrations was confirmed by a high correlation coefficient (R2 > 0.99) for 1:10 diluted centrate samples. Especially in applications requiring accuracy in environmental analyses (such as determining polymer concentration in wastewater), a high R2 indicates that the method is valid and reliable. Since the predictive power of the model is high, measurement and analysis processes become more reliable. Gibbons and Örmeci showed that if the R2 value is >0.98, the method can also be used successfully in concentrated samples after filtration and dilution [23]. It has been shown that the UV-VIS spectrophotometric method is compatible with different sample preparation techniques (filtration and dilution). Similarly, in this study, an [R2 ≥ 99] value was obtained, and it was concluded that the method is suitable for measuring polyelectrolyte concentrations in different matrices.
The absorbance-concentration data obtained in this study, as presented in Table 4 and Table 5, were used to calculate the method detection limit (MDL) values of the polymers.
When the initial sample was both filtered and diluted 10-fold, and the standard addition method was applied by adding different volumes of the polyelectrolyte standard solution, the detection limit was determined to be 0.13 mg/L.
When the sample was only filtered, taken in a specific volume, and subjected to the standard addition method by adding different volumes of the polyelectrolyte solution, with the total sample volume adjusted to match that of pure water, the detection limit in the diluted centrate sample decreased to 0.085 mg/L.
Since the detection limit obtained with Neu Floc 7331 polymer in the centrate sample with low pollution load in the influent raw water was 0.085 mg/L, the detection limit obtained with Zetag 8185 polymer in the centrate sample with high pollution load was lower than 0.12 mg/L, the method was able to determine Neu Floc 7331 even at lower concentrations. It was shown that the analytical method was more sensitive for Neu Floc 7331. The low MDL provides an advantage in terms of being able to determine the presence of these substances in the environment even at very low levels. However, if it is desired to reach lower environmental limit values, different analysis methods or increasing the sensitivity of the device may be required.
When the safety data sheet toxicity data of two polymer types are examined; LC50 (96 h)/Zebra Fish (Branchydanio rerio) for Neu Floc 7331 polymer is >100 mg/L. The value of 100 mg/L indicates that this polymer is not acutely toxic to zebrafish or at least does not have a significant lethal effect below 100 mg/L. EC50 (48 h)/Daphnia magna (Water flea) is >100 mg/L. IC50 (72 h)/Green Algae (Selenastrum capricornutum) is >100 mg/L.
As a result of the analyses, the method detection limit (MDL) determined for Neu Floc 7331 was found to be 0.085 mg/L. This value expresses the lowest concentration that can be detected by the method. According to literature data, acute toxicity values of Neu Floc 7331 were evaluated on zebrafish (B. rerio), water fleas (D. magna) and green algae (S. capricornutum) in accordance with OECD 203, 202, and 201 test guidelines and LC50, EC50, and IC50 values were determined as >100 mg/L in all three organisms. These results show that Neu Floc 7331 has a low acute toxicity potential for the tested organisms. However, further studies are required for long-term effects and bioaccumulation potential.
The method detection limit (MDL) for Zetag 8185 polymer was determined to be 0.12 mg/L. According to toxicity data in the literature, the LC50 value of this polymer on fish is between 1–10 mg/L, and the EC50 value on Daphnia magna is between 10–100 mg/L. These values indicate that Zetag 8185 polymer may be moderately toxic to aquatic organisms. The LC50 value of the adipic acid component it contains is 97–1000 mg/L for fish and 85.6 mg/L for Daphnia magna, which has low to moderate toxicity. The lowest MDL value obtained (0.12 mg/L) ensures that Zetag 8185 polymer can be detected even at very low concentrations in the aquatic environment. This shows that an analytical method with sufficient sensitivity is used to monitor the potential environmental effects of the polymer. For example, if the toxic effect on fish starts at 1 mg/L, the fact that we can measure even at 0.12 mg/L with the UV-Vis spectrophotometer method provides the advantage of early detection of levels approaching toxicity. However, if environmental regulations set a lower limit (such as 0.05 mg/L), the method may need to be improved, or a more sensitive technique may need to be used.
The matrix of the sample (its other components) can also influence the detection limit. The filtration process may have altered the sample matrix, thereby lowering the detection limit. Detection limits in centrate at 190 nm ranged between 0.12 and 0.13 mg/L after a 1:10 dilution. The dilution ratio was carefully determined to both minimize the interference and keep the signal at a measurable level. Because too much dilution will weaken the signal of the target analyte. Therefore, it will cause a decrease in sensitivity.
The dilution process reduces the concentration of the analyte (the substance to be measured), which weakens the signal produced by the analytical instrument. A weaker signal makes it harder to detect the analyte at lower concentrations. This limits the instrument’s ability to detect the analyte at very low concentrations, thus increasing the detection limit.
It is known that the detection limits determined for different polymers vary due to structural differences in polymers. Therefore, the detection limit must be determined separately for each polymer [25,26].

4. Conclusions

The concentrations of two different cationic polymers in sludge centrate samples provided by wastewater treatment plants were successfully determined using UV-Vis spectroscopy, which provided the optimal absorbance values at 190 nm. In this study, a linear relationship was observed between polymer concentrations in the ranges of 0.05–1 mg/L, 0.1–1 mg/L, and 1–5 mg/L and their corresponding absorbance values.
The precision of the method was particularly notable at low polymer concentrations. The lowest detection limit for Neu Floc 7331 in distilled water was determined to be 0.05 mg/L, although this value may vary for different polymers. For the Zetag polymer, the MDL in distilled water at 200 nm was determined to be 0.15 mg/L, highlighting the variability of detection limits across different polymers.
It was observed that there was a strong linear relationship between the absorbance values and concentrations of the two polymers used in this study. This result demonstrates that the method is reliable and practical for polymer analysis, particularly for concentrations above 5 mg/L. However, for concentrations below 1 mg/L, we do not recommend using this method due to its sensitivity to external factors in this range. Since different polymer types show different absorbance spectra, it is necessary to determine the calibration curve for each polymer separately to obtain accurate results.
The detection limit (MDL) for Zetag 8185 polymer was determined to be 0.12 mg/L. This value shows that the method can detect the polymer even at low levels. When compared to the toxicity values reported in the literature, it is seen that the obtained MDL provides sufficient sensitivity to monitor concentrations that pose a potential risk to aquatic ecosystems. The method detection limit (MDL) of the method used for the Neu Floc 7331 polymer in the centrate sample was determined to be 0.085 mg/L. The obtained detection limit shows that NEU FLOC 7331 polymer can be monitored with sufficient sensitivity in terms of environmental monitoring and that effective monitoring can be done even at very low concentrations and indicates that the polymer can be effectively monitored in wastewater treatment processes and environmental examinations. However, when centrate waters are given to the inlet water of wastewater treatment plants, there is a possibility that they will pass into the receiving environment in trace amounts well below the toxic effect limit on living beings as a result of very high dilution and treatment processes. It is thought that further studies should be conducted to fully evaluate the long-term effects of this polymer on the environment. In parallel with the UV-Vis spectrophotometric analysis method we used here, it is also recommended to develop new analysis methods. Our new studies on this subject continue.

Author Contributions

The research was carried out by A.Ö. during her doctorate. Y.N. is the supervisor of the doctoral thesis. All authors have read and agreed to the published version of the manuscript.

Funding

This research was supported by Yıldız Technical University, Department of Environmental Engineering.

Data Availability Statement

Permission was obtained from “The Istanbul Metropolitan Municipality, İSKİ General Directorate, Water and Wastewater Technologies Department” for the data we used in the article.

Acknowledgments

The authors would like to thank the Istanbul Metropolitan Municipality, İSKİ General Directorate, Water and Wastewater Technologies Department for providing these wastewater samples and research opportunities.

Conflicts of Interest

The authors declare no conflicts of interest.

References

  1. Mortimer, D.A. Synthetic polyelectrolytes-A review. Polym. Int. 1991, 25, 29–41. [Google Scholar] [CrossRef]
  2. Thomas, W.M. Acrylamide polymers. Encycl. Polym. Sci. Technol. 1964, 1, 177–197. [Google Scholar]
  3. Koetz, J.; Kosmella, S. Polyelectrolytes and Nanoparticles; Springer: Berlin/Heidelberg, Germany, 2007; ISBN 978-3-540-46381-8. [Google Scholar]
  4. Rabiee, A.; Ershad-Langroudi, A.; Zeynali, M.E. A survey on cationic polyelectrolytes and their applications: Acrylamide derivatives. Rev. Chem. Eng. 2015, 31, 239–261. [Google Scholar] [CrossRef]
  5. Bolto, B.A. Soluble polymers in water purification. Prog. Polym. Sci. 1995, 20, 987–1041. [Google Scholar] [CrossRef]
  6. Glover, S.M.; Yan, Y.D.; Jameson, G.J.; Biggs, S. Dewatering properties of dual-polymer flocculated systems. Int. J. Miner. Process. 2004, 73, 145–160. [Google Scholar] [CrossRef]
  7. Goodrich, M.S.; Dulak, L.H.; Friedman, M.A.; ve Lech, J.J. Acute and long-term toxicity of water-soluble cationic polymers to rainbow-trout (Oncorhynchus mykiss) and the modification of toxicity by humic-acid. Environ. Toxicol. Chem. 1991, 10, 509–515. [Google Scholar] [CrossRef]
  8. Almomani, F.; Örmeci, B. Measurement of polyacrylamide polymers in water and wastewater using an in-line UV–VIS spectrophotometer. J. Environ. Chem. Eng. 2014, 2, 765–772. [Google Scholar] [CrossRef]
  9. Letterman, R.D.; Pero, R.W. Contaminants in polyelectrolytes used in water-treatment. J. Am. Water Works Assoc. 1990, 82, 87–97. [Google Scholar] [CrossRef]
  10. Hamilton, J.D.; Reinert, K.H.; Freeman, M.B. Aquatic risk assessment of polymers. Environ. Sci. Technol. 1994, 28, 187A–192A. [Google Scholar] [CrossRef]
  11. Biesinger, K.E.; Stokes, G.N. Effects of synthetic polyelectrolytes on selected aquatic organisms. Water Pollut. Control Fed. J. 1986, 58, 207–213. [Google Scholar]
  12. Timofeeva, S.S.; Beim, A.M.; Beim, A.A. Ecologo-technological principles of the choice of flocculants for wastewater purification from clay suspensions. Khim. Teknol. Vody 1994, 16, 72–76. [Google Scholar]
  13. Biesinger, K.E.; Lemke, A.E.; Smith, W.E.; Robert, M.T. Comparative toxicity of polyelectrolytes to selected aquatic animals. Water Pollut. Control Fed. 1976, 48, 183–187. [Google Scholar]
  14. Wee, V.T. Determination of Cationic Surfactants in Waste- and River Waters. Water Res. 1984, 18, 223–225. [Google Scholar] [CrossRef]
  15. Becker, N.S.C.; Bennett, D.M.; Bolto, B.A.; Dixon, D.R.; Eldridge, R.J.; Le, N.P.; Rye, C.S. Detection of Polyelectrolytes at Trace Levels in Water by Fluorescent Tagging. React. Funct. Polym. 2004, 60, 183–193. [Google Scholar] [CrossRef]
  16. Tsubouchi, M.; Mitsushio, H.; Yamasaki, N. Determination of Cationic Surfactants by Two-Phase Titration. Anal. Chem. 1981, 53, 1957–1959. [Google Scholar] [CrossRef]
  17. Hanasaki, T.; Ohnishi, H.; Nikaidoh, A.; Tanata, S.; Kawasaki, K. Determination of Trace Polymer in Waste Water. Bull. Environ. Contam. Toxicol. 1985, 35, 476–481. [Google Scholar] [CrossRef]
  18. Majam, M.; Thompson, P.A. Polyelectrolyte determination in drinking water. Water SA 2006, 32, 705–707. [Google Scholar] [CrossRef]
  19. Parazak, D.P.; Burkhardt, C.W.; McCarthy, K.J. Determination of Low Levels of Cationic Polyelectrolytes in Water. Anal. Chem. 1987, 59, 1444–1445. [Google Scholar] [CrossRef]
  20. Masadome, T. Flow Injection Spectrophotometric Determination of Anionic Polyelectrolytes Using the Cationic Dyes. Anal. Lett. 2001, 34, 2711–2719. [Google Scholar] [CrossRef]
  21. Scoggins, M.W.; Miller, J.W. Determination of Water-Soluble Polymers Containing Primary Amide Groups Using the Starch-Triiodide Method. Soc. Pet. Eng. J. 1979, 19, 151–154. [Google Scholar] [CrossRef]
  22. Almomani, F.; Örmeci, B. Optimization of Polymer Dose Based on Residual Polymer Concentration in Dewatering Supernatant. Water Air Soil Pollut. 2014, 225, 2154. [Google Scholar]
  23. Gibbons, M.K.; Ormeci, B. Quantification of polymer concentration in water using UV–vis spectroscopy. J. Water Supply: Res. Technol.–AQUA 2013, 62, 205–213. [Google Scholar] [CrossRef]
  24. Cormier, R. UV-VIS Spectroscopy as a Tool for the Detection of Residual Polymer and Optimization of Polymer Dose in Drinking Water Treatment Applications. Master of Applied Science; Master’s Thesis, Carleton University, Ottawa, ON, Canada, 2019. [Google Scholar]
  25. Salam, M.A.; Örmeci, B.; Paul, S. Determination of the optimum polymer dose for dewatering of oil sands tailings using UV-vis spectrophotometry. J. Pet. Sci. Eng. 2016, 147, 68–76. [Google Scholar] [CrossRef]
  26. Carreres-Prieto, D.; García, J.T.; Cerdán-Cartagena, F.; Suardiaz-Muro, J. Wastewater quality estimation through spectrophotometry-based statistical models. Sensors 2020, 20, 5631. [Google Scholar] [CrossRef] [PubMed]
  27. Alves, E.M.; Rodrigues, R.J.; Corrêa, C.D.S.; Fidemann, T.; Rocha, J.C.; Buzzo, J.L.L.; de Oliva Neto, P.; Núñez, E.G.F. Use of ultraviolet–visible spectrophotometry associated with artificial neural networks as an alternative for determining the water quality index. Environ. Monit. Assess. 2018, 190, 319. [Google Scholar] [CrossRef] [PubMed]
  28. Carré, E.; Pérot, J.; Jauzein, V.; Lin, L.; Lopez-Ferber, M. Estimation of water quality by UV/Vis spectrometry in the framework of treated wastewater reuse. Water Sci. Technol. 2017, 76, 633–641. [Google Scholar] [CrossRef]
  29. Wu, X.; Tong, R.; Wang, Y.; Mei, C.; Li, Q. Study on an online detection method for ground water quality and instrument design. Sensors 2019, 19, 2153. [Google Scholar] [CrossRef]
  30. Guo, Y.; Liu, C.; Ye, R.; Duan, Q. Advances on water quality detection by UV-Vis spectroscopy. Appl. Sci. 2020, 10, 6874. [Google Scholar] [CrossRef]
  31. Shi, Z.; Chow, C.W.; Fabris, R.; Liu, J.; Jin, B. Applications of online UV-Vis spectrophotometer for drinking water quality monitoring and process control: A review. Sensors 2022, 22, 2987. [Google Scholar] [CrossRef]
  32. Thünemann, A.F.; Müller, M.; Dautzenberg, H.; Joanny, J.F.; Löwen, H. Polyelectrolyte complexes. In Polyelectrolytes with Defined Molecular Architecture II; Schmidt, M., Ed.; Springer: Berlin/Heidelberg, Germany, 2004; Volume 166, pp. 113–171. [Google Scholar]
  33. Skoog, D.; West, D.; Holler, F.; Crouch, S.R. Fundamentals of Analytical Chemistry; Saunders College Pub: Fort Worth, TX, USA, 2014; ISBN 13: 978-0495558286. [Google Scholar]
  34. Skoog, D.A.; Holler, J.F.; Crouch, S.R. Principles of Instrumental Analysis, 7th ed.; New Jersey Institute of Technology: Newark, NJ, USA, 2017; p. 74. ISBN 13978-1305577213. [Google Scholar]
  35. Gärdlund, L.; Wågberg, L.; Norgren, M. New insights into the structure of polyelectrolyte complexes. J. Colloid Interface Sci. 2007, 312, 237–246. [Google Scholar] [CrossRef]
  36. Aghamir-Baha, S. Measurement of Polymer Concentration and Optimization of Sludge Dewatering Using UV-VIS Spectroscopy. Master of Applied Science, Master’s Thesis, Institute of Civil and Environmental Engineering, Carleton University, Ottawa, ON, Canada, 2014. [Google Scholar]
  37. Holmberg, K.; Jönsson, B.; Kronberg, B.; Lindman, B. Surfactants and Polymers in Aqueous Solution; Wiley: Hoboken, NJ, USA, 2002; ISBN 9780471498834. [Google Scholar]
  38. Atkins, P.; de Paula, J. Physical Chemistry; W. H. Freeman and Company: New York, NY, USA, 2006; ISBN 0-7167-8759-8. [Google Scholar]
Figure 1. (a) Absorption spectra of Neu Floc 7331 polymer in distilled water (0.05–0.1 mg/L), (b) absorption spectra of Neu Floc 7331 polymer in distilled water (0.1–1 mg/L), (c) absorption spectra of Neu Floc 7331 polymer in distilled water (1–5 mg/L).
Water 17 00825 g001
Figure 2. (a) Absorption spectra of Zetag 8185 polymer in distilled water (0.05–0.1 mg/L), (b) absorption spectra of Zetag 8185 polymer in distilled water (0.1–1 mg/L), (c) absorption spectra of Zetag 8185 polymer in distilled water (1–5 mg/L).
Water 17 00825 g002
Figure 3. (a) Filtered and 10-fold diluted centrate for 0–1 mg/L Neu Floc 7331, (b) Filtered and 10-fold diluted centrate for 0–1 mg/L Zetag 8185.
Water 17 00825 g003
Figure 4. (a) Filtered centrate for 0–1 mg/L Neu Floc 7331, (b) Filtered centrate for 0–1 mg/L Zetag 8185.
Water 17 00825 g004
Figure 5. Linear regression of absorbance-concentration data for Neu Floc 7331 in distilled water: (a) 0.05–1 mg/L, (b) 0.1–1 mg/L, and (c) 1–5 mg/L.
Water 17 00825 g005
Figure 6. Linear regression of absorbance-concentration data for Zetag 8185 in distilled water: (a) 0.05–1 mg/L, (b) 0.1–1 mg/L, and (c) 1–5 mg/L.
Water 17 00825 g006
Figure 7. (a) Linear regression relation between absorbance-concentration data for Neu Floc 7331 (0–1 mg/L) in filtered centrate, (b) Linear regression of absorbance-concentration data for Neu Floc 7331 (0–1 mg/L) in filtered and 10-fold diluted centrate.
Water 17 00825 g007
Figure 8. (a) Linear regression relation between absorbance-concentration data for Zetag 8185 (0–1 mg/L) in filtered centrate, (b) Linear regression of absorbance-concentration data for Zetag 8185 (0–1 mg/L) in filtered and 10-fold diluted centrate.
Water 17 00825 g008
Table 1. Properties of cationic polymers.
Polymer NameCationic ChargeMolecular WeightPhysical State
Zetag™ 8185HighVery HighPowder
Neu Floc 7331HighHighSolid, crystalline, powder
Table 2. Linear regression coefficients from calibration curves.
PolyelectrolytesConcentration Range (mg/L)R2Slope
NEU FLOC 73310.05–10.99840.037
0.1–10.94360.0195
1–50.9960.0181
ZETAG 81850.05–10.98560.0221
0.1–10.98970.0221
1–50.99920.0227
Table 3. Linear regression values for Neu Floc and Zetag polymers in filtered and diluted centrate samples from different treatment plants.
SamplesPolyelectrolytesConcentration Range (mg/L)R2Slope
Filtered CentrateNEU FLOC 73310–10.99630.0216
1:10 Diluted CentrateNEU FLOC 73310–10.99070.0209
Filtered CentrateZETAG 81850–10.99160.0265
1:10 Diluted CentrateZETAG 81850–10.99220.0178
Table 4. Detection limits for different polymers in distilled water at various wavelengths.
PolyelectrolytesDilutionDetection Limits (mg/L)
Distilled water 190 nm203205
NEU FLOC 733100.350.340.05
Distilled water 200 nm202 nm
ZETAG 818500.150.16
Table 5. Detection limits for different polymers in centrate samples at the 190 nm wavelength.
CentratePolyelectrolytesDilutionDetection Limits (mg/L)
NEU FLOC 73311:100.13
NEU FLOC 7331-0.085
ZETAG 81851:100.12
ZETAG 8185-0.13
Disclaimer/Publisher’s Note: The statements, opinions and data contained in all publications are solely those of the individual author(s) and contributor(s) and not of MDPI and/or the editor(s). MDPI and/or the editor(s) disclaim responsibility for any injury to people or property resulting from any ideas, methods, instructions or products referred to in the content.

