
The Spatiotemporal Evolution Characteristics of the Water Use Structure in Shandong Province, Northern China, Based on the Gini Coefficient


Abstract
1. Introduction
2. Materials and Methods
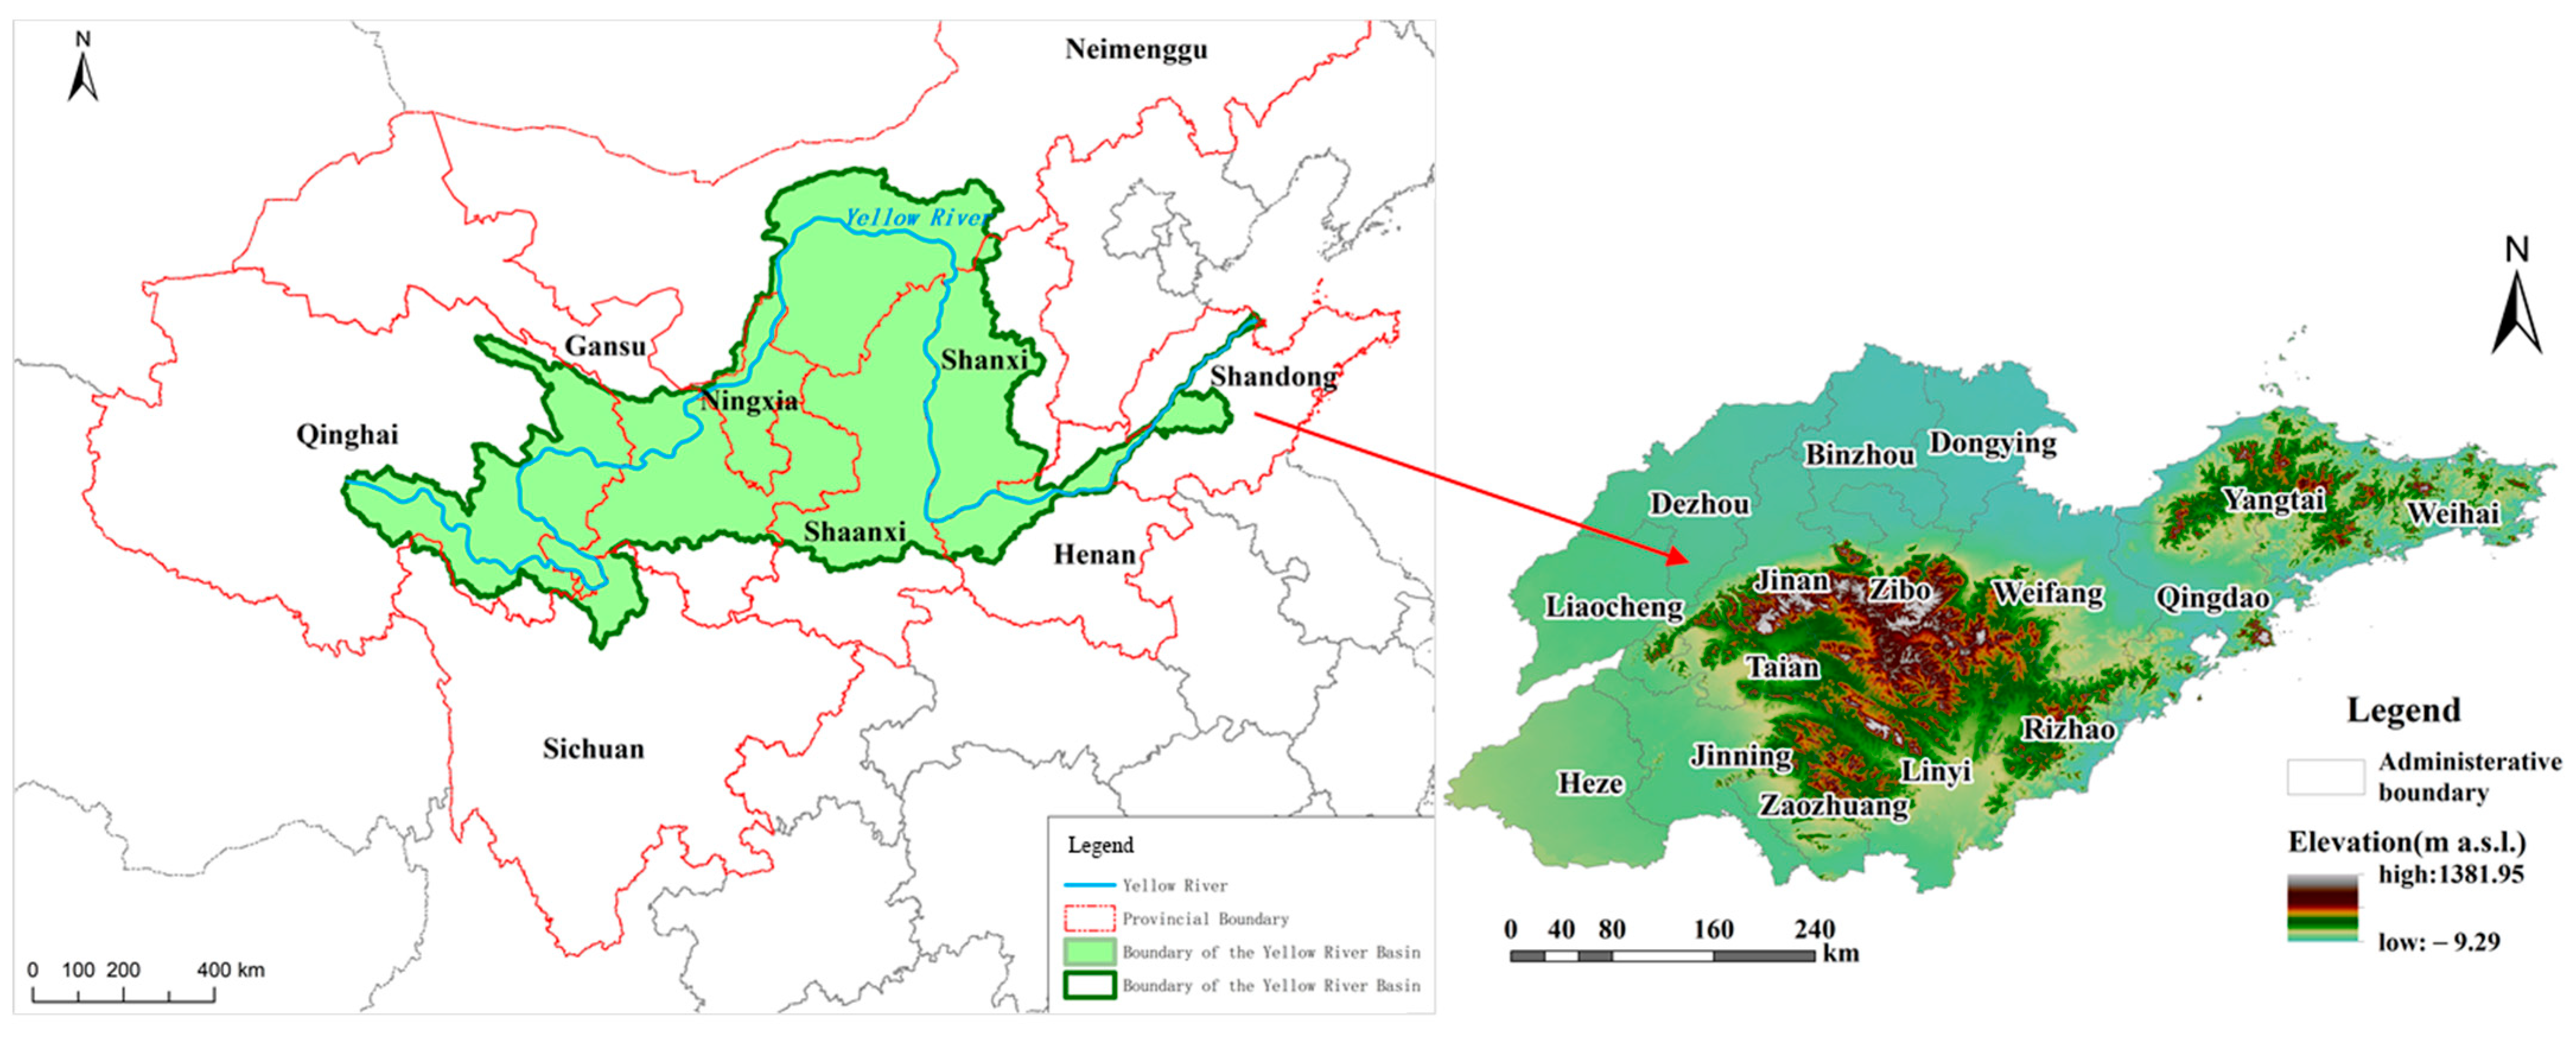
2.1. Study Area and Data
2.2. Methods
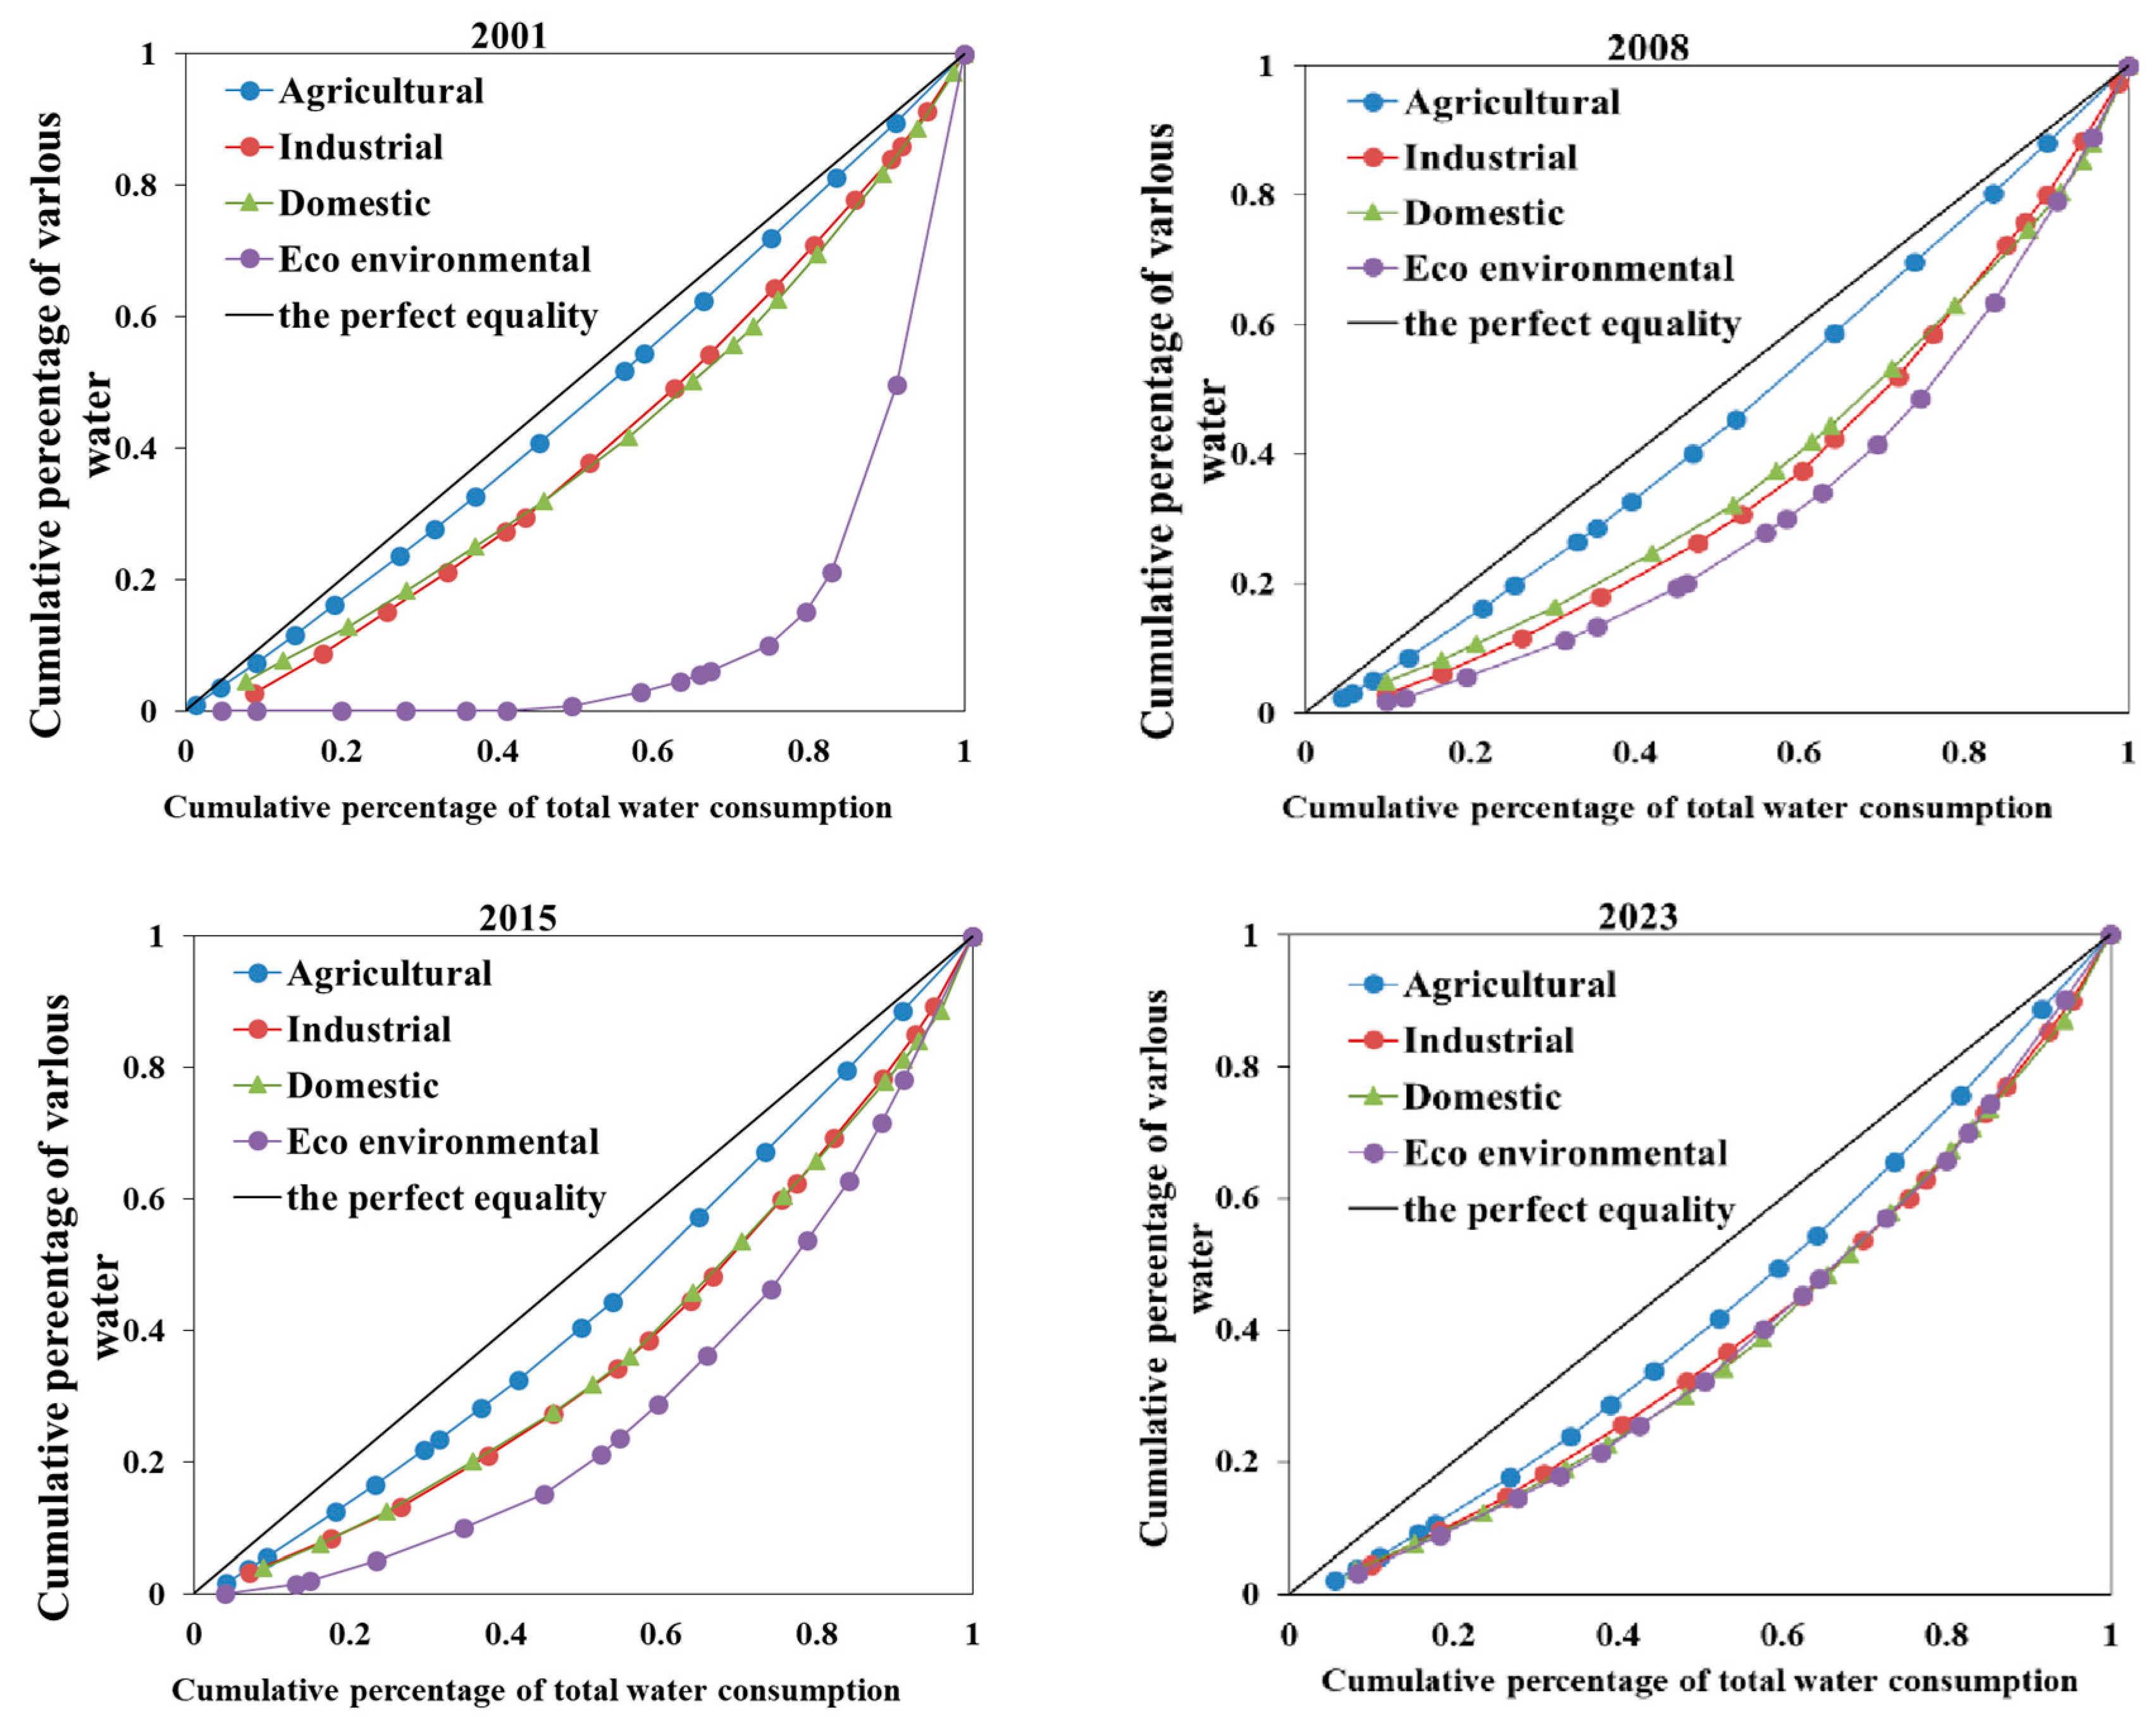
2.2.1. The Lorenz Curve
2.2.2. Gini Coefficient
2.2.3. Mann–Kendall Trend Test
2.2.4. Clustering Analysis
2.2.5. Data Processing
3. Results
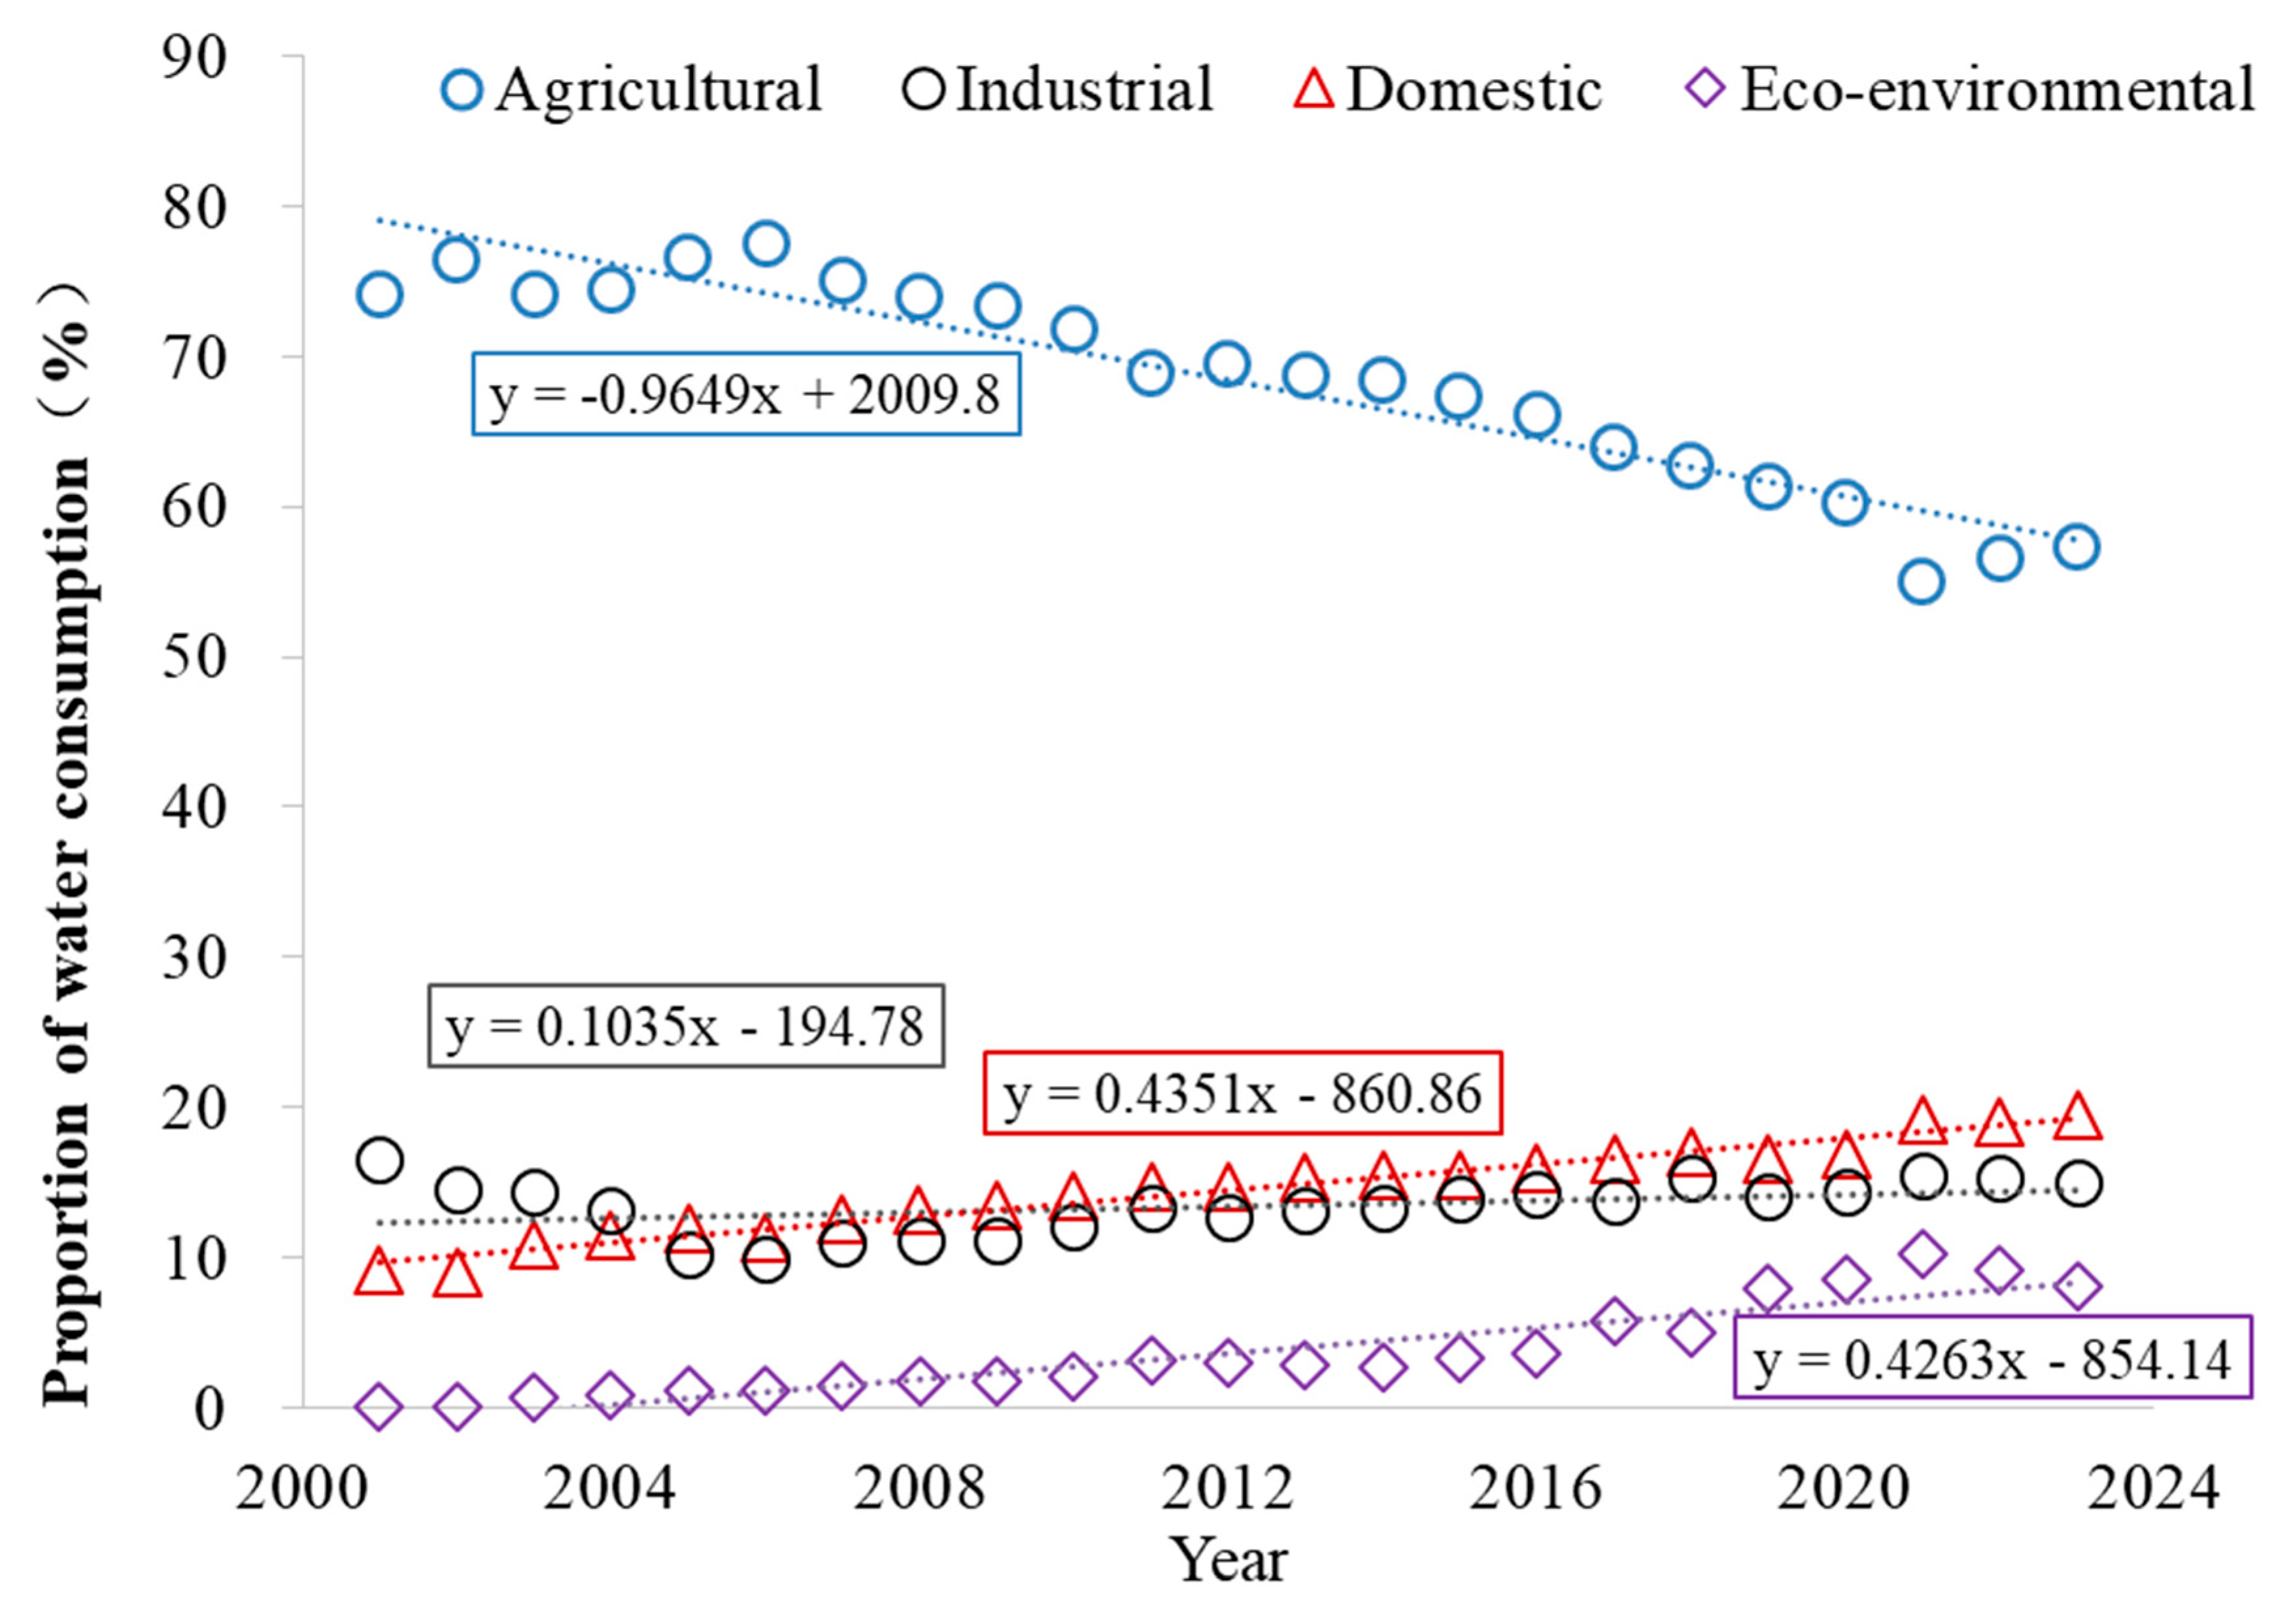
3.1. Statistical Characteristics of Water Use Structure
3.2. Spatial Distribution Characteristics of Water Use Structure
3.3. Variation Characteristics of Water Use Structure
3.4. Evolution Characteristics of Water Use Structure
4. Discussion
5. Conclusions
- (1)
- From 2001 to 2023, Shandong’s water use structure progressively improved, demonstrating more rational and comprehensive water resource utilization. As a major agricultural province, Shandong maintained the highest proportion of agricultural water use, followed by industrial and domestic water, with ecological–environmental water being the smallest. With advancing economic and technological development, all water use categories showed positive changes, particularly in agricultural and ecological water proportions, while industrial and domestic water use exhibited smaller but consistent increases.
- (2)
- Agricultural water use maintained absolute spatial equality (Gini coefficient < 0.2), showing minimal regional disparities. Industrial and domestic water use exhibited fluctuating but stable Gini coefficients (0.2–0.3), indicating relative spatial equality. Ecological water use demonstrated significant improvement, transitioning from “significant disparity” (Gini > 0.4) to “reasonable distribution,” though further optimization remains possible.
- (3)
- Clear regional variations existed among Shandong: the western regions (e.g., Dezhou, Heze) showed high agricultural water use but low industrial/domestic proportions; central areas (e.g., Zibo) had the highest industrial water use; and the eastern zones (e.g., Qingdao, Yantai) exhibited lower agricultural but higher industrial/domestic water shares. All regions increased ecological water use to varying degrees, with the overall spatial equilibrium remaining stable across the province.
- (4)
- With the advancement of the national strategy for ecological protection and high-quality development in the Yellow River Basin, ensuring ecological–environmental water supply will become a key priority for optimizing the water use structure in Shandong Province in the coming period. These findings underscore the need for differentiated water management policies aligned with regional characteristics to support sustainable development in the Yellow River Basin.
Author Contributions
Funding
Data Availability Statement
Acknowledgments
Conflicts of Interest
References
- Wu, H.; Wang, X.; Shahid, S.; Ye, M. Changing Characteristics of the Water Consumption Structure in Nanjing City, Southern China. Water 2016, 8, 314. [Google Scholar] [CrossRef]
- Yue, C.; Nan, T.; Qian, Y.; Liu, F.; Guo, C.Y.; Zhen, S.J. Using Niche Model to Analyze Water Consumption Structure in Jinan City, Shandong. Water 2024, 16, 549. [Google Scholar] [CrossRef]
- Bai, P.; Liu, C.M. Evolution law and attribution analysis of water utilization structure in Beijing. South North Water Transf. Water Sci. Technol. 2018, 16, 1–9. [Google Scholar]
- Yi, J.J.; Chen, Z.C.; Yang, C.P.; Li, Y.Q. Analysis of Spatiotemporal Characteristics of Regional Water Utilization Structure Based on Information Entropy. J. China Hydrol. 2019, 39, 2–17. [Google Scholar]
- Jiao, S.X.; Li, Q.Y.; Wang, A.Z.; Liu, Y.Q.; Yin, Y.X.; Zhao, R.Q.; Zhang, J.W. Dynamic evolution analysis of water consumption structure and industrial structure based on niche in Anyang City. Water Resour. Prot. 2021, 37, 79–85. [Google Scholar]
- Hou, L.X.; Wen, L.; Zhang, X.F.; Wang, L.X.; Zhao, J.; Du, F.L. Quantification of water footprint and analysis of water resources evaluation in Inner Mongolia. J. China Agric. Univ. 2021, 8, 182–195. [Google Scholar]
- Xu, W.L.; Zhou, W.H.; Zhang, J.; Zheng, X.J.; Jin, H. Analysis on Temporal Inhomogenenity of Runoff in Tumen River Mainstream Based on Lorenz Curve. Bull. Soil Water Conserv. 2015, 35, 128–132. [Google Scholar]
- Sueyoshi, T.; Qu, J.J.; Li, A.J.; Liu, X.H. A new approach for evaluating technology inequality and diffusion barriers: The concept of efficiency Gini coefficient and its application in Chinese provinces. Energy 2021, 235, 121256. [Google Scholar] [CrossRef]
- Hu, Z.N.; Chen, Y.Z.; Yao, L.M.; Wei, C.T.; Li, C.Z. Optimal allocation of regional water resources: From a perspective of equity-efficiency trade off. Resour. Conserv. Recycl. 2016, 109, 102–113. [Google Scholar] [CrossRef]
- Zhou, Y.Y.; Zhou, G.F.; Huang, Q.F.; Yue, L. A Study on Distribution of Production, Living and Ecological Space in Karst Areas Based on Lorenz Curves and Land Use Transitions. Bull. Soil Water Conserv. 2020, 40, 297–304. [Google Scholar]
- Wu, X.; Tao, T.; Wu, R.Z.; Wang, X.L. Analysis on the Characteristics of Temporal and Spatial Dynamic Evolution of Water Use Structure in Area of Northern China. Sci. Technol. Eng. 2021, 21, 11768–11775. [Google Scholar]
- Chen, L.; Yang, Y.K.; Liu, Y.; Wang, T.Y.; Jiao, Y.W. Analysis of Water Consumption Structure in Gansu Province Based on Lorentz Curve. J. Chang. River Sci. Res. Inst. 2021, 38, 25–33. [Google Scholar]
- Dong, Z.F.; Qu, A.Y.; Ji, Y.Q. On ecological environment protection of lower reaches of Yellow River with high-quality development strategy. Sci. Technol. Rev. 2020, 38, 109–115. [Google Scholar]
- Zhao, Q.; Liu, X.M.; Gao, Q.; Xiong, D.; Zou, C.H. Evaluation of water resources carrying capacity in Shandong province based on fuzzy comprehensive evaluation. Ecol. Sci. 2018, 4, 188–194. [Google Scholar] [CrossRef]
- Jiang, D.J.; Li, L.J. Analysis of water use efficiency and its dynamics in Shandong Province during 2011–2020. J. Water Resour. Water Eng. 2023, 34, 10–18. [Google Scholar]
- Lorenz, M.O. Methods of Measuring the Concentration of Wealth. Publ. Am. Stat. Assoc. 1905, 9, 209–219. [Google Scholar] [CrossRef]
- Kendall, M.G. Rank Correlation Methods; Charles Griffin: London, UK, 1975. [Google Scholar]
- Chorley, R.J.; Haggett, P. Trend-Surface Mapping in Geographical Research. Trans. Inst. Br. Geogr. 1965, 37, 47–67. [Google Scholar] [CrossRef]
- Barrett, C.R.; Salles, M. On a Generalisation of the Gini Coefficient. Math. Soc. Sci. 1995, 30, 235–244. [Google Scholar] [CrossRef]
- Mann, H.B. Non parametric tests against trend. Econometrica 1945, 13, 245–259. [Google Scholar] [CrossRef]
- Zhao, Y.X.; Li, Y.B.; Zhang, H.T.; Wang, S.X. Study on Zoning for Water Resources Development and Utilization Based on Cluster Analysis. Water Resour. Power 2022, 11, 40–44. [Google Scholar]
- Ba, W.X.; Wang, D.J.; Gong, B.H.; Dai, Y.H.; Yang, Z.P.; Liu, Z.F. Urban water scarcity in China: A systematic review of research advances and future directions. Appl. Geogr. 2023, 159, 103069. [Google Scholar] [CrossRef]
- Rockström, J.; Steffen, W.; Noone, K.; Persson, Å.; Chapin, F.S.; Lambin, E.F.; Lenton, T.M.; Scheffer, M.; Folke, C.; Schellnhuber, H.J.; et al. A safe operating space for humanity. Nature 2009, 461, 472–475. [Google Scholar] [CrossRef] [PubMed]
- Grafton, R.Q.; Pittock, J.; Davis, R.; Williams, J.; Fu, G.; Warburton, M.; Udall, B.; McKenzie, R.; Yu, X.; Che, N.; et al. Global insights into water resources, climate change and governance. Nat. Clim. Chang. 2013, 3, 315–321. [Google Scholar] [CrossRef]
- Annisa, C.N.; Purwanti, E.; Sardjono, M.A. Water sustainability in the Anthropocene: Challenges and solutions for a changing world. IOP Conf. Ser. Earth Environ. Sci. 2023, 1282, 012013. [Google Scholar] [CrossRef]
- Wang, Y.Q.; Li, S.; Kong, K.; Xu, J. Evolution Characteristics and Influencing Factors of Water Use System Structure in Shandong Province Analyzed on the Basis of Improved Entropy. J. Univ. Jinan (Sci. Technol.) 2023, 37, 401–407+420. [Google Scholar]


| Gini Coefficient | 0 < G < 0.2 | 0.2 ≤ G < 0.3 | 0.3 ≤ G < 0.4 | 0.4 ≤ G < 0.5 | ≥0.5 |
|---|---|---|---|---|---|
| Evaluation result | Absolute equality | Relative equality | Relatively reasonable | Significant disparity | Extreme disparity |
| Proportion of Water Consumption | Minimum (%) | Maximum (%) | Average (%) | CV (%) | Skewness | Kurtosis |
|---|---|---|---|---|---|---|
| Agricultural | 37.87 | 83.64 | 64.51 | 19.84 | −0.17 | −0.43 |
| Industrial | 6.51 | 25.83 | 15.49 | 37.65 | 0.16 | −1.04 |
| Domestic | 7.01 | 36.28 | 16.45 | 45.40 | 1.11 | 2.14 |
| Ecological | 1.06 | 6.65 | 3.57 | 45.51 | 0.02 | −0.80 |
| Year | Agricultural | Result | Industrial | Result | Domestic | Result | Ecological | Result |
|---|---|---|---|---|---|---|---|---|
| 2001 | 0.06 | absolute equality | 0.20 | relative equality | 0.20 | absolute equality | 0.76 | significant disparity |
| 2002 | 0.06 | absolute equality | 0.19 | relative equality | 0.25 | relative equality | 0.77 | significant disparity |
| 2003 | 0.07 | absolute equality | 0.23 | relative equality | 0.23 | relative equality | 0.39 | relatively reasonable |
| 2004 | 0.07 | absolute equality | 0.22 | relative equality | 0.19 | absolute equality | 0.40 | relatively reasonable |
| 2005 | 0.08 | absolute equality | 0.29 | relative equality | 0.23 | relative equality | 0.48 | significant disparity |
| 2006 | 0.08 | absolute equality | 0.31 | relatively reasonable | 0.24 | relative equality | 0.41 | significant disparity |
| 2007 | 0.08 | absolute equality | 0.30 | relative equality | 0.25 | relative equality | 0.39 | relatively reasonable |
| 2008 | 0.09 | absolute equality | 0.29 | relative equality | 0.27 | relative equality | 0.37 | relatively reasonable |
| 2009 | 0.09 | absolute equality | 0.28 | relative equality | 0.26 | relative equality | 0.37 | relatively reasonable |
| 2010 | 0.09 | absolute equality | 0.24 | relative equality | 0.26 | relative equality | 0.35 | relatively reasonable |
| 2011 | 0.10 | absolute equality | 0.23 | relative equality | 0.24 | relative equality | 0.45 | significant disparity |
| 2012 | 0.10 | absolute equality | 0.22 | relative equality | 0.26 | relative equality | 0.39 | relatively reasonable |
| 2013 | 0.10 | absolute equality | 0.23 | relative equality | 0.25 | relative equality | 0.35 | relatively reasonable |
| 2014 | 0.10 | absolute equality | 0.23 | relative equality | 0.25 | relative equality | 0.37 | relatively reasonable |
| 2015 | 0.12 | absolute equality | 0.26 | relative equality | 0.26 | relative equality | 0.41 | significant disparity |
| 2016 | 0.13 | absolute equality | 0.26 | relative equality | 0.26 | relative equality | 0.44 | significant disparity |
| 2017 | 0.13 | absolute equality | 0.26 | relative equality | 0.26 | relative equality | 0.41 | significant disparity |
| 2018 | 0.14 | absolute equality | 0.23 | relative equality | 0.27 | relative equality | 0.41 | significant disparity |
| 2019 | 0.14 | absolute equality | 0.22 | relative equality | 0.28 | relative equality | 0.48 | significant disparity |
| 2020 | 0.15 | absolute equality | 0.24 | relative equality | 0.27 | relative equality | 0.41 | significant disparity |
| 2021 | 0.15 | absolute equality | 0.21 | relative equality | 0.24 | relative equality | 0.34 | relatively reasonable |
| 2022 | 0.14 | absolute equality | 0.22 | relative equality | 0.25 | relative equality | 0.23 | relative equality |
| 2023 | 0.15 | absolute equality | 0.23 | relative equality | 0.25 | relative equality | 0.24 | relative equality |
Disclaimer/Publisher’s Note: The statements, opinions and data contained in all publications are solely those of the individual author(s) and contributor(s) and not of MDPI and/or the editor(s). MDPI and/or the editor(s) disclaim responsibility for any injury to people or property resulting from any ideas, methods, instructions or products referred to in the content. |
© 2025 by the authors. Licensee MDPI, Basel, Switzerland. This article is an open access article distributed under the terms and conditions of the Creative Commons Attribution (CC BY) license (https://creativecommons.org/licenses/by/4.0/).
Share and Cite
Liu, C.; Fan, M.; Yang, Y.; Wang, K.; Liu, H. The Spatiotemporal Evolution Characteristics of the Water Use Structure in Shandong Province, Northern China, Based on the Gini Coefficient. Water 2025, 17, 2315. https://doi.org/10.3390/w17152315
Liu C, Fan M, Yang Y, Wang K, Liu H. The Spatiotemporal Evolution Characteristics of the Water Use Structure in Shandong Province, Northern China, Based on the Gini Coefficient. Water. 2025; 17(15):2315. https://doi.org/10.3390/w17152315
Chicago/Turabian StyleLiu, Caihong, Mingyuan Fan, Yongfeng Yang, Kairan Wang, and Haijiao Liu. 2025. "The Spatiotemporal Evolution Characteristics of the Water Use Structure in Shandong Province, Northern China, Based on the Gini Coefficient" Water 17, no. 15: 2315. https://doi.org/10.3390/w17152315
APA StyleLiu, C., Fan, M., Yang, Y., Wang, K., & Liu, H. (2025). The Spatiotemporal Evolution Characteristics of the Water Use Structure in Shandong Province, Northern China, Based on the Gini Coefficient. Water, 17(15), 2315. https://doi.org/10.3390/w17152315