Review

Evolution of Data-Driven Flood Forecasting: Trends, Technologies, and Gaps—A Systematic Mapping Study

by
Banujan Kuhaneswaran
1,*,
Golam Sorwar
1,
Ali Reza Alaei
1 and
Feifei Tong
1,2
1
Faculty of Science and Engineering, Southern Cross University, Gold Coast, QLD 4225, Australia
2
School of Architecture and Civil Engineering, Faculty of Sciences, Engineering and Technology, The University of Adelaide, Adelaide, SA 5005, Australia
*
Author to whom correspondence should be addressed.
Water 2025, 17(15), 2281; https://doi.org/10.3390/w17152281
Submission received: 23 May 2025 / Revised: 22 July 2025 / Accepted: 28 July 2025 / Published: 31 July 2025

Abstract

This paper presents a Systematic Mapping Study (SMS) on data-driven approaches in flood forecasting from 2019 to 2024, a period marked by transformative developments in Deep Learning (DL) technologies. Analysing 363 selected studies, this paper provides an overview of the technological evolution in this field, methodological approaches, evaluation practices and geographical distribution of studies. The study revealed that meteorological and hydrological factors constitute approximately 76% of input variables, with rainfall/precipitation and water level measurements forming the core predictive basis. Long Short-Term Memory (LSTM) networks emerged as the dominant algorithm (21% of implementations), whilst hybrid and ensemble approaches showed the most dramatic growth (from 2% in 2019 to 10% in 2024). The study also revealed a threefold increase in publications during this period, with significant geographical concentration in East and Southeast Asia (56% of studies), particularly China (36%). Several research gaps were identified, including limited exploration of graph-based approaches for modelling spatial relationships, underutilisation of transfer learning for data-scarce regions, and insufficient uncertainty quantification. This SMS provides researchers and practitioners with actionable insights into current trends, methodological practices, and future directions in data-driven flood forecasting, thereby advancing this critical field for disaster management.

1. Introduction

Floods stand out as a particularly devastating natural disaster, accounting for 44% of all catastrophes globally [1]. Floods can cause extensive damage to infrastructure, disrupt economic activities, lead to loss of life, and create long-term social and environmental problems [2]. The increasing frequency and severity of floods, exacerbated by climate change, urbanisation, and environmental degradation, underscore the urgent need for effective disaster management strategies [3]. Timely and accurate flood forecasting is crucial for effective disaster management, as it enables authorities to issue early warnings, plan evacuations, and implement preventive measures that can significantly reduce loss of life and economic damage [4]. Studies have shown that even a few hours of additional warning time can reduce flood-related damage by up to 30% and save countless lives [5,6]. The complexity of flood dynamics, however, is influenced by several factors, including rainfall intensity, catchment soil moisture, and urbanisation, making flood forecasting challenging [7,8].
The imperative for effective flood forecasting extends beyond immediate disaster management to encompass broader sustainable development objectives. Improved flood forecasting directly contributes to multiple United Nations Sustainable Development Goals (SDGs), including SDG 1 (No Poverty) by protecting vulnerable communities’ assets and livelihoods, SDG 3 (Good Health and Well-being) through enabling timely evacuations and reducing flood-related casualties, SDG 11 (Sustainable Cities and Communities) by enhancing urban resilience, and SDG 13 (Climate Action) through climate adaptation strategies. Furthermore, accurate flood predictions support SDG 6 (Clean Water and Sanitation) by protecting water infrastructure, SDG 9 (Industry, Innovation and Infrastructure) through safeguarding critical facilities, and SDG 2 (Zero Hunger) by minimising agricultural losses. The advancement of data-driven flood forecasting technologies thus represents a crucial intersection of technological innovation and sustainable development imperatives.
Recent advances in Machine Learning (ML) and Deep Learning (DL) have revolutionised data-driven predictive modelling and time series forecasting across various domains and applications, achieving promising results in flood forecasting. The data-driven predictive modelling approaches have demonstrated remarkable success in finance [9,10,11], medical applications [12,13,14,15], crime prediction [16,17], education [18], disaster management [19], weather forecasting [20] and environmental monitoring [21]. In flood forecasting, data-driven models offer several advantages over traditional physics-based approaches, including the ability to capture complex non-linear relationships, handle large volumes of data, and adapt to changing conditions. ML and DL techniques have been increasingly applied to flood forecasting, employing various architectures, such as Artificial Neural Networks (ANNs) [22,23], Long Short-Term Memory (LSTM) networks [24,25], and hybrid models [26,27]. These approaches can effectively process multiple input variables, learn from historical patterns, and generate reasonable forecasts with different lead times [28,29]. However, the diversity of available techniques, coupled with the complexity of flood systems, creates challenges in selecting and implementing appropriate models for specific scenarios and contexts.
Systematic Mapping Study (SMS) plays a crucial role in organising and synthesising research knowledge in many rapidly evolving fields. Unlike Systematic Literature Reviews (SLRs) that focus on synthesising evidence, mapping studies aim to structure research areas and trends (including temporal and geographical patterns), identify research gaps, and guide future research directions [30,31,32]. In the context of flood forecasting, an SMS, therefore, can help researchers and practitioners understand the landscape of data-driven approaches, their applications, limitations, and potential areas for improvement [33]. To assess the necessity and potential contribution of such a mapping study, we first examined whether comprehensive mapping studies already existed in this domain [32]. Therefore, we performed a tertiary study (a systematic review of secondary studies) to identify existing literature reviews or mapping studies on data-driven flood forecasting. This process revealed 20 secondary studies in the field. Whilst these studies provide valuable insights into specific aspects, none have comprehensively mapped the landscape of data-driven approaches in flood forecasting during this critical advancement period.
This research gap motivates the present SMS, which aims to provide a comprehensive overview of data-driven approaches in flood forecasting. In performing this, the paper analyses 363 primary studies (2019–2024) across multiple dimensions, including temporal trends, geographical distribution, factors, data sources, technical approaches, and evaluation metrics. The methodology follows established guidelines for SMS [30,31,32], including a rigorous search strategy, explicit inclusion and exclusion criteria, and systematic data extraction and analysis procedures to classify the selected studies across multiple dimensions, including temporal trends, geographical distribution, factors, data sources, technical approaches, and evaluation metrics. This holistic approach enables the identification of both universal patterns and specialised applications in data-driven flood forecasting. This study captures the state-of-the-art in the rapidly evolving field by focusing on rainfall-driven floods and utilising three electronic databases (IEEE Xplore, WoS, and Scopus). The resulting mapping provides researchers, practitioners, and policymakers with an integrated understanding of current capabilities, limitations, and future research directions in data-driven flood forecasting that was previously unavailable in the literature.
The remainder of this paper is organised as follows: Section 2 provides background information on flood forecasting approaches. Section 3 presents the tertiary study findings. Section 4 details the research methodology of this mapping study. Section 5 introduces key temporal concepts in flood forecasting. Section 6 presents results and discussion organised by Research Questions (RQs) covering publication trends, geographical distribution, input factors, algorithms, and evaluation metrics. Finally, Section 7 concludes the paper and offers directions for future research.

2. Background of Flood Forecasting

Flood forecasting is a critical component of disaster management that aims to forecast potential flooding events to minimise their adverse impacts. The advancement of information technologies and their complex applications has made flood forecasting strategies more sophisticated, yet essential for achieving high-quality and reliable forecasts in terms of accuracy, complexity, and portability [4].
Traditional flood forecasting approaches can be broadly categorised into three main types: physical-based, data-driven, and hybrid models.
(i)
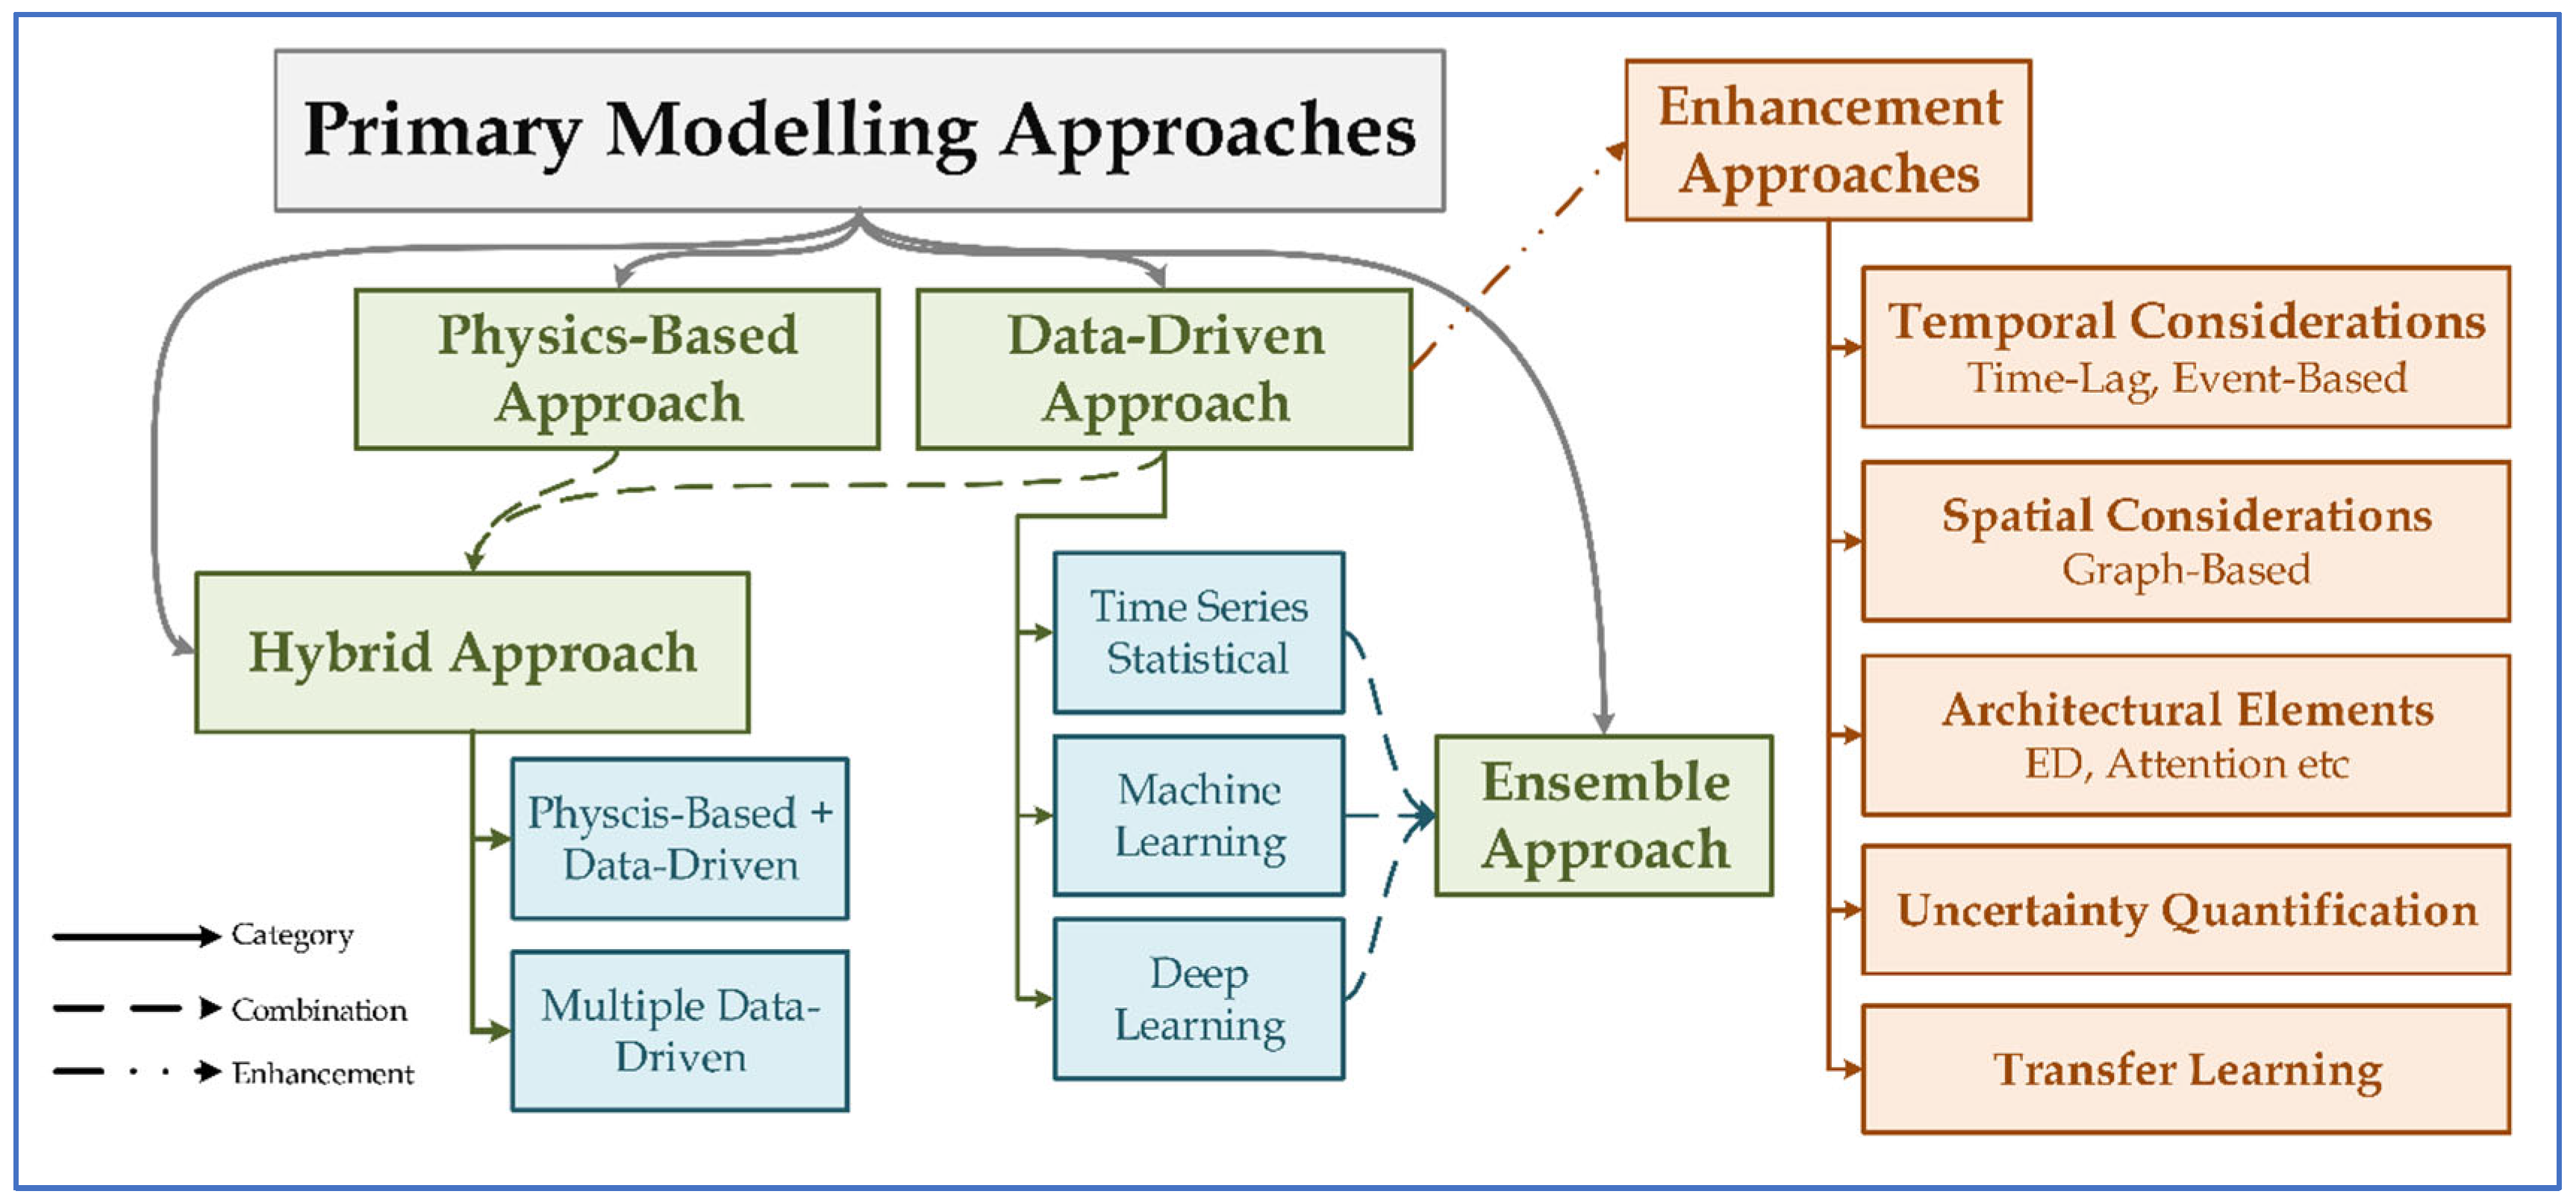
Physical-based models, also known as process-based, physics-based or numerical models, attempt to represent real-world physical processes using formulae adhering to mass and energy conservation principles [34,35]. Examples include the XinAnJiang (XAJ) model, the TOPography based hydrological MODEL (TOPMODEL), and the Hydrologic Engineering Centre-Hydrologic Modelling Systems (HEC-HMS). Whilst these models have established the foundation for flood forecasting over decades, they face numerous limitations. These include increased system complexity with more factors, poor portability, and complex calibration processes that require significant expertise [35]. Additional challenges include high computational demands [36], substantial data requirements for accurate parameterisation, difficulty in representing spatiotemporal variability at different scales, inherent uncertainty in model structure and parameters [37], limited applicability in ungauged basins, and reduced performance in extreme event scenarios due to non-linear hydrological responses that exceed calibration ranges [38]. Moreover, these models often struggle with integrating real-time data and adapting to changing environmental conditions [39].
(ii)
Data-driven models, in contrast, overcome these limitations by analysing hydrological and hydrodynamic data to identify underlying time series patterns without explaining the physics-based development of river flow [40]. These models efficiently create correlations between historical and future data to provide reasonably accurate time series forecasting whilst reducing computational expenses and eliminating the need for boundary conditions [41]. Data-driven approaches can be further categorised into time series statistical models and ML or DL models. (a) Time series statistical models represent the traditional data-driven approach to flood forecasting. Models such as Autoregressive (AR), Moving Average (MA), and Autoregressive Integrated Moving Average (ARIMA) have been widely used since the 1970s [42]. Whilst these models work well for stationary time series and normal error distributions, they struggle mainly with non-linear relationships common in hydrological time series [43]. (b) ML approaches like ANNs, Support Vector Machines (SVMs), Random Forest (RF), and Naive Bayes have shown promise in handling non-linear relationships and processing large amounts of data. However, these models may have limited ability to fully capture long-term temporal dependencies and spatial dependencies [44]. (c) DL models, particularly Recurrent Neural Networks (RNNs), have emerged as powerful tools for flood forecasting due to their ability to handle sequential data and capture temporal dependencies [45]. Advanced architectures like LSTM, Gated Recurrent Units (GRUs) and Convolutional Neural Networks (CNNs) have demonstrated superior performance in many studies by addressing the vanishing gradient problem common in traditional RNNs [46]. Recent advances in DL have introduced more sophisticated architectures, such as attention mechanisms, Graph Neural Networks (GNNs), and transformer models. These innovations help models to better capture spatial-temporal relationships and handle long-term dependencies more effectively [28,47].
(iii)
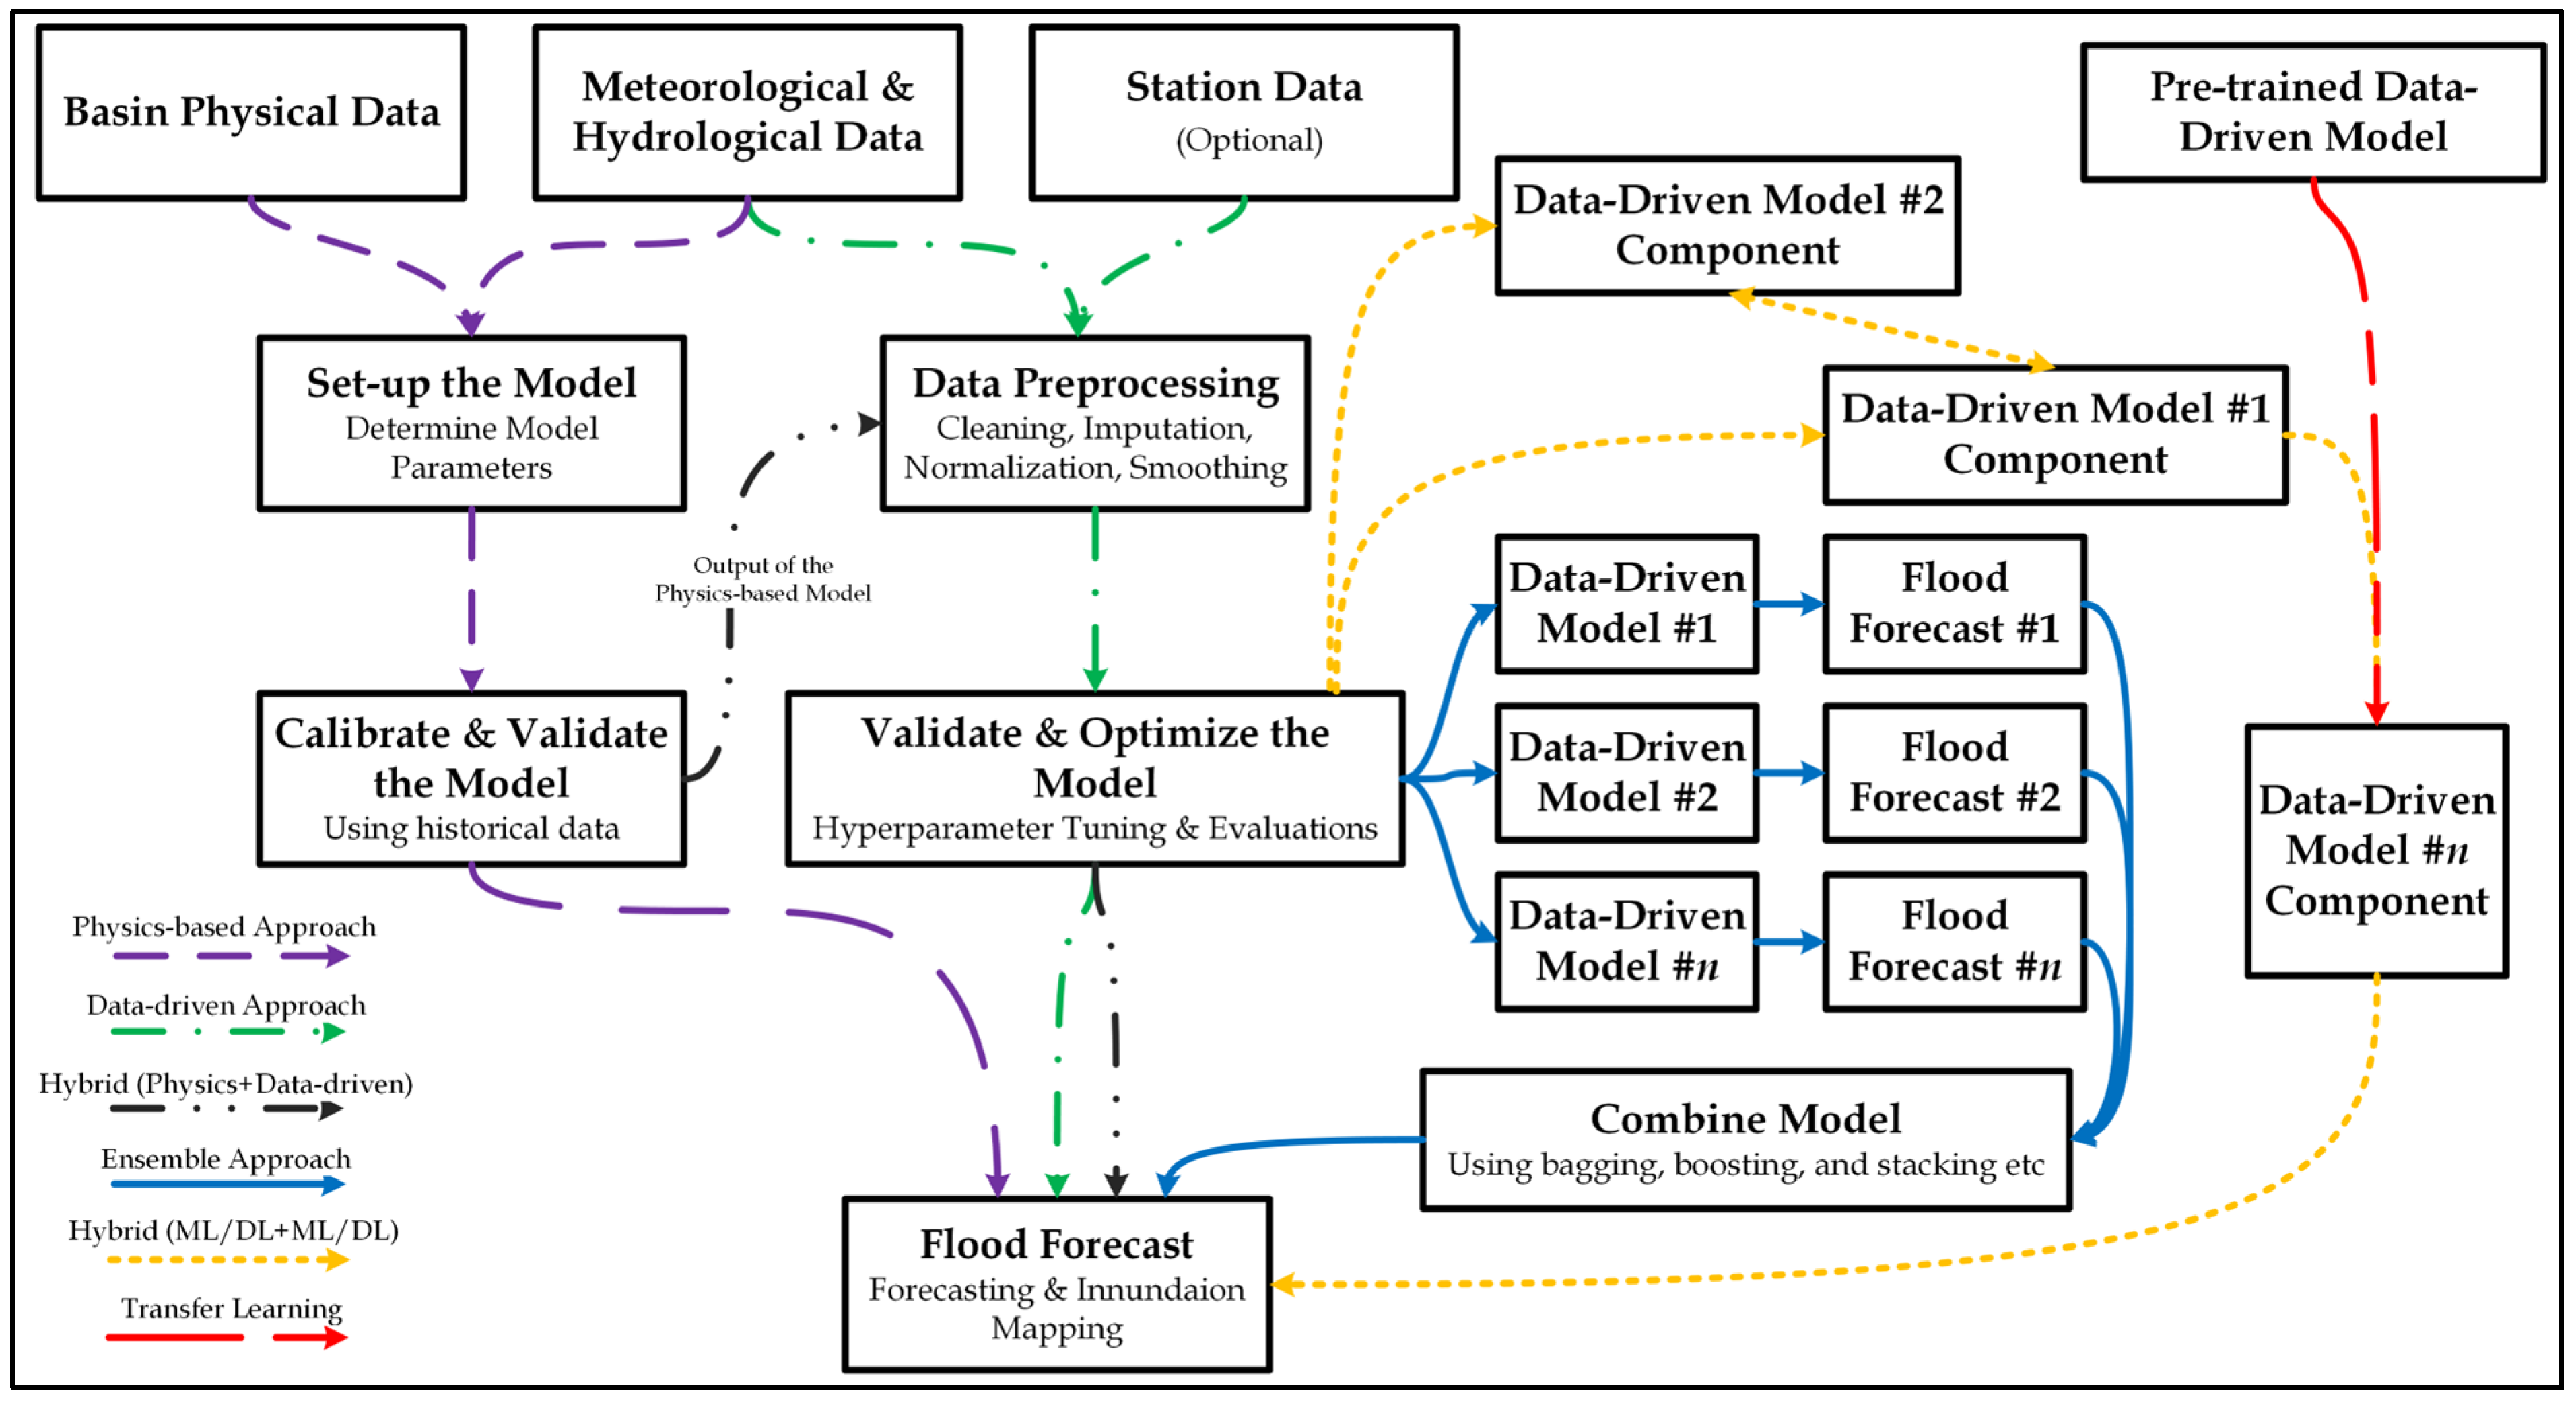
Hybrid approaches in data-driven modelling have gained significant attention in recent years. These methods can be broadly categorised into: (i) hybrids combining different ML/DL models [48] and (ii) hybrids integrating physics-based and data-driven models [27]. The first category includes combinations like CNN-LSTM, which leverage CNN’s spatial feature extraction capabilities with LSTM’s temporal modelling strengths [49,50], and FastGRNN-FCN, which combines the efficiency of FastGRNN with the feature extraction capabilities of FCN [51]. The second category of hybrids integrates physical models with data-driven models to leverage the strengths of both paradigms. Examples include MIKE21-LSTM, XAJ-MCQRNN, and HEC-HMS-LSTM combinations [45,52]. These hybrid models demonstrate the ongoing efforts to create more comprehensive and accurate flood forecasting systems that can capture both the data-driven patterns and the underlying physical processes of hydrological systems. Despite these advancements, a systematic understanding of the current landscape, trends, and gaps in data-driven flood forecasting research remains necessary, which motivates the present SMS.
In summary, flood forecasting has evolved from traditional physics-based models to diverse data-driven approaches capable of handling non-linear relationships and complex patterns. Recent advancements include sophisticated DL architectures and hybrid models that combine multiple methodologies for improved accuracy. Despite this progress, a systematic evaluation of the current landscape remains necessary to identify effective approaches and knowledge gaps in data-driven flood forecasting—the primary motivation for this mapping study. Before conducting this mapping study, we first performed a tertiary study to establish the novelty and scope of our research [53].

3. Tertiary Study

A tertiary study represents a systematic review of secondary studies (such as SLRs, surveys, reviews and SMSs) within a specific research domain [54]. Whilst primary studies report original research findings, secondary studies synthesise and analyse these primary studies, and tertiary studies aggregate and evaluate collections of secondary studies to provide a comprehensive overview of the research landscape. This preliminary step was essential to position our research within the existing knowledge base and to confirm the originality and value of our contribution.
The tertiary study was conducted using the following search string applied to title, abstract, and keywords:
(“flood*” OR “water level”) AND (“predict*” OR “forecast*”) AND (“review” OR “survey” OR “systematic mapping” OR “mapping study”).
We selected three major electronic databases for our search: IEEE Xplore [55], Web of Science (WoS) [56], and Scopus [57]. These databases were chosen due to their comprehensive coverage of computer science, data science, engineering, and environmental science publications, providing an excellent representation of interdisciplinary research in data-driven flood forecasting. These databases also provide broad coverage of relevant literature and are known for their rigorous inclusion, ensuring access to high-impact journals across multiple disciplines.
We further limited our search to the period between 2019 and 2024. This time frame was specifically chosen as it coincides with a period of transformative development in data-driven flood forecasting, characterised by rapid advancement in ML/DL architectures, increased availability of high-resolution hydrometeorological data, and the emergence of novel computational approaches. Additionally, the volume of publications on ML/DL applications for flood forecasting has increased significantly during this period, making it particularly important to understand the current state of research.
After eliminating duplicates and applying inclusion and exclusion criteria similar to those used in our main study (discussed in Section 4.2.3), we identified 20 relevant secondary studies. Our analysis of the 20 identified secondary studies revealed several gaps in data-driven flood forecasting research. For example, we noted that the existing reviews predominantly focus on specific aspects of flood forecasting, with many concentrating exclusively on particular modelling approaches (eight studies on DL, six on traditional ML) rather than providing a comprehensive overview of the entire technical landscape. In addition, the temporal scope varies considerably, with some studies covering extended historical periods (1979–2023) [58] whilst lacking detailed analysis of recent innovations. Geographically, several studies focus on specific regions like Southeast Asia [59] or India [60] or on specialised application contexts such as ice jam floods [58], urban drainage systems [61], or lake water level forecasting [62]. Methodologically, many existing reviews employ traditional literature review approaches rather than systematic mapping methodologies, resulting in a less structured classification of the research domain [60,63,64,65,66]. Additionally, whilst some studies have analysed aspects like data sources, preprocessing techniques, and evaluation metrics [60,67], none have provided a comprehensive mapping that integrates all these dimensions into a unified framework for understanding the current state of data-driven flood forecasting. Therefore, the present study aims to provide a comprehensive analysis of the data-driven approaches used for flood forecasting. The complete list of 20 secondary studies identified through our tertiary study analysis is provided in Supplementary File S1 (Appendix A: List of Tertiary Studies).

4. Research Method

The research method for this SMS follows the guidelines established by Kitchenham and Charters [32]. This well-established methodology has been utilised in many mapping studies in the computer science field [53,68,69]. The methodology comprises three main phases: (i) Planning: refers to pre-review activities aimed at establishing a review protocol that defines RQs, inclusion and exclusion criteria, sources of studies, search string, and mapping procedures; (ii) Conducting: searches for and selects studies to extract and synthesise data from them; and (iii) Reporting: the final phase focusing on documenting results and sharing them with potentially interested parties. During this phase, the SMS findings are used to address RQs. In the conducting phase, as recommended by Kitchenham and Charters [32], we complemented database searches with snowballing from reference lists of selected studies. This technique helps to identify additional relevant studies through the reference lists of papers found using the search strings. Additionally, as suggested by Kitchenham and Charters [32], we performed direct searches for works by key researchers and research groups identified from previously selected papers (those retrieved through database searches and snowballing). This approach helped to overcome the limitations of relying solely on specific electronic databases.

4.1. Research Questions

To achieve the overall aims and objectives identified in the previous section, this SMS addresses the following five RQs (RQ1–RQ5).
RQ1: What are the temporal and types of publication trends?
Maps the evolution and maturity of the field by analysing publication patterns across years and publication venues. This helps to identify established publication forums and emerging trends in flood forecasting research.
RQ2: Which countries were the studies based on?
Identifies the geographical distribution of research efforts and potential gaps in regional coverage. Understanding where studies are conducted helps to highlight areas needing more research attention, particularly flood-prone regions.
RQ3: What input factors, output variables, data sources, collection periods, and temporal resolutions were utilised in flood forecasting studies?
Maps the fundamental data characteristics of flood forecasting models, including input variables, target outputs, data sources, collection timeframes, and temporal resolutions. This comprehensive examination of data foundations is crucial as these elements significantly impact model performance and applicability. Understanding patterns in data usage helps researchers to identify reliable configurations for different forecasting scenarios and recognise potential data gaps in current approaches.
RQ4: What technical approaches and temporal forecasting capabilities were implemented in the studies?
Maps the entire technical pipeline used in flood forecasting, from preprocessing techniques and feature engineering to model implementation, uncertainty quantification, and optimisation methods, including the analysis of lead times and temporal forecasting horizons. This comprehensive view helps researchers to understand the complete workflow of successful flood forecasting systems, their temporal forecasting capabilities, and identify opportunities for methodological improvements across the entire forecasting pipeline.
RQ5: What evaluation metrics were employed to assess model performance?
Documents how forecasting models are evaluated. Understanding evaluation approaches enables meaningful comparison between different methods and supports the standardisation of assessment criteria.
By systematically addressing these questions, this SMS aims to provide researchers and practitioners with actionable insights into the current state and future directions of data-driven flood forecasting.

4.2. Study Selection

4.2.1. Sources and Timeframe

For this SMS, we utilised the same three major scientific databases (IEEE Xplore, WoS, and Scopus) described in our tertiary study (Section 3) since these databases collectively provide comprehensive coverage of interdisciplinary research in data-driven flood forecasting. Furthermore, we limited our search to the period between 2019 and 2024, which captures a transformative period in data-driven flood forecasting. Four significant developments characterise this period: (i) the emergence of novel DL architectures, including transformers, GNNs, and attention mechanisms that have revolutionised time series modelling capabilities [46,70]; (ii) unprecedented access to high-resolution hydrometeorological data through improved satellite products and sensor networks [71]; (iii) significant advancements in uncertainty quantification techniques for hydrological forecasting [72,73]; (iv) the integration of explainable AI approaches that enhance trust in data-driven forecasting systems [74,75]. These factors collectively represent a distinct phase in the evolution of flood forecasting that warrants dedicated analysis.

4.2.2. Terms and Search String

The search string was developed based on three core concepts: flood (including hydrological measurements), technology (covering data-driven approaches and algorithms), and forecasting Table 1. These concepts were combined using Boolean operators to create a comprehensive search strategy. This search string was applied to the title, abstract, and keywords fields in the selected databases. The string underwent syntactic adaptations based on the specific requirements of each database whilst maintaining semantic consistency.

4.2.3. Inclusion and Exclusion Criteria (IC and EC)

To ensure a focused and methodologically sound SMS, we established explicit inclusion and exclusion criteria that address the specific challenges of the vast flood forecasting literature landscape. Our focus on data-driven approaches for flood forecasting (IC1) is strategically justified by the paradigm shift in hydrology towards ML and DL techniques, which have demonstrated superior capability in capturing complex non-linear relationships in hydrological systems compared to traditional statistical methods [70]. The exclusion of categorical classification studies (binary or other form of categorisation) and flood susceptibility or risk mapping studies without time series forecasting (EC1) reflects the operational need for continuous time series forecasting that provides actionable information with temporal progression. Similarly, our focus on short to medium-term forecasting horizons (EC2) aligns with the critical operational window for emergency response planning, evacuation decisions, and infrastructure protection measures, where forecasting ranging from hours to days is most valuable for decision-makers [46,76].
The methodological boundaries established through EC3 and EC4 ensure that our analysis captures studies where data-driven models play the primary forecasting role rather than supporting physics-based approaches. This distinction is crucial as hybrid approaches have proliferated in the recent literature, creating a methodological spectrum between purely physics-based and purely data-driven approaches. By focusing on studies where ML/DL components drive the forecasting using hydrological variables, we ensure relevance to the contemporary challenges in operational flood forecasting, where computational efficiency and adaptive learning have become increasingly important [77]. The exclusion of studies with limited practical applicability (EC5) further strengthens the real-world relevance of our findings for flood management authorities and practitioners. In addition to specific ECs (EC1–EC5), the generic ECs (EC6–EC11) are employed in the paper selection process. Table 2 summarises the IC and ECs used in this SMS.

4.3. Data Extraction and Synthesis

The initial search yielded 2760 publications across three databases: IEEE (229), Scopus (1121), and WoS (1410). The search and selection process is shown in Figure 1.
In the first stage, duplicate removal reduced the papers to 1908 (31% reduction). The second stage applied generic ECs (EC6–EC10) to titles and abstracts, resulting in 1711 papers (10% reduction). The third stage applied specific ECs (EC1–EC5) to titles and abstracts, yielding 696 papers (59% reduction). In the fourth stage, specific ECs (EC1–EC5) were applied to full texts, resulting in 348 papers (50% reduction). For the fifth stage, we performed snowballing and searched for additional works by identified researchers and research groups, adding 59 papers (17% increment). In the final stage, after applying selection criteria (EC1–EC10) to the full texts of these additional papers, we reached a final set of 363 studies for our mapping. Table 3 summarises the stages and their outcomes. The final set of 363 selected primary studies used for this mapping is listed in Supplementary File S1 (Appendix B: List of Selected 363 Studies).

4.4. Classification Scheme

A classification scheme is essential to categorise and analyse the selected studies for conducting an SMS [31]. Our classification scheme consists of multiple facets (Table 4), each corresponding to one of our RQs. The categories were developed through two complementary approaches: (i) based on established categories in flood forecasting literature [4] and (ii) derived from analysis of the selected studies through an iterative process.

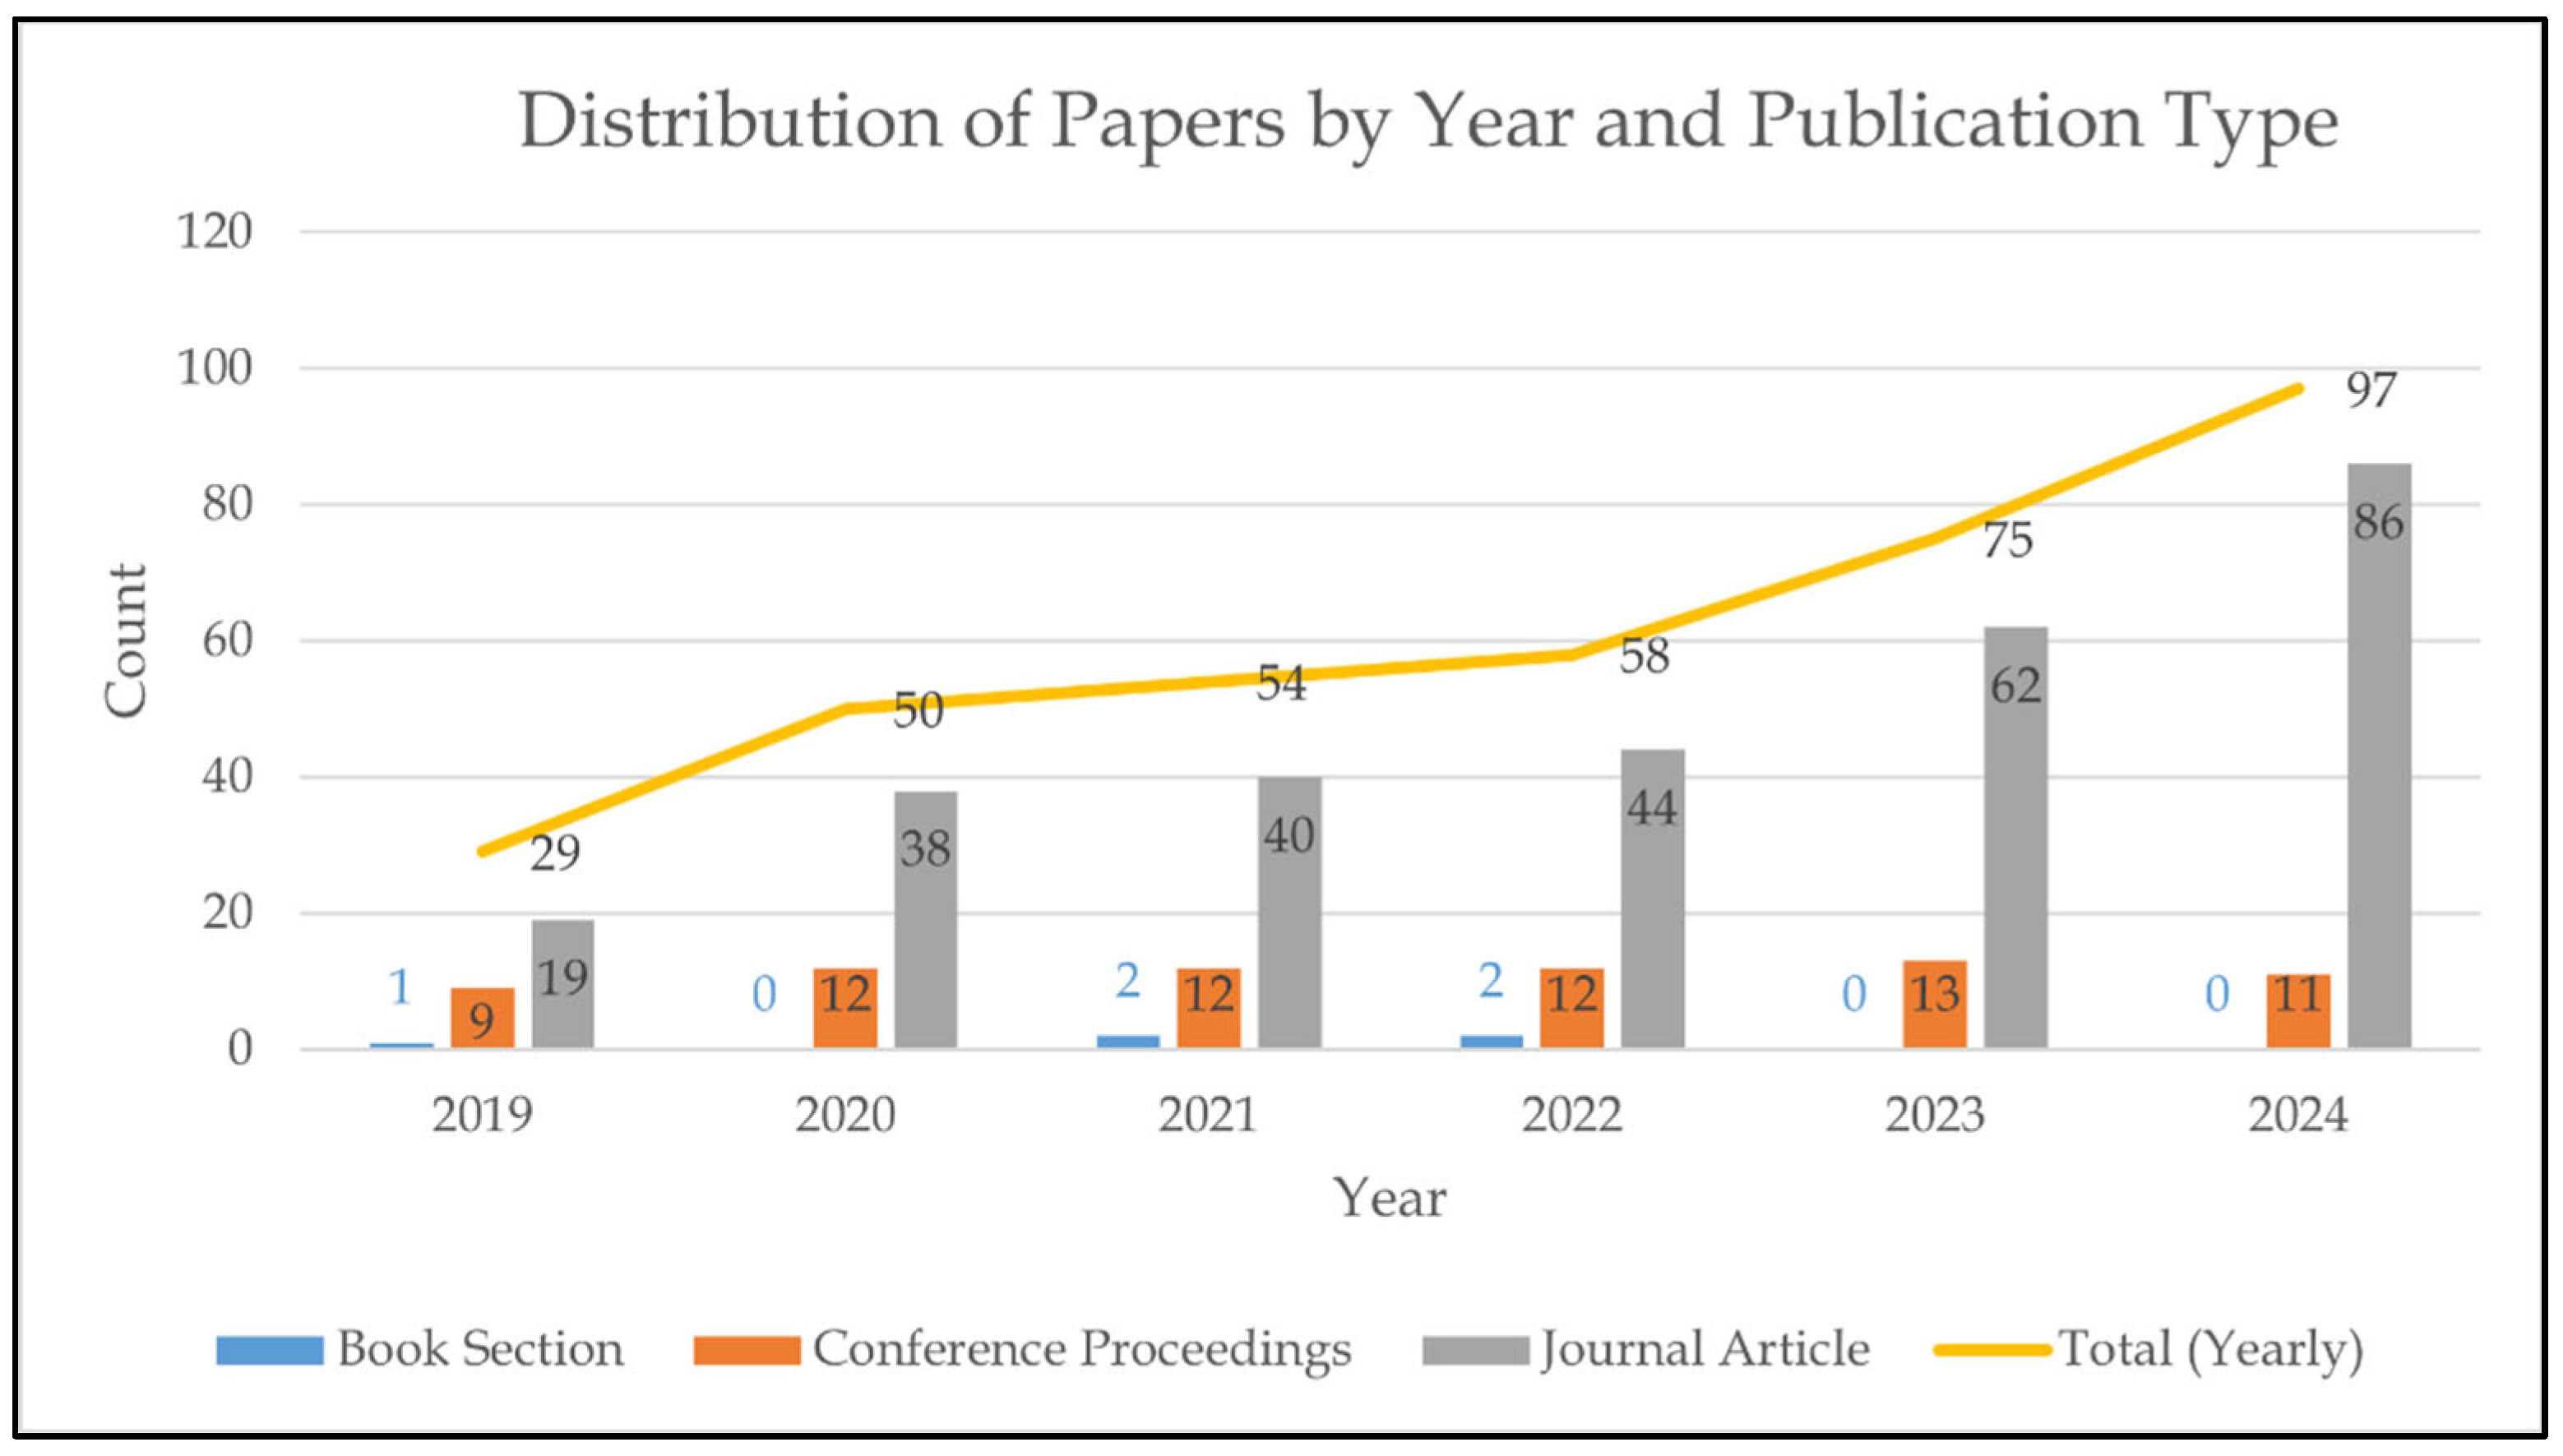
4.4.1. Publication Trends and Types (RQ1)

Studies were classified according to publication year (2019–2024), type (journal articles, conference proceedings, and book sections), and specific publication venues to identify temporal patterns and preferred outlets for flood forecasting research.

4.4.2. Geographical Distribution (RQ2)

Studies were categorised by country of application to identify geographical patterns in research focus, highlighting both heavily studied and understudied flood-prone regions worldwide.

4.4.3. Input Factors, Output Variables, Data Sources, and Temporal Characteristics (RQ3)

To systematically analyse the diverse input–output configurations and data characteristics in flood forecasting studies, we developed the following classification facets:
Input Factor Categories: Studies were classified based on the types of input variables used and are grouped into eight main categories: (i) Meteorological: variables related to weather and climate conditions, such as precipitation/rainfall, air temperature, wind speed/velocity, humidity, solar radiation, cloud cover, and evapotranspiration; (ii) Hydrological: variables related to water and its movement, including discharge/flow rate, river level, streamflow, groundwater level, infiltration rates, reservoir inflow, and water level; (iii) Geographic/Spatial/Terrain: variables describing the physical characteristics of the study area, such as altitude, area, slope, elevation, river bathymetry, topography, and coordinate information; (iv) Land Cover/Land Use: variables describing the surface cover and human use of the land, including land cover, land use type, imperviousness, and proportion of surface factors; (v) Soil Related: variables describing soil properties, such as soil moisture, soil texture, soil type, hydraulic conductivity, and permeability; (vi) Derived Indices/Parameters: calculated values based on other primary variables, including aridity index, leaf area index, NDVI, and climate indices; (vii) Infrastructure/Network Related: variables describing human-made systems, such as building footprints, channel geometry, pipe network density, and reservoir release; (viii) Remote Sensing/Imagery: data from satellite or radar sources, including radar echo maps, SAR imagery, and river webcam images.
Output Variable Categories: The prediction targets in flood forecasting studies were classified into six categories: (i) Water Level/Stage: heights of water surface at specific locations, including river level, gauge height, flood level, and water stages; (ii) Streamflow/Discharge/Runoff: volume of water flowing through a channel over time, including discharge, river flow, and inflow; (iii) Flood Inundation/Event: characteristics: spatial impact and key attributes of flood events, including inundation depth, flood volume, and peak discharge; (iv) Flood Risk and Impact Assessment: variables related to potential consequences, including flood risk level, warning, and flood condition classification; (v) Meteorological Variables: weather-related outputs such as rainfall processes and precipitation.
Data Collection Period: The temporal span of data used in studies was categorised as follows: (i) Seasonal focus (specific seasons only, such as the monsoon season); (ii) Event-based (focused on discrete flood events); (iii) Mixed historical and synthetic (combination of actual and simulated data); (iv) Continuous time series, further divided by duration: (a) <1 year, (b) 1–10 years, (c) 11–30 years, and (d) 30+ years.
Data Frequency/Time Step: The temporal resolution of data was classified according to common sampling intervals in hydrology, ranging from 1 s to daily, with intermediate categories including per minute (1, 2, 5, 10, 12, 15, 30), hourly (1, 3, 4, 6, 12), and daily measurements.

4.4.4. Technical Approaches (RQ4)

To analyse the technical approaches used in flood forecasting studies, we classified the algorithms and methodologies into two main categories: data preprocessing and modelling approaches.
Data Preprocessing Approaches: (i) Preprocessing and Feature Engineering: Techniques used to clean, transform, and enhance the input data before model training, including normalisation methods, missing data imputation techniques, outlier detection algorithms, and feature selection approaches; (ii) Look-back Window Selection: Approaches used to determine the optimal historical data window for forecasting, including sliding window techniques, recursive strategies, direct multi-step methods, and temporal attention mechanisms. This also captures the specific window sizes used across different studies.
Modelling Approaches: (i) Forecasting Algorithms: core ML/DL algorithms used for flood forecasting, such as time series statistical models, traditional ML (e.g., SVM, Random Forest, Decision Trees), DL models (e.g., CNN, RNN, LSTM, GRU), hybrid models and ensemble models; (ii) Physics-Based Models: hydrological and hydrodynamic models, including HEC-HMS, SWAT, MIKE, and other numerical models; (iii) Uncertainty Quantification: methods used to quantify and communicate the uncertainty in flood forecasts, including ensemble techniques, Monte Carlo methods, Bayesian approaches, and probabilistic forecasting frameworks; (iv) Optimisation and Hyperparameter: Tuning Algorithms: techniques used to optimise model parameters and hyperparameters, including gradient descent variants, evolutionary algorithms, Bayesian optimisation, and grid/random search methods.
Each study was analysed to extract information related to these technical aspects, allowing us to identify trends in algorithmic approaches and methodological innovations in flood forecasting research. Additionally, we identified the proposed models introduced in each study and the baseline models they outperformed, providing context for evaluating advancements in the field.

4.4.5. Evaluation Matrices (RQ5)

To analyse how flood forecasting models are evaluated, we classified performance metrics into six main categories: (i) Error-based Metrics: Metrics that quantify the difference between forecasted and observed values. These include general error metrics (e.g., Root Mean Squared Error (RMSE), Mean Absolute Error (MAE), Mean Squared Error (MSE), Mean Absolute Percentage Error (MAPE)) that measure overall forecasting accuracy and peak-specific error metrics that focus on critical high-flow events; (ii) Goodness-of-fit Metrics: Metrics that assess how well the model fits the observed data, including efficiency metrics (e.g., Nash-Sutcliffe Model Efficiency (NSE), Coefficient of Determination (R2), Kling-Gupta Efficiency (KGE)) that measure the model’s explanatory power and bias metrics (e.g., Relative Error, Percent BIAS) that quantify systematic deviations; (iii) Classification Performance Metrics: Metrics used to evaluate binary classification aspects of forecasting, such as Accuracy, F1-score, Precision, Recall, and Critical Success Index (CSI), particularly relevant for flood/no-flood forecasting; (iv) Probabilistic Forecast Metrics: Metrics that evaluate uncertainty quantification and probabilistic forecasts, including Continuous Ranked Probability Score (CRPS), Qualification Rate, Reliability, and various forecasting interval metrics such as Prediction Interval (PI) that assess confidence bounds; (v) Hydrological-specific Performance Metrics: Metrics specifically designed for hydrological applications, including volume-related metrics (e.g., Volumetric Efficiency, Flood Volume Error) and peak flow analysis metrics (e.g., Critical Water Conditions, Peak Discharge Error); (vi) Computational Performance Metrics: Metrics that evaluate the computational aspects of models, such as Computation Time, AIC, Forecasting Time, and Memory Usage, which are essential for operational implementation.
In addition to these primary metric categories, researchers also employ various statistical tests (e.g., Kolmogorov–Smirnov Test, Spearman’s Rank R) to verify the statistical significance of results and visual assessment techniques (e.g., Confusion Matrices, Taylor Diagrams) to provide intuitive representations of model performance. These supplementary evaluation approaches complement the quantitative metrics and offer additional insights into model behaviour and reliability. This classification scheme enables a comprehensive analysis of evaluation approaches in flood forecasting research, facilitating the identification of established practices and emerging trends in model assessment.
Each selected study was analysed according to the categories and subcategories outlined in Table 4. The extraction process employed both automated tools for bibliometric data and manual analysis for technical content, ensuring accuracy and completeness. This comprehensive extraction framework addresses a critical gap in existing secondary studies, which typically focus on singular aspects (e.g., only algorithms or only evaluation metrics) rather than providing an integrated view of the research landscape. By capturing the interconnections between data characteristics, technical approaches, and evaluation methods, our framework enables researchers to understand not just what techniques are being used, but how they relate to specific forecasting contexts and performance outcomes.

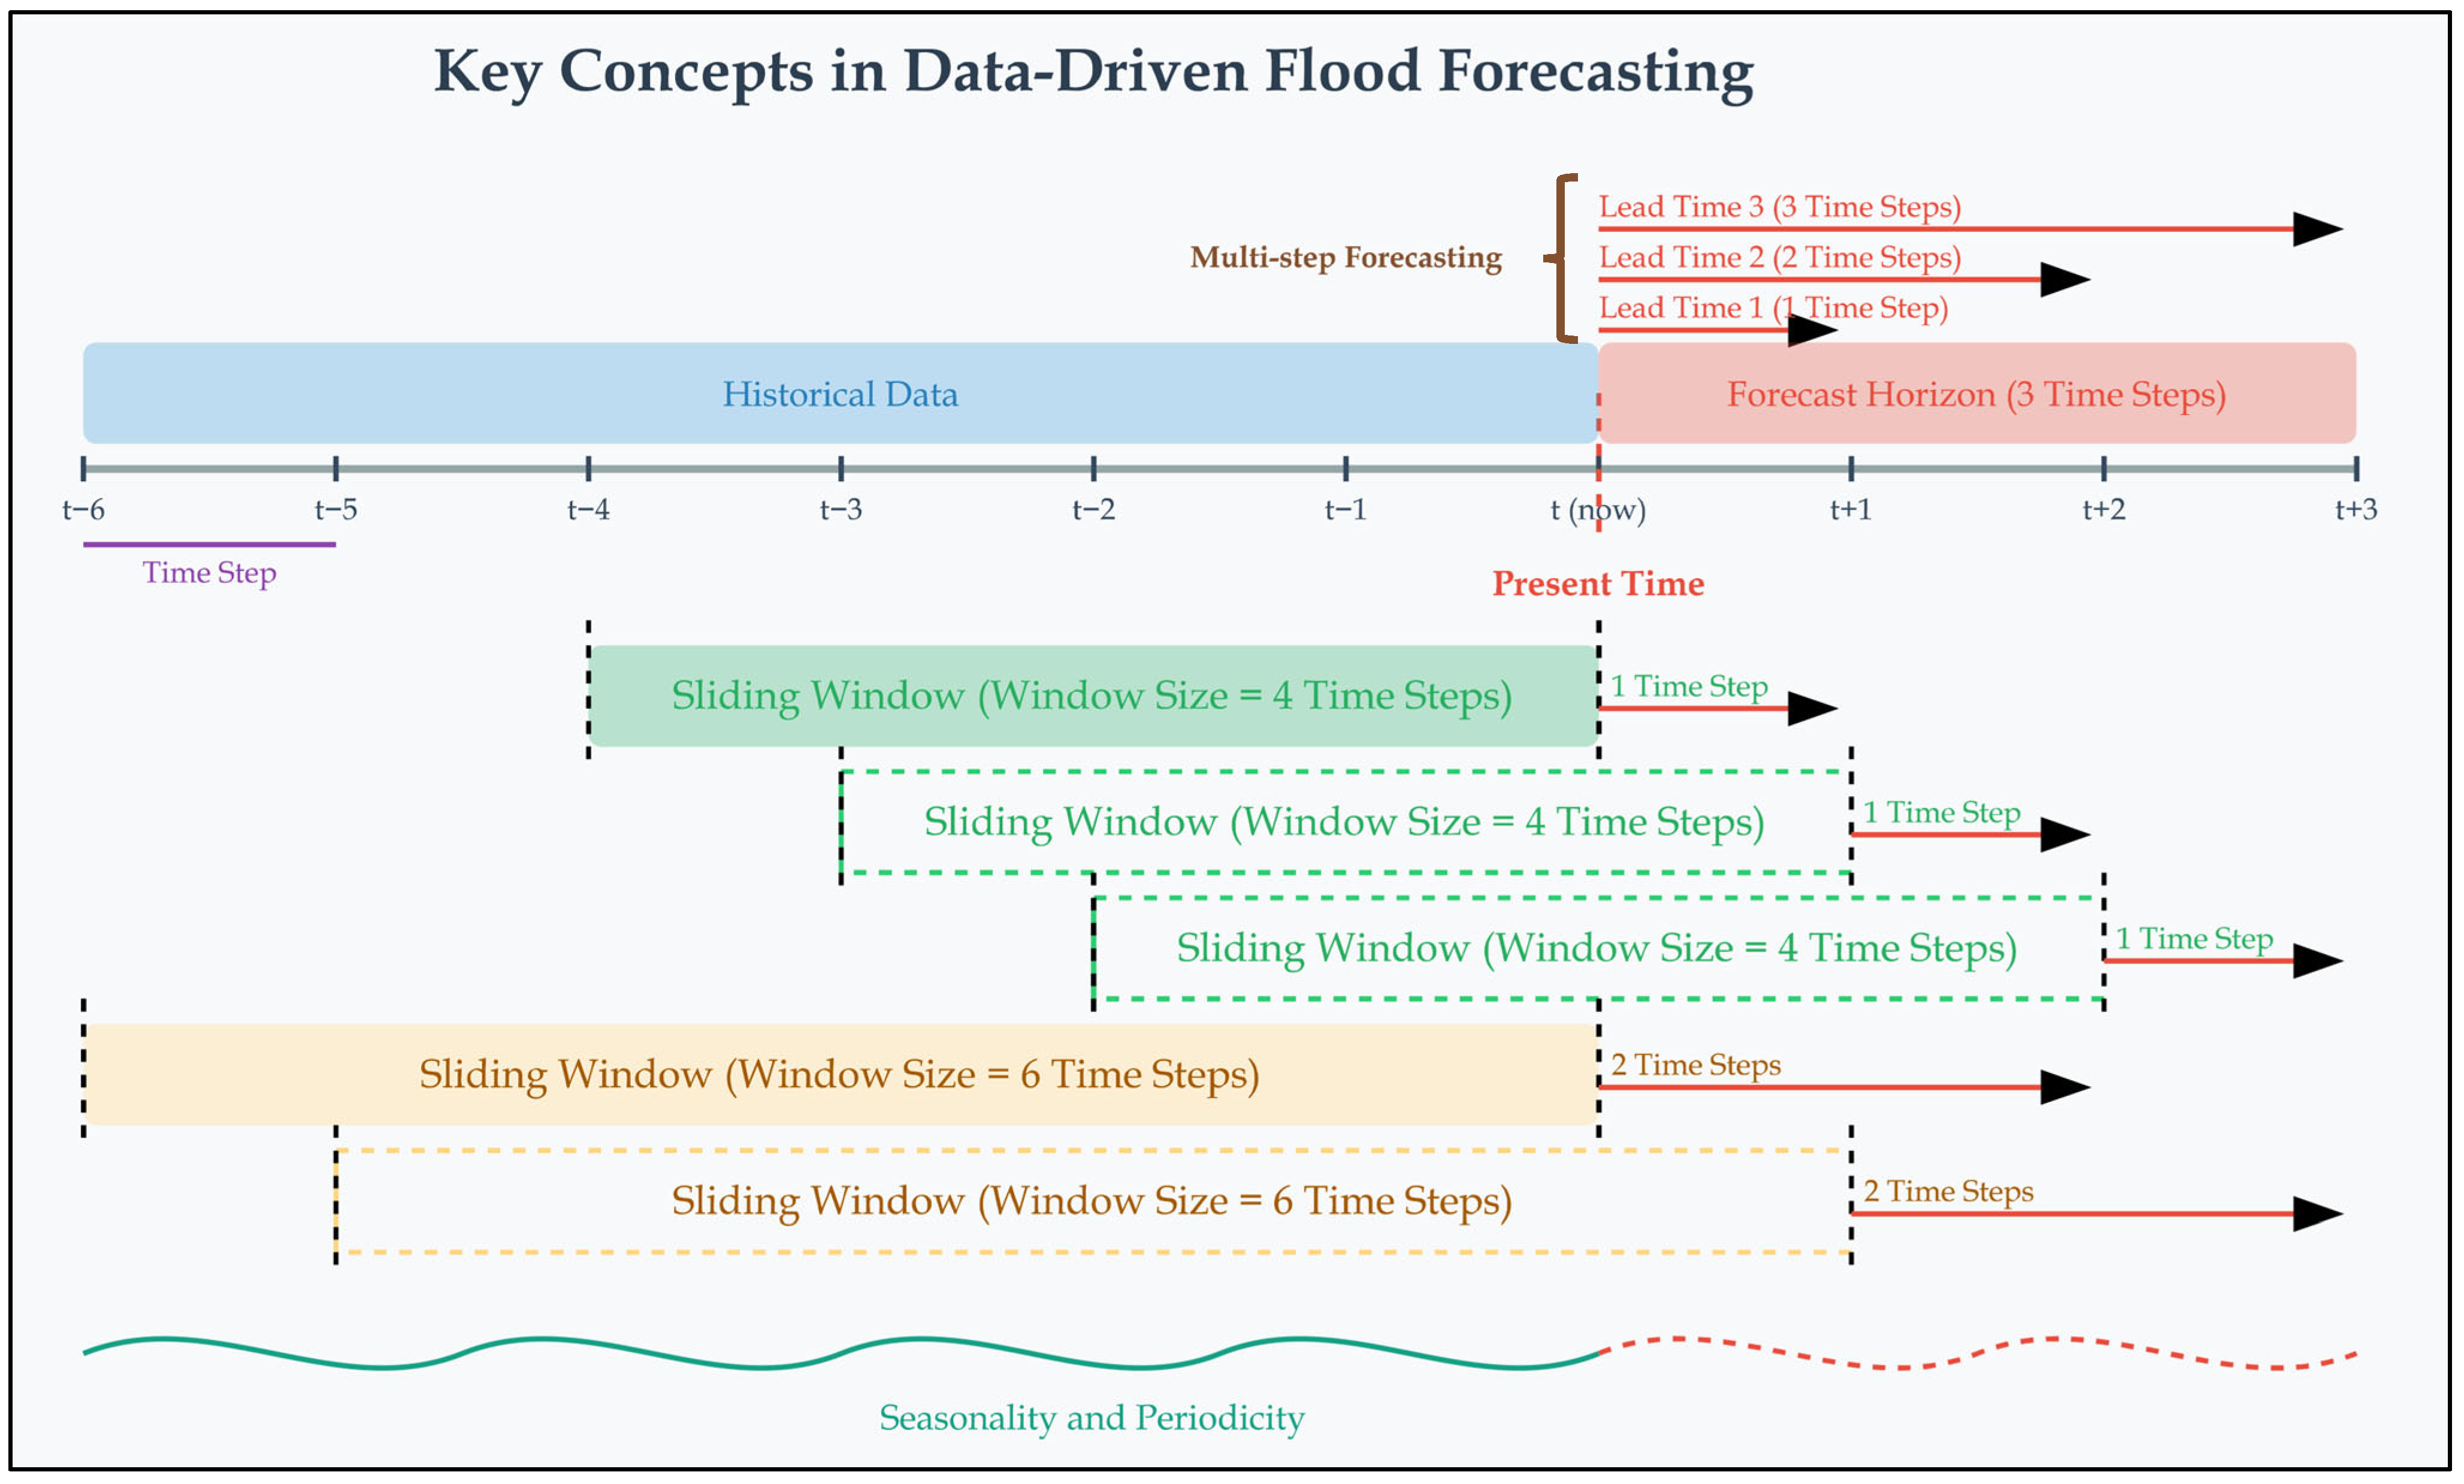
5. Temporal Concepts in Flood Forecasting

It is essential to clarify key temporal terminology that frequently appears in flood forecasting literature, where there is considerable inconsistency in how researchers define and use critical temporal concepts. This section aims to clarify these concepts and to facilitate discussion and interpretation of the mapping results that follow.

5.1. Forecasting and Prediction
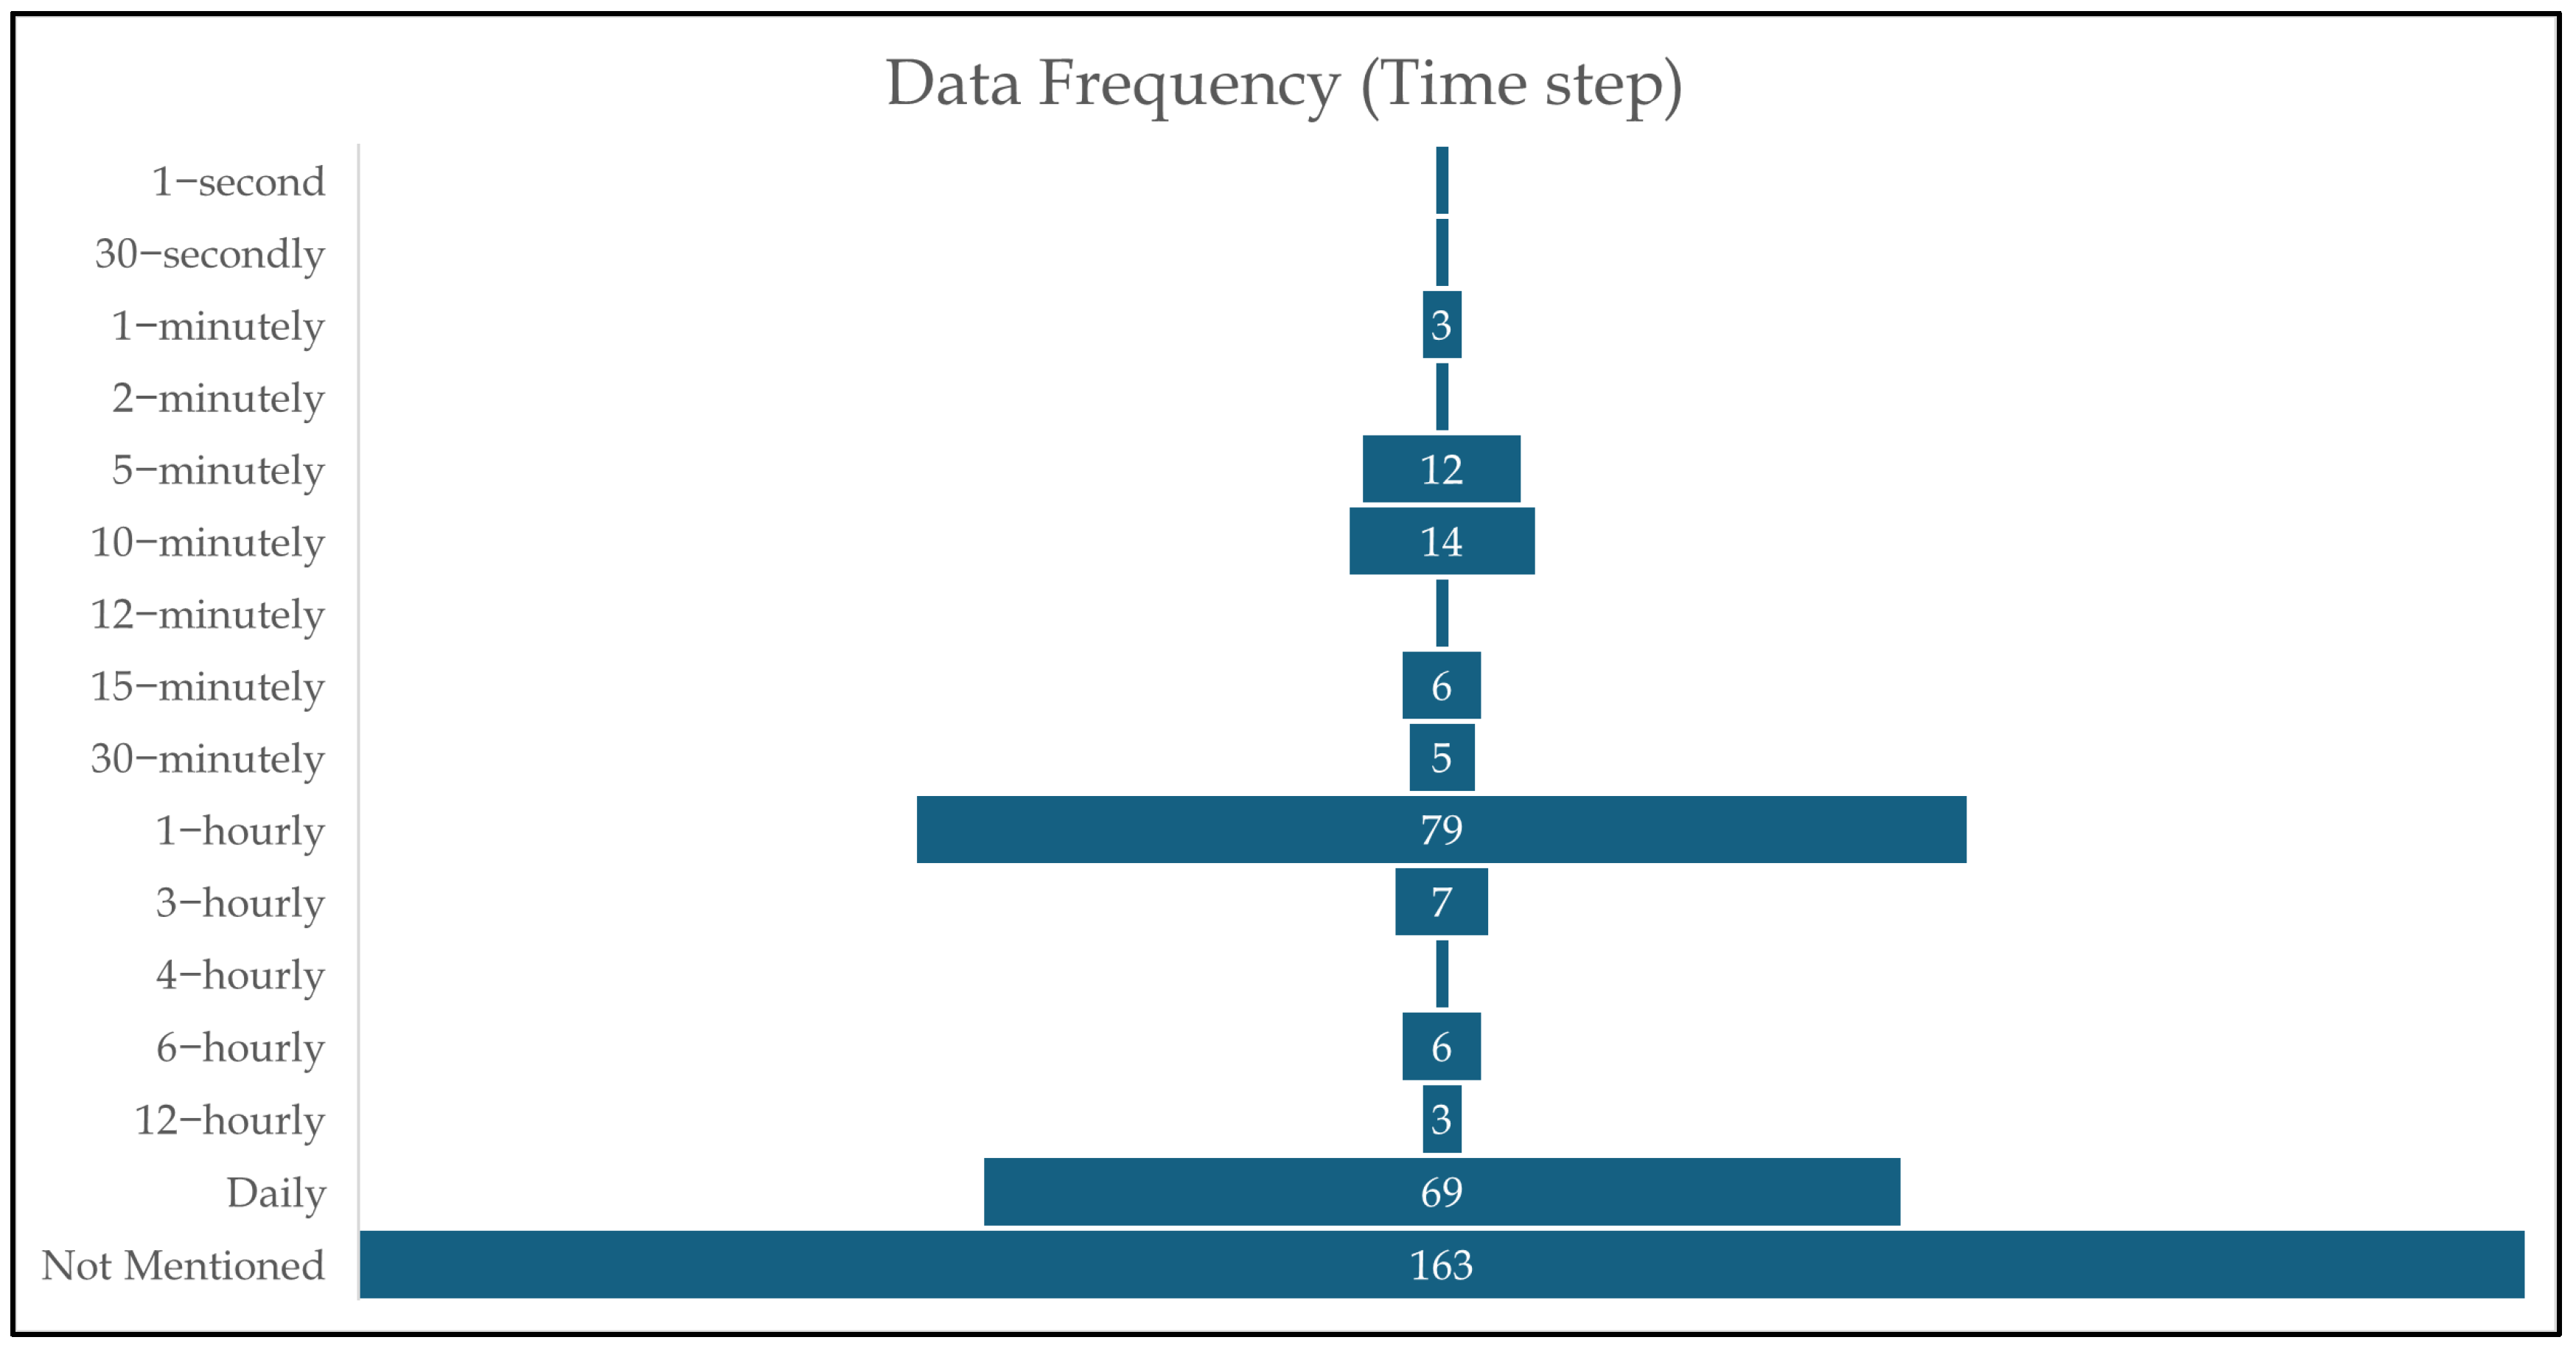
In hydrology and flood management, forecasting and prediction have distinct meanings despite being used interchangeably. Forecasting specifically calculates future values of a time series from historical and current values, with an explicit temporal dimension [78,79]. For instance, estimating river discharge 72 hour ahead using historical streamflow data constitutes forecasting. Prediction, however, is a broader term for estimating any quantity regardless of temporal context, such as determining current conditions at ungauged locations or classifying binary outcomes such as flood/no-flood conditions [78]. For example, a model that determines the flood-inundated region from the current rainfall rate and a Digital Elevation Model (DEM) can predict the flood extent without predicting what will happen in the future.
This SMS focuses primarily on flood forecasting—determining future values of hydrological variables for early warning and emergency planning. Figure 2 illustrates the key concepts in data-driven flood forecasting.

5.2. Time Step

The time step is the frequency (temporal resolution) of data sampling and model output [80], shown as intervals t−6, t−5, etc., in Figure 2. For example, if river height data are collected on a daily basis, this implies a time step of 1 day. Various hydrological processes need different time steps; flash floods in urban areas may need 15−minute intervals, whilst slower river basin responses require 6 hour, 12 hour, or daily time steps [81]. Time step selection significantly impacts model performance and computational requirements [82,83].

5.3. Forecast Horizon and Lead Time
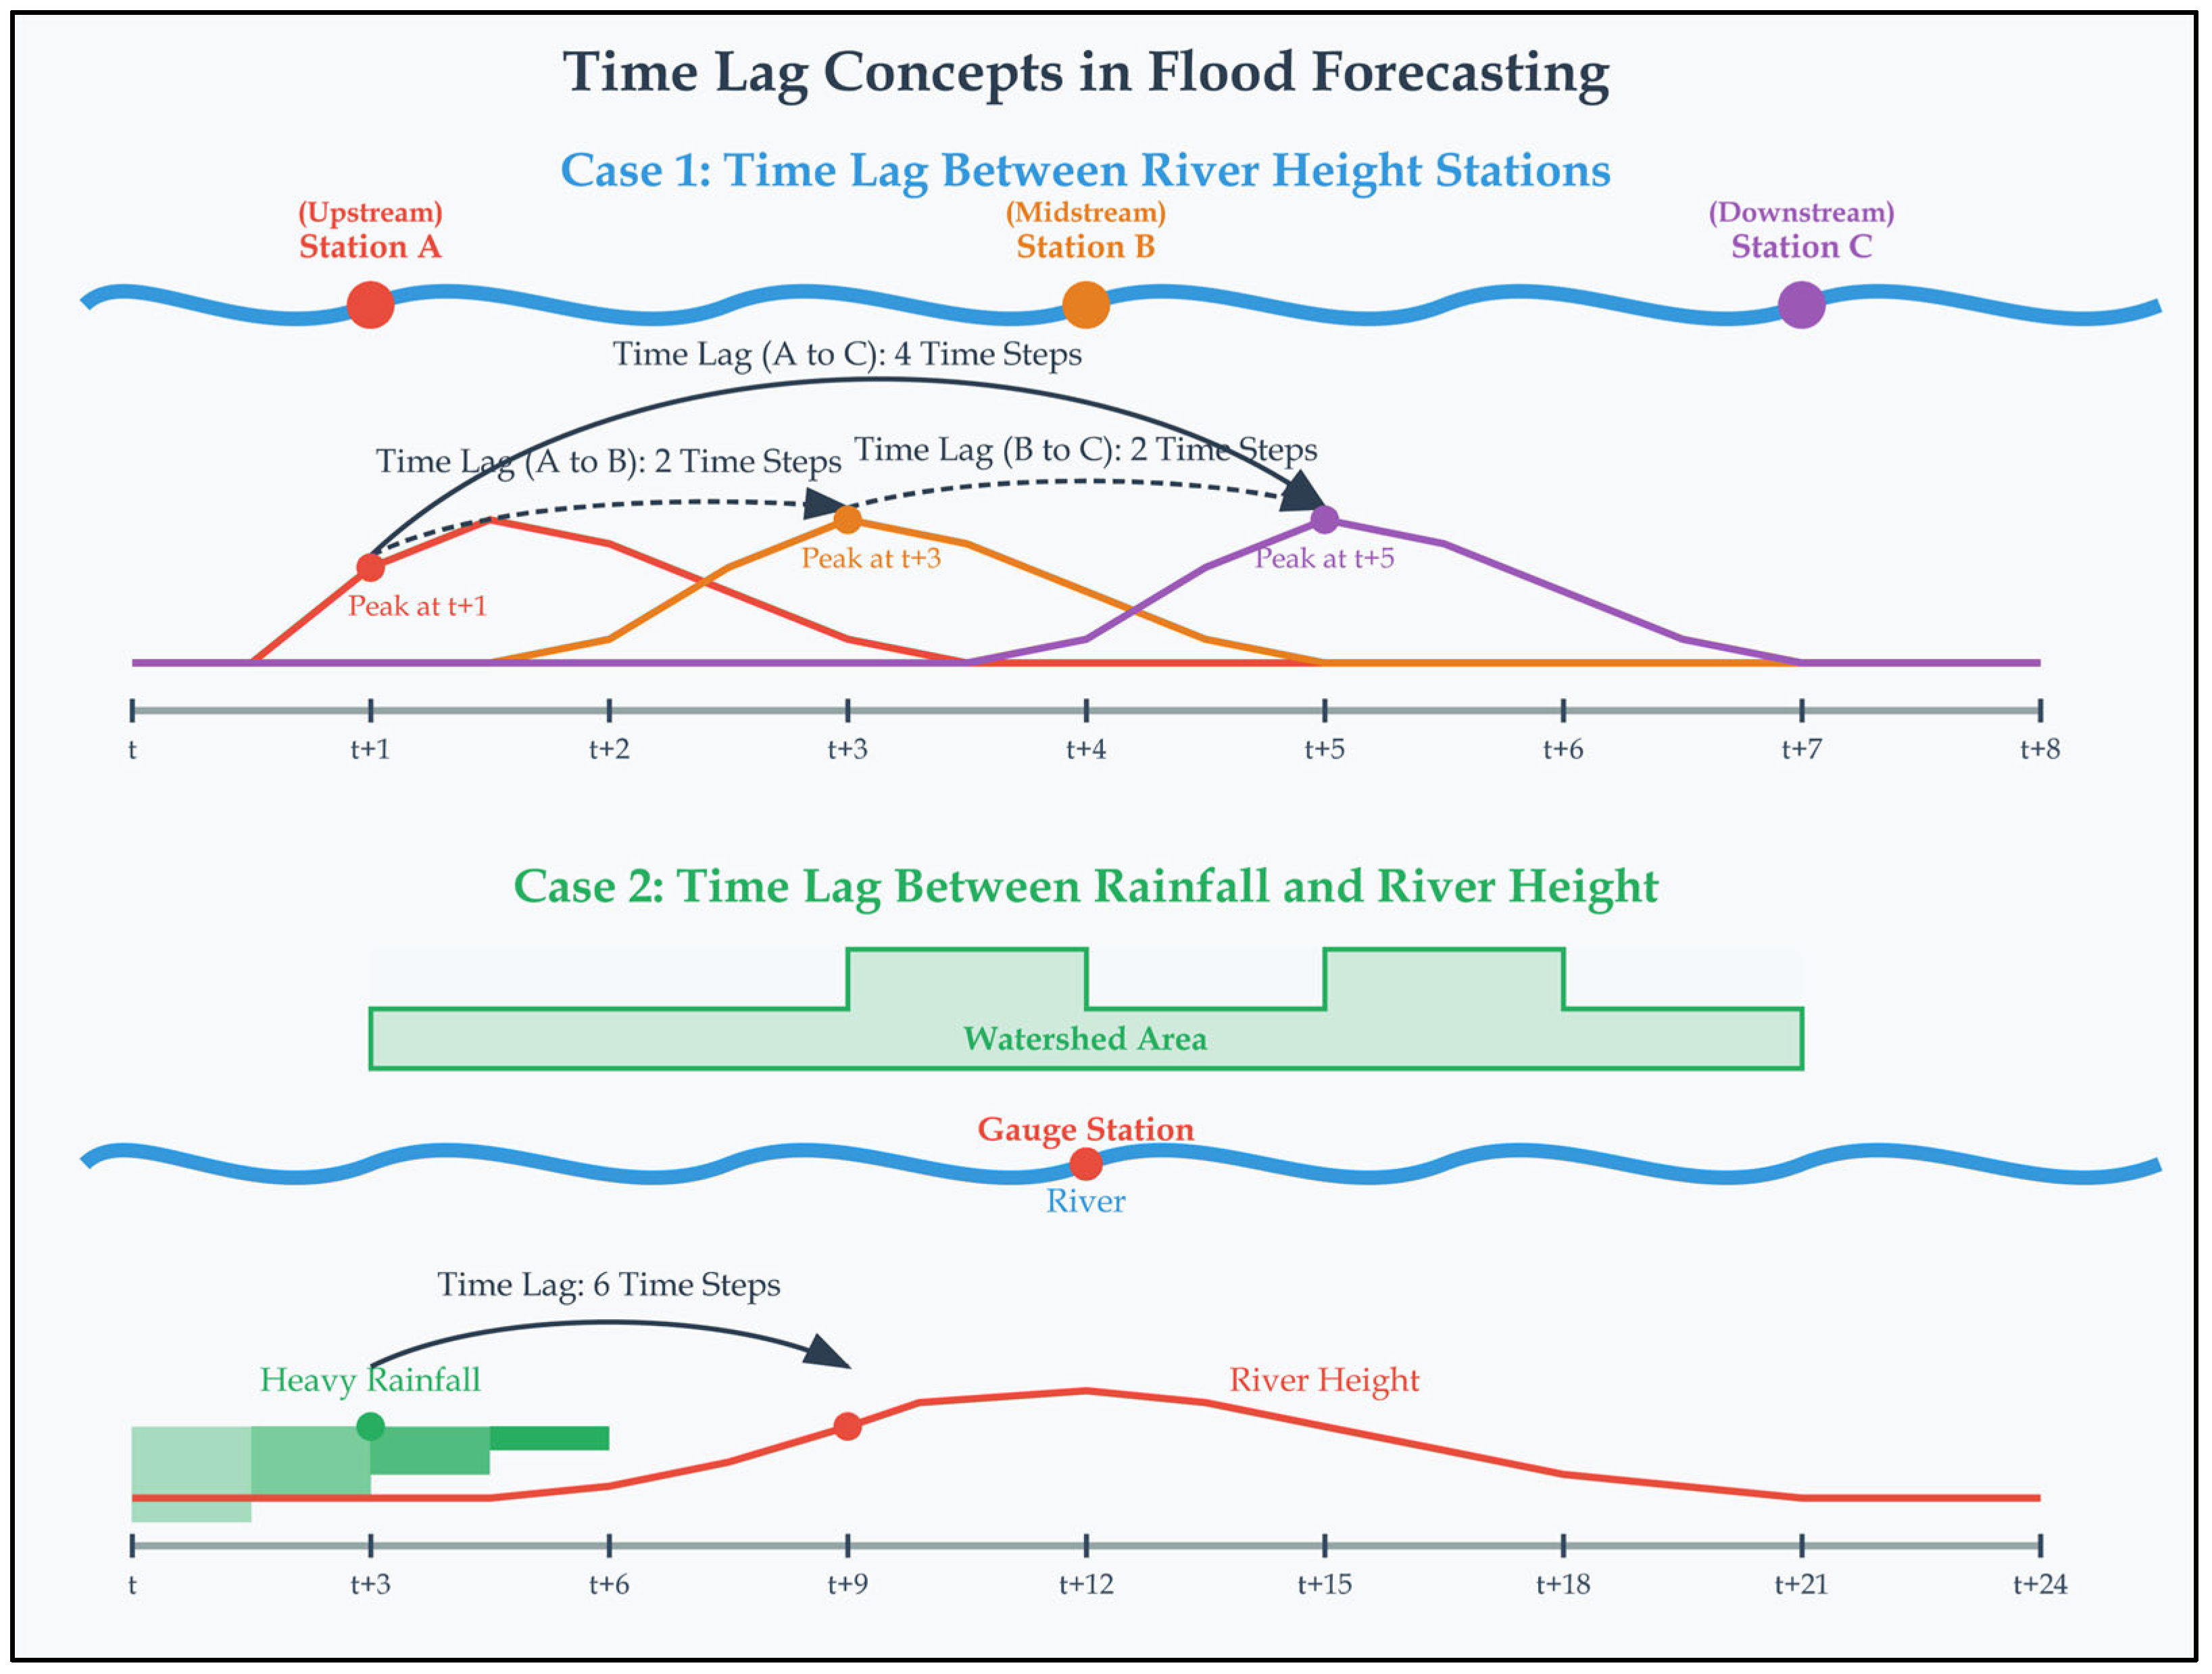
The forecast horizon is the total duration that the forecasting system predicts into the future [84]. For example, a flood forecasting system with a 5-day horizon generates forecasts covering the entire 5-day period. As shown in Figure 2, for a three-time-step forecast horizon, the forecasting system provides output covering the entire three-step-ahead period. Lead time, conversely, refers to the specific future point for which a forecast is generated, measured from the forecast production time [85]. With hourly time steps, a 12 hour lead time means forecasting 12 hour ahead. In Figure 2, lead times of 1-, 2- and 3-time steps show how far ahead each forecast is made. A study might evaluate model performance at multiple lead times (1 day, 3 days, 7 days and 10 days) within a 10-day forecast horizon. Operational flood forecasting faces a fundamental trade-off between lead time and accuracy—longer lead times provide more preparation time but typically deliver less accurate forecasts [86,87].
Multi-step forecasting is the task of forecasting for several future time steps [88,89], as shown in Figure 2, where the forecasts are created for lead times of 1-, 2-, and 3-time steps at once. This is important in flood forecasting because decision-makers need to know what the future will look like, not just one step from now, but two or three steps from now. Multi-step forecasts can be created either recursively (using previous forecasts as inputs for subsequent time steps) or directly (training models to generate outputs for several future time steps at once).

5.4. Lag Time

Lag time represents the time steps in the past used as features to forecast future values, defining the shift between input and output variables. This concept is particularly significant in flood forecasting due to delays between rainfall events and corresponding streamflow increases [90,91]. In simple terms, for example, when it rains heavily in an upstream area, it might take 3 days for that water to reach the target measurement station downstream. So, rainfall from 3 days ago might be more relevant to today’s river level than today’s rainfall. These delays are called “lag times”.
As shown in Figure 3, lag time is expressed in two crucial ways in flood forecasting: (i) the time delay between upstream and downstream river gauges [91,92] and (ii) the watershed response time, which is the time between a rainfall event and an increase in river levels [91]. For example, if heavy rainfall at 10:00 AM produces peak flow at 4:00 PM, the lag time is 6 h. Data-driven models learn these relationships using lagged features (e.g., rainfall from t−1, t−2, t−3 hour) to forecast streamflow. Proper lag time selection is crucial in flood forecasting models, with researchers employing techniques like Autocorrelation Functions (ACF) to identify optimal lag structures [93,94,95].

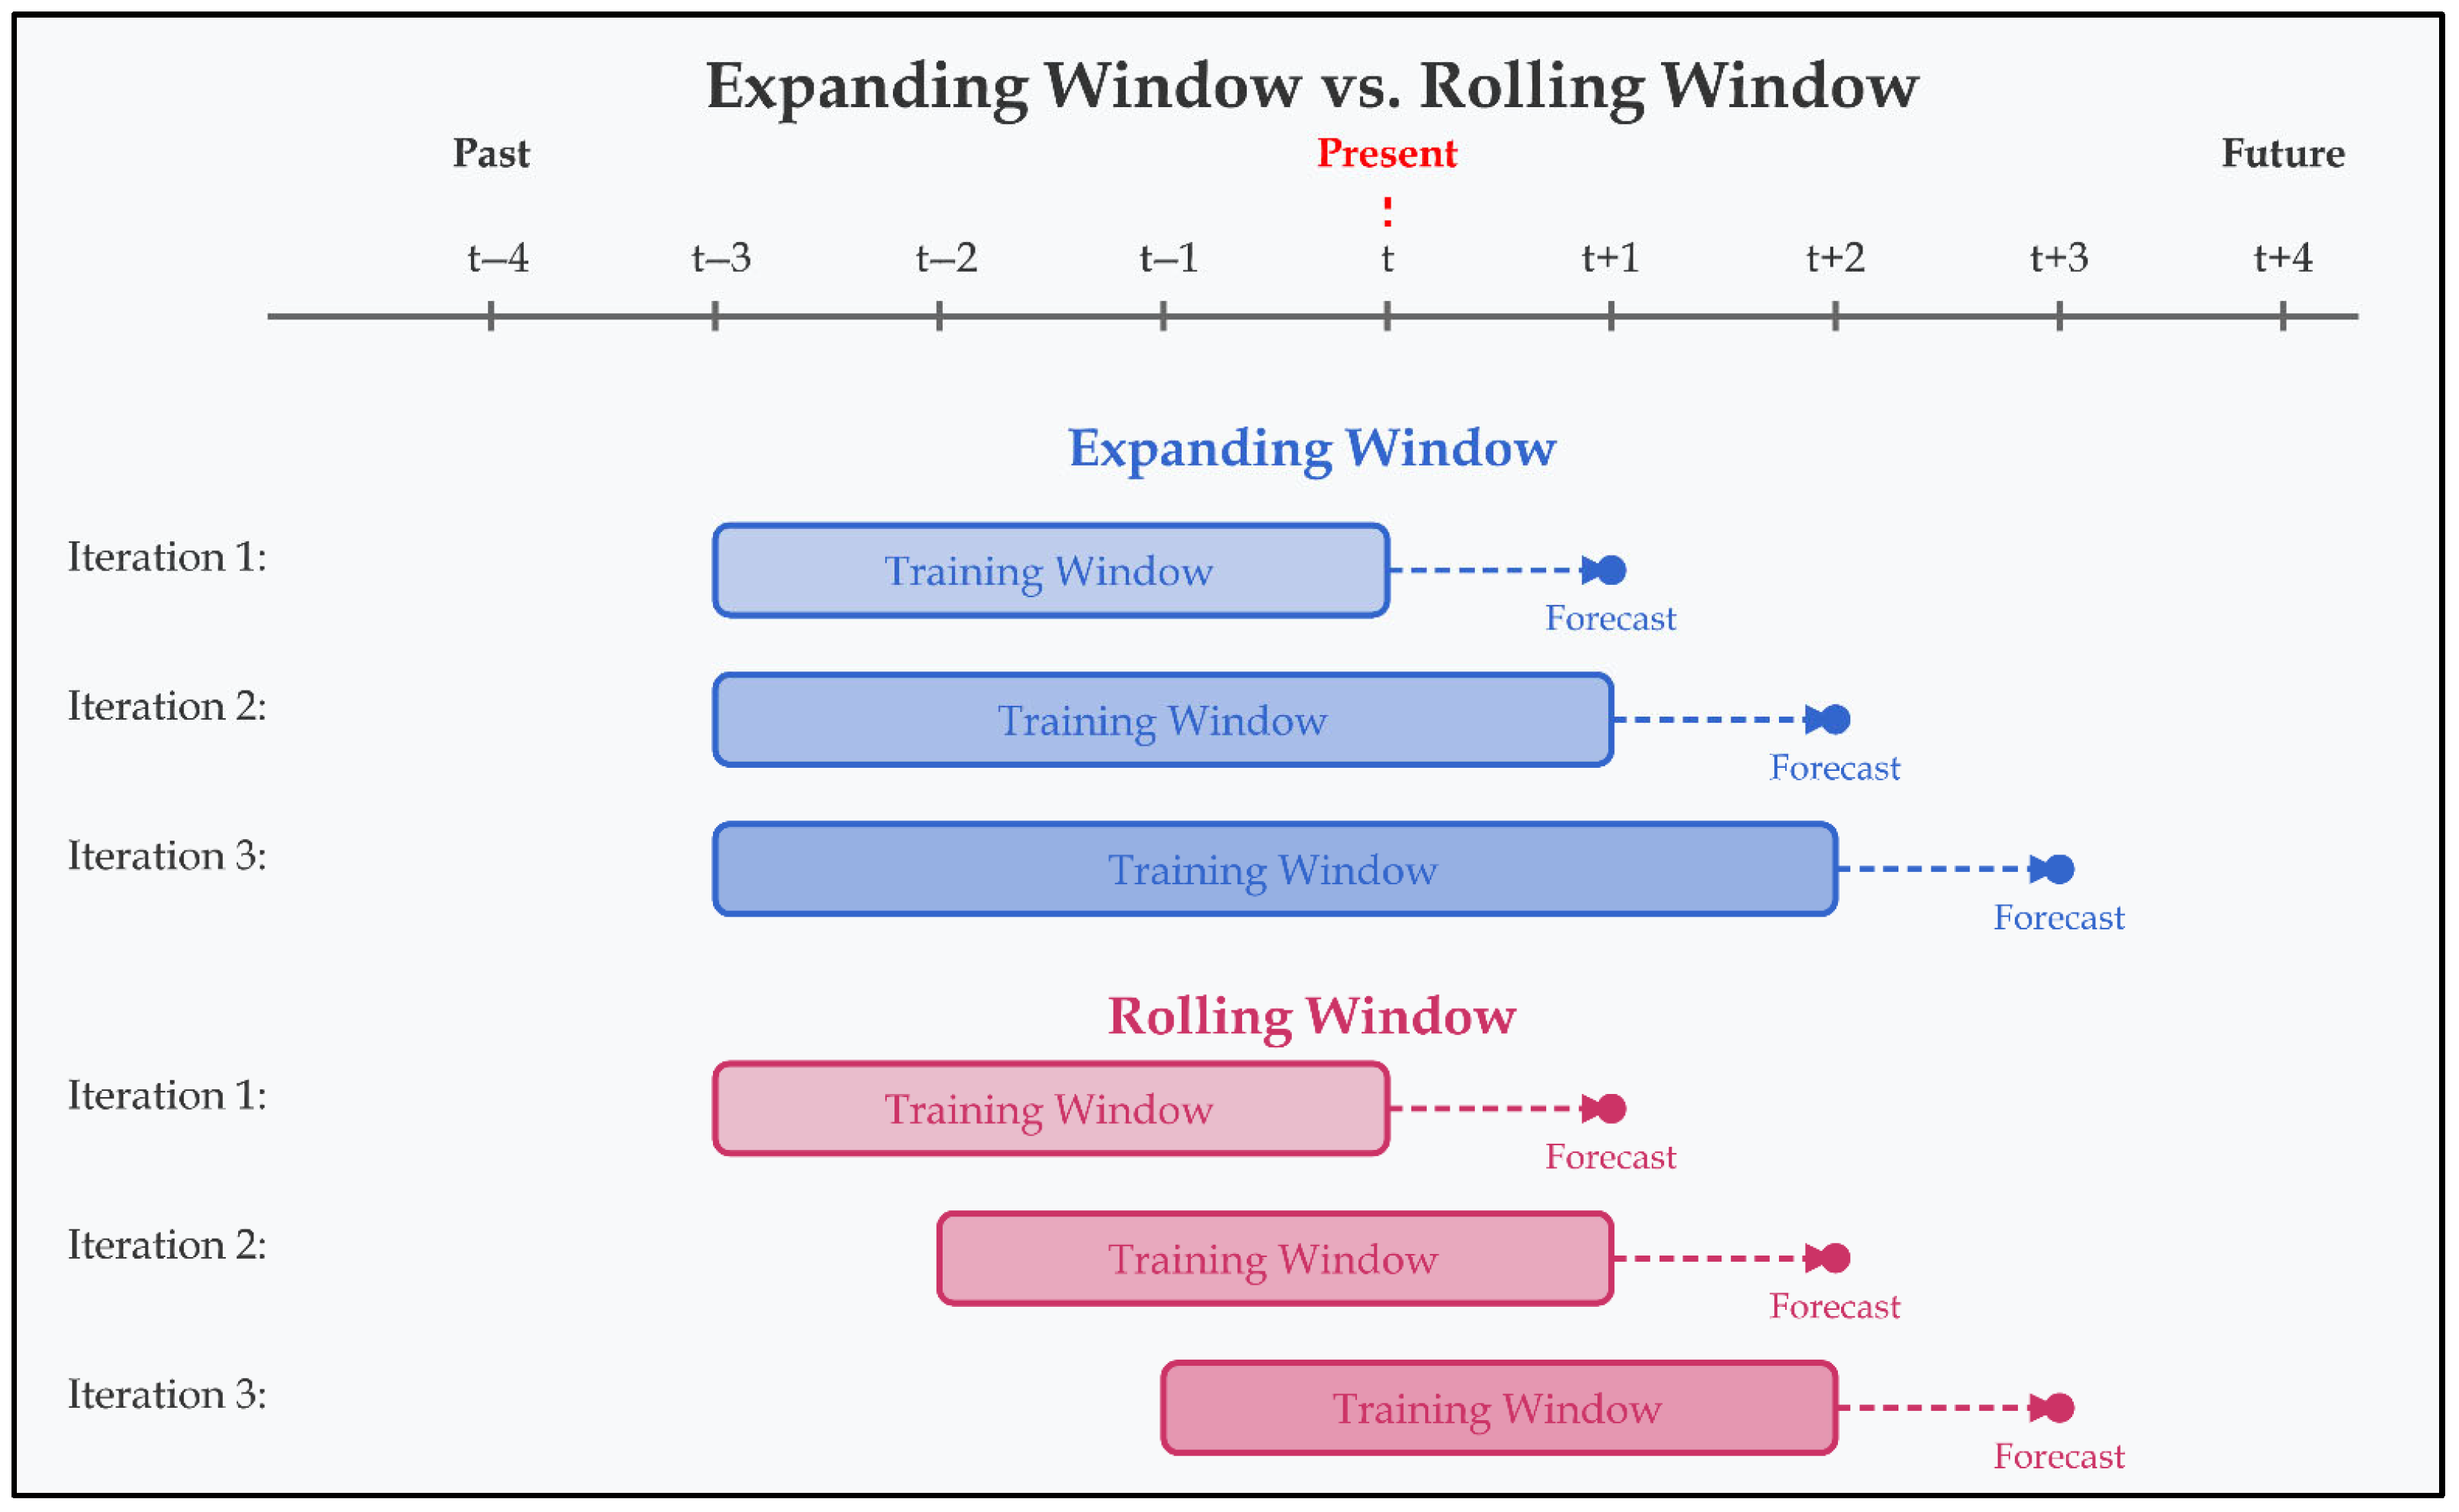
5.5. Look-Back Window (Historical Input)

The look-back window defines the historical data period used as model input for forecasting [96]. This duration significantly influences model performance, computational efficiency, and pattern recognition capabilities. Effective look-back windows for flood forecasting range from hours to weeks, depending on catchment characteristics, hydrological response time and lead times [97]. The sliding window approach implements the look-back period by using a fixed number of previous time steps as input features [98]. As illustrated in Figure 4, two main variations exist: (i) the rolling window, which has a fixed size and thus excludes the oldest observations as new ones are included [99]; (ii) the expanding window, which increases in size over time, retaining all historical observations and appending new ones [100].
The choice between approaches depends on whether recent patterns (rolling window) or long-term trends (expanding window) are more relevant to the forecasting task [101]. The sliding window technique represents a basic method for handling historical data (look-back) in forecasting models, whilst other approaches include sequence-based methods (RNNs, LSTMs, GRUs), feature-based methods (historical values as features) and hierarchical temporal approaches (multiple time scale dependencies). The sliding window technique differs from other approaches because it offers a simple method for handling historical inputs across different model architectures [101].
Understanding these fundamental concepts provides the necessary framework for analysing and comparing the various data-driven flood forecasting approaches identified in this SMS.

6. Results and Discussion

This comprehensive analysis of 363 studies provides a structured overview of the current landscape of data-driven flood forecasting research. The findings are organised according to the five identified RQs, i.e., the publication trends, geographical distribution, data characteristics, technical approaches, and evaluation metrics. For reference, a comprehensive list of abbreviations is provided in Supplementary File S2, whilst the complete mapping of all extracted data items across the 363 studies is available in Supplementary File S3.

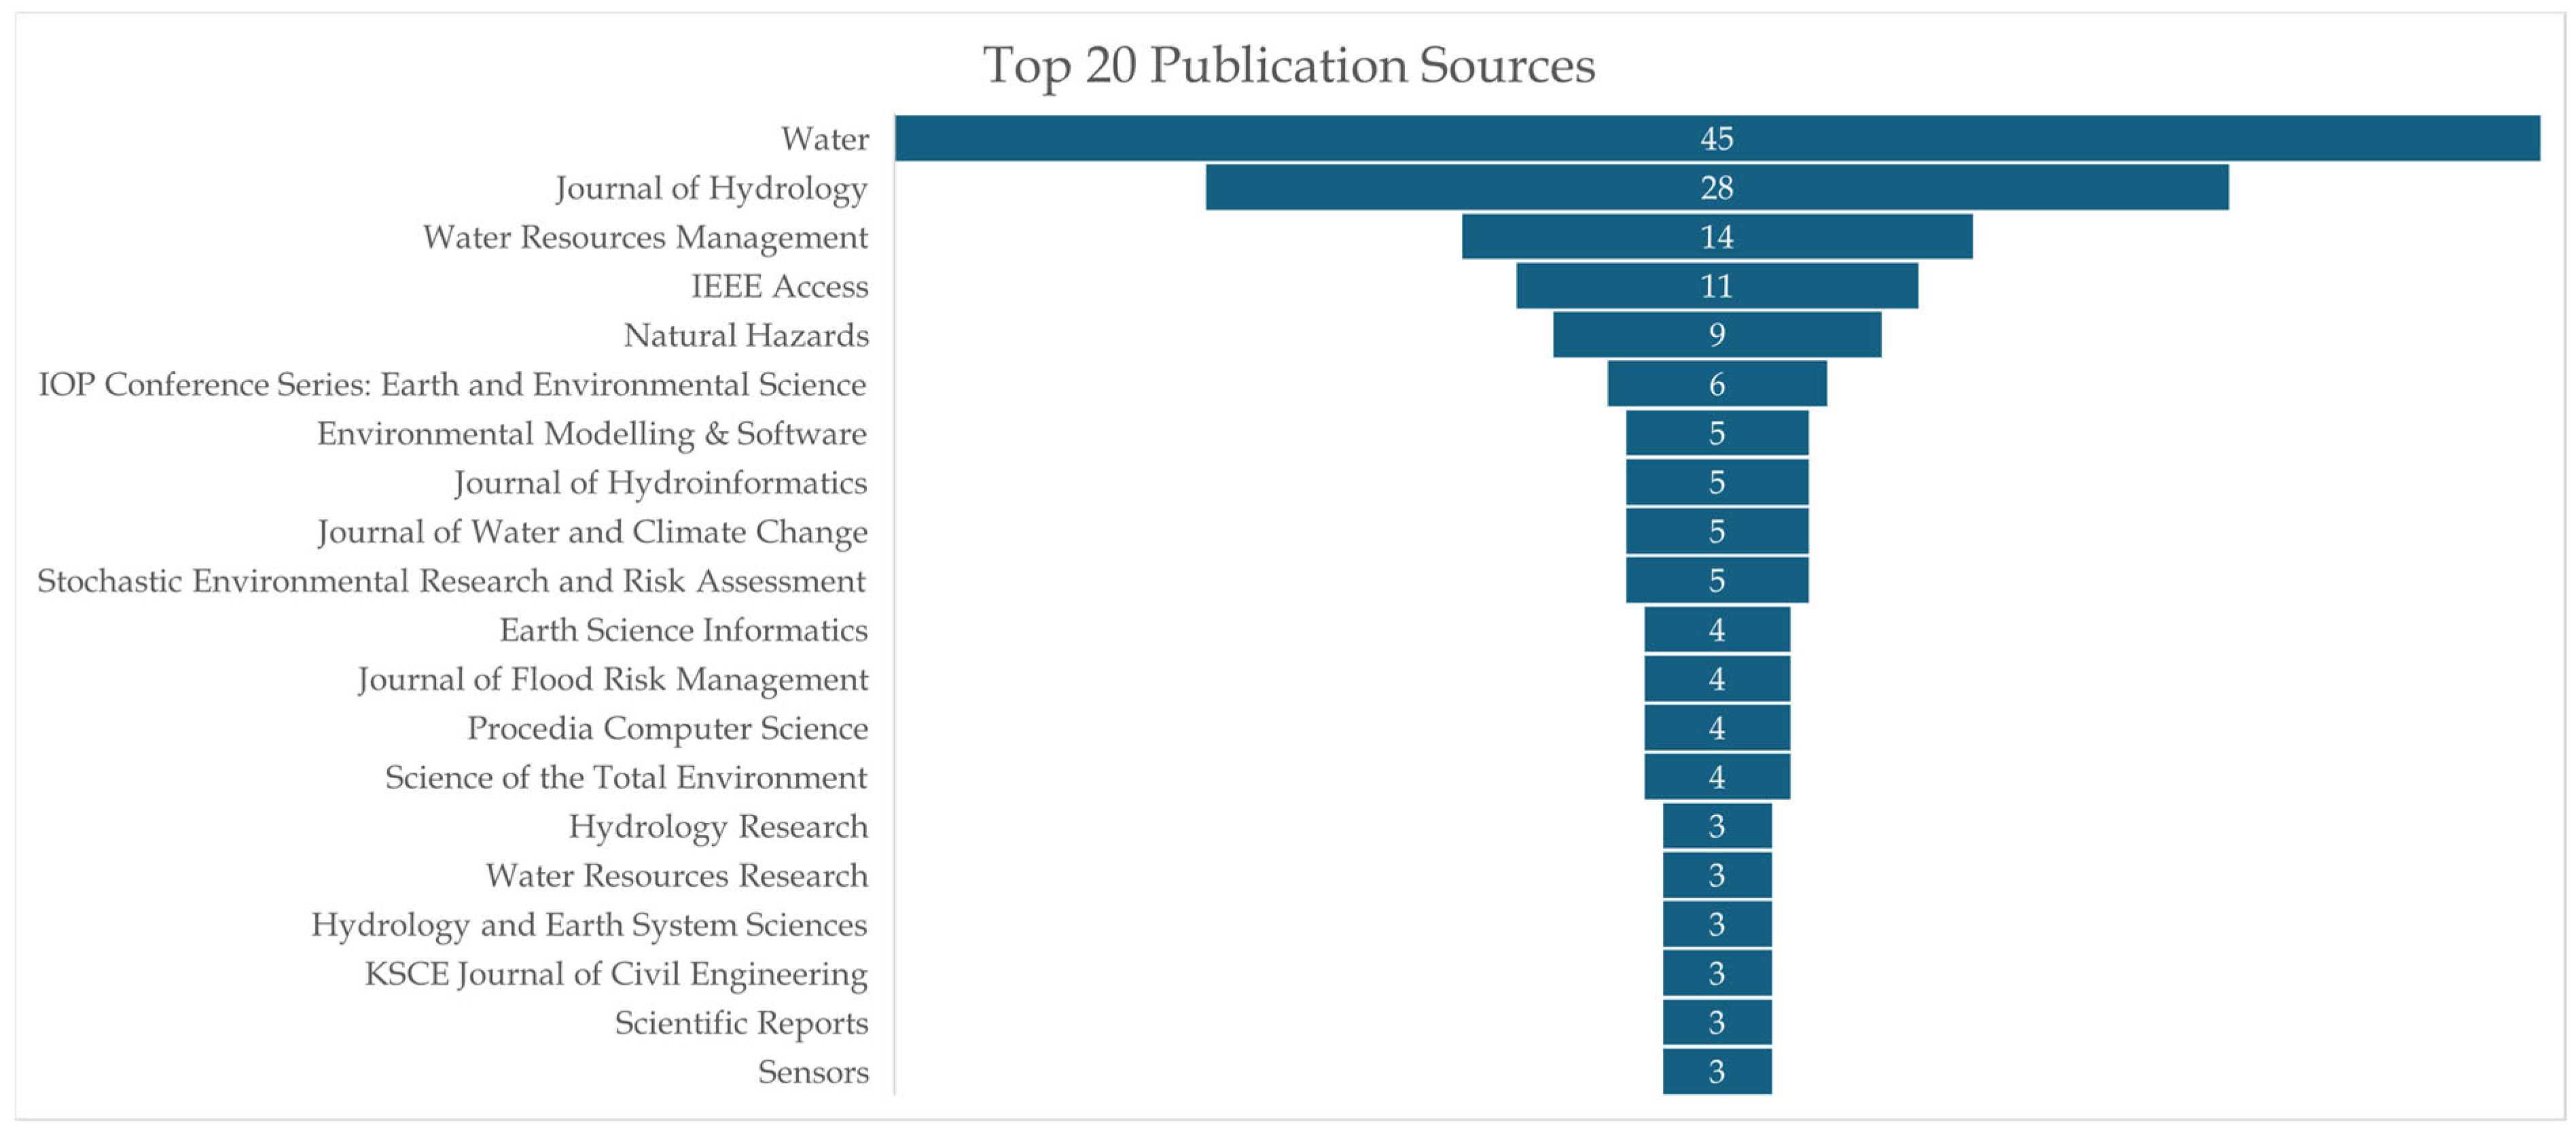
6.1. RQ1: What Are the Temporal and Types of Publication Trends?

Figure 5 illustrates the distribution of studies on data-driven flood forecasting across different publication types and years. Journals constituted 80%, conference proceedings comprised 19%, and book sections accounted for 1%. The number of publications increased from 8% in 2019 to 27% in 2024. Journal articles increased from 5% in 2019 to 24% in 2024. Conference proceedings appeared at a rate of approximately 11 publications per year, whilst book sections were present in quantities of 1–2 papers in 2019, 2021 and 2022.
Figure 6 presents the top 20 publication sources for data-driven flood forecasting research. Water accounted for 12%, followed by the Journal of Hydrology with 8%, Water Resources Management with 4%, and IEEE Access with 3%. Natural Hazards included 2%. IOP Conference Series: Earth and Environmental Science was the conference proceedings with the highest number of papers, with 2%. Four journals each contained 1%: Environmental Modelling & Software, Journal of Hydroinformatics, Journal of Water and Climate Change, and Stochastic Environmental Research and Risk Assessment.
The analysis of data-driven flood forecasting publications between 2019 and 2024 revealed distinct trends reflecting the field’s evolution and changing research priorities. The threefold growth in publications (from 29 studies in 2019 to 87 studies in 2024), with sharp increases of 72% from 2019 to 2020 and 29% from 2022 to 2023, signifies a substantial transformation in flood forecasting methodologies. This transformation represents a shift towards advanced data-driven techniques that better capture complex hydrological relationships, incorporate real-time data streams, and provide actionable forecasts with quantified uncertainty. This research acceleration aligns with transformative improvements in ML/DL architectures, increased computational resources, and higher-resolution hydrometeorological data that have collectively expanded research possibilities in this domain [70,75]. The concentration of publications in specialised water-focused journals (Water, Journal of Hydrology, and Water Resources Management) alongside computational venues like IEEE Access demonstrates the multidisciplinary nature of data-driven flood forecasting research, where hydrological expertise and computational approaches are increasingly integrated to address complex forecasting challenges.

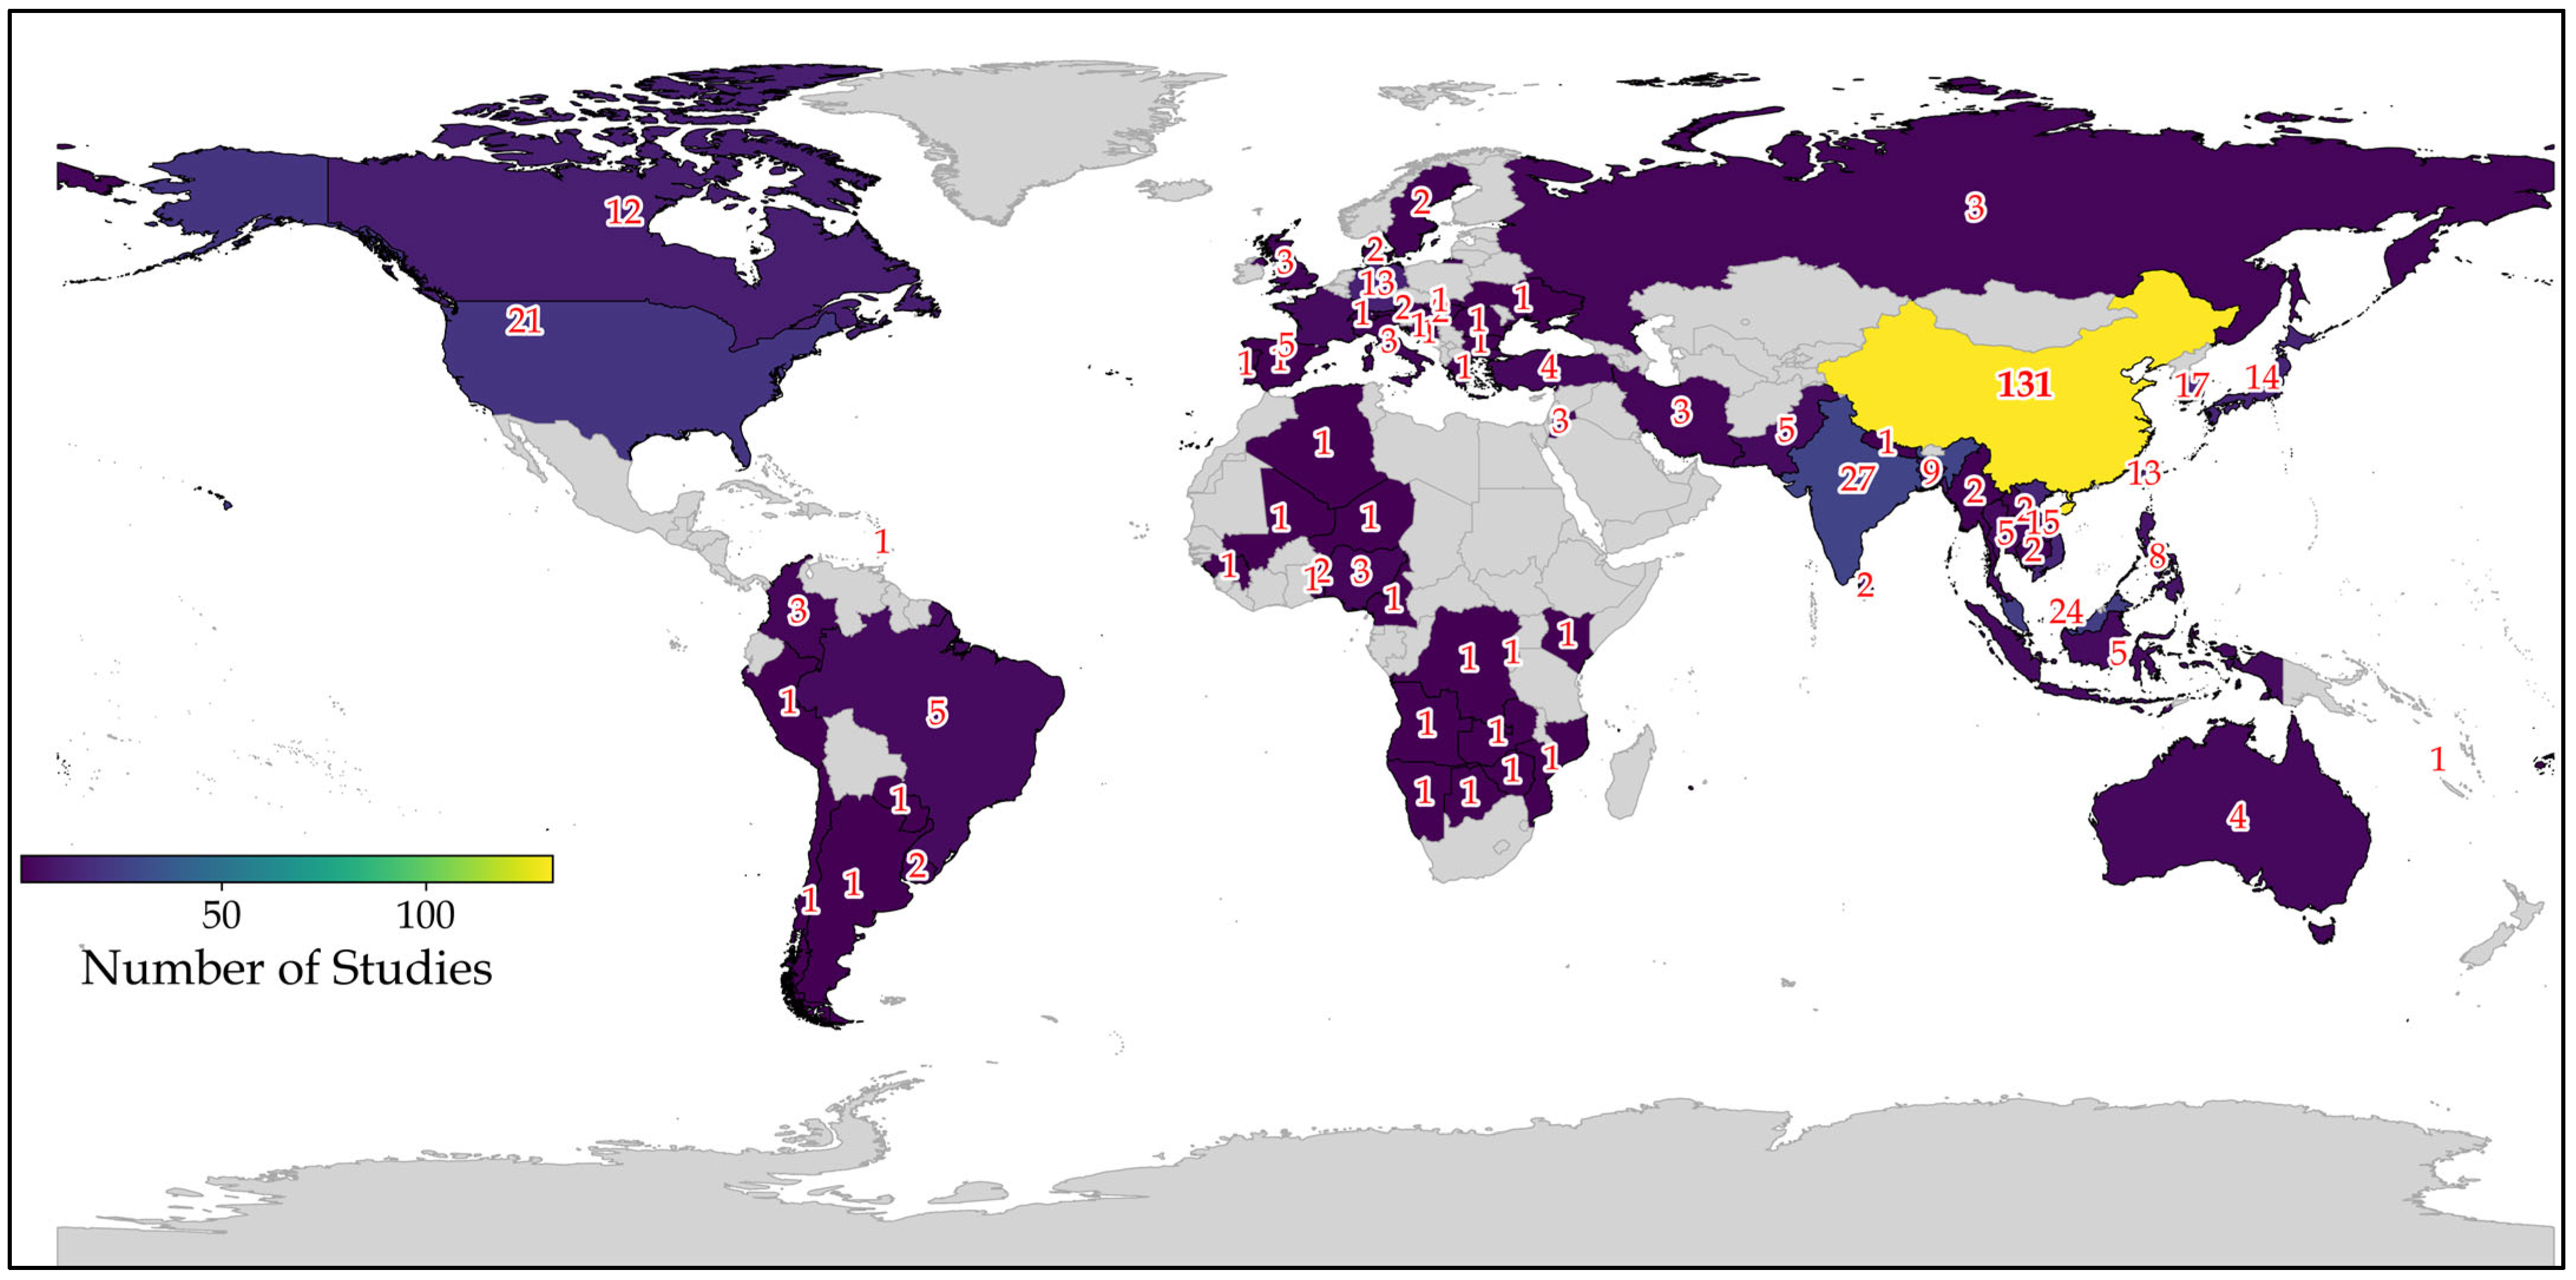
6.2. RQ2: Which Countries Were the Studies Based on?

Figure 7 illustrates the geographical distribution of data-driven flood forecasting studies conducted between 2019 and 2024. Our mapping identified studies from 70 different countries. China appeared in 131 studies (36%), followed by India (7%) and Malaysia (7%). The United States appeared in 6%, South Korea in 5%, Vietnam, Japan, Germany and Taiwan in 4%, and Canada in 3% of studies. East and Southeast Asian countries appeared in over 56% of all studies, whilst North America appeared in approximately 10% and European countries in about 8%. South America, Africa, and the Middle East appeared in fewer studies across these regions.
The geographical distribution of flood forecasting research revealed significant disparities. Whilst China leads with 36% of studies, reflecting its severe flooding challenges [102] and strategic investment in technological solutions, regions with critical flooding vulnerabilities remain underrepresented. The possible reasons for this discrepancy include: (i) limited technological infrastructure and computational resources in developing regions, where inadequate monitoring networks impede timely and accurate data collection [103], (ii) insufficient historical hydrometeorological data availability, creating barriers in data-scarce regions [104], (iii) inadequate research funding and economic disparities between nations [105,106] and (iv) fewer specialised research institutions and trained personnel in hydrological modelling and data science in less developed regions. The geographical imbalances in research suggest a great need for collaboration, capacity building, and knowledge sharing to extend the gains made in data-driven forecasting to understudied areas. Future work should also aim to equalise the global distribution of flood forecasting capabilities to enhance global flood resilience in the context of climate change through better forecasting.
Interestingly, some economically advanced regions, including North America, Australia, and parts of Europe, also show relatively low representation despite having robust technological infrastructure and research capabilities. This pattern suggests additional factors beyond resource limitations. These regions may prioritise different approaches to flood management, such as established structural measures (dams, levees) or traditional physics-based hydrological models with longer institutional histories. Another possibility is that flood risk management in these regions may be more distributed across multiple disciplinary boundaries (urban planning, civil engineering, environmental management) rather than being specifically concentrated in data-driven forecasting research. Long-established legacy systems and institutional practices may also create resistance to adopting newer data-driven approaches despite their potential benefits. Understanding these different regional priorities could help identify complementary strengths across global flood management approaches and inform more comprehensive strategies.
Regarding specific river basins, within Chinese water bodies, the Tunxi River Basin appears in 14 studies, the Changhua River Basin in 13, and the Yangtze River Basin in 11 studies. Transboundary river systems include the Jhelum River, Kelantan River, and Red River Basin (6 studies each), followed by the Brahmaputra and Ganges Rivers (5 studies each). These water bodies are associated with significant flood risk.

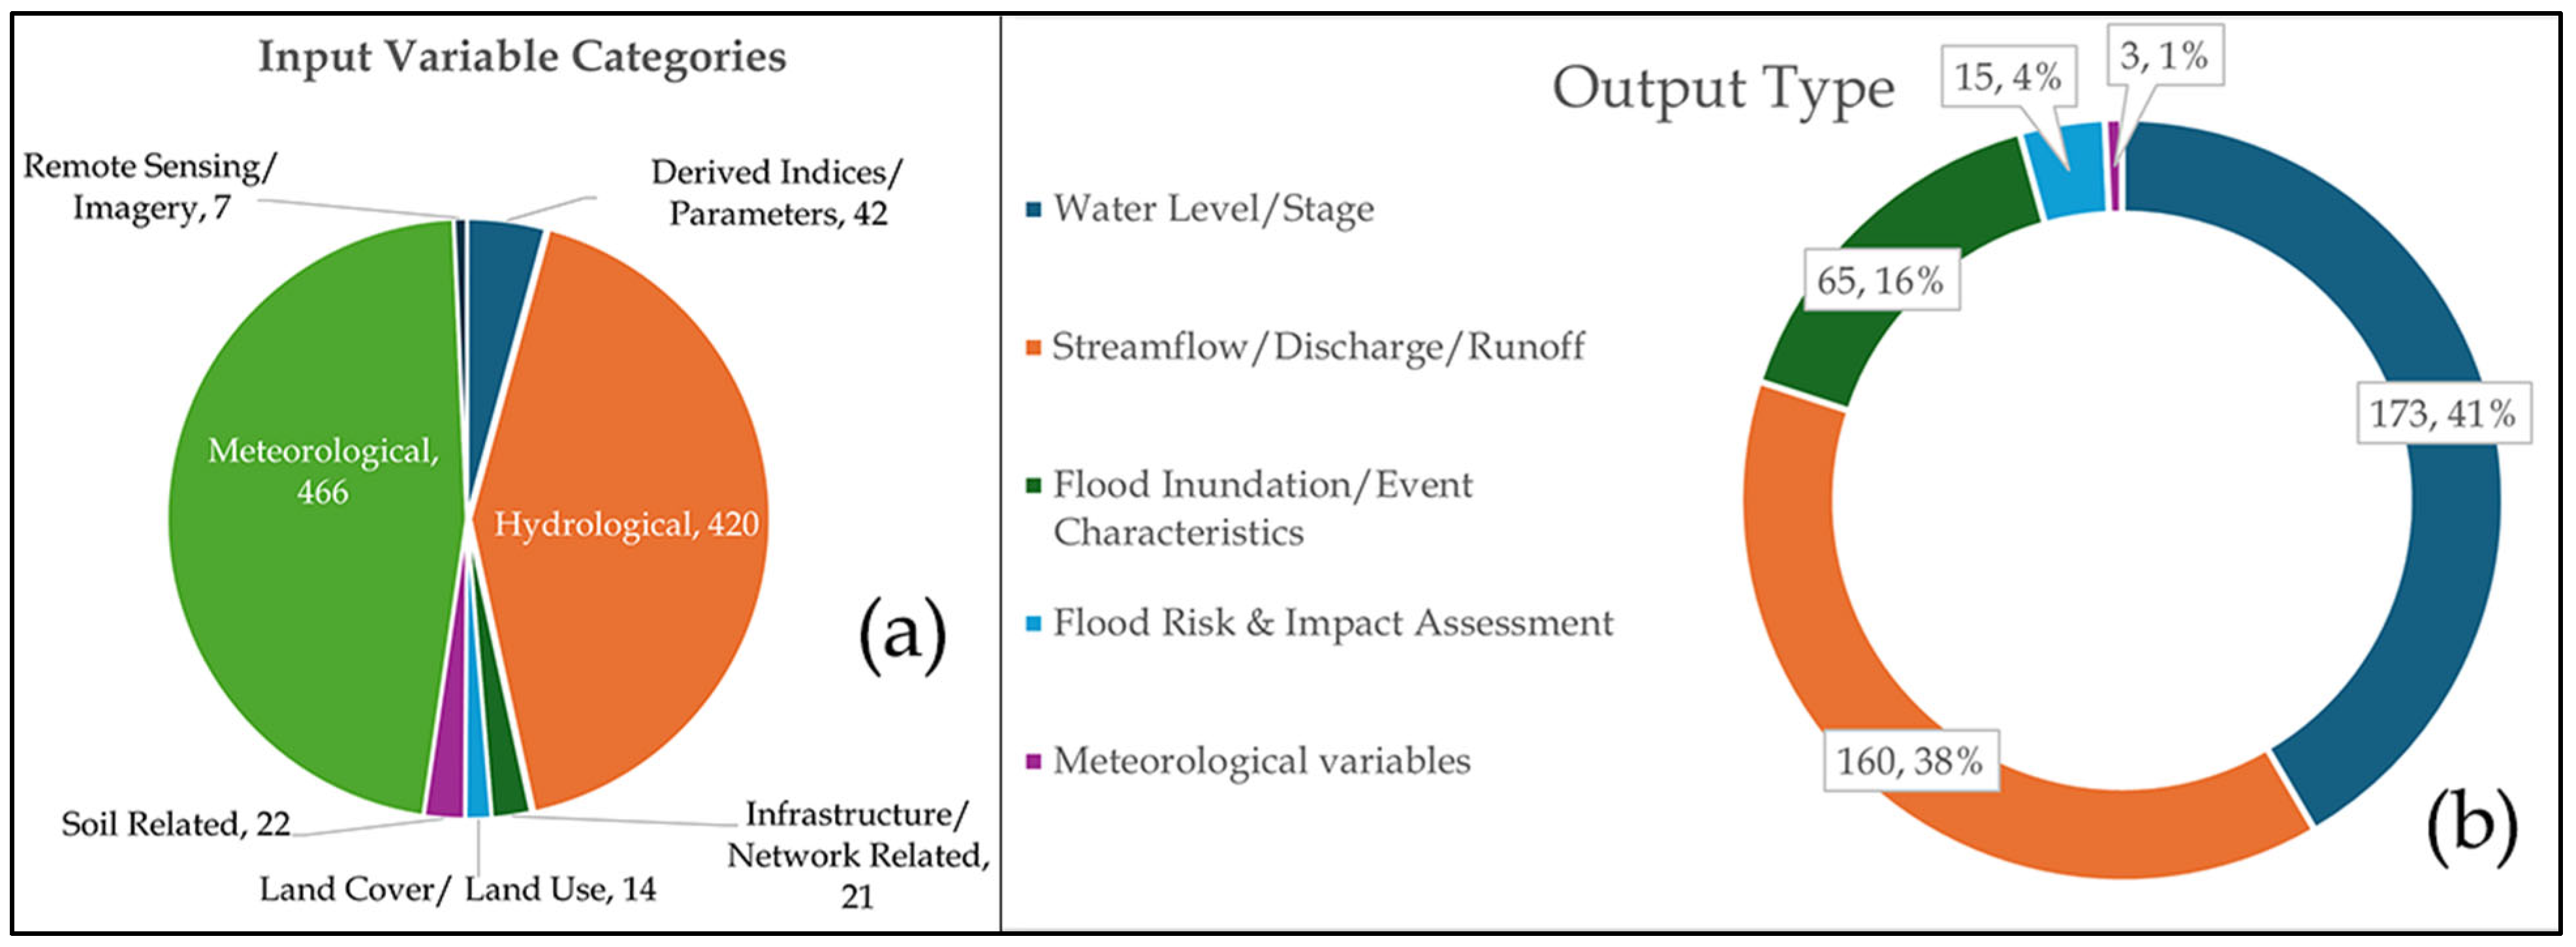
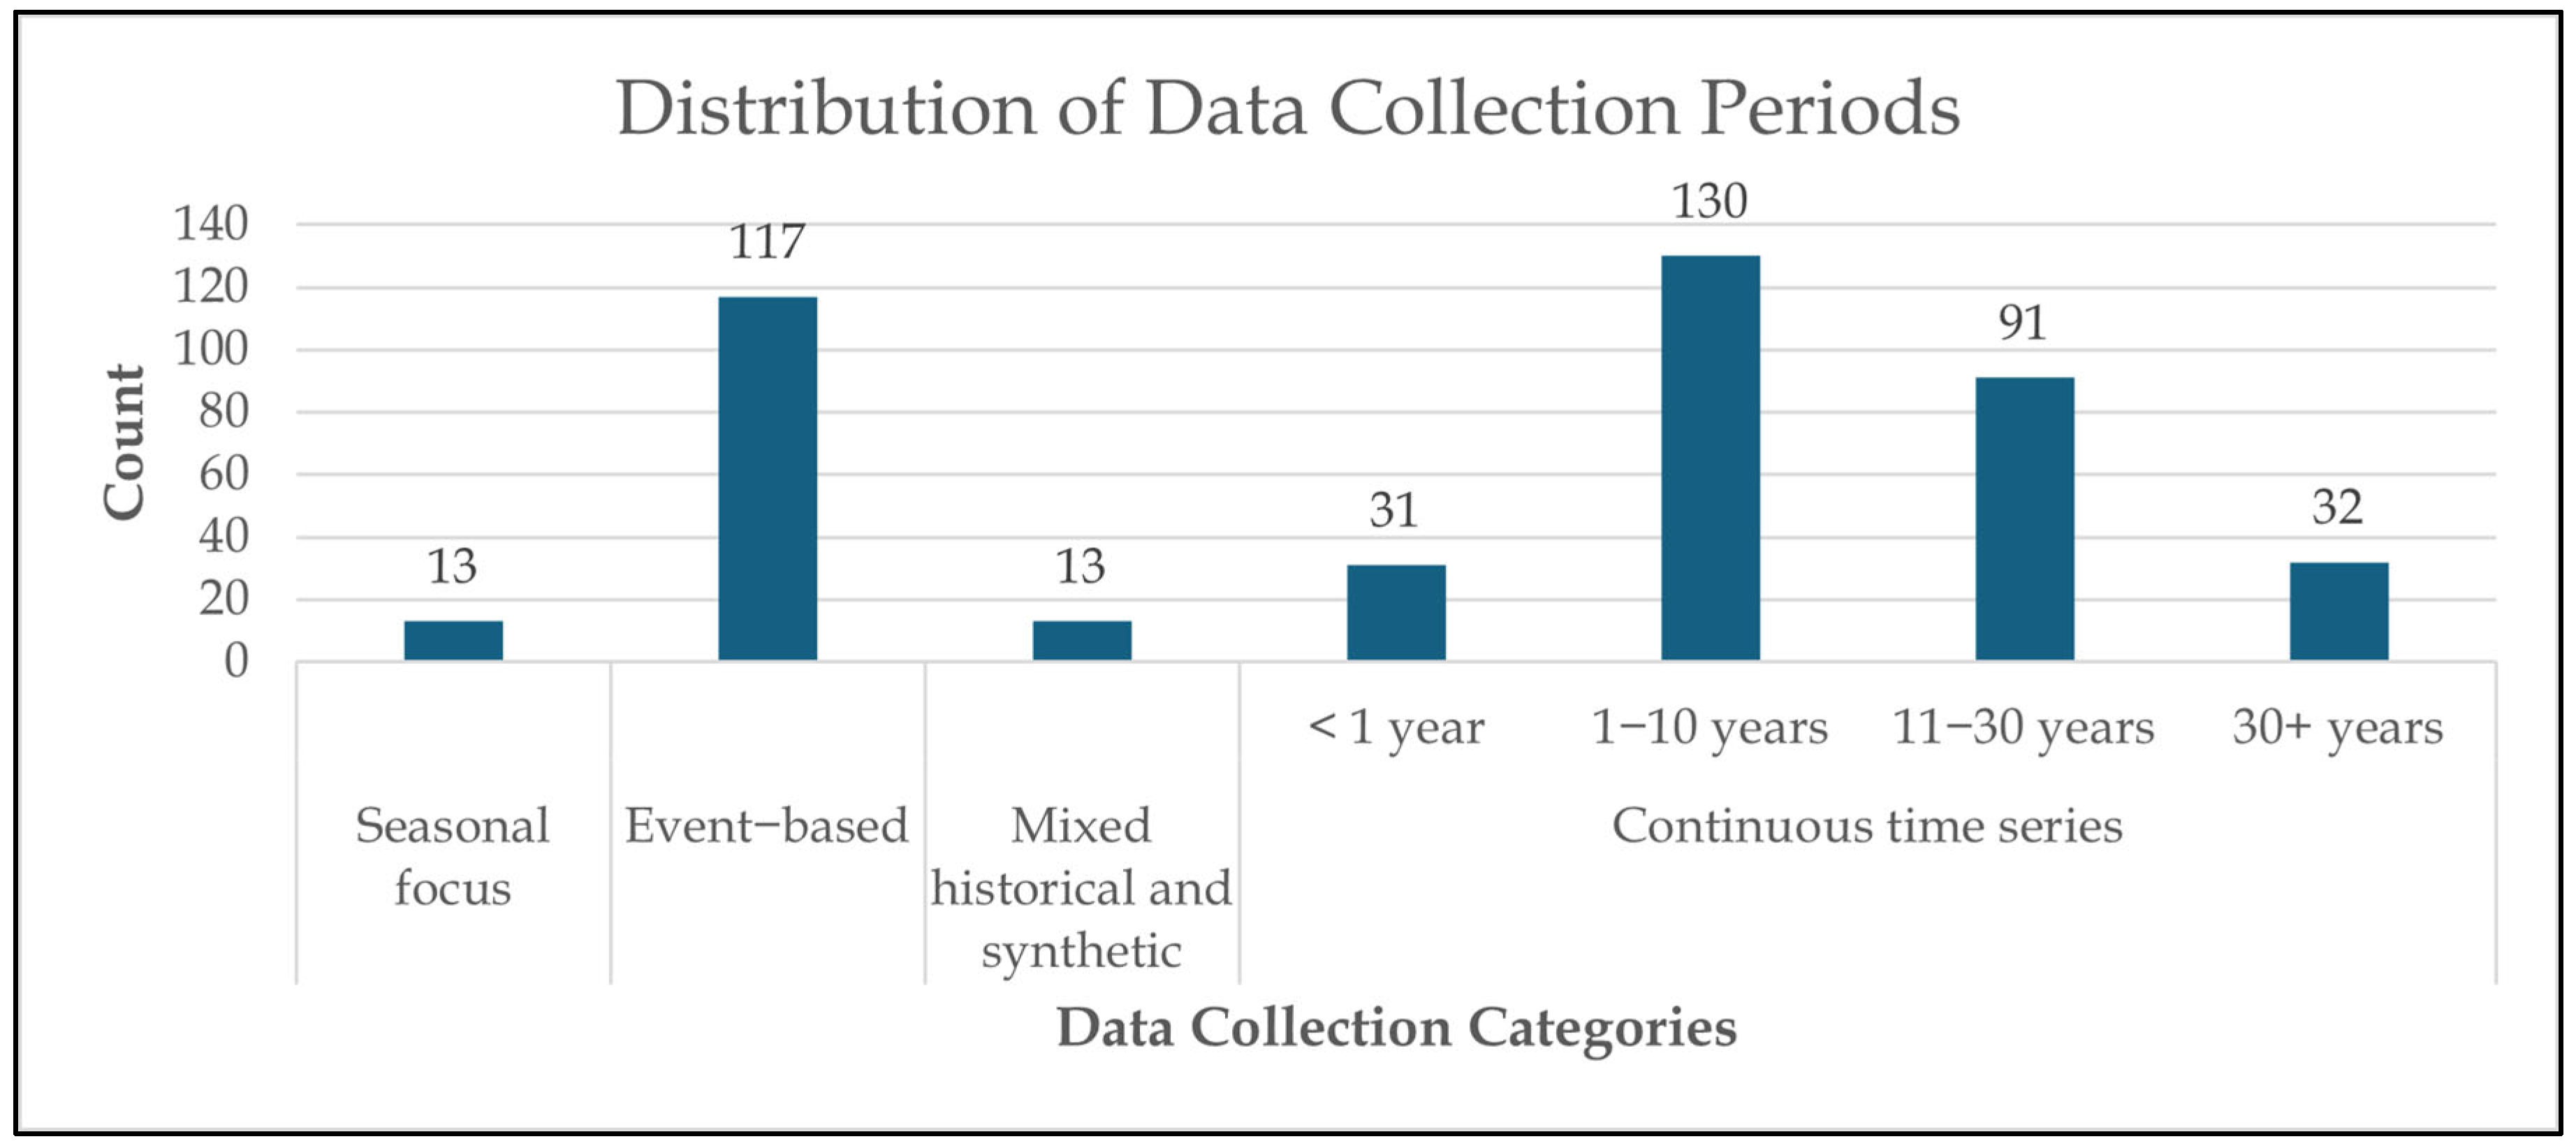
6.3. RQ3: What Input Factors, Output Variables, Data Sources, Collection Periods, and Temporal Resolutions Were Utilised in Flood Forecasting Studies?

The input variables used in data-driven flood forecasting models included meteorological and hydrological factors, which collectively appeared in approximately 76% of all inputs. As shown in Figure 8a, meteorological inputs (466) included rainfall/precipitation variables, and hydrological inputs (420) included water level measurements. Geographic/spatial/terrain variables appeared in 69 cases, event-specific variables in 46 cases, and derived indices/parameters in 42 cases. Infrastructure/network, soil, and remote sensing variables appeared in fewer cases. Regarding data sources, government hydrological agencies were used in 67% of flood forecasting studies, weather agency data in 42%, satellite-derived data in 29%, and multiple data sources in 33%. Crowd-sourced data appeared in 3% of studies and social media in 2%. Output variables across the 363 studies included Water Level/Stage forecasting (41%), Streamflow/Discharge/Runoff (38%), Flood Inundation/Event Characteristics (16%), Flood Risk and Impact Assessment (4%), and Meteorological variables (1%). Figure 8b shows the distribution of various outputs in the selected studies.
Rainfall and water level measurements (height, discharge and runoff) provide direct indicators of potential flooding conditions, making them essential inputs for training forecasting models. This predominance demonstrates that data-driven approaches can effectively capture flood dynamics using primarily these core hydrometeorological variables without requiring extensive additional parameters. The strong relationship between these variables and flood events makes them reliable predictors across diverse geographical and hydrological contexts. Geographic/spatial/terrain, soil-related, and land use/land cover variables were typically employed in hybrid approaches, where physics-based models generated simulation data that fed into data-driven models. The predominance of Water Level/Stage and Streamflow/Runoff outputs (collectively 80%) in data-driven flood forecasting studies indicates a strong focus on fundamental hydrological parameters critical for operational flood management. These metrics offer direct, quantifiable measurements that can be continuously monitored and forecasted, aligning with the operational needs of early warning systems and flood response planning.
Figure 9 illustrates the distribution of data collection periods across the studies. Continuous time series approaches appeared in 67% of studies, with 1–10 years occurring in the highest percentage. Event-based methods appeared in 27% of studies, whilst seasonal focus and mixed historical-synthetic approaches appeared in 3% of studies. The predominance of continuous time series over event-based approaches in data-driven flood forecasting reflects researchers’ preference for comprehensive temporal patterns that capture normal and extreme conditions. The popularity of 1–10-year collection periods balance data sufficiency with computational feasibility, whilst the limited utilisation of very long-term data (>30 years, only 7%) represents a missed opportunity to incorporate climate variability patterns. This underutilisation likely stems from the limited availability of consistent historical records in many regions and challenges in data quality control across extended timeframes.
The distribution of data collection frequency (time step) included various temporal resolutions (Figure 10). Hourly data collection appeared in 79 cases, and daily observations in 69 cases. For example, 10-minute intervals appeared in 13 cases, 15−minute intervals in 6 cases, and 5−minute intervals in 12 cases. Other time steps, including 4-hourly, 12−minutely, 2−minutely, 30−secondly, and 1−second intervals, appeared in one study each.
An inverse relationship emerges between temporal resolution and historical depth; studies with finer temporal granularity (minutes/hourly) typically employed shorter historical records, whilst coarser resolutions (daily) incorporated longer periods. This pattern stems from computational constraints and the relative recency of high-frequency data collection infrastructure. Indeed, high-resolution temporal data (hourly or sub-hourly) remains unavailable in many regions due to technical limitations in sensor networks, telemetry systems, and data storage infrastructure, particularly in developing countries or remote areas. The prevalence of hourly and daily time steps reflects a practical compromise between detail and manageability, with application context determining appropriate resolution; urban watersheds require finer resolution (5–15 min) to capture rapid responses, whilst larger basins can be effectively modelled with coarser intervals. Future research opportunities include developing data reconstruction techniques for extending limited historical records, creating infrastructure-appropriate models for regions with sparse monitoring networks, and implementing adaptive time-stepping approaches that vary resolution based on hydrological conditions.
Despite the critical role of temporal relationships in flood forecasting, surprisingly few studies (<5%) explicitly incorporated lag time concepts in preprocessing workflows. Whilst advanced DL architectures can extract these dependencies, explicit preprocessing with appropriate lag structures offers dual advantages: reduced computational complexity and enhanced model performance [29,107]. The studies that utilised lag time concepts demonstrated that incorporating catchment response time knowledge enables more efficient modelling of rainfall-runoff relationships. Similarly, remote sensing/imagery inputs remained underutilised despite their potential for providing crucial spatial flood information, especially in data-scarce regions. Although satellite data integration shows promising growth [108,109,110,111], the field would benefit from formalised methodologies for integrating multi-source remote sensing data (such as satellite imagery, radar, and LiDAR) with ground-based measurements, particularly addressing challenges in temporal alignment, spatial resolution reconciliation, and quality control across these diverse data streams.

6.4. RQ4: What Algorithms Were Implemented in the Studies?

After analysing all the selected papers, we were able to summarise the flood forecasting landscape into a comprehensive taxonomic framework (Figure 11). This taxonomy identifies four fundamental methodologies—physics-based, data-driven, hybrid, and ensemble approaches, with distinct enhancement techniques. Hybrid approaches manifested in two key strategies: physics-based and data-driven integrations and multiple data-driven combinations. The ensemble approach aggregated multiple model forecasts, improving accuracy and quantifying uncertainty. These primary approaches could be enhanced through specialised techniques addressing various forecasting challenges: temporal considerations (time-lag incorporation), spatial considerations (graph-based modelling), architectural elements (attention mechanisms), uncertainty quantification methods, and transfer learning. This framework provides a structured understanding of the methodological diversity in flood forecasting research.
Building on this taxonomic framework, Figure 12 illustrates the operational workflow implementing these approaches in flood forecasting systems. The physics-based pathway (purple) follows a structured sequence from basin physical data collection through model setup and calibration. The data-driven approach (green) processes meteorological and hydrological time series through cleaning, normalisation, and feature engineering before model training and optimisation. The diagram shows hybrid implementations: physics-based and data-driven integration (black) and multiple data-driven component combinations (yellow). The ensemble approach (blue) aggregates forecasts from multiple models using techniques like bagging, boosting, and stacking. In addition, transfer learning (red) leverages pre-trained models from different contexts to enhance performance in new regions or scenarios. These implementation workflows demonstrate how the fundamental approaches from our taxonomy materialise in practical flood forecasting systems. All pathways ultimately converge to generate the final flood forecast, which can be used for inundation mapping and emergency response planning. This comprehensive framework demonstrates how different modelling philosophies can be operationalised in flood forecasting systems, allowing practitioners to select approaches based on data availability, computational resources, and specific forecasting objectives.
Beyond the specific technical implementations, our analysis revealed three distinct temporal approaches to flood forecasting. (i) Event-based forecasting focused exclusively on specific flood events or extreme rainfall episodes. For example, research conducted by Liu, Xie, Li, Hu, Jiang, Li and Song [26] isolated 18 major flood events between 2016 and 2019 with a total of 5–7 days of pre-event and post-event data or research by Liu et al. [112] utilised data from 8 historical rainfall events from 2008 to 2018 for forecasting. (ii) Seasonal-based forecasting targeted recurring hydrological patterns during specific annual periods, such as models developed exclusively for monsoon seasons across multiple years. For example, Wang et al. [113] applied their research for the June–September period using 2007–2019 data and Tiu et al. [114] for the November–February period using 1996–2016 data. This approach optimised predictions for the most flood-prone periods when operational forecasting was most critical. (iii) Continuous forecasting, the most comprehensive approach, maintained ongoing predictions regardless of hydrological conditions, training models on complete time series to capture the full spectrum of river behaviour. Whilst continuous approaches proved most common in our analysis, each approach offered distinct advantages depending on the forecasting objective, with event-based models often showing superior performance for extreme events despite their limited temporal scope.

6.4.1. Data Preprocessing

For the imputation of missing data, linear interpolation appeared in 16 implementations, mean value imputation in four, and median imputation in three implementations. K-Nearest Neighbours (KNN) and linear extrapolation each appeared in two implementations. For feature extraction, Cross-Correlation Function (CCF) and Continuous Wavelet Transform (CWT) appeared in seven implementations each, Empirical Mode Decomposition (EMD) and Principal Component Analysis (PCA) in five implementations each. Feature selection approaches included Partial Mutual Information (PMI) (five implementations), literature-based selection and correlation analysis four implementations each. Normalisation appears in 62 implementations and standardisation in 19 implementations for feature transformation methods.
Data preprocessing approaches showed notable patterns across studies, with linear interpolation dominating missing data imputation despite more sophisticated alternatives like KNN remaining underutilised. Feature engineering revealed an evolution towards advanced signal processing, with Continuous Wavelet Transform and Empirical Mode Decomposition gaining traction for extracting meaningful patterns from non-stationary hydrological signals. The widespread use of normalisation reflected its fundamental importance in handling the diverse scales of hydrological variables, though standardised preprocessing pipelines remained inconsistent across the literature, suggesting opportunities for methodological refinement.

6.4.2. Forecasting Models

The 363 studies contained a total of 1290 forecasting algorithm implementations, with 1118 standalone algorithm applications and 172 hybrid/ensemble approaches. Out of 1290 applications, LSTM networks appeared in 21%, traditional ANNs in 6%, and CNNs in 5%. SVMs and Multi-Layer Perceptrons (MLPs), GRUs and various NN architectures appeared in 4%, and Linear Regression (LR) models in 3%. Figure 13a shows the top 20 standalone forecasting algorithms implemented. The dominance of DL approaches, particularly LSTM networks, in flood forecasting research reflected a paradigm shift in hydrological modelling. LSTMs became the preferred choice due to their ability to capture long-term dependencies in time series data and handle non-linear relationships in hydrological processes [115]. Our analysis revealed numerous LSTM variations employed across studies, including Bidirectional LSTM [116], Seq2Seq LSTM [117], and architecturally enhanced implementations incorporating attention mechanisms (Attention LSTM [118], Dual Attention LSTM [119]) and spatial components (Spatio-Temporal LSTM [24]). These architectural innovations extended basic LSTM capabilities by focusing on relevant historical features, incorporating bidirectional information flow, or integrating spatial relationships alongside temporal patterns, demonstrating the research community’s continuous efforts to address complex multi-dimensional challenges [115].
Hybrid models appeared in 10% (out of 1290 cases), pure ensemble methods in 3% and 0.5% combined both hybrid and ensemble techniques. Figure 13b shows the breakdown of hybrid/ensemble approaches. Among hybrid approaches, CNN + LSTM combinations appeared in 3%, and CNN + GRU and Convolutional LSTM (ConvLSTM) architectures in 0.5% each. Figure 13c shows the top 10 hybrid approaches implemented. The substantial use of CNNs, combined with recurrent architecture, highlighted the importance of spatial feature extraction in flood forecasting. These hybrid CNN + LSTM/GRU [120,121] models captured spatial patterns whilst modelling temporal evolution, addressing the spatiotemporal complexity of flood dynamics. Despite their proven capabilities in capturing complex spatial relationships, graph-based approaches remained significantly underutilised. GNNs offered powerful tools for modelling dependencies between interconnected locations in river networks and watershed systems, representing an untapped potential for advancing spatial analysis [122]. Similarly, transfer learning [123,124] remained underutilised, appearing in fewer than 3% (out of 363 studies), though it represented a promising direction for extending forecasting capabilities to data-scarce regions.
Physics-based models appeared in 144 cases in flood forecasting studies either as baseline models to evaluate data-driven models or as hybrid models. MIKE and XAJ models appeared in 8% (out of 144 cases), Storm Water Management Model (SWMM) in 7%, Shallow Water Equations (SWE) in 5%, HEC-HMS in 4%, Saint-Venant Equations, Hydrodynamic (HD) models and HEC-RAS in 3%. Figure 13d shows the top five physics-based models with the highest occurrence. The continued relevance of physics-based models like MIKE [125], XAJ [52], and SWMM [126] in hybrid configurations demonstrated the value of domain knowledge. The growing prevalence of hybrid models combining physics-based approaches with ML/DL techniques represented a pragmatic integration of process understanding with data-driven flexibility, addressing limitations in pure physics-based and pure data-driven approaches [26,27]. Our analysis revealed a consistent upward trend in hybrid and ensemble approaches, increasing from just 7 studies in 2019 to 38 in 2024. This dramatic growth, with hybrid/ensemble methods now representing 43% (38 out of 89) of studies in 2024, demonstrated the research community’s growing recognition of their effectiveness. This trend suggests hybrid/ensemble approaches will likely dominate future flood forecasting research, potentially offering the most comprehensive solution to complex hydrological forecasting challenges.

6.4.3. Optimisation and Hyperparameter Tuning

For optimisation and hyperparameter tuning, within 346 identified cases, Adam optimiser appeared in 38%, Levenberg–Marquardt (LM) algorithm in 8%, and Genetic Algorithms (GA) in 6%. Backpropagation and GridSearchCV in 5%. Gradient-based methods, including Gradient Descent (GD) and Stochastic GD (SGD), appeared in 4%, whilst Particle Swarm Optimisation (PSO) and Bayesian Optimisation Algorithm (BOA) appeared in 3%. In optimisation techniques, adaptive algorithms, particularly Adam, dominated the landscape, complemented by traditional approaches like LM and evolutionary algorithms such as GA. This diversity reflected the complex parameter spaces in hydrological modelling and varying computational requirements across forecasting systems. However, the limited adoption of advanced hyperparameter tuning approaches like Bayesian optimisation indicated untapped potential for improving model robustness through more systematic parameter selection strategies.

6.4.4. Look-Back Window and Lead Times

The implementation of look-back window approaches (10% of studies) demonstrated significant methodological variation despite addressing similar conceptual needs. Studies diverged in window size implementation (fixed versus variable), movement patterns (overlapping versus non-overlapping), and historical data processing (equal weighting versus decay functions). These differences highlighted how researchers adapted temporal data handling to specific forecasting contexts and architectural considerations. The substantial performance variations resulting from different window configurations underscored the critical importance of temporal data structuring in flood forecasting, suggesting that look-back window selection could significantly benefit the field.
Regarding lead times, out of identified 676 different lead times, very short-term forecasting (≤1 hour) appeared in 24%, short-term forecasting (>1–≤24 hour) in 49%% (27% for >1–≤12 hour and 22% for >12–≤24 hour), medium-term forecasting (>1–≤7 day) in 23% (13% for >1–≤3 day and 10% for >3–≤7 day), and long-term forecasting (>1 week) in 3%. 1% focused on rainfall-based forecasting without explicit lead times. Further, LSTM-based approaches offer the most flexibility across temporal scales, hybrid models excel in medium-term forecasting where both accuracy and computational efficiency matter, whilst traditional ML remains viable for operational short-term predictions where simplicity and interpretability are prioritised.
Technology-specific lead time analysis revealed important patterns across different modelling approaches. LSTM-based models demonstrated the broadest applicability across all forecasting horizons, from 15 minute intervals to 30-day forecasts, with the majority concentrated in 1–24 hour ranges, reflecting their superior capability in capturing temporal dependencies. In contrast, hybrid models such as CNN-LSTM and LSTM-GRU predominantly targeted short to medium-term forecasting (1–7 days), leveraging combined architectures to balance spatial-temporal feature extraction with computational efficiency. Traditional ML models, including ANN, SVM, and Random Forest, were primarily employed for short-term forecasting (≤24 h), with limited application beyond 3-day horizons, suggesting their constraints in capturing long-term dependencies. Physics-based models, when used in isolation, showed a preference for real-time to short-term forecasting; however, their integration in hybrid approaches extended capabilities to medium-term ranges. Finally, advanced architectures such as Transformers and GNNs emerged primarily in recent studies (2023–2024), targeting both very short-term (minutes) and medium-term (days) forecasting, indicating their potential for multi-scale temporal modelling. This technology-lead time mapping provides crucial guidance for practitioners: LSTM-based approaches offer the most flexibility across temporal scales, hybrid models excel in medium-term forecasting where both accuracy and computational efficiency matter, whilst traditional ML remains viable for operational short-term predictions where simplicity and interpretability are prioritised.

6.5. RQ5: What Evaluation Metrics Were Employed to Assess Model Performance?

Our analysis of the evaluation metrics used in data-driven flood forecasting studies revealed a total of 1603 metric instances across the 363 selected studies, with 371 distinct metrics identified. Error-based metrics dominated the evaluation landscape, with RMSE being the most frequently used metric (70% of the studies), followed by NSE (49%) and MAE (40%). Goodness-of-fit metrics were also extensively used, with R2 and Correlation Coefficient (R) appearing in 37% and 18%, respectively. Classification performance metrics (Accuracy, F1-score, Recall, Precision) appeared less frequently but were still notable, whilst specialised hydrological metrics like Peak Time Error featured in fewer studies.
The overwhelming preference for error-based metrics, particularly RMSE, revealed a persistent focus on absolute forecasting accuracy in flood forecasting research. This trend aligned with traditional hydrological modelling practices but raised concerns about the comprehensiveness of model evaluation. The significant reliance on RMSE may have been problematic as it disproportionately penalises large errors [127], potentially leading researchers to optimise average conditions [128] rather than extreme flood events. Whilst efficiency metrics like NSE provided a complementary assessment of model performance relative to the means of observations, the limited adoption of peak-specific and timing error metrics (appearing in fewer than 10% of studies) suggested insufficient attention to critical aspects of flood forecasting, namely the accurate forecasting of flood peaks and their timing. The lower occurrence of classification performance metrics (Accuracy, F1-score, Recall, Precision) was consistent with our study focus on continuous forecasting approaches, appearing primarily in studies that extended regression outputs to categorical risk analysis or warning level classifications. Furthermore, despite the increasing importance of uncertainty quantification in hydrological modelling, probabilistic metrics (CRPS, PI metrics) were employed in only a small fraction of studies, indicating an opportunity for more robust evaluation frameworks that better reflected operational requirements for flood warning systems.

6.6. Potential Research Directions

Based on our SMS, we identify eight crucial research directions for advancing the field. First, geographical coverage extension through targeted research initiatives and international collaborations is essential to address underrepresented flood-prone regions in Africa, South America, and the Middle East, thereby enhancing global flood resilience. Second, the exploration of GNNs or similar graph-based neural networks represents a significant opportunity to leverage their untapped potential for modelling complex spatial relationships in river networks and watershed systems. Third, transfer learning implementation could address data scarcity challenges and enable knowledge transfer between watersheds with different characteristics, particularly benefiting regions with limited historical data. Fourth, uncertainty quantification enhancement through increased incorporation of probabilistic forecasting methods and corresponding evaluation metrics would provide more reliable and actionable forecasts for decision-makers. Fifth, remote sensing integration requires advancing methodologies to systematically incorporate satellite data, particularly in data-scarce regions where ground-based monitoring networks are sparse or non-existent. Sixth, advanced imputation techniques utilising reanalysis products such as the European Centre for Medium-Range Weather Forecasts (ECMWF), Integrated Multi-satellitE Retrievals for GPM (IMERG), or Goddard Earth Observing System Forward Processing (GEOS-FP) could extract location-specific meteorological data for replacing missing values, thereby improving data quality and model performance. Seventh, the optimisation of time lag and look-back window approaches as preprocessing steps prior to model training could enhance model performance whilst reducing computational requirements. Finally, the extension of forecasting lead times towards medium-term horizons (1–7 days) would provide communities with crucial additional preparation time for evacuation, property protection, and emergency planning, potentially offering greater societal impact than very short-term forecasts despite the inherent challenges of longer prediction windows.

7. Conclusions

This SMS has analysed the landscape of data-driven flood forecasting from 2019 to 2024, revealing trends and patterns across publication venues, geographical distribution, input–output configurations, technical implementations, and evaluation methodologies. The dramatic growth in publications during this period reflected a fundamental shift towards data-driven approaches capable of capturing complex non-linear relationships efficiently in hydrological systems. This research expansion, however, showed significant geographical disparities, with a concentration of studies in East and Southeast Asia that highlighted both regional flooding challenges and technology investment, whilst simultaneously revealing critical research needs in vulnerable regions across Africa, South America, and the Middle East. Our analysis of technical implementations revealed that rainfall and water level measurements formed the predictive basis across diverse watersheds, confirming the fundamental importance of meteorological and hydrological variables in flood forecasting. The technological landscape evolved substantially during this period, with LSTM networks establishing clear dominance in the field, whilst hybrid approaches combining physics-based knowledge with data-driven flexibility demonstrated the most substantial growth trajectory. Notably, the underutilisation of graph-based methods, transfer learning approaches, and advanced uncertainty quantification techniques represented significant missed opportunities for advancing the field. Furthermore, the overwhelming preference for error-based metrics in model evaluation, particularly RMSE, suggested a concerning focus on general accuracy that potentially overlooks peak flow prediction—precisely when forecasts are most critical for disaster management. This evaluation bias indicated a pressing need for more comprehensive assessment frameworks that better reflect the operational requirements of flood warning systems and prioritise the accurate prediction of extreme events that pose the greatest risk to communities.
The findings from this SMS provide actionable insights for diverse stakeholders: researchers can prioritise identified gaps in graph-based approaches and transfer learning; practitioners can make informed decisions when selecting appropriate models and evaluation metrics for specific watershed contexts; and policymakers in underrepresented regions can leverage these insights to develop region-specific flood forecasting capabilities that address local hydrological challenges whilst benefiting from global methodological advances.
This SMS has a few methodological limitations. The exclusive focus on 2019–2024 excluded earlier foundational research. Our reliance on three databases (IEEE Xplore, WoS, and Scopus) may have missed studies in other repositories. The restriction to English-language publications potentially omits valuable research from non-English-speaking regions, particularly given the geographic imbalances identified. Furthermore, our specific exclusion criteria (categorical classification studies, monthly/seasonal forecasting) narrowed the scope. Finally, whilst our search strategy was comprehensive, the rapidly evolving terminology in this field meant some relevant studies using alternative terms may have been overlooked.
This SMS can be extended through future studies that broaden the temporal scope to include foundational research, expand database coverage, incorporate non-English publications, or focus specifically on underrepresented regions identified in our geographical analysis. Additionally, complementary systematic reviews could examine specific technical approaches in greater depth or conduct comparative analyses between data-driven and physics-based approaches. Such extended secondary research would further consolidate knowledge in this rapidly evolving field, helping to bridge the identified geographical and methodological gaps in the flood forecasting literature.

Supplementary Materials

The following supporting information can be downloaded at: https://www.mdpi.com/article/10.3390/w17152281/s1, Supplementary File S1: List of selected tertiary studies and List of selected 363 studies; Supplementary File S2: List of Abbreviations; Supplementary File S3: Comprehensive mapping of extracted items vs studies chosen.

Author Contributions

Conceptualization, B.K., G.S., A.R.A. and F.T.; methodology, B.K., G.S., A.R.A. and F.T.; formal analysis, B.K.; investigation, B.K.; data curation, B.K.; writing—original draft preparation, B.K.; writing—review and editing, B.K., G.S., A.R.A. and F.T.; visualisation, B.K.; supervision, G.S., A.R.A. and F.T.; project administration, G.S.; funding acquisition, G.S., A.R.A. and F.T. All authors have read and agreed to the published version of the manuscript.

Funding

This research was funded by the Connectivity Innovation Network (CIN) (52251), an initiative of the New South Wales (NSW) Government and the NSW Telco Authority, Australia.

Conflicts of Interest

The authors declare no conflicts of interest. The funders had no role in the design of the study; in the collection, analyses, or interpretation of data; in the writing of the manuscript; or in the decision to publish the results.

References

  1. WMO. Weather-Related Disasters Increase over Past 50 Years, Causing More Damage but Fewer Deaths. Available online: https://wmo.int/media/news/weather-related-disasters-increase-over-past-50-years-causing-more-damage-fewer-deaths (accessed on 11 July 2024).
  2. Zeleňáková, M.; Gaňová, L.; Purcz, P.; Horský, M.; Satrapa, L.; Blišťan, P.; Diaconu, D. Mitigation of the Adverse Consequences of Floods for Human Life, Infrastructure, and the Environment. Nat. Hazards Rev. 2017, 18, 05017002. [Google Scholar] [CrossRef]
  3. Dharmarathne, G.; Waduge, A.; Bogahawaththa, M.; Rathnayake, U.; Meddage, D. Adapting Cities to the Surge: A Comprehensive Review of Climate-induced Urban Flooding. Results Eng. 2024, 22, 102123. [Google Scholar] [CrossRef]
  4. Hakim, D.K.; Gernowo, R.; Nirwansyah, A.W. Flood Prediction with Time Series Data Mining: Systematic Review. Nat. Hazards Res. 2024, 4, 194–220. [Google Scholar] [CrossRef]
  5. WMO. Early Warning System. Available online: https://wmo.int/topics/early-warning-system (accessed on 24 February 2025).
  6. Kuller, M.; Schoenholzer, K.; Lienert, J. Creating Effective Flood Warnings: A Framework from a Critical Review. J. Hydrol. 2021, 602, 126708. [Google Scholar] [CrossRef]
  7. Qin, Y. Urban Flooding Mitigation Techniques: A Systematic Review and Future Studies. Water 2020, 12, 3579. [Google Scholar] [CrossRef]
  8. Byaruhanga, N.; Kibirige, D.; Gokool, S.; Mkhonta, G. Evolution of Flood Prediction and Forecasting Models for Flood Early Warning Systems: A Scoping Review. Water 2024, 16, 1763. [Google Scholar] [CrossRef]
  9. Senthan, P.; Rathnayaka, R.; Banujan, K.; Kumara, B. Development of churn prediction Model Using XGBoost-Telecommunication Industry in Sri Lanka. In Proceedings of the 2021 IEEE International IOT, Electronics and Mechatronics Conference (IEMTRONICS), Toronto, ON, Canada, 21–24 April 2021; pp. 1–7. [Google Scholar]
  10. Mishoba, S.; Banujan, K.; Prasanth, S.; Kumara, B. A Machine Learning Approach to Classify the Telecommunication Customers Based on Their Profitability. In Social Customer Relationship Management (Social-CRM) in the Era of Web 4.0; IGI Global: Hershey, PA, USA, 2022; pp. 1–25. [Google Scholar]
  11. Singh, R.; Srivastava, S. Stock Prediction Using Deep Learning. Multimed. Tools Appl. 2017, 76, 18569–18584. [Google Scholar] [CrossRef]
  12. Kajanan, S.; Kumara, B.; Banujan, K.; Prasanth, S.; Manitheepan, K. Classify the Outcome of Arterial Blood Gas Test to Detect the Respiratory Failure Using Machine Learning. In Proceedings of the 2022 International Conference on Decision Aid Sciences and Applications (DASA), Chiangrai, Thailand, 23–25 March 2022; pp. 1139–1143. [Google Scholar]
  13. Prasanth, S.; Banujan, K.; Kumara, B. Hyper Parameter Tuned Ensemble Approach for Gestational Diabetes Prediction. In Proceedings of the 2021 International Conference on Innovation and Intelligence for Informatics, Computing, and Technologies (3ICT), Zallaq, Bahrain, 29–30 September 2021; pp. 18–23. [Google Scholar]
  14. Premisha, P.; Prasanth, S.; Kanagarathnam, M.; Banujan, K. An Ensemble Machine Learning Approach for Stroke Prediction. In Proceedings of the 2022 International Research Conference on Smart Computing and Systems Engineering (SCSE), Colombo, Sri Lanka, 1 September 2022; pp. 165–170. [Google Scholar]
  15. Banujan, K.; Ifham, M.; Kumara, B. Boosting Ensemble Machine Learning Approach for Covid-19 Death Prediction. Sri Lanka J. Soc. Sci. Humanit. 2023, 3, 81–89. [Google Scholar] [CrossRef]
  16. Sandagiri, S.; Kumara, B.; Banujan, K. Detecting Crime Related Twitter Posts Using Artificial Neural Networks Based Approach. In Proceedings of the 2020 20th International Conference on Advances in ICT for Emerging Regions (ICTer), Colombo, Sri Lanka, 4–7 November 2020; pp. 5–10. [Google Scholar]
  17. Wijeratne, A.K.; Ravikumar, N.; Bandara, P.M.; Banujan, K. Prognostication of Crime Using Bagging Regression Model: A Case Study of London. In Handbook of Research on Technological Advances of Library and Information Science in Industry 5.0; IGI Global: Hershey, PA, USA, 2023; pp. 462–478. [Google Scholar]
  18. Banujan, K.; Kumara, B.; Prasanth, S.; Ravikumar, N. Revolutionising Educational Assessment: Automated Question Classification Using Bloom’s Taxonomy and Deep Learning Techniques- A Case Study on Undergraduate Examination Questions. Int. J. Educ. Dev. Using Inf. Commun. Technol. 2023, 19, 259–278. [Google Scholar]
  19. Banujan, K.; Kumara, B.; Paik, I. Strengthening Post-Disaster Management Activities by Rating Social Media Corpus. In Research Anthology on Managing Crisis and Risk Communications; IGI Global Scientific Publishing: Hershey, PA, USA, 2023; pp. 711–729. [Google Scholar]
  20. Aswin, S.; Geetha, P.; Vinayakumar, R. Deep Learning Models for the Prediction of Rainfall. In Proceedings of the 2018 International Conference on Communication and Signal Processing (ICCSP), Chennai, India, 3–5 April 2018; pp. 0657–0661. [Google Scholar]
  21. Kekulanadara, K.; Kumara, B.; Banujan, K. Comparative Analysis of Machine Learning Algorithms for Predicting Air Quality Index. In Proceedings of the 2021 from Innovation to Impact (FITI), Colombo, Sri Lanka, 8 December 2021; pp. 1–5. [Google Scholar]
  22. Zhu, H.; Leandro, J.; Lin, Q. Optimization of Artificial Neural Network (ANN) for Maximum Flood Inundation Forecasts. Water 2021, 13, 2252. [Google Scholar] [CrossRef]
  23. Patel, M.; Parekh, F. Forecasting of Flood Flow of Panam River Basin Using Adaptive Neuro-Fuzzy Inference System (ANFIS) and ANN with Comparative Study. J. Adv. Res. Appl. Sci. Eng. Technol. 2023, 32, 346–359. [Google Scholar] [CrossRef]
  24. Malik, H.; Feng, J.; Shao, P.; Abduljabbar, Z.A. Improving Flood Forecasting Using Time-Distributed CNN-LSTM Model: A Time-Distributed Spatiotemporal Method. Earth Sci. Inform. 2024, 17, 3455–3474. [Google Scholar] [CrossRef]
  25. Wang, F.; Wang, W.; Bi, W.; Lin, W.; Zhang, D. Dual-Stage Attention-Based LSTM Network for Multiple Time Steps Flood Forecasting. Proc. Int. Assoc. Hydrol. Sci. 2024, 386, 141–146. [Google Scholar] [CrossRef]
  26. Liu, C.; Xie, T.; Li, W.; Hu, C.; Jiang, Y.; Li, R.; Song, Q. Research on Machine Learning Hybrid Framework by Coupling Grid-Based Runoff Generation Model and Runoff Process Vectorization for Flood Forecasting. J. Environ. Manag. 2024, 364, 121466. [Google Scholar] [CrossRef] [PubMed]
  27. Xu, C.; Zhong, P.-a.; Zhu, F.; Xu, B.; Wang, Y.; Yang, L.; Wang, S.; Xu, S. A Hybrid Model Coupling Process-Driven and Data-Driven Models for Improved Real-Time Flood Forecasting. J. Hydrol. 2024, 638, 131494. [Google Scholar] [CrossRef]
  28. Zhang, L.; Qin, H.; Mao, J.; Cao, X.; Fu, G. High Temporal Resolution Urban Flood Prediction Using Attention-Based LSTM Models. J. Hydrol. 2023, 620, 129499. [Google Scholar] [CrossRef]
  29. Zhang, Y.; Zhou, Z.; Van Griensven Thé, J.; Yang, S.X.; Gharabaghi, B. Flood Forecasting Using Hybrid LSTM and GRU Models with Lag Time Preprocessing. Water 2023, 15, 3982. [Google Scholar] [CrossRef]
  30. Petersen, K.; Feldt, R.; Mujtaba, S.; Mattsson, M. Systematic Mapping Studies in Software Engineering. In Proceedings of the 12th International Conference on Evaluation and Assessment in Software Engineering (EASE), Bari, Italy, 26–27 June 2008. [Google Scholar]
  31. Petersen, K.; Vakkalanka, S.; Kuzniarz, L. Guidelines for Conducting Systematic Mapping Studies in Software Engineering: An Update. Inf. Softw. Technol. 2015, 64, 1–18. [Google Scholar] [CrossRef]
  32. Kitchenham, B.; Charters, S. Guidelines for Performing Systematic Literature Reviews in Software Engineering; Kitchenham: Hershey, PA, USA, 2007. [Google Scholar]
  33. Farshchian, B.A.; Dahl, Y. The Role of ICT in Addressing the Challenges of Age-related Falls: A Research Agenda Based on a Systematic Mapping of the Literature. Pers. Ubiquitous Comput. 2015, 19, 649–666. [Google Scholar] [CrossRef]
  34. Kong, X.; Li, Z.; Liu, Z. Flood Prediction in Ungauged Basins by Physical-based TOPKAPI Model. Adv. Meteorol. 2019, 2019, 4795853. [Google Scholar] [CrossRef]
  35. Hussain, F.; Wu, R.-S.; Wang, J.-X. Comparative Study of Very Short-term Flood Forecasting Using Physics-based Numerical Model and Data-driven Prediction Model. Nat. Hazards 2021, 107, 249–284. [Google Scholar] [CrossRef]
  36. Jodhani, K.H.; Patel, D.; Madhavan, N. A Review on Analysis of Flood Modelling Using Different Numerical Models. Mater. Today Proc. 2023, 80, 3867–3876. [Google Scholar] [CrossRef]
  37. Ardabili, S.; Mosavi, A.; Dehghani, M.; Várkonyi-Kóczy, A.R. Deep Learning and Machine Learning in Hydrological Processes Climate Change and Earth Systems a Systematic Review. In Proceedings of the Engineering for Sustainable Future: Selected papers of the 18th International Conference on Global Research and Education Inter-Academia–2019, 18, Budapest, Hungary, 4–7 September 2019; Springer: Cham, Switzerland, 2020; pp. 52–62. [Google Scholar]
  38. Taormina, R.; Chau, K.-W. Data-driven Input Variable Selection for Rainfall–runoff Modeling Using Binary-coded Particle Swarm Optimization and Extreme Learning Machines. J. Hydrol. 2015, 529, 1617–1632. [Google Scholar] [CrossRef]
  39. Chen, C.; Hui, Q.; Xie, W.; Wan, S.; Zhou, Y.; Pei, Q. Convolutional Neural Networks for Forecasting Flood Process in Internet-of-Things Enabled Smart City. Comput. Netw. 2021, 186, 107744. [Google Scholar] [CrossRef]
  40. Oliveira Santos, V.; Costa Rocha, P.A.; Scott, J.; Thé, J.V.G.; Gharabaghi, B. A New Graph-Based Deep Learning Model to Predict Flooding with Validation on a Case Study on the Humber River. Water 2023, 15, 1827. [Google Scholar] [CrossRef]
  41. Liang, Z.; Zou, R.; Chen, X.; Ren, T.; Su, H.; Liu, Y. Simulate the Forecast Capacity of a Complicated Water Quality Model Using the Long Short-term Memory Approach. J. Hydrol. 2020, 581, 124432. [Google Scholar] [CrossRef]
  42. Fan, J.; Zhang, K.; Huang, Y.; Zhu, Y.; Chen, B. Parallel Spatio-temporal Attention-based TCN for Multivariate Time Series Prediction. Neural Comput. Appl. 2023, 35, 13109–13118. [Google Scholar] [CrossRef]
  43. Li, G.; Zhu, H.; Jian, H.; Zha, W.; Wang, J.; Shu, Z.; Yao, S.; Han, H. A Combined Hydrodynamic Model and Deep Learning Method to Predict Water Level in Ungauged Rivers. J. Hydrol. 2023, 625, 130025. [Google Scholar] [CrossRef]
  44. Reichstein, M.; Camps-Valls, G.; Stevens, B.; Jung, M.; Denzler, J.; Carvalhais, N.; Prabhat, F. Deep Learning and Process Understanding for Data-driven Earth System Science. Nature 2019, 566, 195–204. [Google Scholar] [CrossRef]
  45. Khatun, A.; Chatterjee, C.; Sahu, G.; Sahoo, B. A Novel Smoothing-Based Long Short-Term Memory Framework for Short-to Medium-Range Flood Forecasting. Hydrol. Sci. J. 2023, 68, 488–506. [Google Scholar] [CrossRef]
  46. Kratzert, F.; Klotz, D.; Brenner, C.; Schulz, K.; Herrnegger, M. Rainfall–runoff Modelling Using Long Short-term Memory (LSTM) Networks. Hydrol. Earth Syst. Sci. 2018, 22, 6005–6022. [Google Scholar] [CrossRef]
  47. Noor, F.; Haq, S.; Rakib, M.; Ahmed, T.; Jamal, Z.; Siam, Z.S.; Hasan, R.T.; Adnan, M.S.G.; Dewan, A.; Rahman, R.M. Water Level Forecasting Using Spatiotemporal Attention-Based Long Short-Term Memory Network. Water 2022, 14, 612. [Google Scholar] [CrossRef]
  48. Li, W.; Liu, C.; Xu, Y.; Niu, C.; Li, R.; Li, M.; Hu, C.; Tian, L. An Interpretable Hybrid Deep Learning Model for Flood Forecasting Based on Transformer and LSTM. J. Hydrol. Reg. Stud. 2024, 54, 101873. [Google Scholar] [CrossRef]
  49. Nie, Q.; Wan, D.; Wang, R. CNN-BiLSTM Water Level Prediction Method with Attention Mechanism. J. Phys. Conf. Ser. 2021, 2078, 012032. [Google Scholar] [CrossRef]
  50. Niu, S. Application of CNN-LSTM and Internet of Things in Rainfall Accumulation Prediction at Urban Flooding Sites. In Proceedings of the 2023 IEEE 6th International Conference on Information Systems and Computer Aided Education (ICISCAE), Dalian, China, 23-25 September 2023; pp. 938–944. [Google Scholar]
  51. Dong, S.; Yu, T.; Farahmand, H.; Mostafavi, A. A Hybrid Deep Learning Model for Predictive Flood Warning and Situation Awareness Using Channel Network Sensors Data. Comput.-Aided Civ. Infrastruct. Eng. 2021, 36, 402–420. [Google Scholar] [CrossRef]
  52. Zhou, Y.; Cui, Z.; Lin, K.; Sheng, S.; Chen, H.; Guo, S.; Xu, C.-Y. Short-Term Flood Probability Density Forecasting Using a Conceptual Hydrological Model with Machine Learning Techniques. J. Hydrol. 2022, 604, 127255. [Google Scholar] [CrossRef]
  53. de Souza, É.F.; de Almeida Falbo, R.; Vijaykumar, N.L. Knowledge Management Initiatives in Software Testing: A Mapping Study. Inf. Softw. Technol. 2015, 57, 378–391. [Google Scholar] [CrossRef]
  54. Felizardo, K.R.; de Souza, É.F.; Napoleão, B.M.; Vijaykumar, N.L.; Baldassarre, M.T. Secondary Studies in the Academic Context: A Systematic Mapping and Survey. J. Syst. Softw. 2020, 170, 110734. [Google Scholar] [CrossRef]
  55. IEEE Xplore. Available online: https://ieeexplore.ieee.org (accessed on 1 February 2025).
  56. Web of Science. Available online: https://webofscience.com (accessed on 1 February 2025).
  57. Scopus. Available online: https://www.scopus.com (accessed on 1 February 2025).
  58. Salimi, A.; Ghobrial, T.; Bonakdari, H. A Comprehensive Review of AI-Based Methods Used for Forecasting Ice Jam Floods Occurrence, Severity, Timing, and Location. Cold Reg. Sci. Technol. 2024, 227, 104305. [Google Scholar] [CrossRef]
  59. Chitwatkulsiri, D.; Miyamoto, H. Real-Time Urban Flood Forecasting Systems for Southeast Asia—A Review of Present Modelling and Its Future Prospects. Water 2023, 15, 178. [Google Scholar] [CrossRef]
  60. Sharma, T.; Pal, A.; Kaushik, A.; Yadav, A.; Chitragupta, A. A Survey on Flood Prediction Analysis Based on ML Algorithm Using Data Science Methodology. In Proceedings of the 2022 IEEE Delhi Section Conference (DELCON), New Delhi, India, 11–13 February 2022; pp. 1–8. [Google Scholar]
  61. Piadeh, F.; Behzadian, K.; Alani, A.M. A Critical Review of Real-Time Modelling of Flood Forecasting in Urban Drainage Systems. J. Hydrol. 2022, 607, 127476. [Google Scholar] [CrossRef]
  62. Ozdemir, S.; Yaqub, M.; Yildirim, S.O. A Systematic Literature Review on Lake Water Level Prediction Models. Environ. Model. Softw. 2023, 163, 105684. [Google Scholar] [CrossRef]
  63. Ullah, T.F.; Prakasi, O.G.; Kanmani, P. A Review on Flood Prediction Algorithms and a Deep Neural Network Model for Estimation of Flood Occurrence. Int. Res. J. Multidiscip. Technovation 2020, 2, 8–14. [Google Scholar] [CrossRef]
  64. Shetty, P.; Varma, S.; Tripathi, S.; Bhole, C. Advancements in Disaster Prediction: A Systematic Review of Earthquake, Flood, and Cyclone Forecasting Techniques. In Proceedings of the 2024 4th International Conference on Sustainable Expert Systems (ICSES), Kaski, Nepal, 15–17 October 2024; pp. 1665–1673. [Google Scholar]
  65. Di, Q.; Jinbo, Q.; Mingti, C. Application of Machine Learning in Flood Forecast: A Survey. In Proceedings of the 2022 International Conference on Virtual Reality, Human-Computer Interaction and Artificial Intelligence (VRHCIAI), Changsha, China, 28–30 October 2022; pp. 177–181. [Google Scholar]
  66. Subashini, M.; Sudarmani, R.; Gobika, S.; Varshini, R. Development of Smart Flood Monitoring and Early Warning System Using Weather Forecasting Data and Wireless Sensor Networks—A Review. In Proceedings of the 2021 Third International Conference on Intelligent Communication Technologies and Virtual Mobile Networks (ICICV), Tirunelveli, India, 4–6 February 2021; pp. 132–135. [Google Scholar]
  67. Khairudin, N.M.; Mustapha, N.B.; Aris, T.N.M.; Zolkepli, M. In-Depth Review on Machine Learning Models for Long-Term Flood Forecasting. J. Theor. Appl. Inf. Technol. 2022, 100, 3360–3378. [Google Scholar]
  68. Banujan, K.; Chamanee, G.; Kumara, B. A Comprehensive Review on the Integration of Geographic Information Systems and Artificial Intelligence for Landfill Site Selection: A Systematic Mapping Perspective. Waste Manag. Res. 2025, 43, 137–159. [Google Scholar] [CrossRef]
  69. Alabadla, M.; Sidi, F.; Ishak, I.; Ibrahim, H.; Affendey, L.S.; Ani, Z.C.; Jabar, M.A.; Bukar, U.A.; Devaraj, N.K.; Muda, A.S. Systematic Review of Using Machine Learning in Imputing Missing Values. IEEE Access 2022, 10, 44483–44502. [Google Scholar] [CrossRef]
  70. Sit, M.; Demiray, B.Z.; Xiang, Z.; Ewing, G.J.; Sermet, Y.; Demir, I. A Comprehensive Review of Deep Learning Applications in Hydrology and Water Resources. Water Sci. Technol. 2020, 82, 2635–2670. [Google Scholar] [CrossRef] [PubMed]
  71. Feng, J.; Wang, Z.; Wu, Y.; Xi, Y. Spatial and Temporal Aware Graph Convolutional Network for Flood Forecasting. In Proceedings of the 2021 International Joint Conference on Neural Networks (IJCNN), Shenzhen, China, 18–22 July 2021; pp. 1–8. [Google Scholar]
  72. Nguyen, D.H.; Kim, S.-H.; Kwon, H.-H.; Bae, D.-H. Uncertainty Quantification of Water Level Predictions from Radar-based Areal Rainfall Using an Adaptive MCMC Algorithm. Water Resour. Manag. 2021, 35, 2197–2213. [Google Scholar] [CrossRef]
  73. Wang, S.; Xu, O. Uncertainty Forecasting Model for Mountain Flood Based on Bayesian Deep Learning. IEEE Access 2024, 12, 47830–47841. [Google Scholar] [CrossRef]
  74. Chu, W.; Zhang, C.; Li, H.; Zhang, L.; Shen, D.; Li, R. SHAP-Powered Insights Into Spatiotemporal Effects: Unlocking Explainable Bayesian-Neural-Network Urban Flood Forecasting. Int. J. Appl. Earth Obs. Geoinf. 2024, 131, 103972. [Google Scholar] [CrossRef]
  75. Xiang, X.; Guo, S.; Cui, Z.; Wang, L.; Xu, C.-Y. Improving Flood Forecast Accuracy Based on Explainable Convolutional Neural Network by Grad-CAM Method. J. Hydrol. 2024, 642, 131867. [Google Scholar] [CrossRef]
  76. Nayak, M.; Das, S.; Senapati, M.R. Improving Flood Prediction with Deep Learning Methods. J. Inst. Eng. (India) Ser. B 2022, 103, 1189–1205. [Google Scholar] [CrossRef]
  77. Mosavi, A.; Ozturk, P.; Chau, K.-w. Flood Prediction Using Machine Learning Models: Literature Review. Water 2018, 10, 1536. [Google Scholar] [CrossRef]
  78. Brown, R.G. Smoothing, Forecasting and Prediction of Discrete Time Series; Courier Corporation: Chelmsford, MA, USA, 2004. [Google Scholar]
  79. Armstrong, J.S. Principles of Forecasting: A Handbook for Researchers and Practitioners; Springer Science & Business Media: New York, NY, USA, 2001; Volume 30. [Google Scholar]
  80. Wang, Y.; Huang, Y.; Xiao, M.; Zhou, S.; Xiong, B.; Jin, Z. Medium-Long-Term Prediction of Water Level Based on an Improved Spatio-Temporal Attention Mechanism for Long Short-Term Memory Networks. J. Hydrol. 2023, 618, 129163. [Google Scholar] [CrossRef]
  81. Ficchì, A.; Perrin, C.; Andréassian, V. Impact of Temporal Resolution of Inputs on Hydrological Model Performance: An Analysis Based on 2400 Flood Events. J. Hydrol. 2016, 538, 454–470. [Google Scholar] [CrossRef]
  82. Gürsoy, Ö.; Engin, S.N. A Wavelet Neural Network Approach to Predict Daily River Discharge Using Meteorological Data. Meas. Control 2019, 52, 599–607. [Google Scholar] [CrossRef]
  83. Roodsari, B.K.; Chandler, D.G.; Kelleher, C.; Kroll, C.N. A Comparison of SAC-SMA and Adaptive Neuro-fuzzy Inference System for Real-time Flood Forecasting in Small Urban Catchments. J. Flood Risk Manag. 2019, 12, e12492. [Google Scholar] [CrossRef]
  84. Haben, S.; Voss, M.; Holderbaum, W. Time Series Forecasting: Core Concepts and Definitions. In Core Concepts and Methods in Load Forecasting: With Applications in Distribution Networks; Springer: Cham, Switzerland, 2023; pp. 55–66. [Google Scholar]
  85. Kim, B.; Choi, S.Y.; Han, K.-Y. Integrated Real-Time Flood Forecasting and Inundation Analysis in Small–medium Streams. Water 2019, 11, 919. [Google Scholar] [CrossRef]
  86. Shahabi, A.; Tahvildari, N. A Deep-Learning Model for Rapid Spatiotemporal Prediction of Coastal Water Levels. Coast. Eng. 2024, 190, 104504. [Google Scholar] [CrossRef]
  87. Dai, W.; Tang, Y.; Liao, N.; Zou, S.; Cai, Z. Urban Flood Prediction Using Ensemble Artificial Neural Network: An Investigation on Improving Model Uncertainty. Appl. Water Sci. 2024, 14, 144. [Google Scholar] [CrossRef]
  88. Khajehali, M.; Safavi, H.R.; Nikoo, M.R.; Fooladi, M. A Fusion-Based Framework for Daily Flood Forecasting in Multiple-Step-Ahead and Near-Future under Climate Change Scenarios: A Case Study of the Kan River, Iran. Nat. Hazards 2024, 120, 8483–8504. [Google Scholar] [CrossRef]
  89. Li, Y.; Su, M.; Duan, Z.; Liu, H. A New Integrated Prediction Method of River Level Based on Spatiotemporal Correlation. Stoch. Environ. Res. Risk Assess. 2024, 38, 1121–1143. [Google Scholar] [CrossRef]
  90. Chieu, T.Q.; Thao, N.T.P.; Thi Hue, D.; Huong, N.T.T. Prediction of the Water Level at the Kien Giang River Based on Regression Techniques. River 2024, 3, 59–68. [Google Scholar] [CrossRef]
  91. Lin, C.-H.A.; Liu, C.-Y.; Chen, K.-C. Quantum-Train Long Short-Term Memory: Application on Flood Prediction Problem. In Proceedings of the 2024 IEEE International Conference on Quantum Computing and Engineering (QCE), Montreal, QC, Canada, 15-20 September 2024; pp. 268–273. [Google Scholar]
  92. Kow, P.-Y.; Liou, J.-Y.; Yang, M.-T.; Lee, M.-H.; Chang, L.-C.; Chang, F.-J. Advancing Climate-Resilient Flood Mitigation: Utilizing Transformer-LSTM for Water Level Forecasting at Pumping Stations. Sci. Total Environ. 2024, 927, 172246. [Google Scholar] [CrossRef] [PubMed]
  93. Luo, Y.; Zhou, Y.; Chen, H.; Xiong, L.; Guo, S.; Chang, F.-J. Exploring a Spatiotemporal Hetero Graph-Based Long Short-Term Memory Model for Multi-Step-Ahead Flood Forecasting. J. Hydrol. 2024, 633, 130937. [Google Scholar] [CrossRef]
  94. Sharma, A.; Sharma, A. Artificial Neural Network (ANN) for Forecasting of Flood at Kasol in Satluj River, India. In Proceedings of the International Conference on Advanced Production and Industrial Engineering, Delhi, India, 18–19 June 2021; pp. 1085–1094. [Google Scholar]
  95. Zakaria, M.N.A.; Malek, M.A.; Zolkepli, M.; Ahmed, A.N. Application of Artificial Intelligence Algorithms for Hourly River Level Forecast: A Case Study of Muda River, Malaysia. Alex. Eng. J. 2021, 60, 4015–4028. [Google Scholar] [CrossRef]
  96. Girihagama, L.; Naveed Khaliq, M.; Lamontagne, P.; Perdikaris, J.; Roy, R.; Sushama, L.; Elshorbagy, A. Streamflow Modelling and Forecasting for Canadian Watersheds Using LSTM Networks With Attention Mechanism. Neural Comput. Appl. 2022, 34, 19995–20015. [Google Scholar] [CrossRef]
  97. Effrosynidis, D.; Spiliotis, E.; Sylaios, G.; Arampatzis, A. Time Series and Regression Methods for Univariate Environmental Forecasting: An Empirical Evaluation. Sci. Total Environ. 2023, 875, 162580. [Google Scholar] [CrossRef]
  98. Pungching, J.; Pilailar, S. Developing a Flood Forecasting System With Machine Learning and Applying to Geographic Information System. Geogr. Tech. 2023, 18, 1–18. [Google Scholar] [CrossRef]
  99. Li, J.; Wu, G.; Zhang, Y.; Shi, W. Optimizing Flood Predictions by Integrating LSTM and Physical-Based Models with Mixed Historical and Simulated Data. Heliyon 2024, 10, e33669. [Google Scholar] [CrossRef]
  100. Thaisiam, W.; Yomwilai, K.; Wongchaisuwat, P. Utilizing Sequential Modeling in Collaborative Method for Flood Forecasting. J. Hydrol. 2024, 636, 131290. [Google Scholar] [CrossRef]
  101. Benson, B.; Pan, W.; Prasad, A.; Gary, G.; Hu, Q. Forecasting Solar Cycle 25 Using Deep Neural Networks. Sol. Phys. 2020, 295, 65. [Google Scholar] [CrossRef]
  102. Zeng, C.; Aboagye, E.M.; Li, H.; Che, S. Comments and Recommendations on Sponge City China’s Solutions to Prevent Flooding Risks. Heliyon 2023, 9, e12745. [Google Scholar] [CrossRef] [PubMed]
  103. Olawade, D.B.; Wada, O.Z.; Ige, A.O.; Egbewole, B.I.; Olojo, A.; Oladapo, B.I. Artificial Intelligence in Environmental Monitoring: Advancements, Challenges, and Future Directions. Hyg. Environ. Health Adv. 2024, 12, 100114. [Google Scholar] [CrossRef]
  104. Abu-Saymeh, R.K.; Godrej, A.; Alexander, K.A. Modeling Large River Basins and Flood Plains with Scarce Data: Development of the Large Basin Data Portal. Hydrology 2023, 10, 87. [Google Scholar] [CrossRef]
  105. Petersen, O.H. Inequality of Research Funding Between Different Countries and Regions is a Serious Problem for Global Science. Function 2021, 2, zqab060. [Google Scholar] [CrossRef]
  106. Van Bavel, B.; Curtis, D.R.; Soens, T. Economic Inequality and Institutional Adaptation in Response to Flood Hazards. Ecol. Soc. 2018, 23, 30. [Google Scholar] [CrossRef]
  107. Ma, K.; He, D.; Liu, S.; Ji, X.; Li, Y.; Jiang, H. Novel Time-Lag Informed Deep Learning Framework for Enhanced Streamflow Prediction and Flood Early Warning in Large-Scale Catchments. J. Hydrol. 2024, 631, 130841. [Google Scholar] [CrossRef]
  108. Tang, X.; Yin, Z.; Qin, G.; Guo, L.; Li, H. Integration of Satellite Precipitation Data and Deep Learning for Improving Flash Flood Simulation in a Poor-gauged Mountainous Catchment. Remote Sens. 2021, 13, 5083. [Google Scholar] [CrossRef]
  109. Kardhana, H.; Valerian, J.R.; Rohmat, F.I.W.; Kusuma, M.S.B. Improving Jakarta’s Katulampa Barrage Extreme Water Level Prediction Using Satellite-Based Long Short-Term Memory (LSTM) Neural Networks. Water 2022, 14, 1469. [Google Scholar] [CrossRef]
  110. Huang, Z.; Wu, H.; Gu, G.; Li, X.; Nanding, N.; Adler, R.F.; Yilmaz, K.K.; Alfieri, L.; Chen, S. Paired Satellite and NWP Precipitation for Global Flood Forecasting. J. Hydrometeorol. 2023, 24, 2191–2205. [Google Scholar] [CrossRef]
  111. Kumar, A.; Singh, V. Real-Time Flood Forecasting Using Satellite Precipitation Product and Machine Learning Approach in Bagmati River Basin, India. Acta Geophys. 2024, 72, 4431–4451. [Google Scholar] [CrossRef]
  112. Liu, Y.; Wang, H.; Guan, X.; Meng, Y.; Xu, H. Urban Flood Depth Prediction and Visualization Based on the XGBoost-SHAP Model. Water Resour. Manag. 2024, 39, 1353–1375. [Google Scholar] [CrossRef]
  113. Wang, Y.; Liu, J.; Li, C.; Liu, Y.; Xu, L.; Yu, F. A Data-driven Approach for Flood Prediction Using Grid-based Meteorological Data. Hydrol. Process. 2023, 37, e14837. [Google Scholar] [CrossRef]
  114. Tiu, E.S.K.; Huang, Y.F.; Ng, J.L.; Aldahoul, N.; Ahmed, A.N.; Elshafie, A. An Evaluation of Various Data Pre-Processing Techniques with Machine Learning Models for Water Level Prediction. Nat. Hazards 2022, 110, 121–153. [Google Scholar] [CrossRef]
  115. Waqas, M.; Humphries, U.W. A Critical Review of RNN and LSTM Variants in Hydrological Time Series Predictions. MethodsX 2024, 13, 102946. [Google Scholar] [CrossRef]
  116. Ahmed, A.M.; Akther, S.; Nguyen-Huy, T.; Raj, N.; Jui, S.J.J.; Farzana, S. Real-Time Prediction of the Week-Ahead Flood Index Using Hybrid Deep Learning Algorithms with Synoptic Climate Mode Indices. J. Hydro-Environ. Res. 2024, 57, 12–26. [Google Scholar] [CrossRef]
  117. Cao, Q.; Zhang, H.; Zhu, F.; Hao, Z.; Yuan, F. Multi-step-ahead Flood Forecasting Using an Improved BiLSTM-S2S Model. J. Flood Risk Manag. 2022, 15, e12827. [Google Scholar] [CrossRef]
  118. Xia, Y.; Lu, J. Short-Term Flood Prediction Model Based on Pre-Training Enhancement. Electronics 2024, 13, 2203. [Google Scholar] [CrossRef]
  119. Cui, Z.; Guo, S.; Chen, H.; Liu, D.; Zhou, Y.; Xu, C.-Y. Quantifying and Reducing Flood Forecast Uncertainty by the CHUP-BMA Method. Hydrol. Earth Syst. Sci. 2024, 28, 2809–2829. [Google Scholar] [CrossRef]
  120. Selva Jeba, G.; Chitra, P. River Flood Prediction Through Flow Level Modeling Using Multi-Attention Encoder-Decoder-Based TCN with Filter-Wrapper Feature Selection. Earth Sci. Inform. 2024, 17, 5233–5249. [Google Scholar] [CrossRef]
  121. Kashem, A.; Das, P.; Hasan, M.M.; Karim, R.; Nasher, N.R. Hybrid Deep Learning Models for Multi-Ahead River Water Level Forecasting. Earth Sci. Inform. 2024, 17, 3021–3037. [Google Scholar] [CrossRef]
  122. Roudbari, N.S.; Punekar, S.R.; Patterson, Z.; Eicker, U.; Poullis, C. From Data to Action in Flood Forecasting Leveraging Graph Neural Networks and Digital Twin Visualization. Sci. Rep. 2024, 14, 18571. [Google Scholar] [CrossRef] [PubMed]
  123. Kimura, N.; Minakawa, H.; Fukushige, Y.; Kimura, M.; Baba, D. Water Level Predictions in a Drainage Pumping Station Using a Deep Learning Model, Coupled with a Physical Model and a Transfer Learning Approach. J. Jpn. Soc. Civ. Eng. Ser. B1 (Hydraul. Eng.) 2024, 77, I_319–I_324. [Google Scholar] [CrossRef]
  124. Ueda, F.; Tanouchi, H.; Egusa, N.; Yoshihiro, T. A Transfer Learning Approach Based on Radar Rainfall for River Water-Level Prediction. Water 2024, 16, 607. [Google Scholar] [CrossRef]
  125. Noymanee, J.; Theeramunkong, T. Flood Forecasting with Machine Learning Technique on Hydrological Modeling. Procedia Comput. Sci. 2019, 156, 377–386. [Google Scholar] [CrossRef]
  126. Sheng, Z.; Zheng, M. Pipe Network Water Level Prediction Platform Coupled with SWMM and LSTM. In Proceedings of the International Conference on Water Resource and Environment, Online, 21–24 November 2024; pp. 140–150. [Google Scholar]
  127. Olivetti, L.; Messori, G. Advances and Prospects of Deep Learning for Medium-range Extreme Weather Forecasting. Geosci. Model Dev. 2024, 17, 2347–2358. [Google Scholar] [CrossRef]
  128. Watson, P.A. Machine Learning Applications for Weather and Climate Need Greater Focus on Extremes. Environ. Res. Lett. 2022, 17, 111004. [Google Scholar] [CrossRef]
Figure 1. Search and selection process.
Water 17 02281 g001
Figure 2. Key concepts in data-driven flood forecasting.
Water 17 02281 g002
Figure 3. Time-lag concepts in flood forecasting.
Water 17 02281 g003
Figure 4. Expanding window vs. rolling window.
Water 17 02281 g004
Figure 5. Distribution of papers by year and publication type.
Water 17 02281 g005
Figure 6. Top 20 publication sources.
Water 17 02281 g006
Figure 7. Distribution of flood forecasting studies by country (2019–2024).
Water 17 02281 g007
Figure 8. (a) Input variable categories, (b) output categories of the selected studies.
Water 17 02281 g008
Figure 9. Distribution of data collection periods.
Water 17 02281 g009
Figure 10. Distribution of Data Collection Frequency (Time Step).
Water 17 02281 g010
Figure 11. Primary Modelling Approaches for Flood Forecasting.
Water 17 02281 g011
Figure 12. High-level Workflow Diagram of the Four Primary Modelling Approaches for Flood Forecasting.
Water 17 02281 g012
Figure 13. Distribution of technical approaches in flood forecasting studies (2019–2024): (a) Top 20 standalone forecasting algorithms; (b) Distribution of hybrid and ensemble approaches; (c) Top 10 hybrid algorithm combinations; (d) Top 5 physics-based models.
Water 17 02281 g013
Table 1. Search terms for the SMS on flood forecasting using data-driven models.
ConceptKeywords
Flood“flood*”, “river level”, “water level”, “river discharge”, “river height”
Technology“deep*learning”, “artificial*intelligence”, “machine*learning”, “data*mining”, “neural network”, “transformer”, “reinforcement learning”, “long short*term memory”, “lstm”, “decision tree”, “support vector machine”, “svm”, “ensemble*learning”, “ai”, etc.
Forecasting“predict*”, “forecast*”
Table 2. Inclusion and exclusion criteria.
TypeCriteria
ICIC1: Study discusses data-driven flood forecasting
Specific ECsEC1: Studies not addressing quantitative hydrological forecasting
  • Studies present only binary classifications (flood/no-flood) or other classifications.
  • Studies focused on flood susceptibility or risk mapping without time series forecasting
EC2: Studies with inappropriate temporal characteristics
  • Studies focused on monthly, seasonal, or yearly forecasting horizons.
  • Studies forecasting only the maximum water level per event without temporal progression
EC3: Studies with methodological misalignment
  • Studies where data-driven components are in secondary roles.
  • Studies using purely statistical approaches without ML/DL components.
EC4: Studies not utilising hydrological variables (such as river discharge, water level, runoff) as target forecast variables
EC5: Studies with limited practical applicability
  • Studies without operational relevance for flood forecasting systems.
  • Studies presenting only theoretical frameworks without implementation.
Generic ECsEC6: Conference summaries/editorials/guidelines
EC7: Tertiary study (review article, etc.)
EC8: Non-English studies
EC9: Study without full-text access
EC10: Books and grey literature
EC11: Duplicate study
Table 3. Results from the selection stages.
StageApplied CriteriaAnalysed ContentInitial # of StudiesFinal # of StudiesReduction %
1EC 11Title and Abstract2760190831
2IC1, EC6–10Title and Abstract1908171110
3IC1, EC1–5Title and Abstract171169659
4IC1, EC1–5Full Paper69634850
5Snowballing, Research Groups, IC1, EC1–5Title and Abstract348407−17 (increased)
6Snowballing, Research Groups, IC1, EC1–10Full Paper40736311
Table 4. Data extraction form.
CategorySubcategoryRQ
Reference InformationTitle
Publication Year
Authors
Publication Type (Journal/Conference/Book)
Publication Source
RQ1
Geographical ContextCountry/Region of Study
River Basin/Watershed
RQ2
Data CharacteristicsInput Variables
Output Variables
Data Sources
Data Collection Period
Data Collection Frequency (Time Step)
Lag Time Implementation
RQ3
Technical ImplementationPreprocessing Techniques
Forecasting Algorithms
Physics-Based Models Used
Look-back Window Approach
Lead Time/Forecast Horizon
Uncertainty Quantification
Optimisation Methods
RQ4
Evaluation FrameworkError-based Metrics
Goodness-of-fit Metrics
Classification Metrics
Probabilistic Metrics
Hydrological-specific Metrics
Computational Performance
RQ5
Disclaimer/Publisher’s Note: The statements, opinions and data contained in all publications are solely those of the individual author(s) and contributor(s) and not of MDPI and/or the editor(s). MDPI and/or the editor(s) disclaim responsibility for any injury to people or property resulting from any ideas, methods, instructions or products referred to in the content.

