

Two-Dimensional Flood Modeling of a Piping-Induced Dam Failure Triggered by Seismic Deformation: A Case Study of the Doğantepe Dam

 , , and
Abstract
1. Introduction
2. Materials and Methods
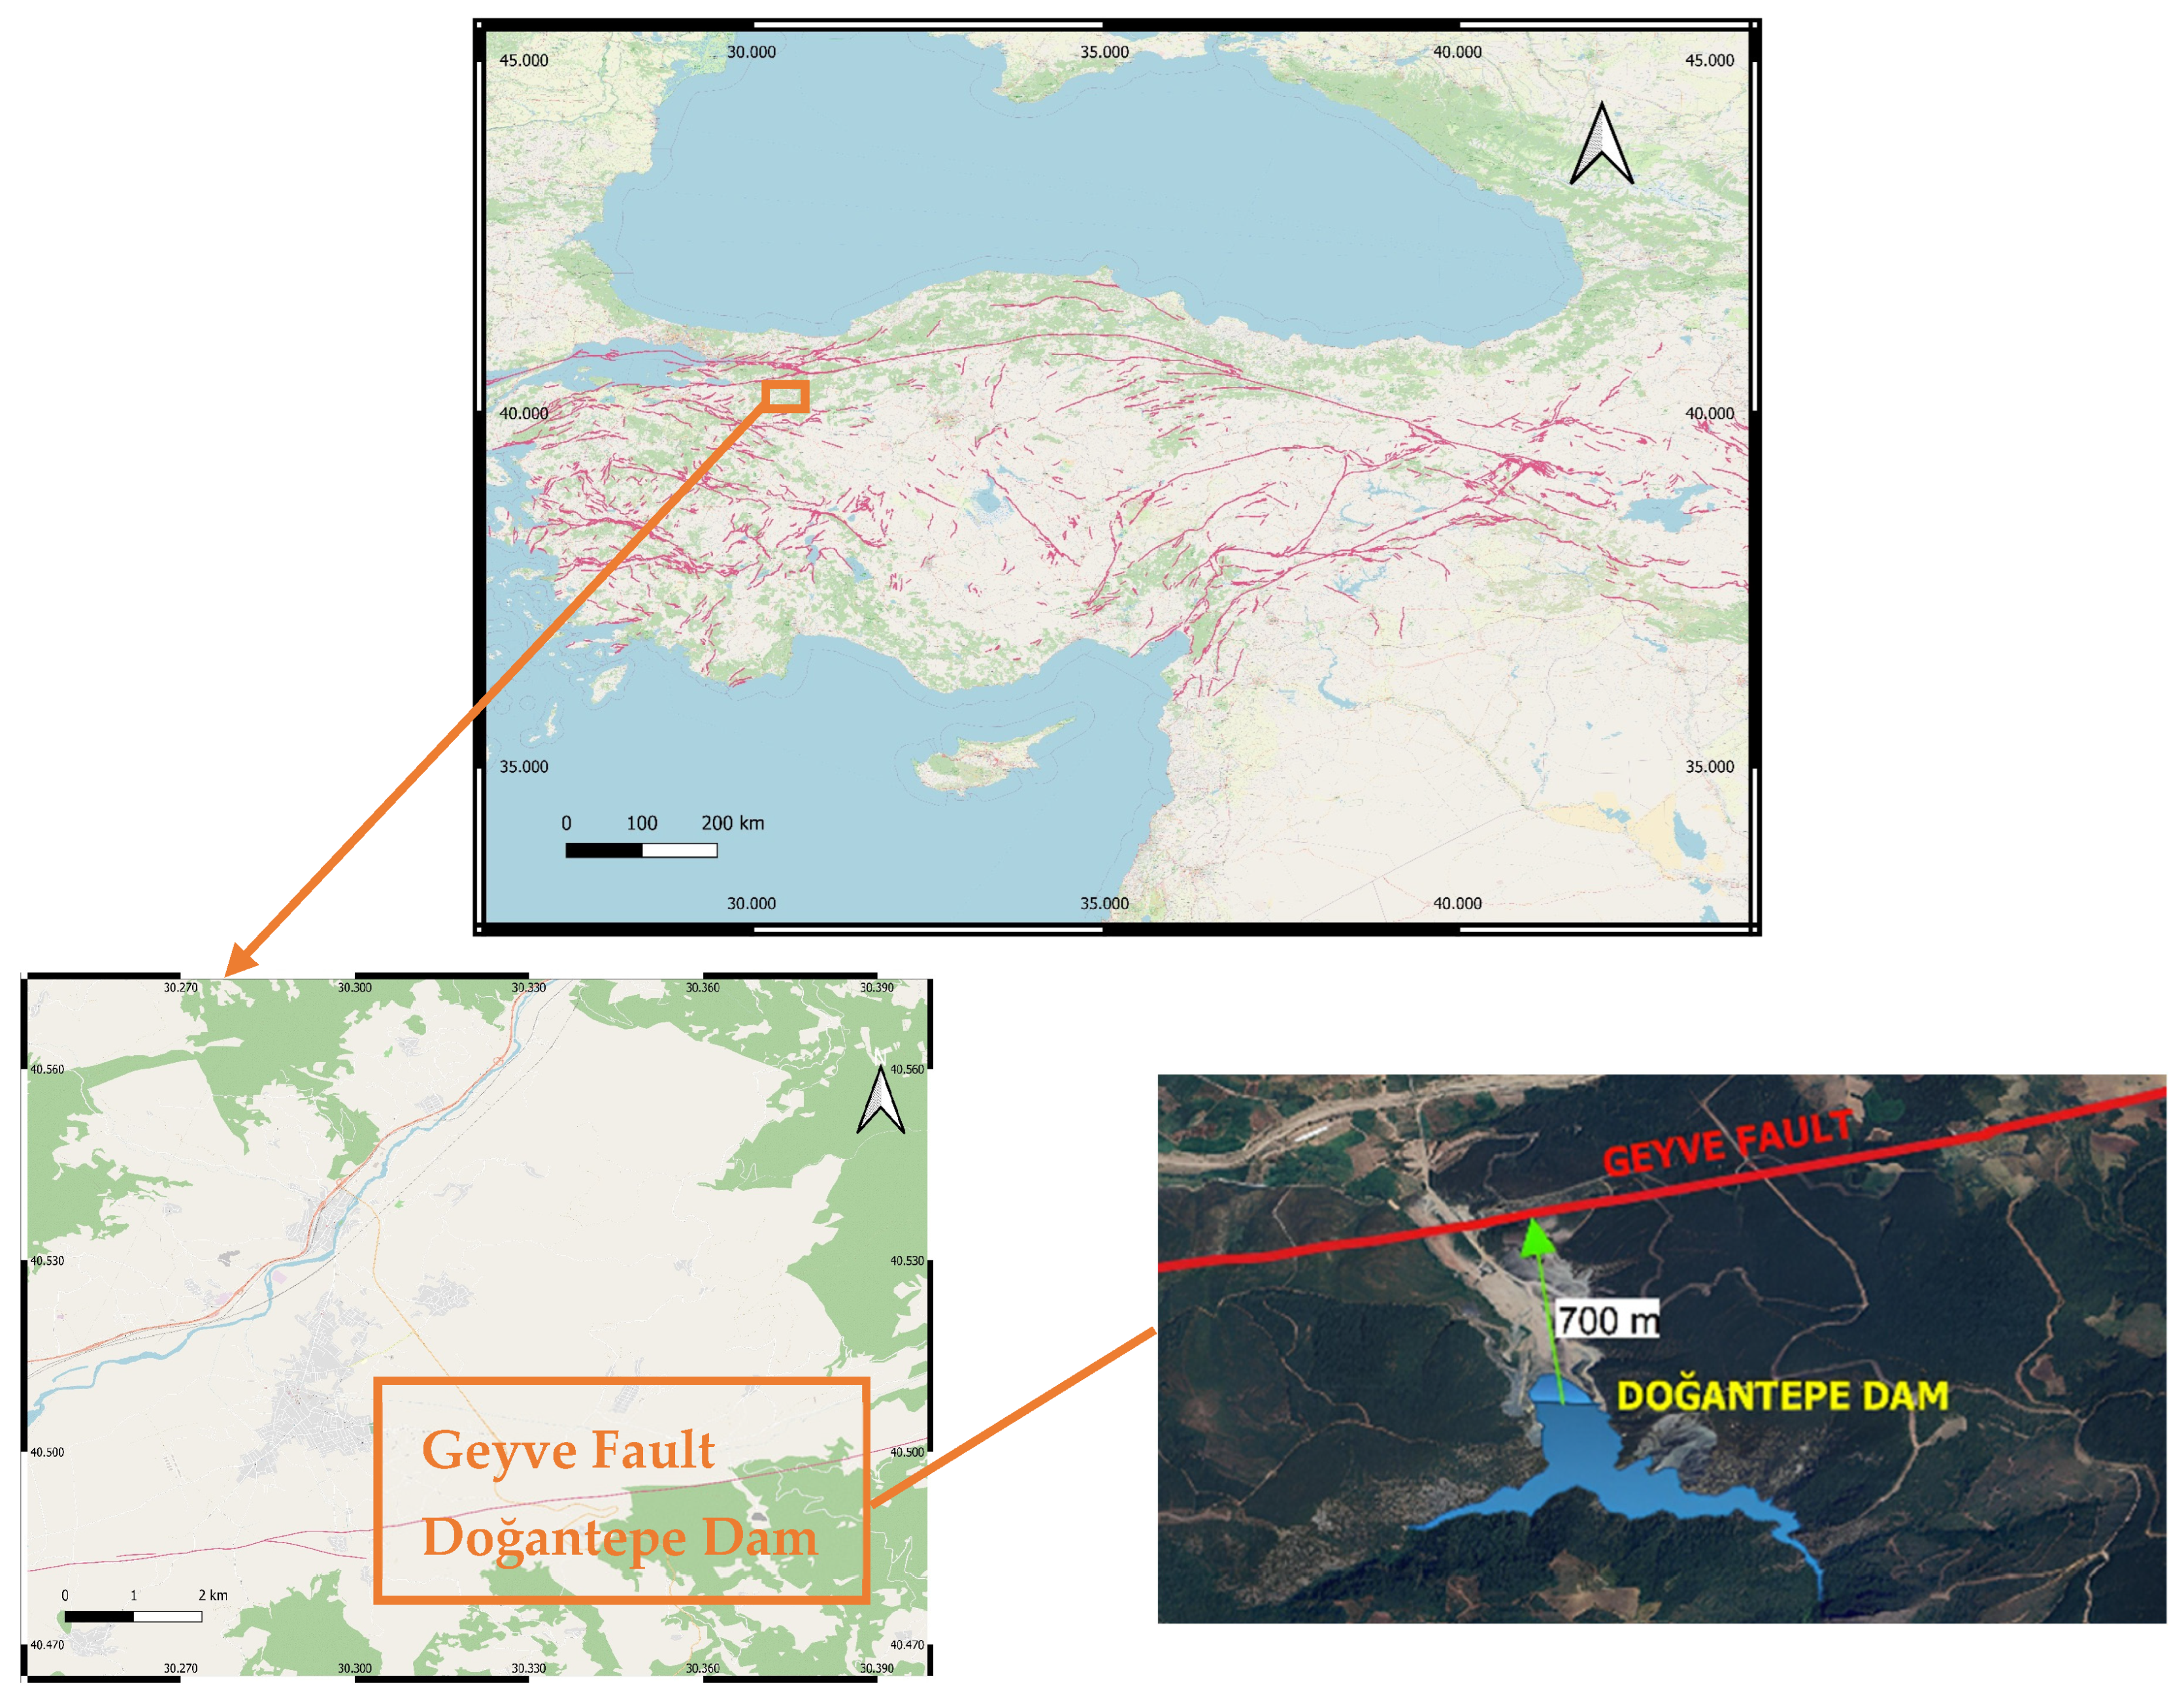
2.1. Study Area
2.2. Structural Behavior of the Dam Body Under Earthquake Loading and Failure Scenario
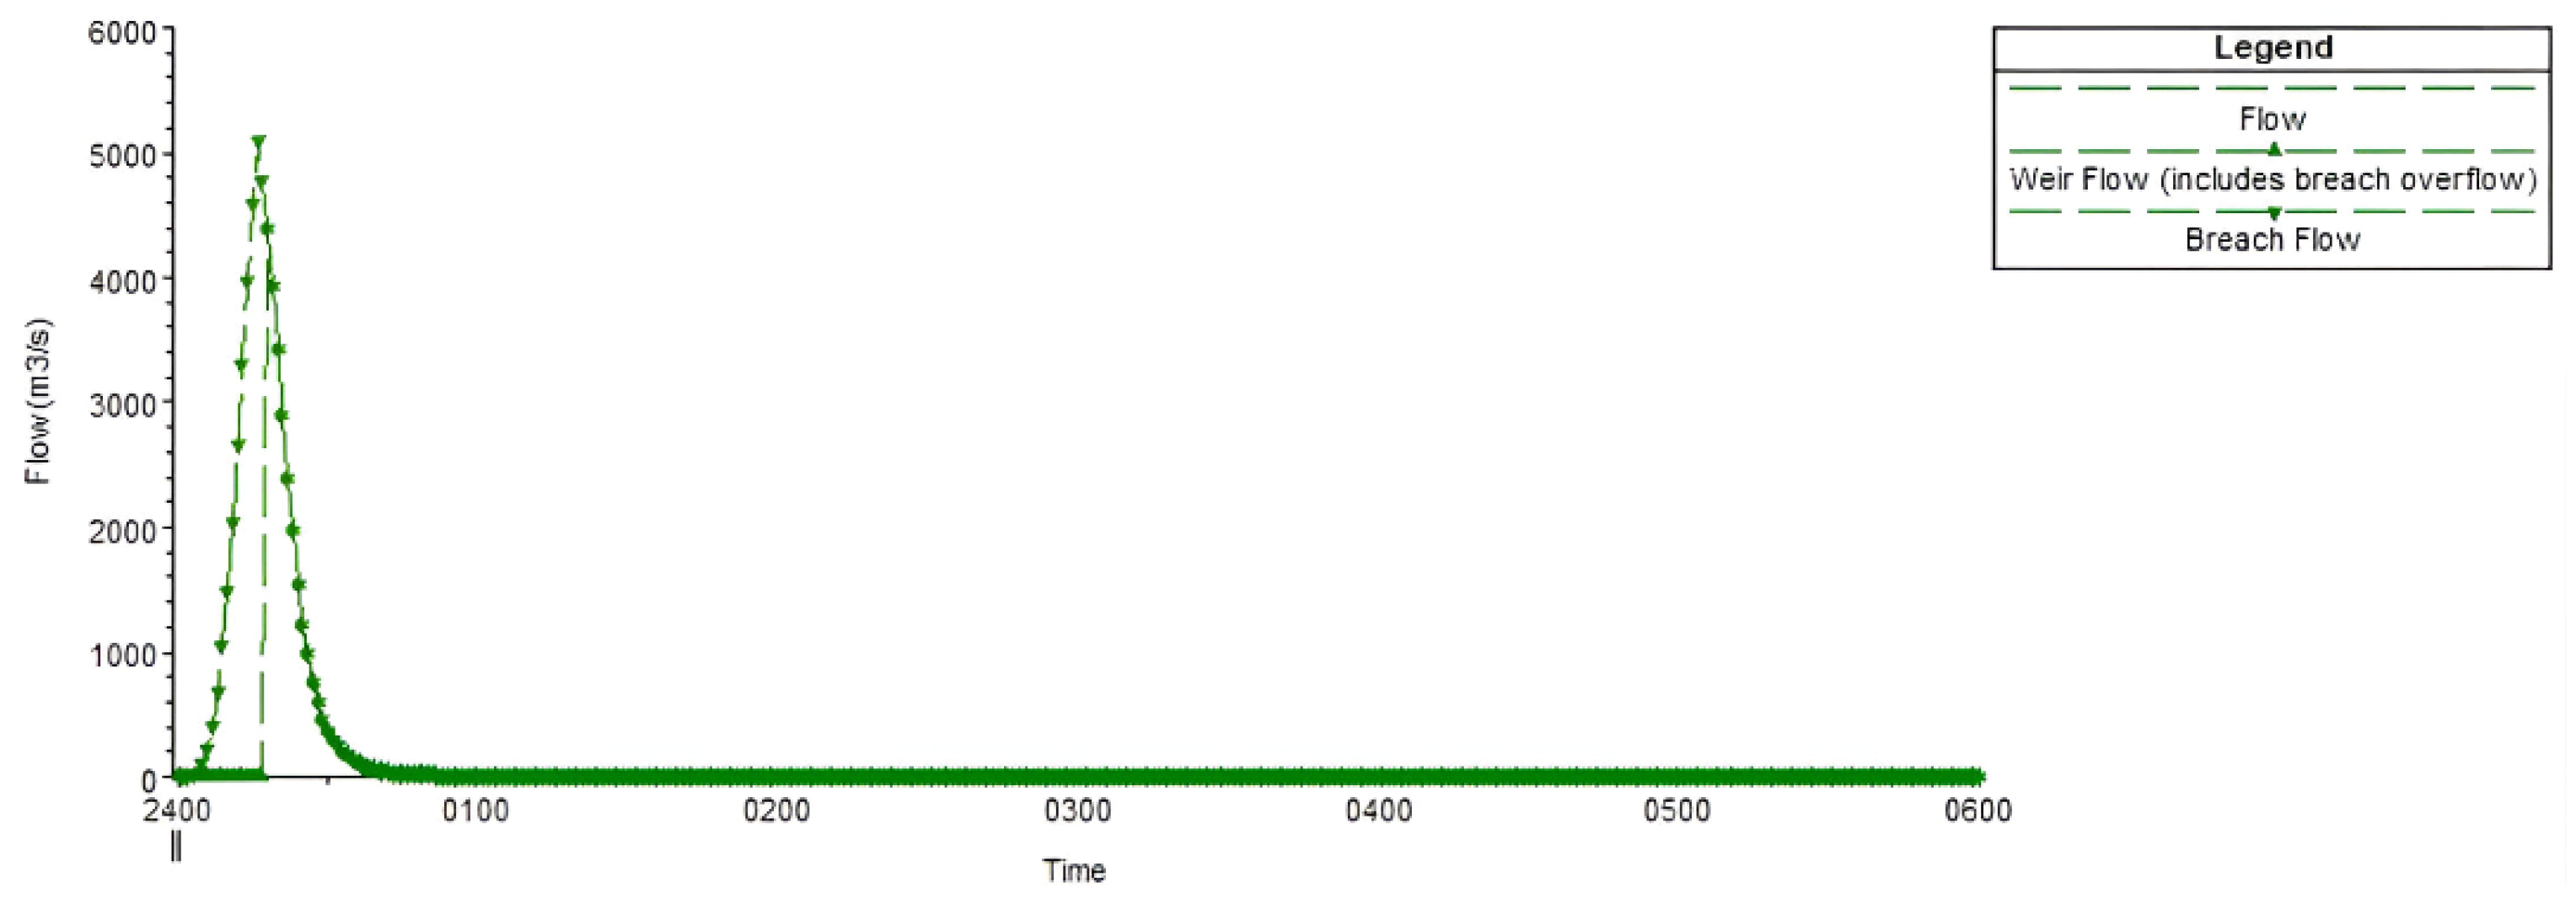
2.3. Definition of Breach Parameters
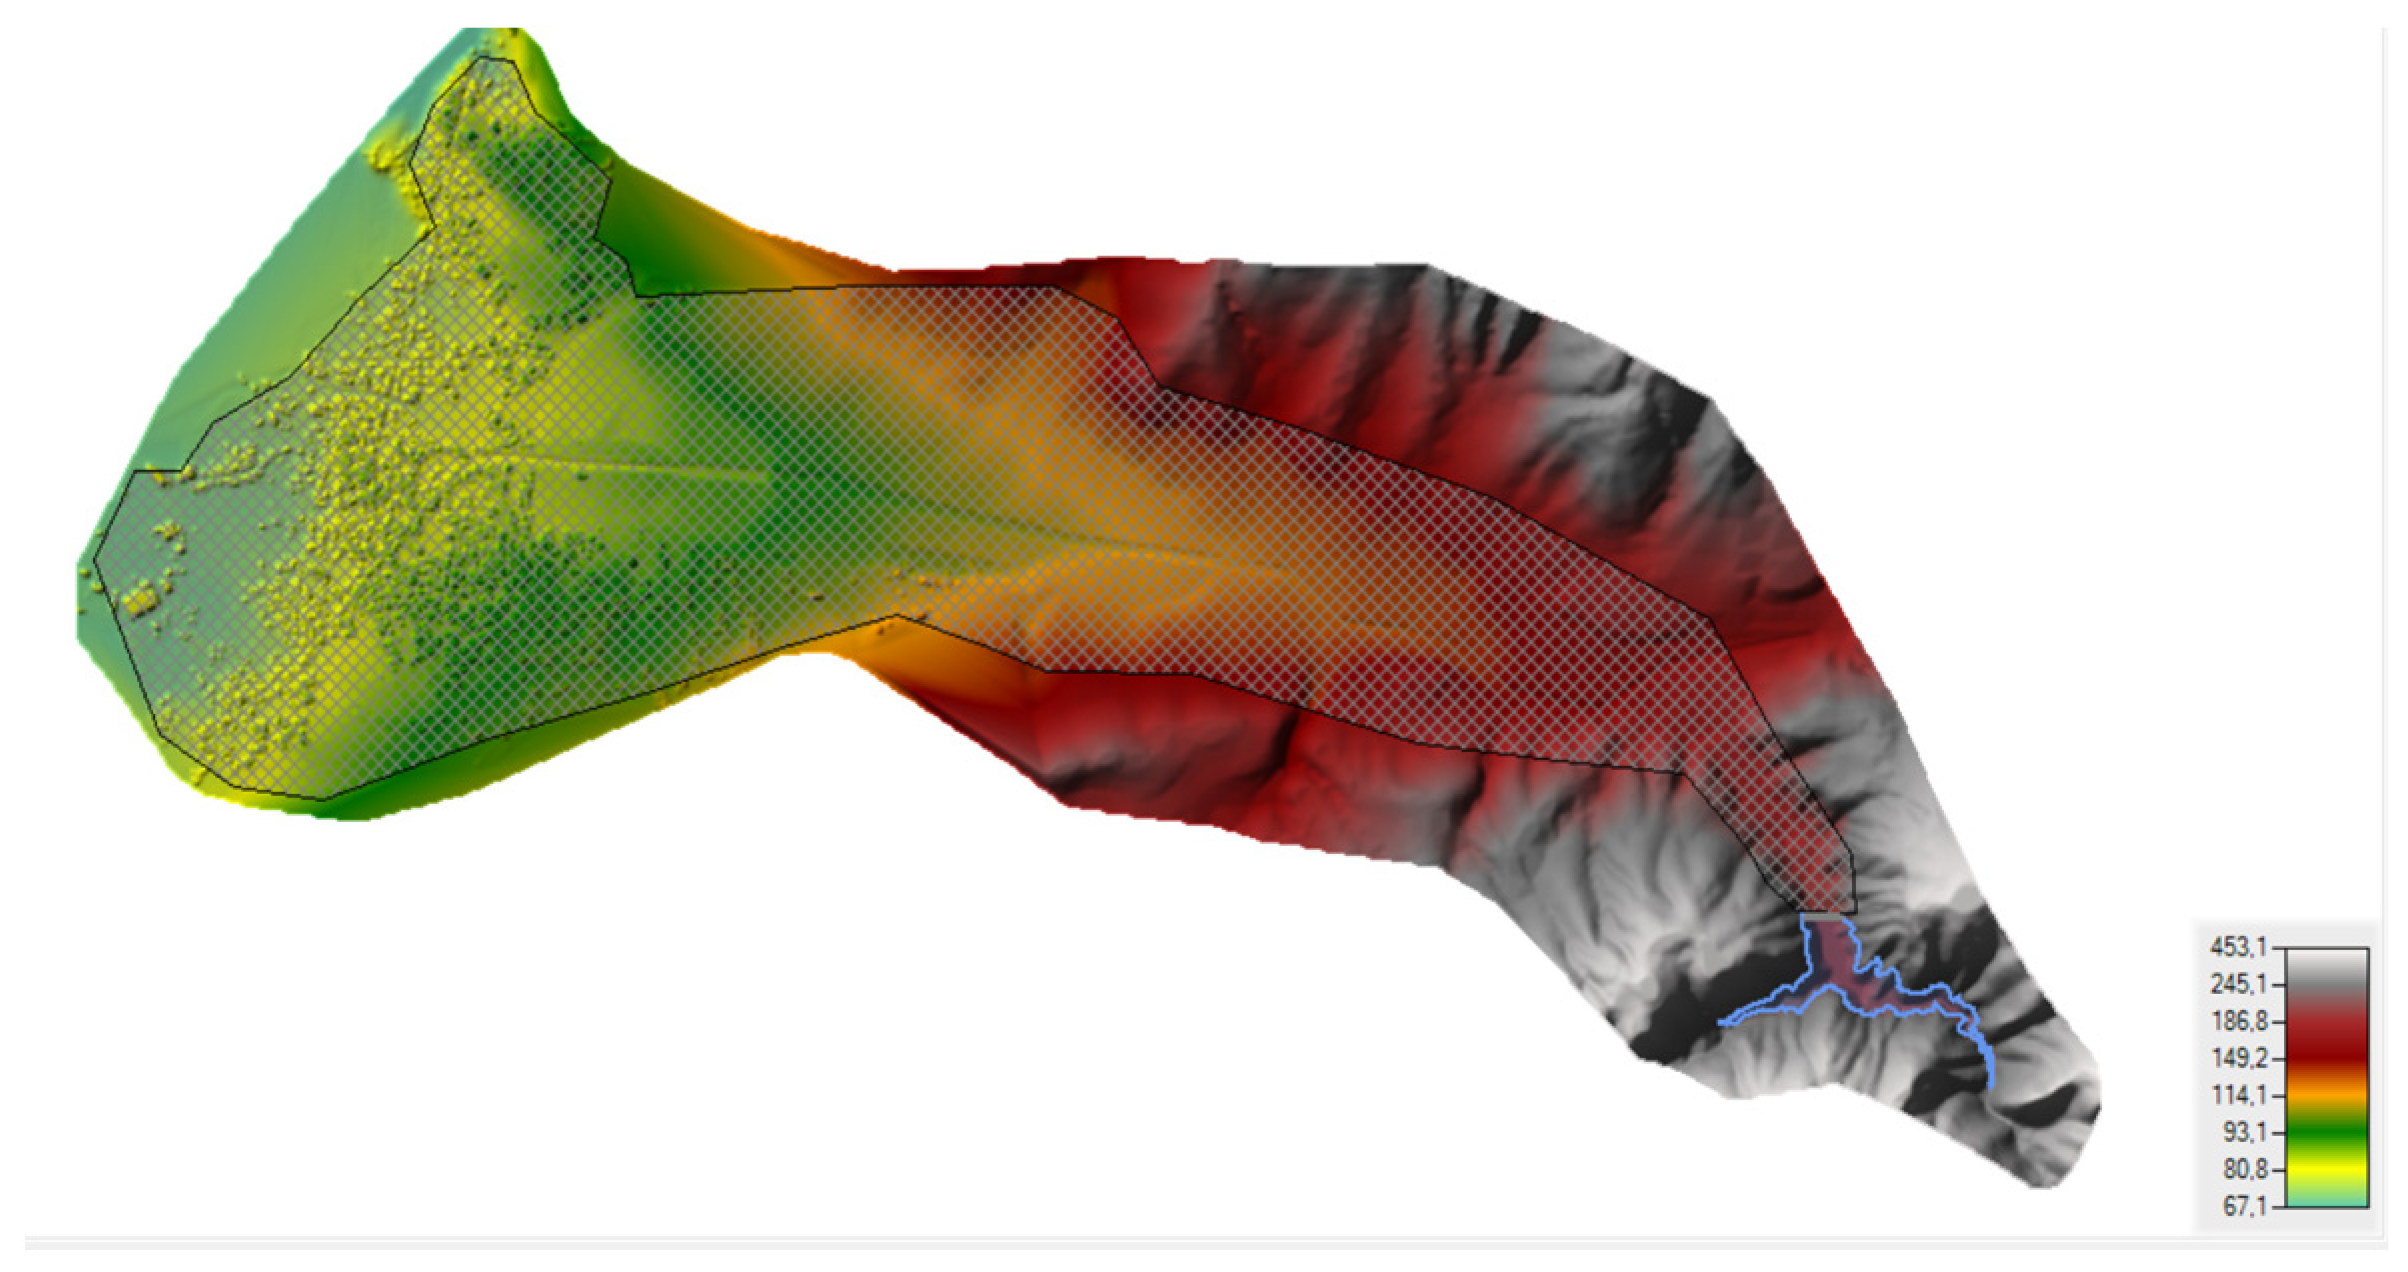
2.4. HEC-RAS 2D Modeling
3. Results
4. Discussion
5. Conclusions
Author Contributions
Funding
Data Availability Statement
Conflicts of Interest
References
- Huseiny, M.I.; Kuntoro, A.A.; Nugroho, E.O.; Kusuma, M.S.B. Dam-Break Risk Analysis and Mitigation at Pidekso Dam, Wonogiri Regency, Central Java, Indonesia. J. Water Manag. Model. 2024, 32, C521. [Google Scholar] [CrossRef]
- Abdulrahman, K.Z.; Faris, M.R.; Ibrahim, H.M.; Yousif, O.S.Q.; Ghafoor, A.A.; Othman, L.S.; Karakouzian, M. Hypothetical Failure of the Khassa Chai Dam and Flood Risk Analysis for Kirkuk, Iraq. Nat. Hazards 2022, 113, 1833–1851. [Google Scholar] [CrossRef]
- Ahmad, I.; Waseem, M.; Ashraf, A.; Leta, M.K.; Ahmad, S.; Wahab, H. Hydrological Risk Assessment for Mangla Dam: Compound Effects of Instant Flow and Precipitation Peaks under Climate Change, Using HEC-RAS and HEC-GeoRAS. SN Appl. Sci. 2023, 5, 344. [Google Scholar] [CrossRef]
- Sumira, M.; Anggraheni, E.; Prastica, R.M.S. Dam Break Analysis of Sermo Dam. J. Civ. Eng. Forum 2023, 9, 127–138. [Google Scholar] [CrossRef]
- Yang, M.; Cai, Q.; Li, Z.; Yang, J. Uncertainty Analysis on Flood Routing of Embankment Dam Breach Due to Overtopping Failure. Sci. Rep. 2023, 13, 20151. [Google Scholar] [CrossRef] [PubMed]
- Pathan, A.I.; Mohapatra, P.K.; Shaikh, A.A.; Agnihotri, P.G.; Sidek, L.M.; Ibrahim, M. Integrated Approach of Dam Break Analysis and Flood Inundation Mapping Using HEC-RAS—A Case Study of Ukai Dam, India. In Proceedings of the International Conference on Dam Safety Management and Engineering, Kuala Lumpur, Malaysia, 16–17 March 2023; Springer Nature: Singapore, 2023; pp. 589–606. [Google Scholar]
- Mattas, C.; Karpouzos, D.; Georgiou, P.; Tsapanos, T. Two-Dimensional Modelling for Dam Break Analysis and Flood Hazard Mapping: A Case Study of Papadia Dam, Northern Greece. Water 2023, 15, 994. [Google Scholar] [CrossRef]
- Ferrari, A.; Vacondio, R.; Mignosa, P. High-Resolution 2D Shallow Water Modelling of Dam Failure Floods for Emergency Action Plans. J. Hydrol. 2023, 618, 129192. [Google Scholar] [CrossRef]
- Darji, K.; Patel, D. A Dam Break Analysis Using HEC-RAS 2D Hydrodynamic Modeling for Decision-Making System. In Proceedings of the International Conference on Hydraulics, Water Resources and Coastal Engineering, Pune, India, 18–20 December 2024; Springer Nature: Singapore, 2024; pp. 183–194. [Google Scholar]
- Billal, K.; Ali, H.; Leila, M. Analysis Dam Failure and Flood Inundation Mapping: A Case Study of Manbaa-Al-Ghozlan Dam, Biskra, Algeria. Stud. Eng. Exact Sci. 2024, 5, 3312–3328. [Google Scholar] [CrossRef]
- Gaagai, A.; Aouissi, H.A.; Krauklis, A.E.; Burlakovs, J.; Athamena, A.; Zekker, I.; Boudoukha, A.; Benaabidate, L.; Chenchouni, H. Modeling and Risk Analysis of Dam-Break Flooding in a Semi-Arid Montane Watershed: A Case Study of the Yabous Dam, Northeastern Algeria. Water 2022, 14, 767. [Google Scholar] [CrossRef]
- Psomiadis, E.; Tomanis, L.; Kavvadias, A.; Soulis, K.X.; Charizopoulos, N.; Michas, S. Potential Dam Breach Analysis and Flood Wave Risk Assessment Using HEC-RAS and Remote Sensing Data: A Multicriteria Approach. Water 2021, 13, 364. [Google Scholar] [CrossRef]
- Pandey, B.R.; Knoblauch, H.; Zenz, G. Potential Dam Breach Flood Assessment with the 2D Diffusion and Full Dynamic Wave Equations Using a Hydrologic Engineering Center-River Analysis System. Water 2024, 16, 277. [Google Scholar] [CrossRef]
- Karamma, R.; Badaruddin, S.; Mustamin, R.; Saing, Z. Flood Modelling Due to Dam Failure Using HEC-RAS 2D with GIS Overlay: Case Study of Karalloe Dam in South Sulawesi Province Indonesia. Civ. Eng. Archit. 2022, 10, 2833–2846. [Google Scholar] [CrossRef]
- Brunner, G.W. HEC-RAS, River Analysis System Hydraulic Reference Manual; US Army Corps of Engineers: Davis, CA, USA, 2016.
- Urzică, A.; Mihu-Pintilie, A.; Stoleriu, C.C.; Cîmpianu, C.I.; Huţanu, E.; Pricop, C.I.; Grozavu, A. Using 2D HEC-RAS Modeling and Embankment Dam Break Scenario for Assessing the Flood Control Capacity of a Multi-Reservoir System (NE Romania). Water 2020, 13, 57. [Google Scholar] [CrossRef]
- Abdelghani, L. Modeling of Dam-Break Flood Wave Propagation Using HEC-RAS 2D and GIS: Case Study of Taksebt Dam in Algeria. World J. Eng. 2024, 21, 376–385. [Google Scholar] [CrossRef]
- Sonmez, O.; Demir, I.H.; Demir, F.; Dobrucali, E. Determination of Flood Inundation Areas and Assessment of Flood Hazard Costs in Urban Settlements: A Case Study of Agva. J. Environ. Prot. Ecol. 2017, 18, 509–523. [Google Scholar]
- Khosravi, K.; Rostaminejad, M.; Cooper, J.R.; Mao, L.; Melesse, A.M. Dam Break Analysis and Flood Inundation Mapping: The Case Study of Sefid-Roud Dam, Iran. In Extreme Hydrology and Climate Variability; Elsevier: Amsterdam, The Netherlands, 2019; pp. 395–405. [Google Scholar]
- Federico, F.; Cesali, C. Effects of Dam Failure Mechanisms on Downstream Flood Propagation. In Proceedings of the International Conference on Embankment Dams, Beijing, China, 5–7 June 2020; Springer International Publishing: Cham, Switzerland, 2020; pp. 149–162. [Google Scholar]
- Bharath, A.; Shivapur, A.V.; Hiremath, C.G.; Maddamsetty, R. Dam Break Analysis Using HEC-RAS and HEC-GeoRAS: A Case Study of Hidkal Dam, Karnataka State, India. Environ. Chall. 2021, 5, 100401. [Google Scholar] [CrossRef]
- Zhang, L.; Xu, Y.; Jia, J.S. Analysis of Earth Dam Failures: A Database Approach; Taylor & Francis: Abingdon, UK, 2009; Volume 3, pp. 184–189. [Google Scholar] [CrossRef]
- Wahl, T.L. Uncertainty of Predictions of Embankment Dam Breach Parameters. J. Hydraul. Eng. 2004, 130, 389–397. [Google Scholar] [CrossRef]
- Elgamal, A.; Yang, Z.; Parra, E.; Ragheb, A. Modeling of Cyclic Mobility in Saturated Cohesionless Soils. Int. J. Plast. 2003, 19, 883–905. [Google Scholar] [CrossRef]
- Ardıçlıoğlu, M. Adana Seyhan Barajının Yıkılma ve 2 Boyutlu Taşkın Yayılımının HEC-RAS Ile Modellenmesi. Çukurova Üniversitesi Mühendislik Fakültesi Derg. 2024, 39, 741–752. [Google Scholar] [CrossRef]
- Froehlich, D.C. Embankment Dam Breach Parameters and Their Uncertainties. J. Hydraul. Eng. 2008, 134, 1708–1721. [Google Scholar] [CrossRef]
- Mohammed, L.A.; Khassaf, S.I.; Al-Murshidi, K.R. Application HEC-RAS Model to Simulate the Flood Wave Due to Dam Failure. In Proceedings of the 2019 4th Scientific International Conference Najaf (SICN), Al-Najef, Iraq, 29–30 April 2019; pp. 150–155. [Google Scholar]
- Turkel, A.O.; Zaifoglu, H.; Yanmaz, A.M. Probabilistic Modeling of Dam Failure Scenarios: A Case Study of Kanlikoy Dam in Cyprus. Nat. Hazards 2024, 120, 10087–10117. [Google Scholar] [CrossRef]
- Spero, H.; Calhoun, D.; Schubert, M. Simulating the 1976 Teton Dam Failure Using Geoclaw and HEC-RAS and Comparing with Historical Observations. arXiv 2022, arXiv:2206.00766. [Google Scholar] [CrossRef]
- Sarayli, S.; Sert, S.; Sonmez, O. Analysis of Fill Dam Using Finite Element Method and Comparison with Monitoring Results. Water 2024, 16, 2387. [Google Scholar] [CrossRef]
- Sarayli, S.; Sonmez, O.; Sert, S.; Demir, F.; Tuncer Evcil, G.; Baycan, A.; Ergun, M. Dynamic Analysis of Geyve Dogantepe Dam; Technical Note; Sakarya University Disaster Management Application and Research Center: Sakarya, Türkiye, 2025. [Google Scholar]
- Devlet Su İşleri Genel Müdürlüğü (DSİ). Baraj Tasarımında Sismik Parametre Seçimi Rehberi; T.C. Orman ve Su İşleri Bakanlığı: Ankara, Türkiye, 2012.
- Wahl, T.L. Prediction of Embankment Dam Breach Parameters: A Literature Review and Needs Assessment; Report No. DSO-98-004; U.S. Department of the Interior, Bureau of Reclamation, Dam Safety Office: Denver, CO, USA, 1998.
- United States Army Corps of Engineers. Slope Stability—Engineering Manual EM 1110-2-1902; United States Army Corps of Engineers: Washington, DC, USA, 2003.
- Federal Emergency Management Agency. Federal Guidelines for Inundation Mapping of Flood Risks Associated with Dam Incidents and Failures; Federal Emergency Management Agency: Washington, DC, USA, 2013.
- Elgamal, A.; Yang, Z.; Parra, E. Computational Modeling of Cyclic Mobility and Post-Liquefaction Site Response. Soil Dyn. Earthq. Eng. 2002, 22, 259–271. [Google Scholar] [CrossRef]
- Federal Emergency Management Agency. Federal Guidelines for Dam Safety: Emergency Action Planning for Dams; FEMA P-64; Federal Emergency Management Agency: Washington, DC, USA, 2013.
- Von Thun, D.R.; Gillette, J.L. Guidance on Breach Parameters: Presentation to the NRC Committee on Safety Criteria for Dams; U.S. Bureau of Reclamation: Denver, CO, USA, 1990.
- MacDonald, T.C.; Langridge-Monopolis, J. Breaching Charateristics of Dam Failures. J. Hydraul. Eng. 1984, 110, 567–586. [Google Scholar] [CrossRef]
- US Army Corps of Engineers (USACE). HEC-RAS Hydraulic Reference Manual; Version 6.6; USACE: Davis, CA, USA, 2024.
- Horritt, M.S.; Bates, P.D. Evaluation of 1D and 2D Numerical Models for Predicting River Flood Inundation. J. Hydrol. 2002, 268, 87–99. [Google Scholar] [CrossRef]
- U.S. Army Corps of Engineers (USACE). HEC-RAS River Analysis System 2D Modeling User’s Manual; Version 6.0; U.S. Army Corps of Engineers (USACE): Davis, CA, USA, 2021.
- Esri. Land Use Land Cover 10m Annual Global Raster (Sentinel-2). Available online: https://livingatlas.arcgis.com/landcover (accessed on 23 December 2024).
- Chow, V.T. Open-Channel Hydraulics; McGraw-Hill: New York, NY, USA, 1959. [Google Scholar]


| Feature | Value |
|---|---|
| Dam type | Concrete-faced sand–gravel embankment |
| Dam height (from thalweg) | 50.50 m |
| Crest length | 209.90 m |
| Parapet crest elevation | 235.50 m |
| Minimum water level | 214.15 m |
| Normal water level | 230.60 m |
| Maximum water level | 234.27 m |
| Reservoir volume at normal level | 2.89 hm3 |
| Parameter | Description |
|---|---|
| Breach Location | Seismic deformation zones (PLAXIS 2D). |
| Breach Base Elevation | Weak zone from seismic assessment. |
| Breach Width | Von Thun & Gillette empirical method. |
| Side Slope Ratio (Z:1) | Typical for internal erosion breaches. |
| Formation Time | Low erosion resistance scenario. |
| Trigger Reservoir Level | Maximum operational level. |
| Breach Progression Type | Sudden failure representing piping. |
| Failure Mechanism | Piping-type internal erosion scenario. |
| Material Erosion Resistance | Low category, sand–gravel fill. |
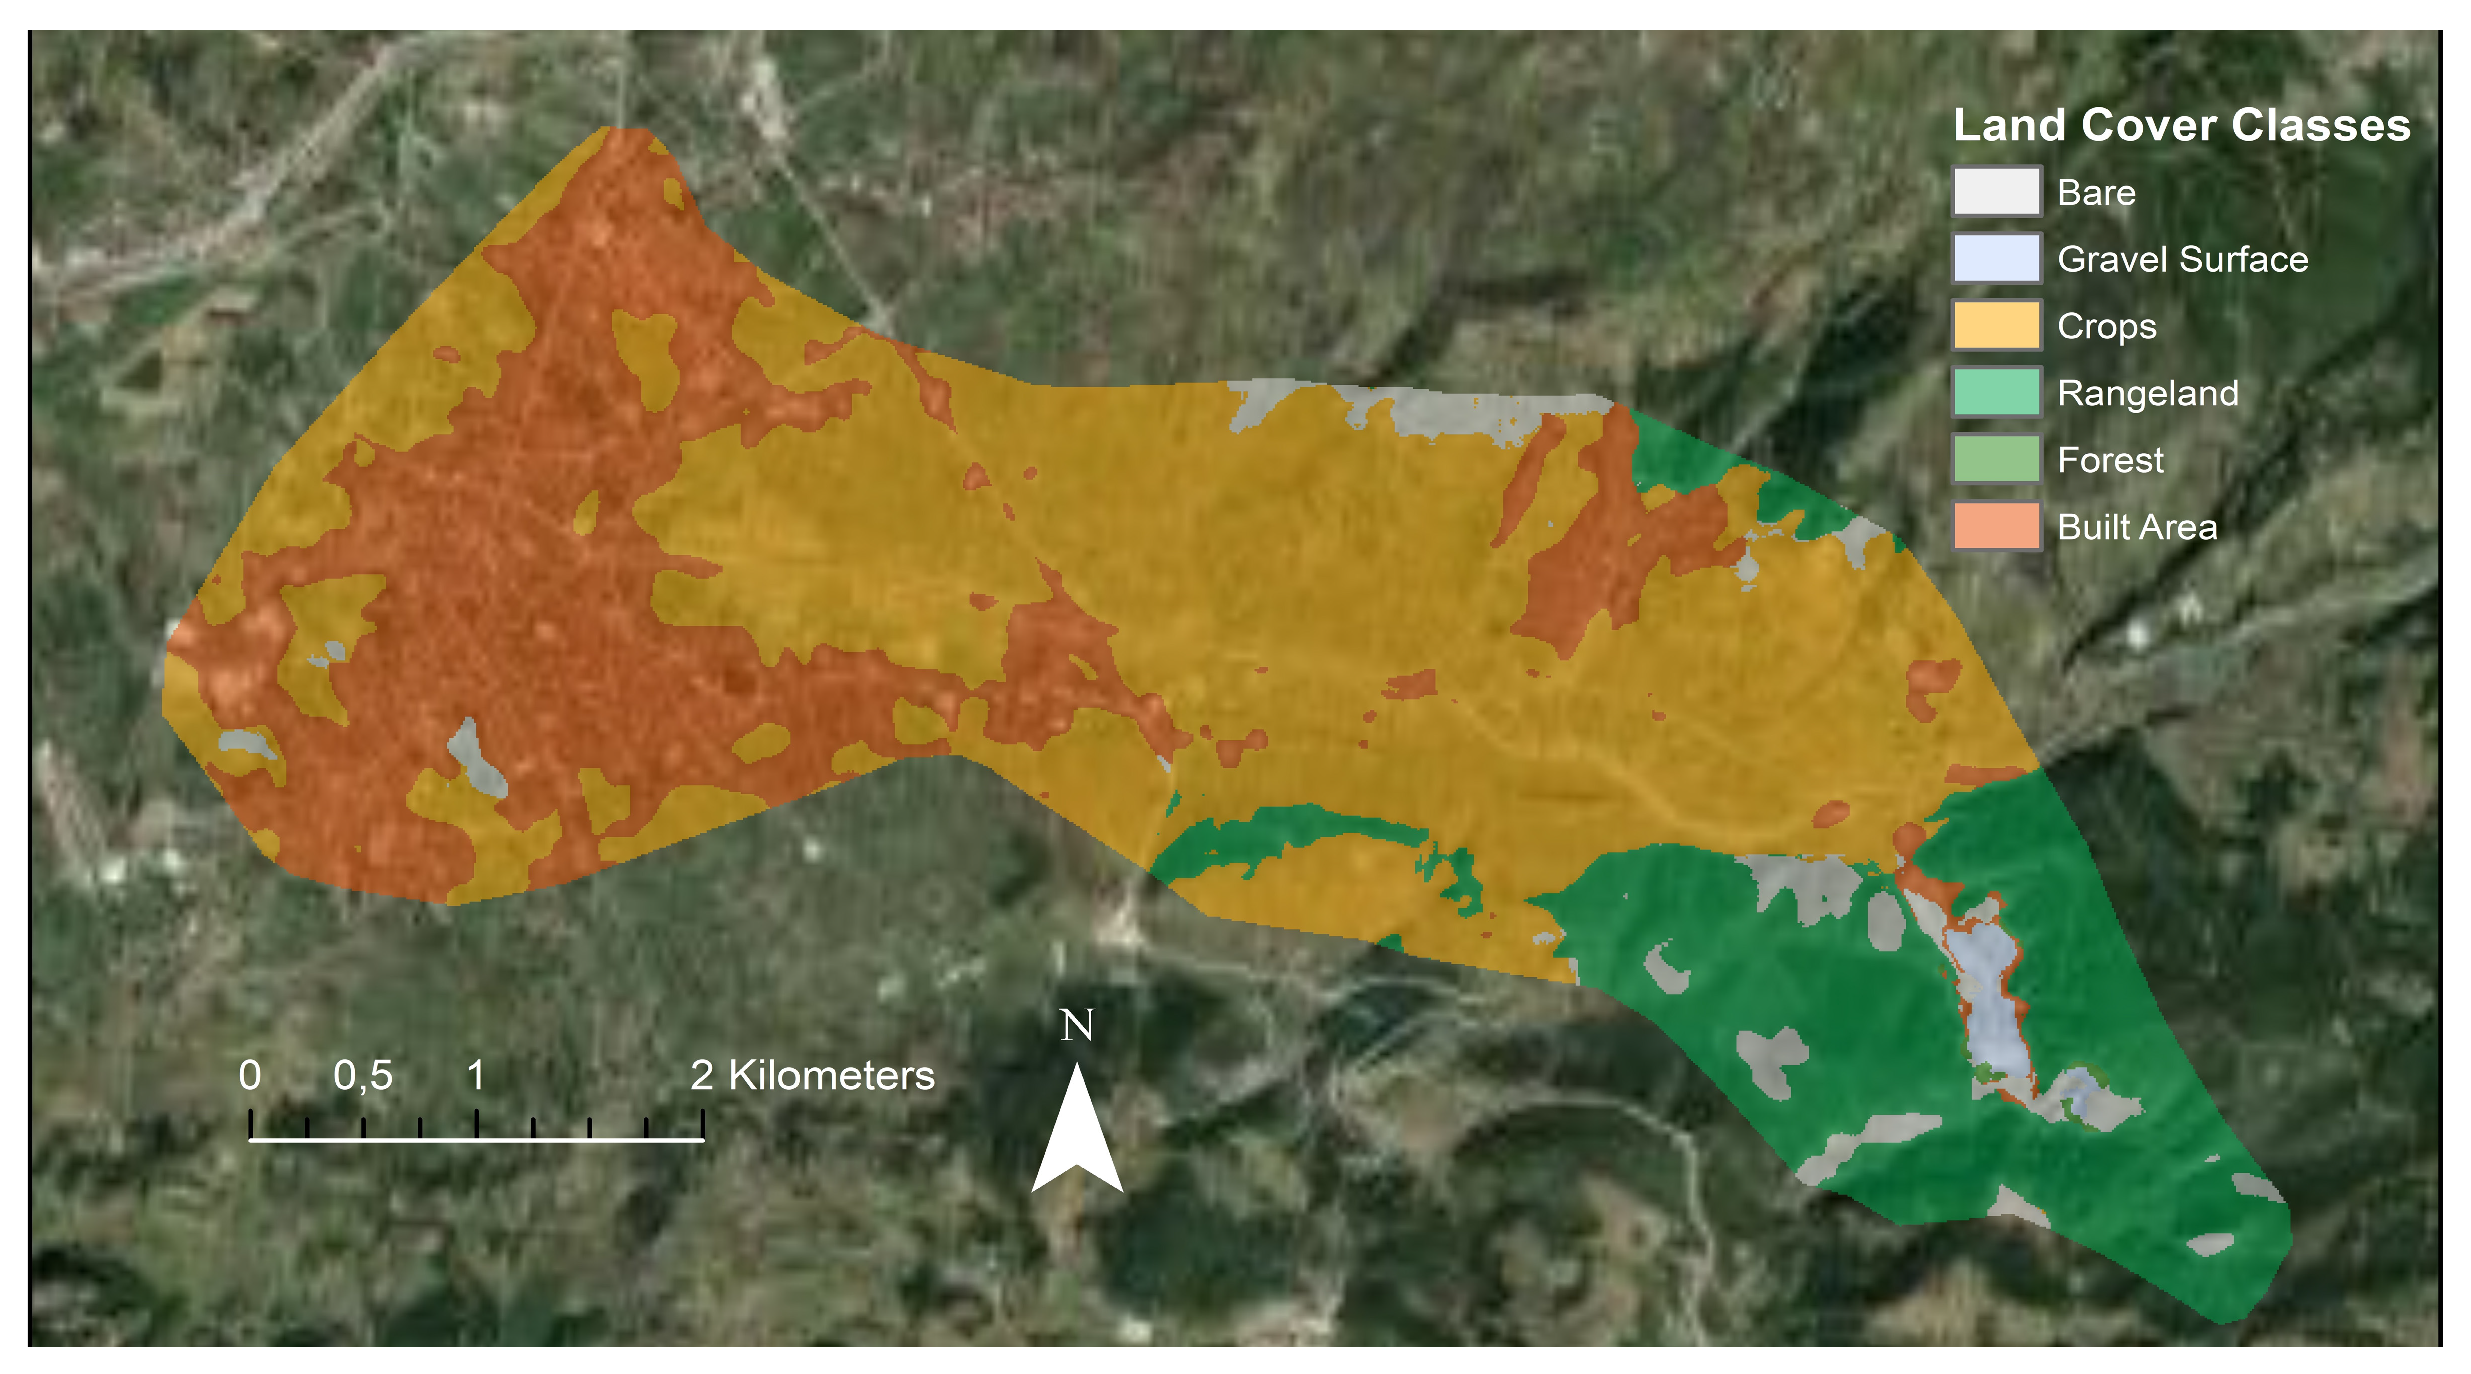
| Land Cover Class | Manning’s n |
|---|---|
| Bare | 0.025 |
| Gravel Surface | 0.03 |
| Crops | 0.045 |
| Rangeland | 0.04 |
| Forest | 0.10 |
| Built Area | 0.12 |
Disclaimer/Publisher’s Note: The statements, opinions and data contained in all publications are solely those of the individual author(s) and contributor(s) and not of MDPI and/or the editor(s). MDPI and/or the editor(s) disclaim responsibility for any injury to people or property resulting from any ideas, methods, instructions or products referred to in the content. |
© 2025 by the authors. Licensee MDPI, Basel, Switzerland. This article is an open access article distributed under the terms and conditions of the Creative Commons Attribution (CC BY) license (https://creativecommons.org/licenses/by/4.0/).
Share and Cite
Demir, F.; Sarayli, S.; Sonmez, O.; Ergun, M.; Baycan, A.; Tuncer Evcil, G. Two-Dimensional Flood Modeling of a Piping-Induced Dam Failure Triggered by Seismic Deformation: A Case Study of the Doğantepe Dam. Water 2025, 17, 2207. https://doi.org/10.3390/w17152207
Demir F, Sarayli S, Sonmez O, Ergun M, Baycan A, Tuncer Evcil G. Two-Dimensional Flood Modeling of a Piping-Induced Dam Failure Triggered by Seismic Deformation: A Case Study of the Doğantepe Dam. Water. 2025; 17(15):2207. https://doi.org/10.3390/w17152207
Chicago/Turabian StyleDemir, Fatma, Suleyman Sarayli, Osman Sonmez, Melisa Ergun, Abdulkadir Baycan, and Gamze Tuncer Evcil. 2025. "Two-Dimensional Flood Modeling of a Piping-Induced Dam Failure Triggered by Seismic Deformation: A Case Study of the Doğantepe Dam" Water 17, no. 15: 2207. https://doi.org/10.3390/w17152207
APA StyleDemir, F., Sarayli, S., Sonmez, O., Ergun, M., Baycan, A., & Tuncer Evcil, G. (2025). Two-Dimensional Flood Modeling of a Piping-Induced Dam Failure Triggered by Seismic Deformation: A Case Study of the Doğantepe Dam. Water, 17(15), 2207. https://doi.org/10.3390/w17152207