
Integration of Remote Sensing and Machine Learning Approaches for Operational Flood Monitoring Along the Coastlines of Bangladesh Under Extreme Weather Events
 ,
,  , , , ,
  ,
,
Abstract
1. Introduction
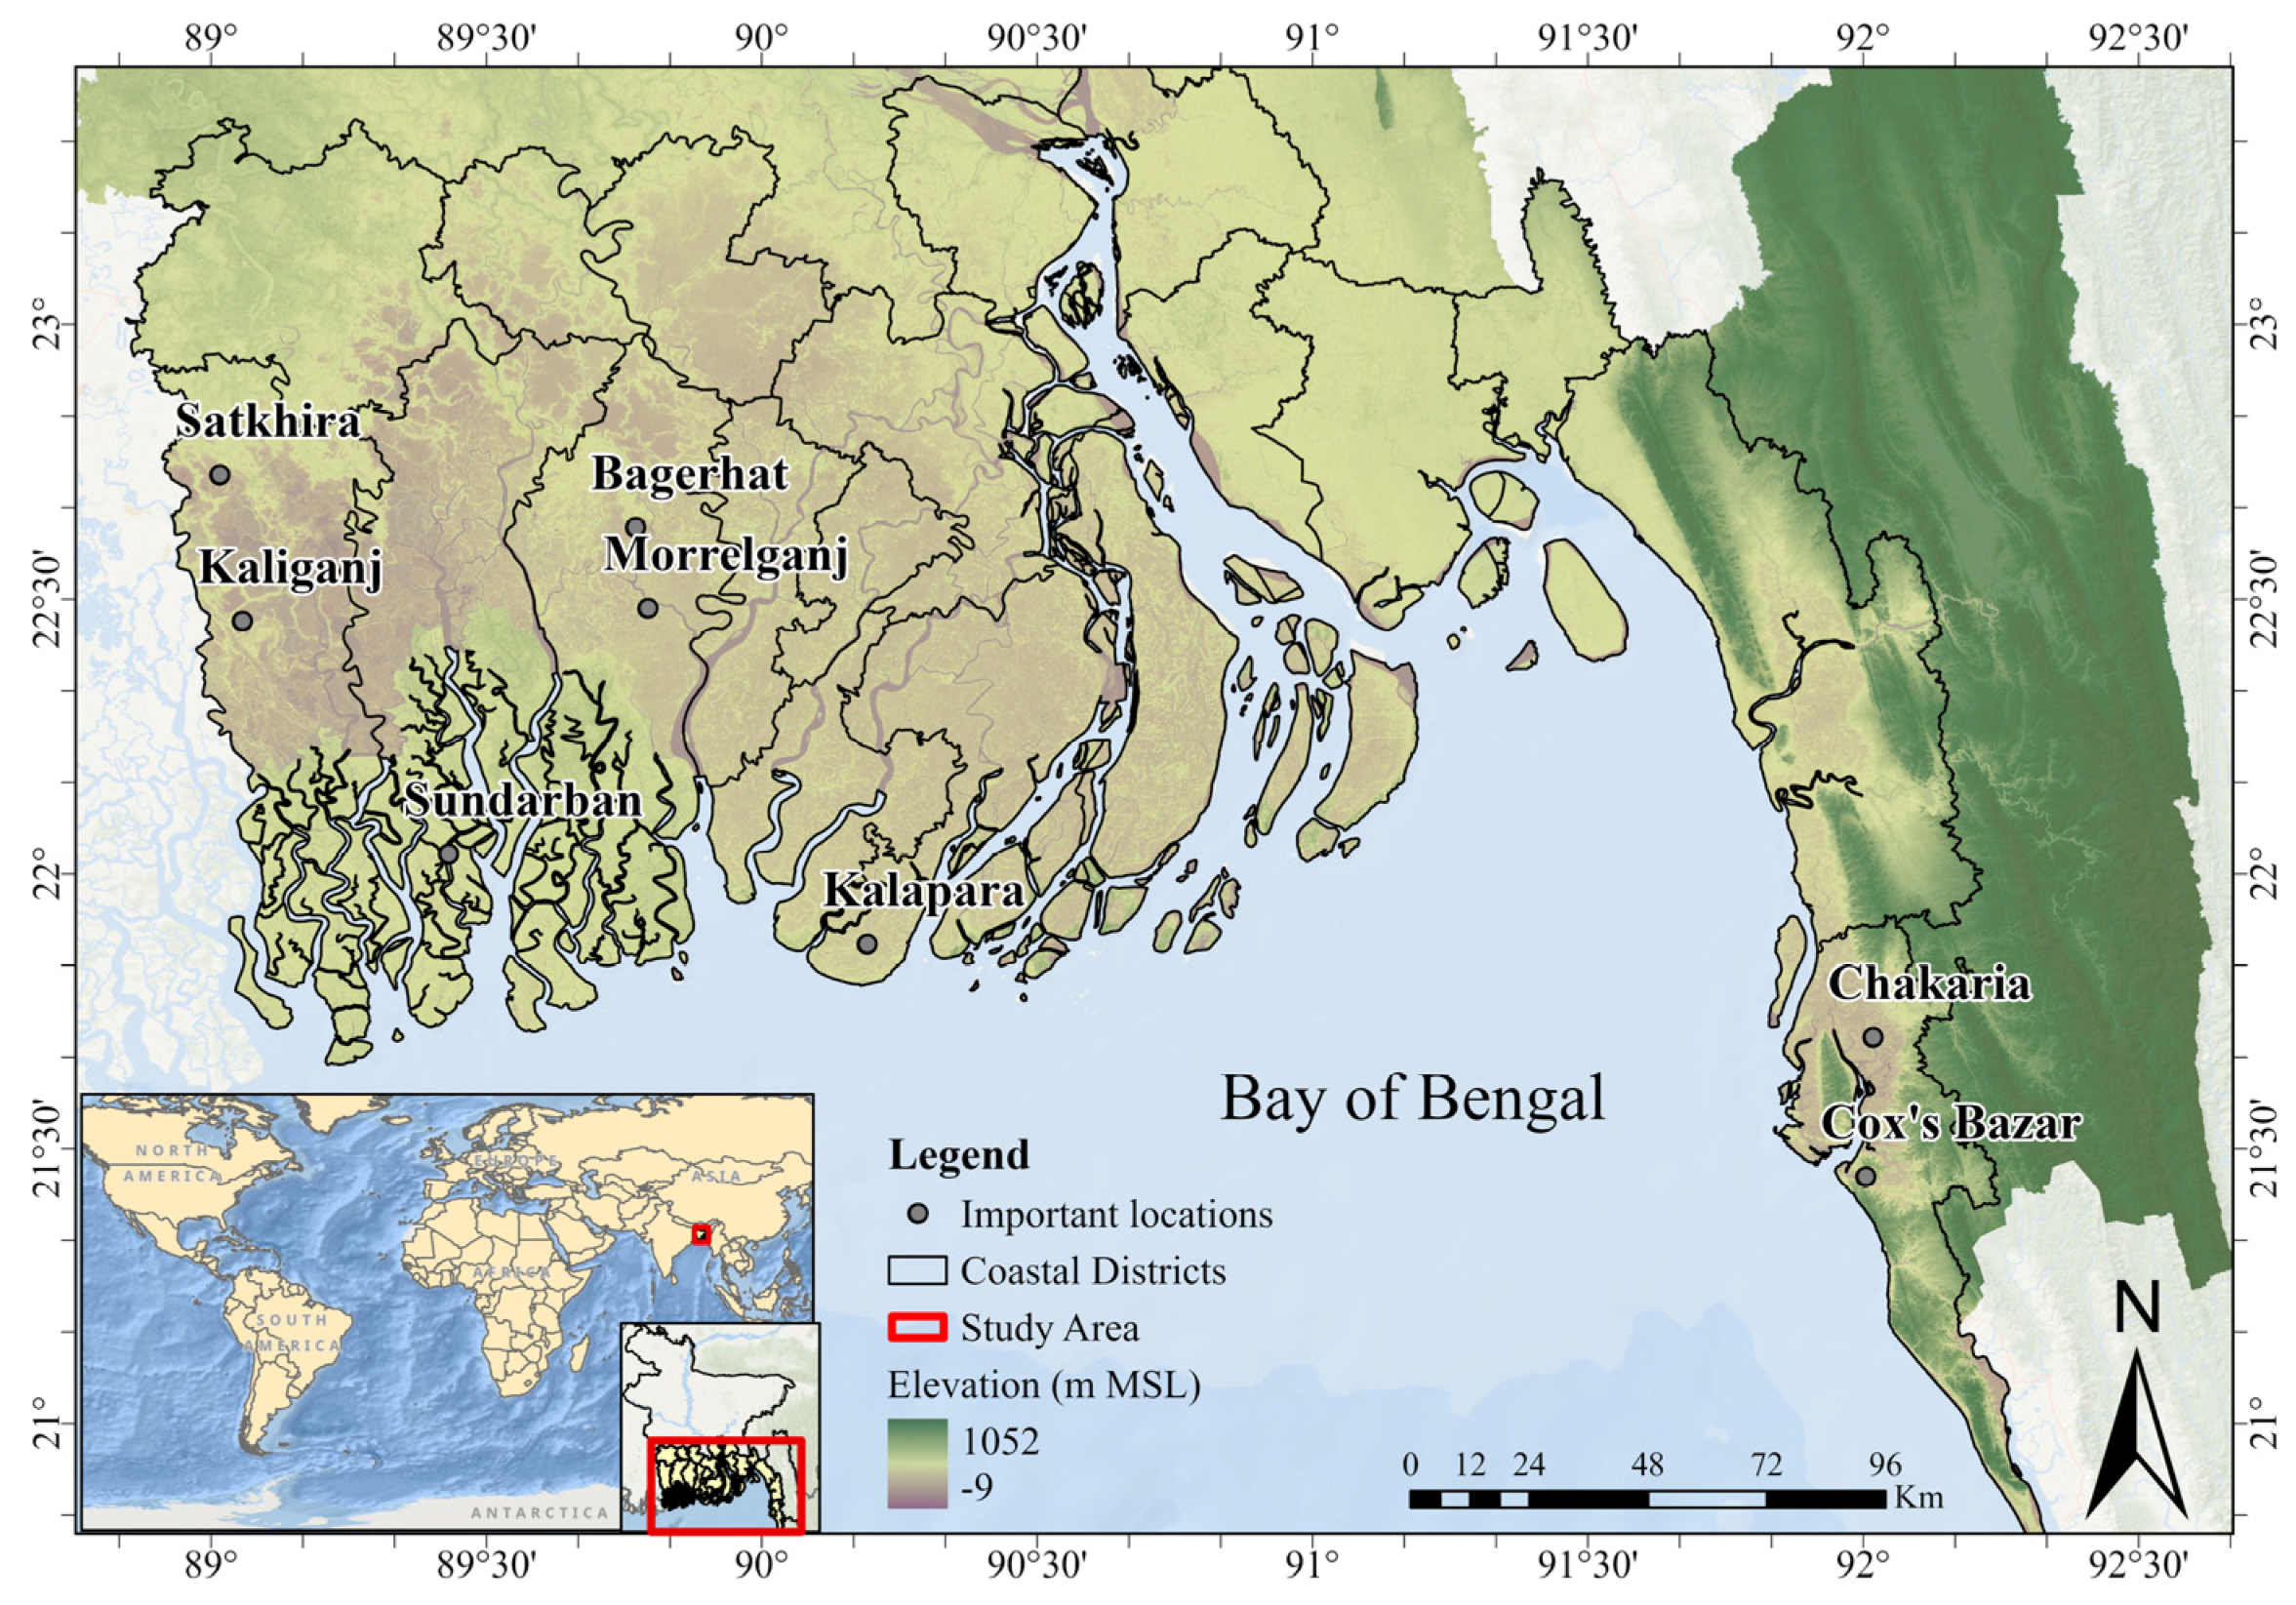
2. Study Area
3. Data and Methods
3.1. Data Sources
3.2. Methodology
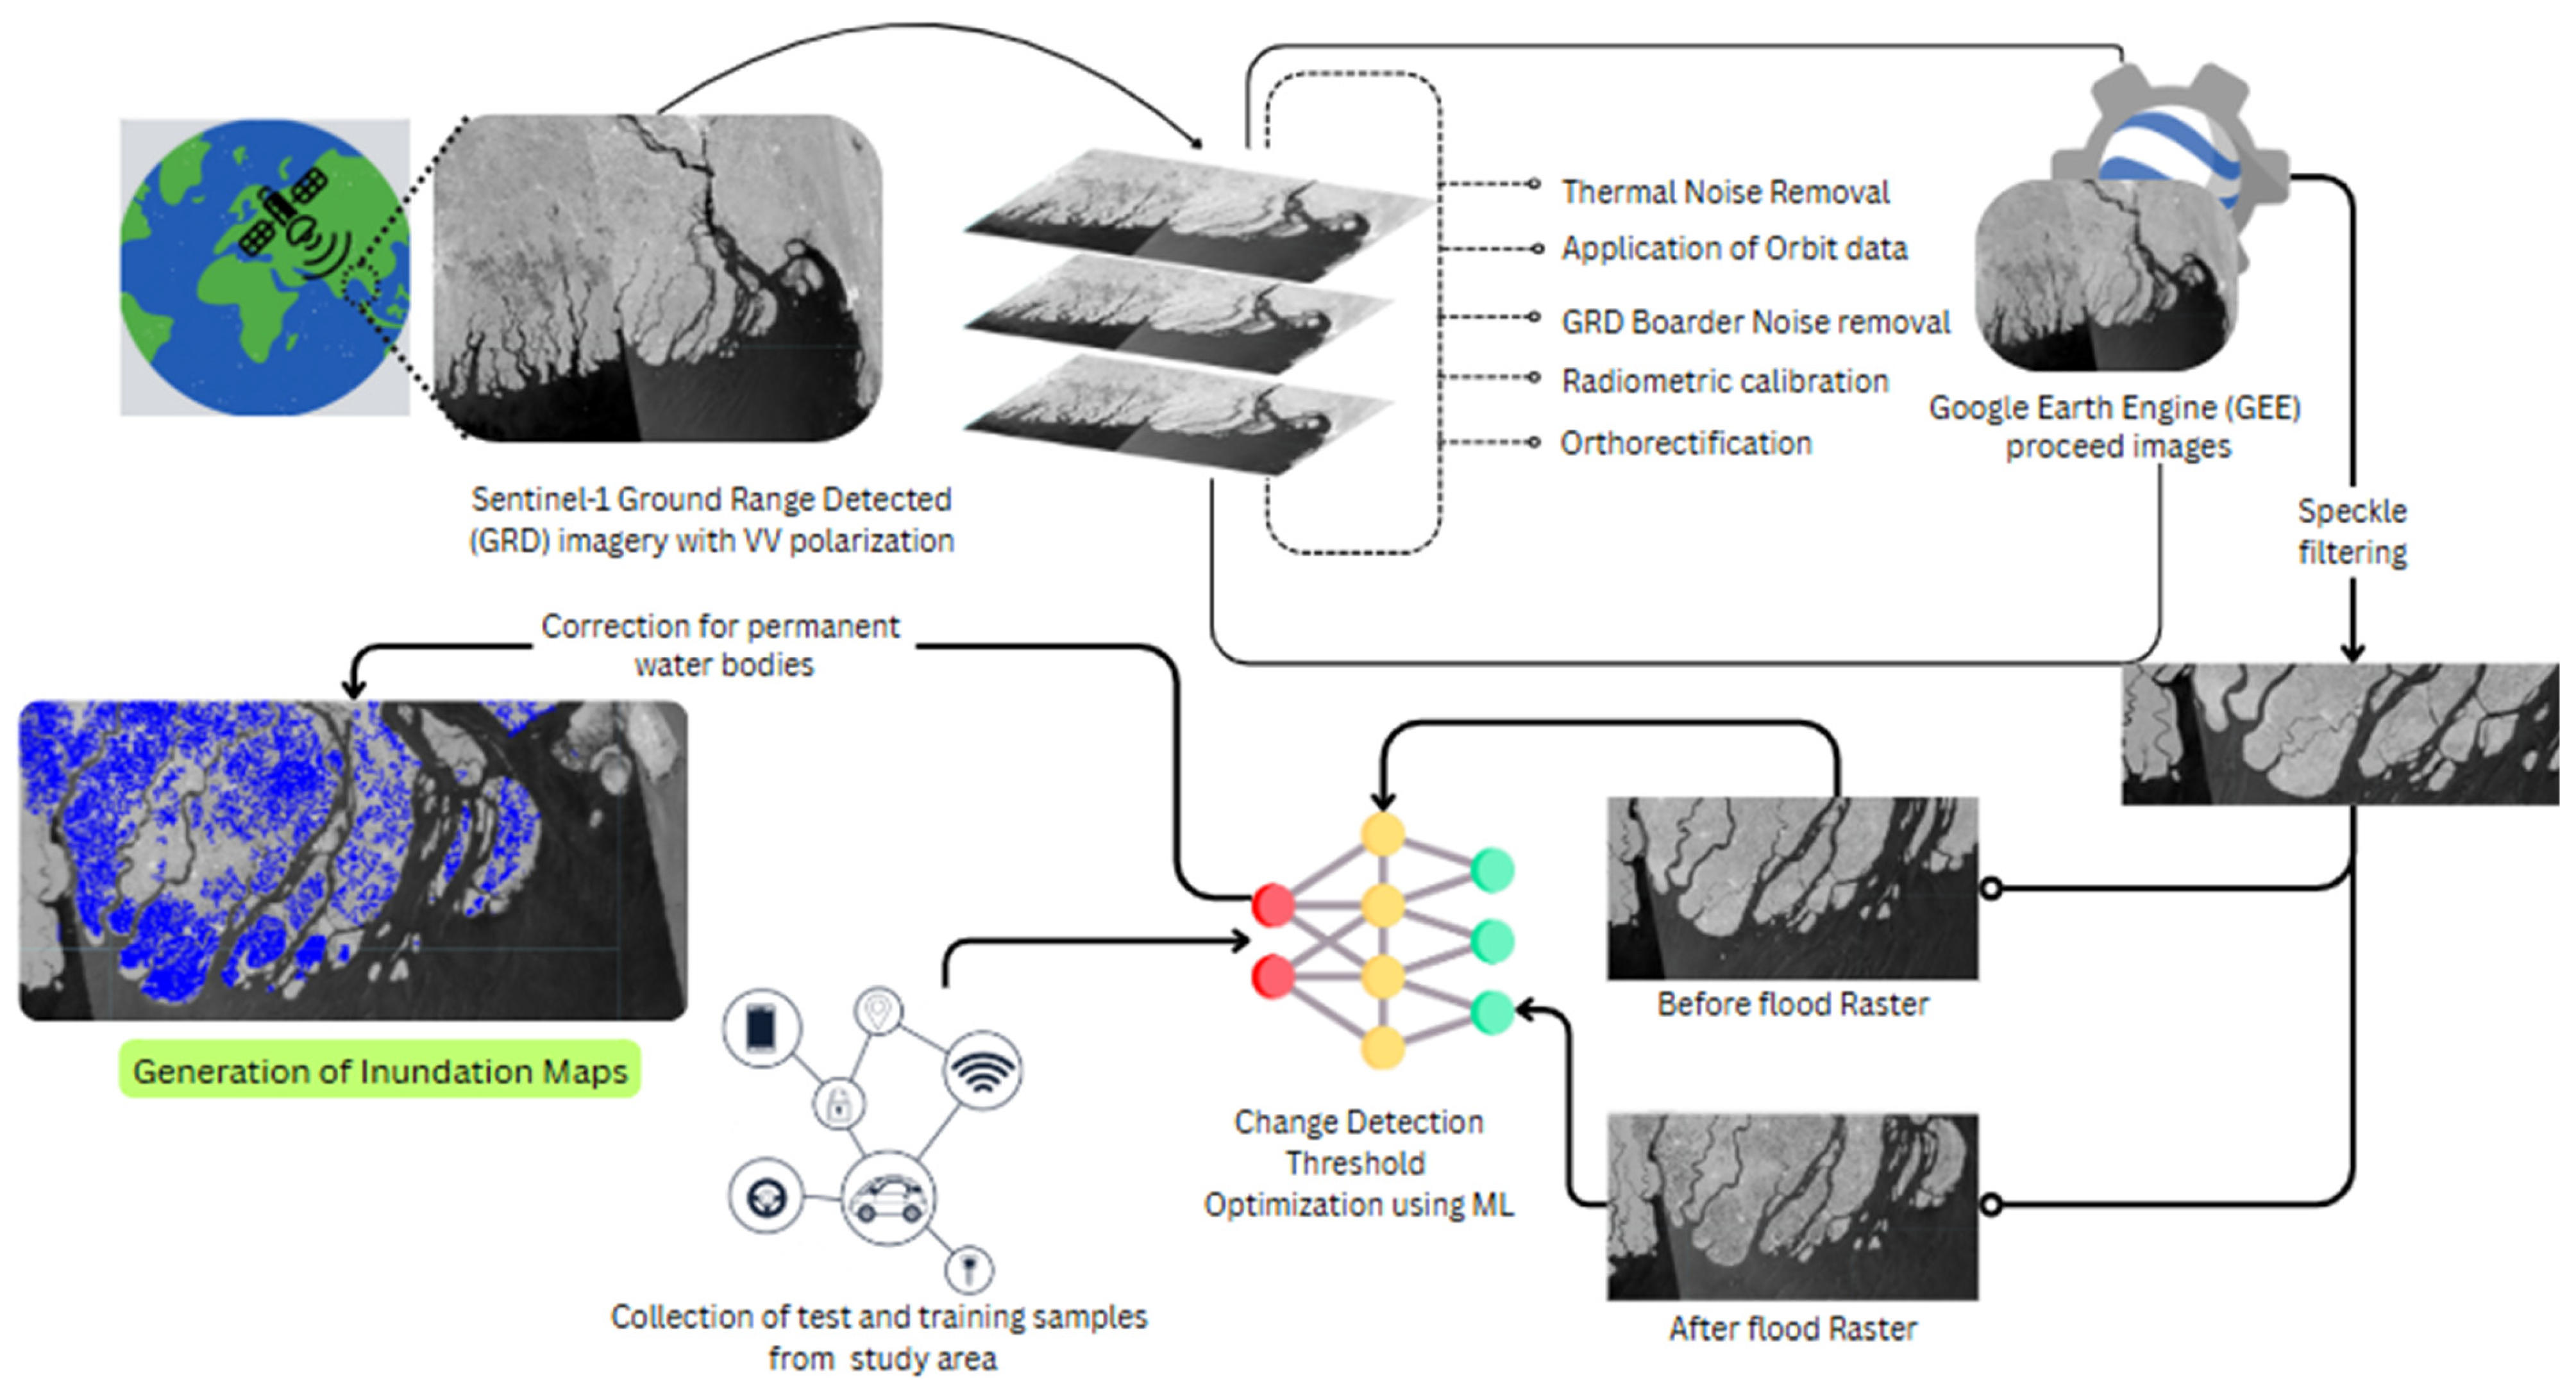
3.2.1. Analysis of SAR Images
3.2.2. Estimation of Change Detection Threshold,
Data Preparation and Splitting
Class Imbalance Analysis and Bias Mitigation
Model Configuration and Hyperparameter Tuning
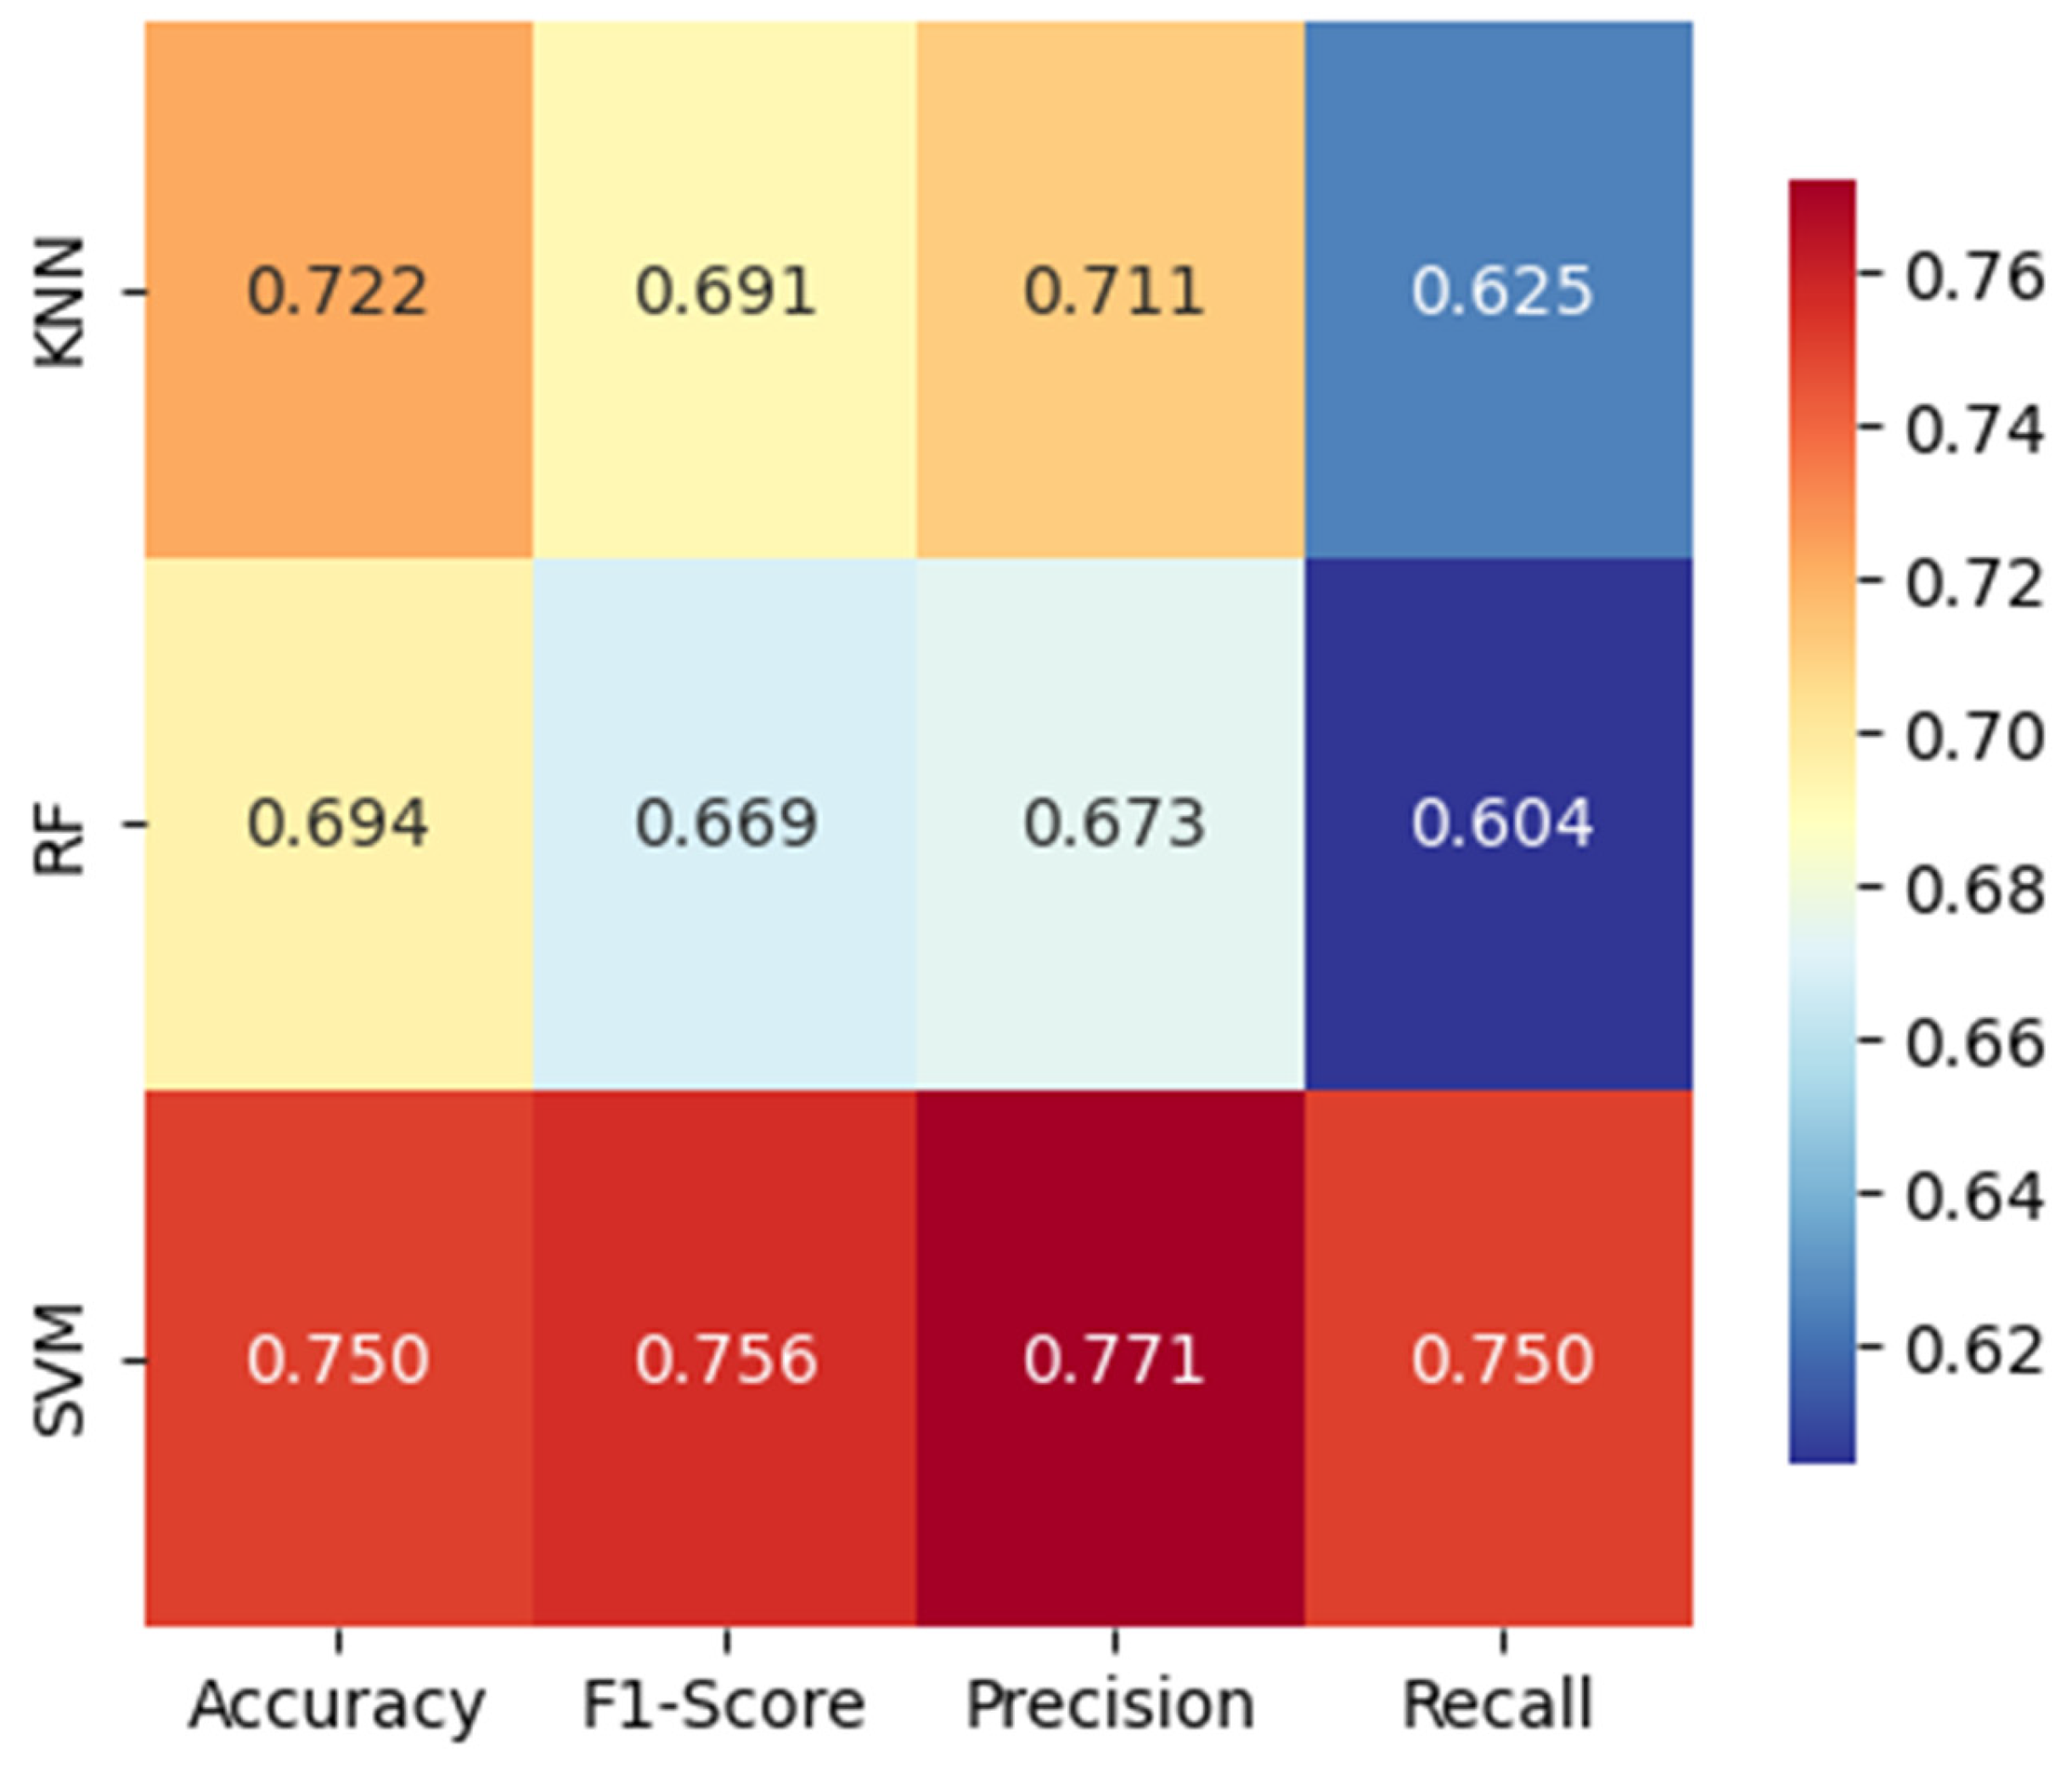
Feature Importance in Machine Learning Models
- o
- is the reduction in impurity (e.g., Gini) at split for tree
- o
- represents the set of splits in which the feature was used
- o
- is the number of trees in the random forest
- o
- is the total impurity at the root node
- o
- is the weight vector (coefficients for each feature)
- o
- is the bias term,
- o
- is the input feature vector
- o
- is the class label
Model Evaluation
- o
- is the number of false positives
- o
- is the number of true negatives
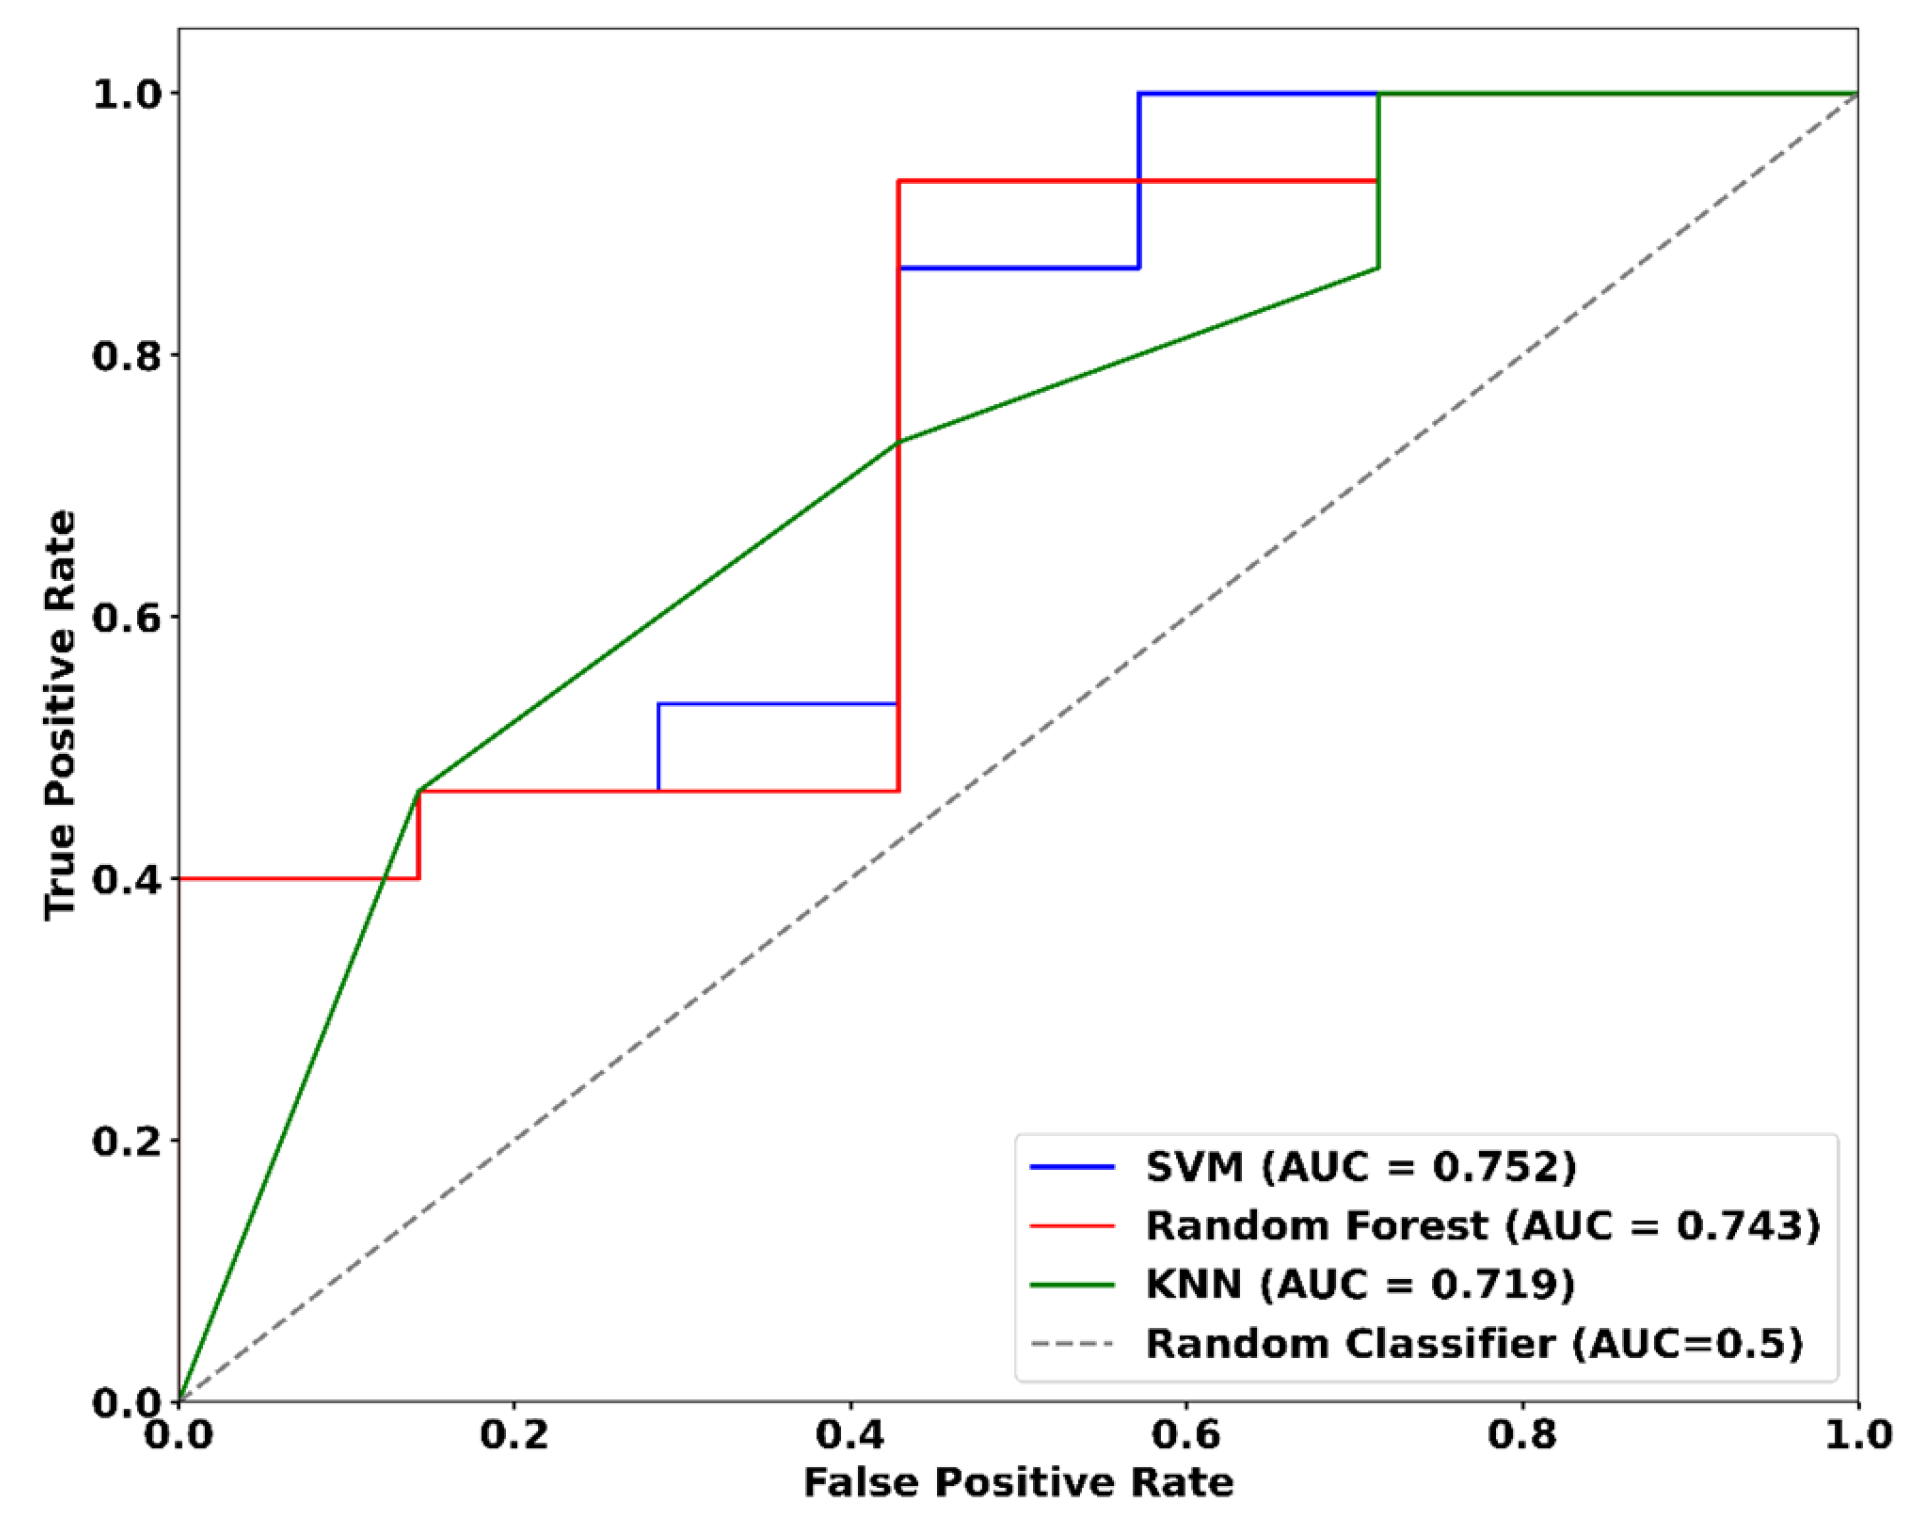
Statistical Significance Evaluation
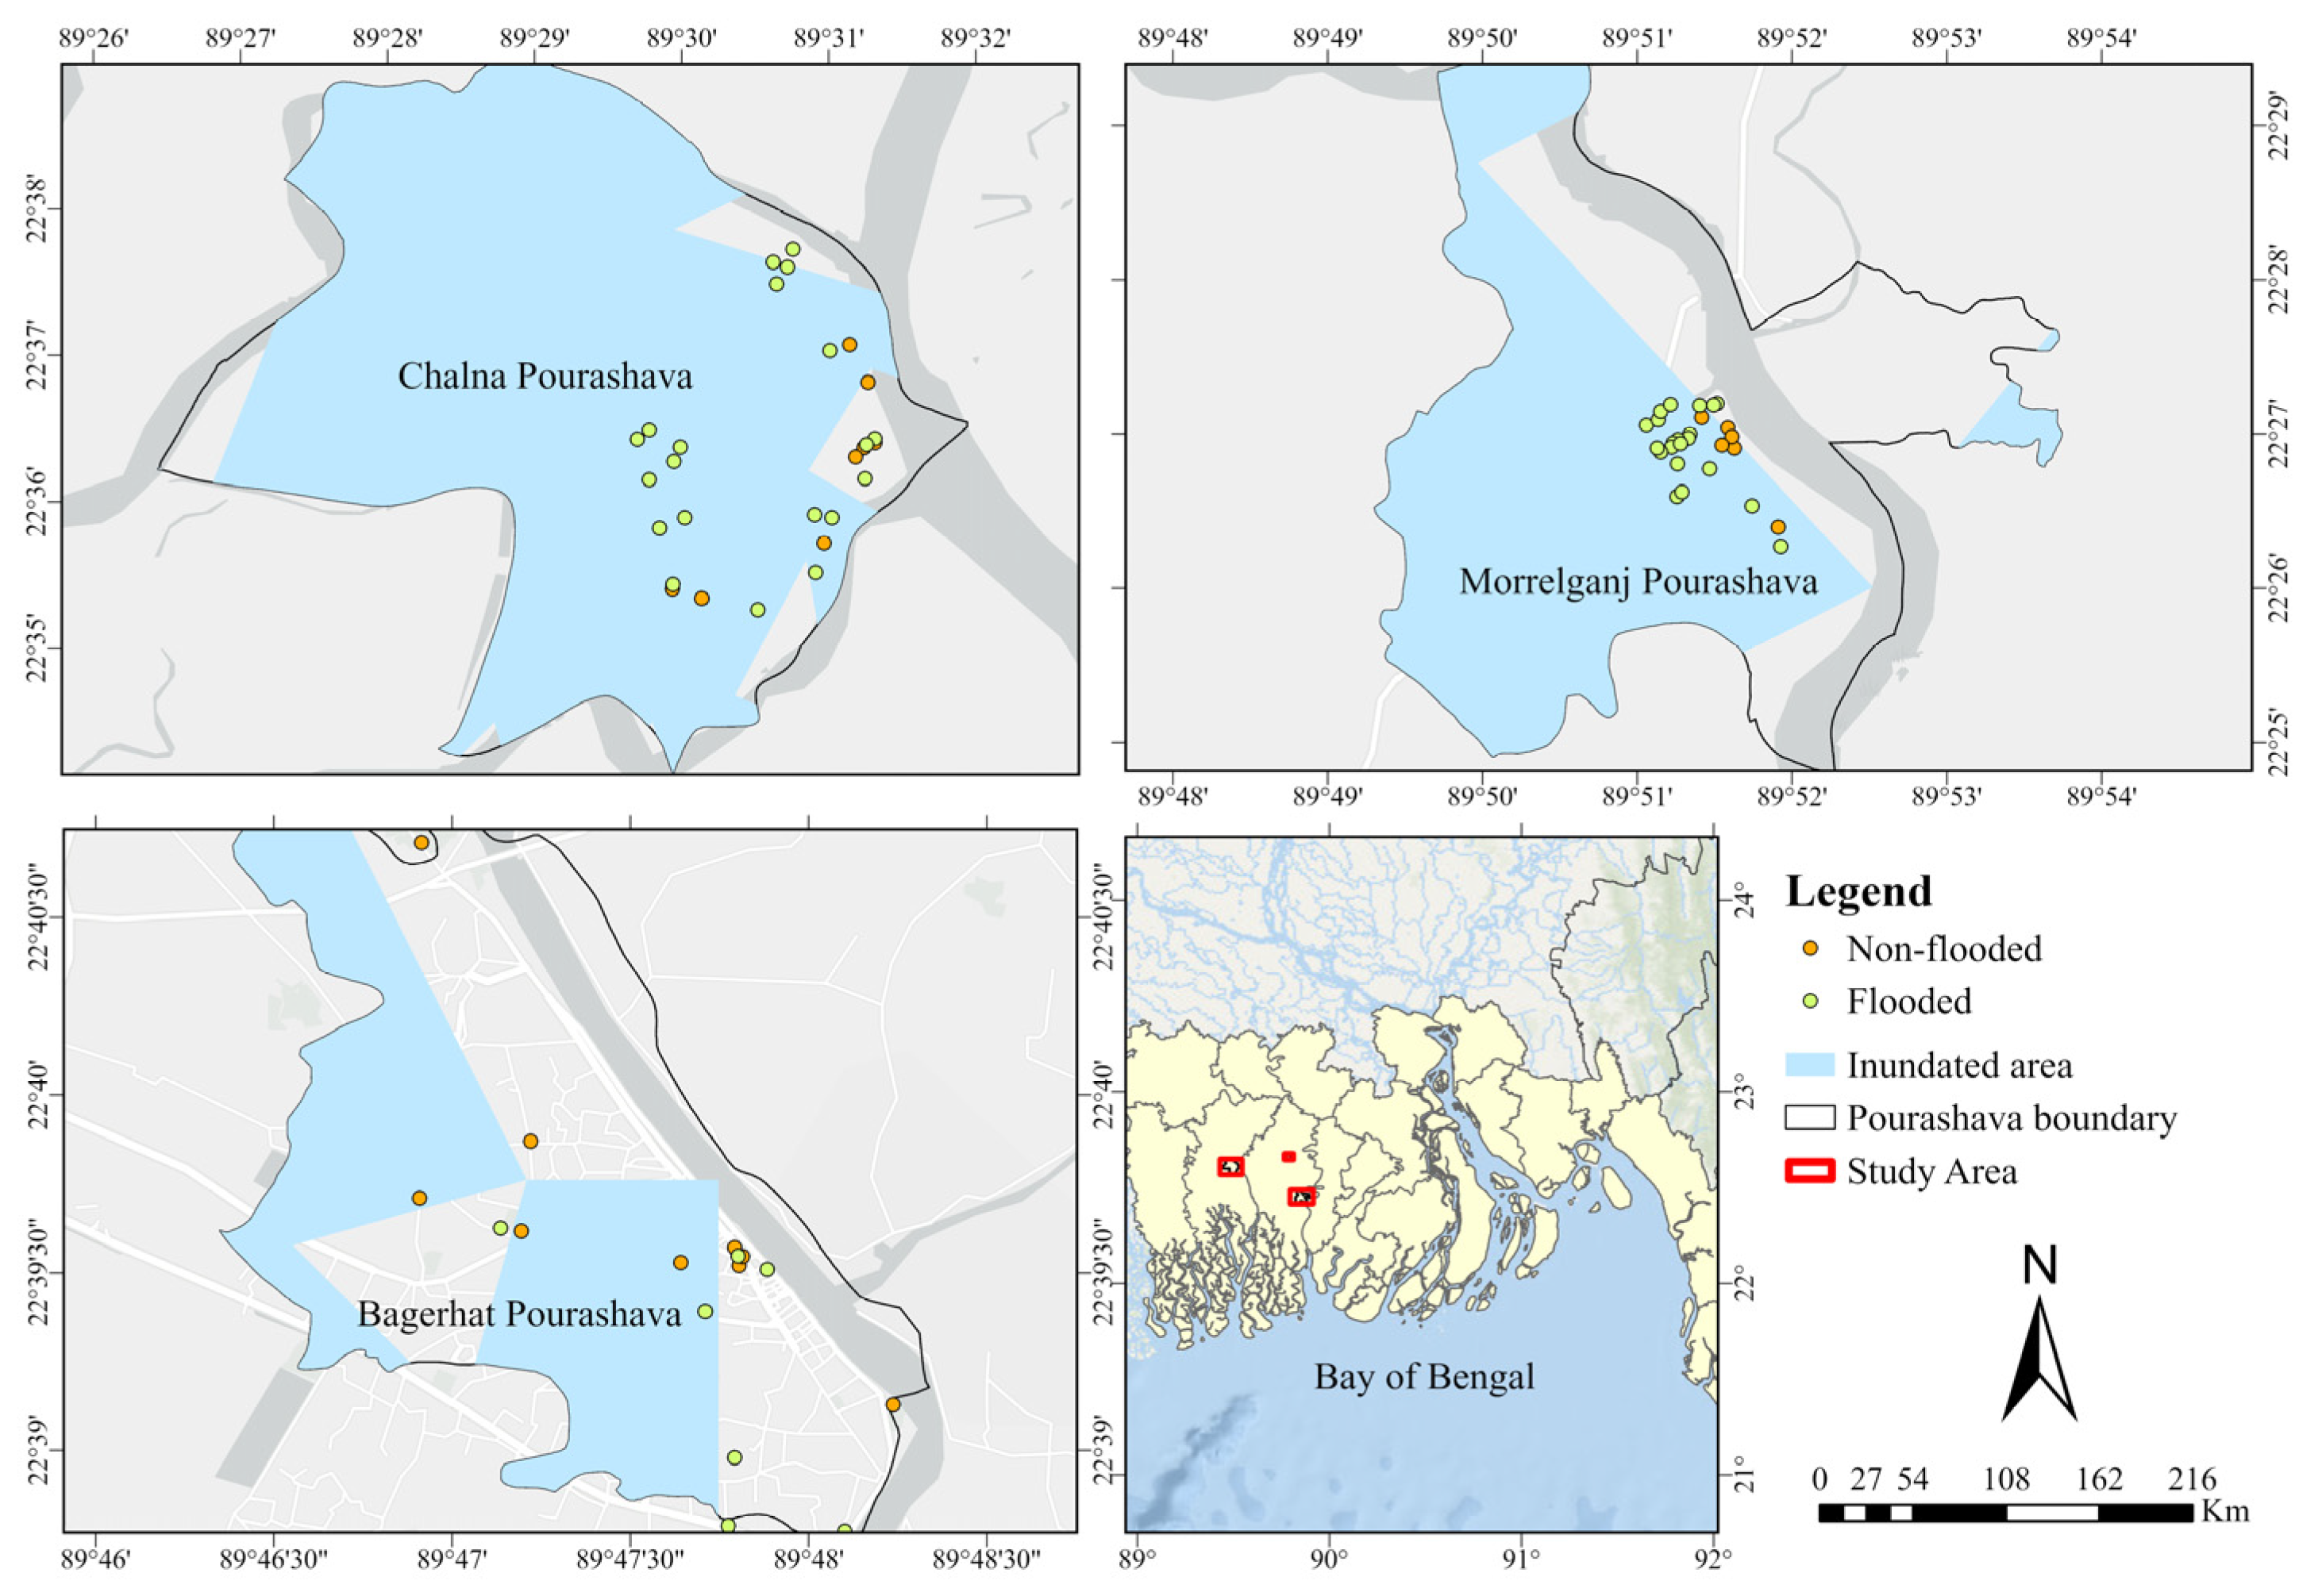
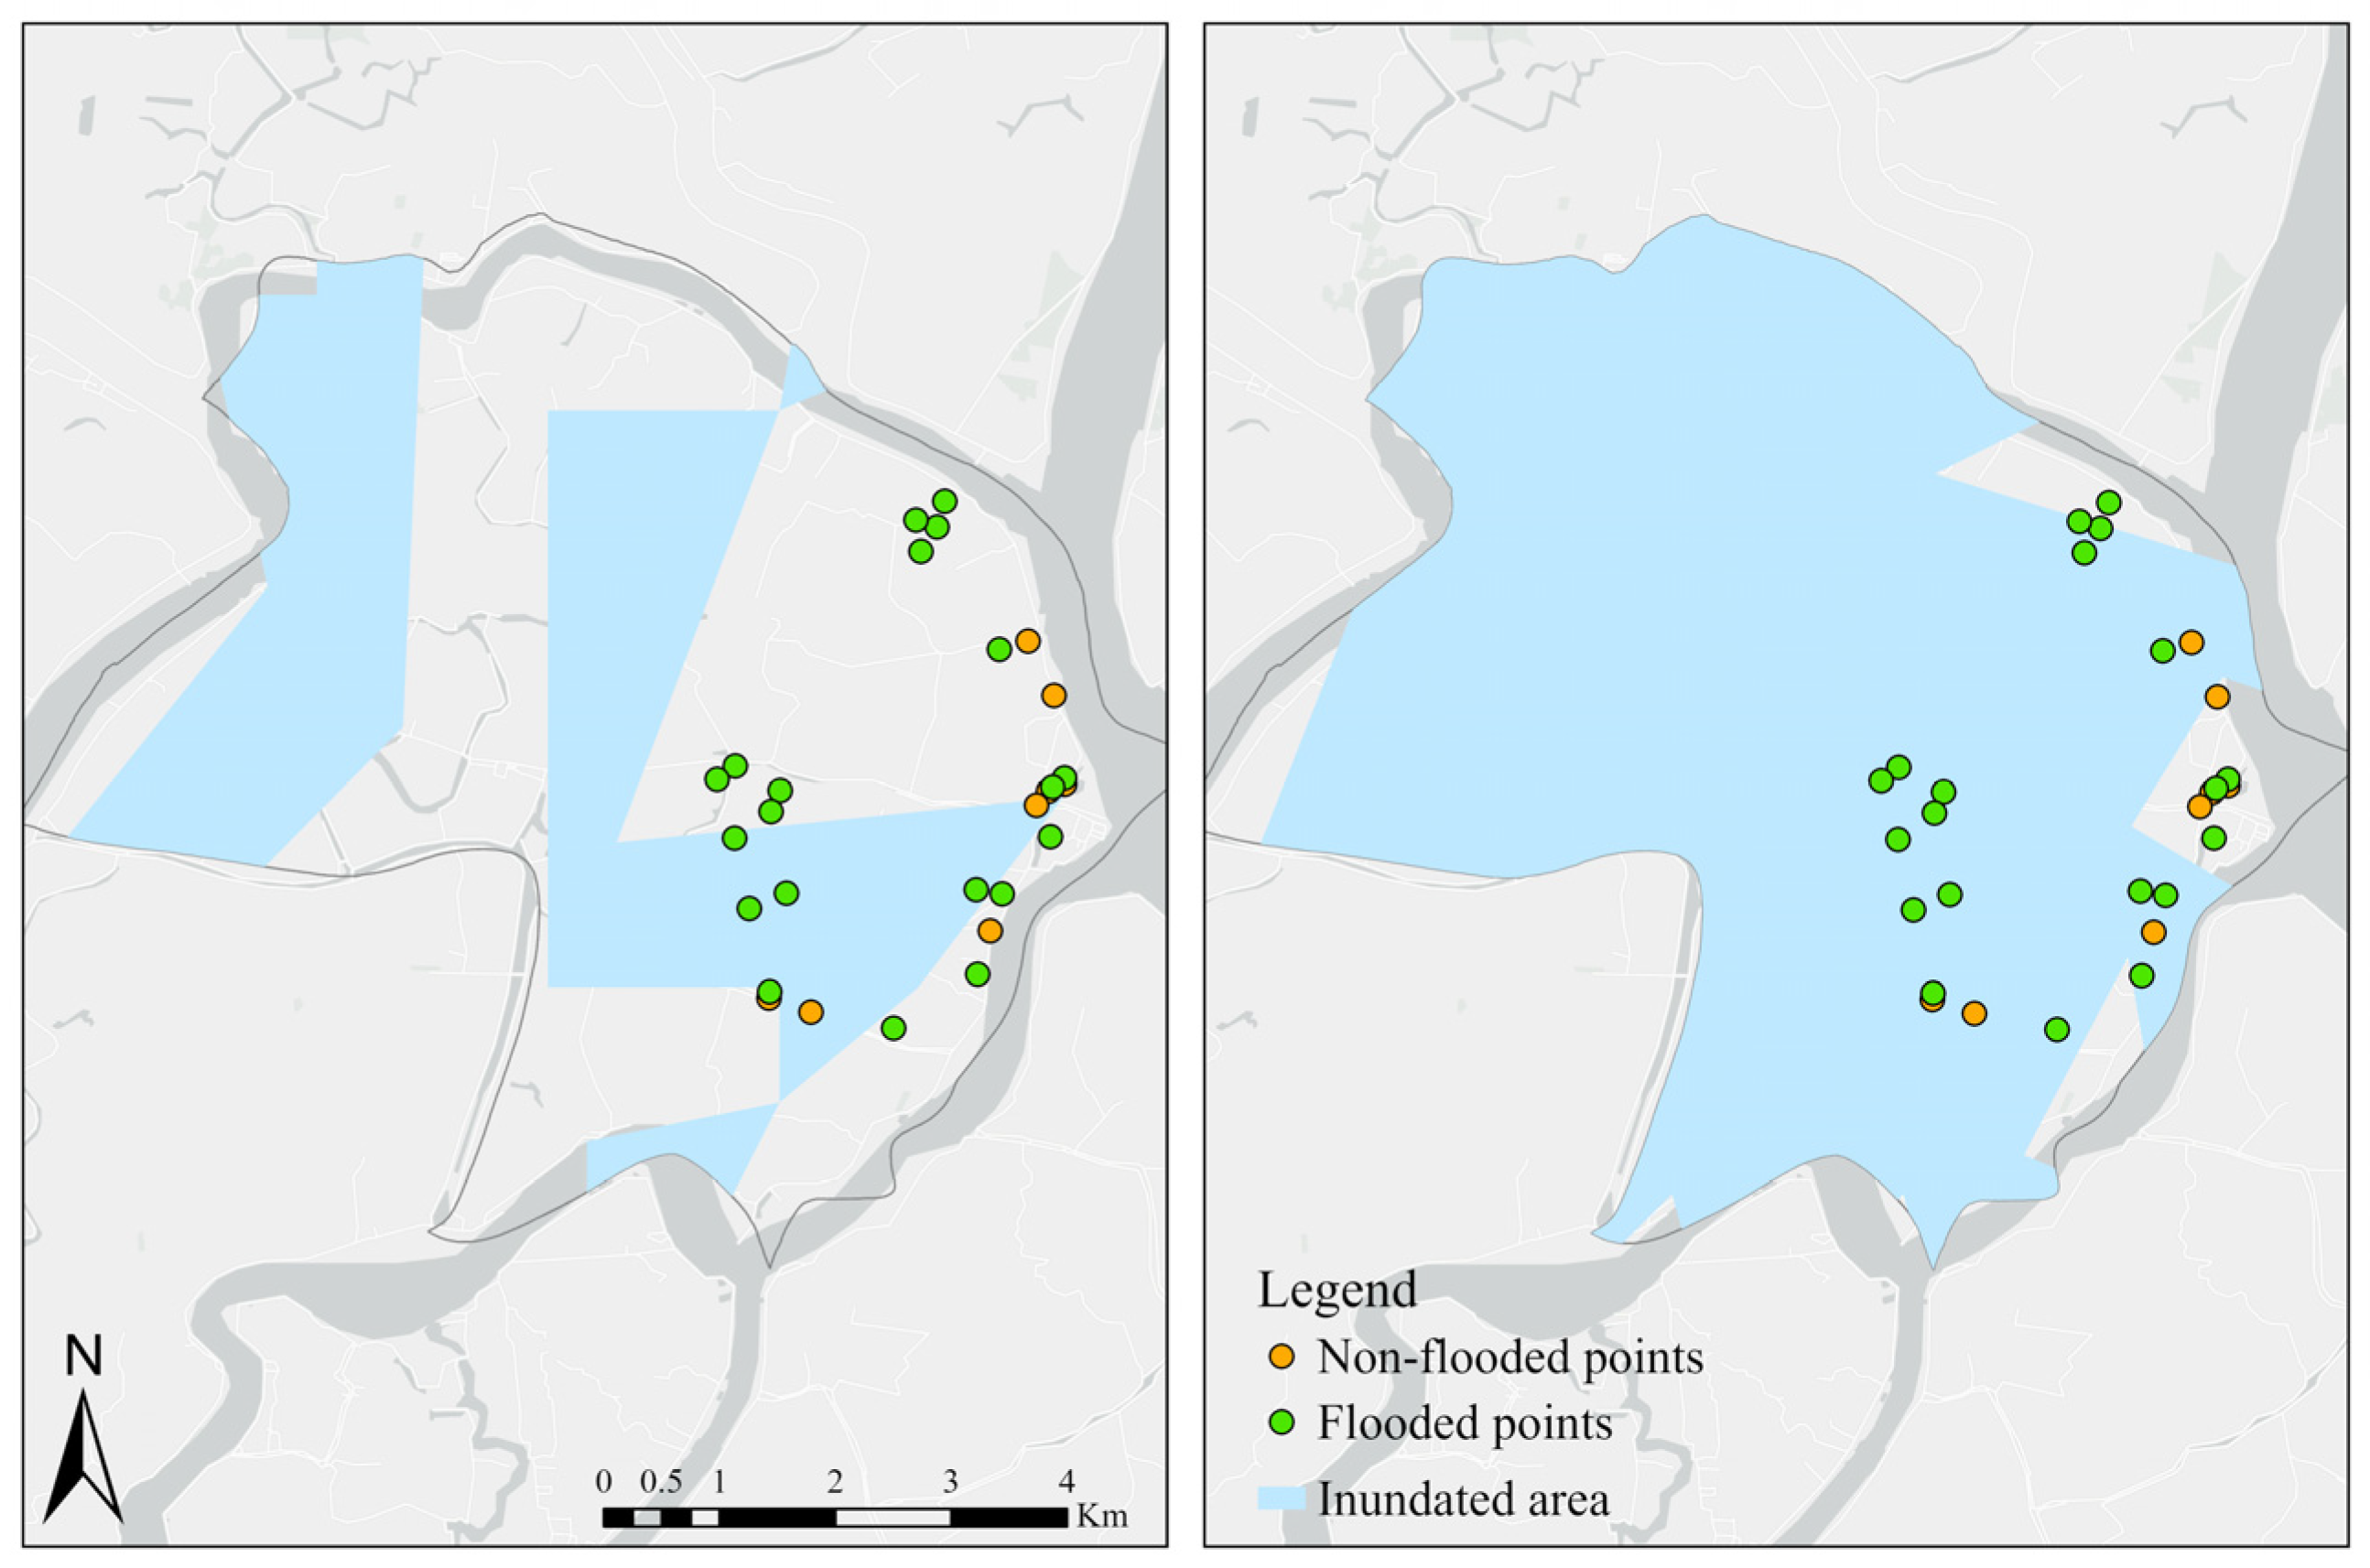
3.2.3. Identification of Flood-Affected Zones
4. Results
4.1. Optimization of Change Detection Threshold,
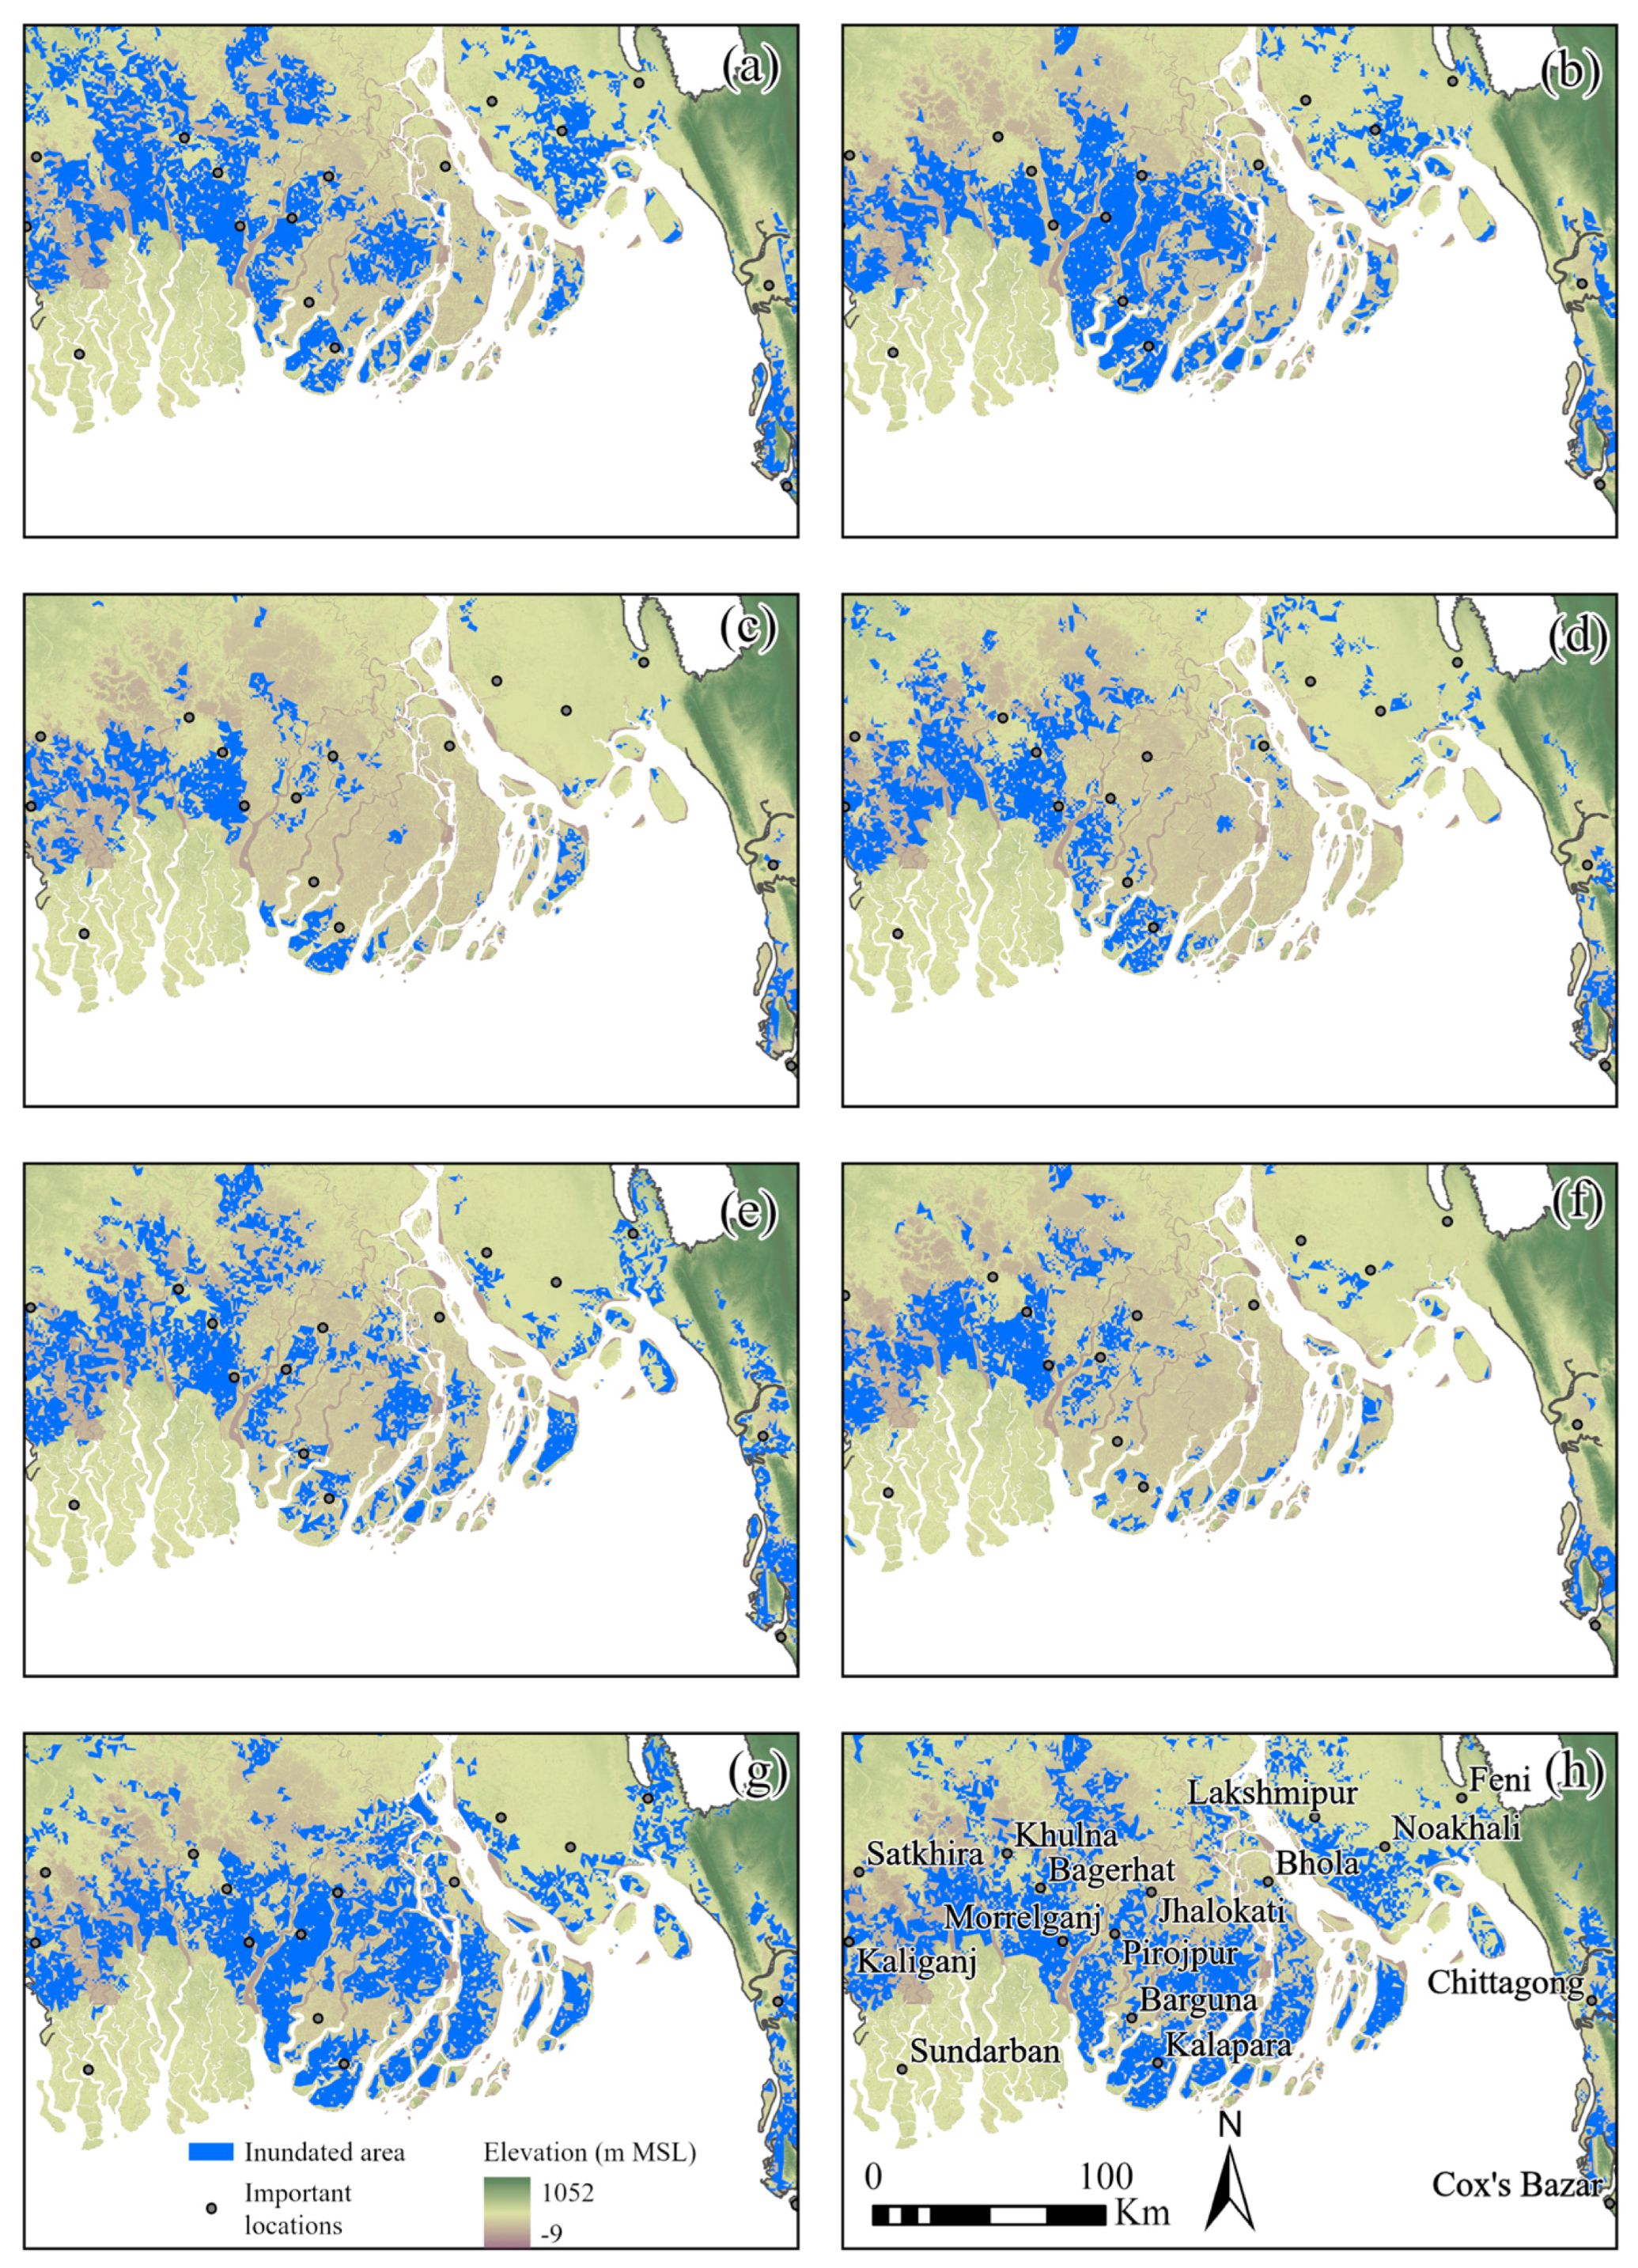
4.2. Assessment of Inundation
4.2.1. Inundation Due to Peak Rainfall
4.2.2. Inundation Due to Cyclone
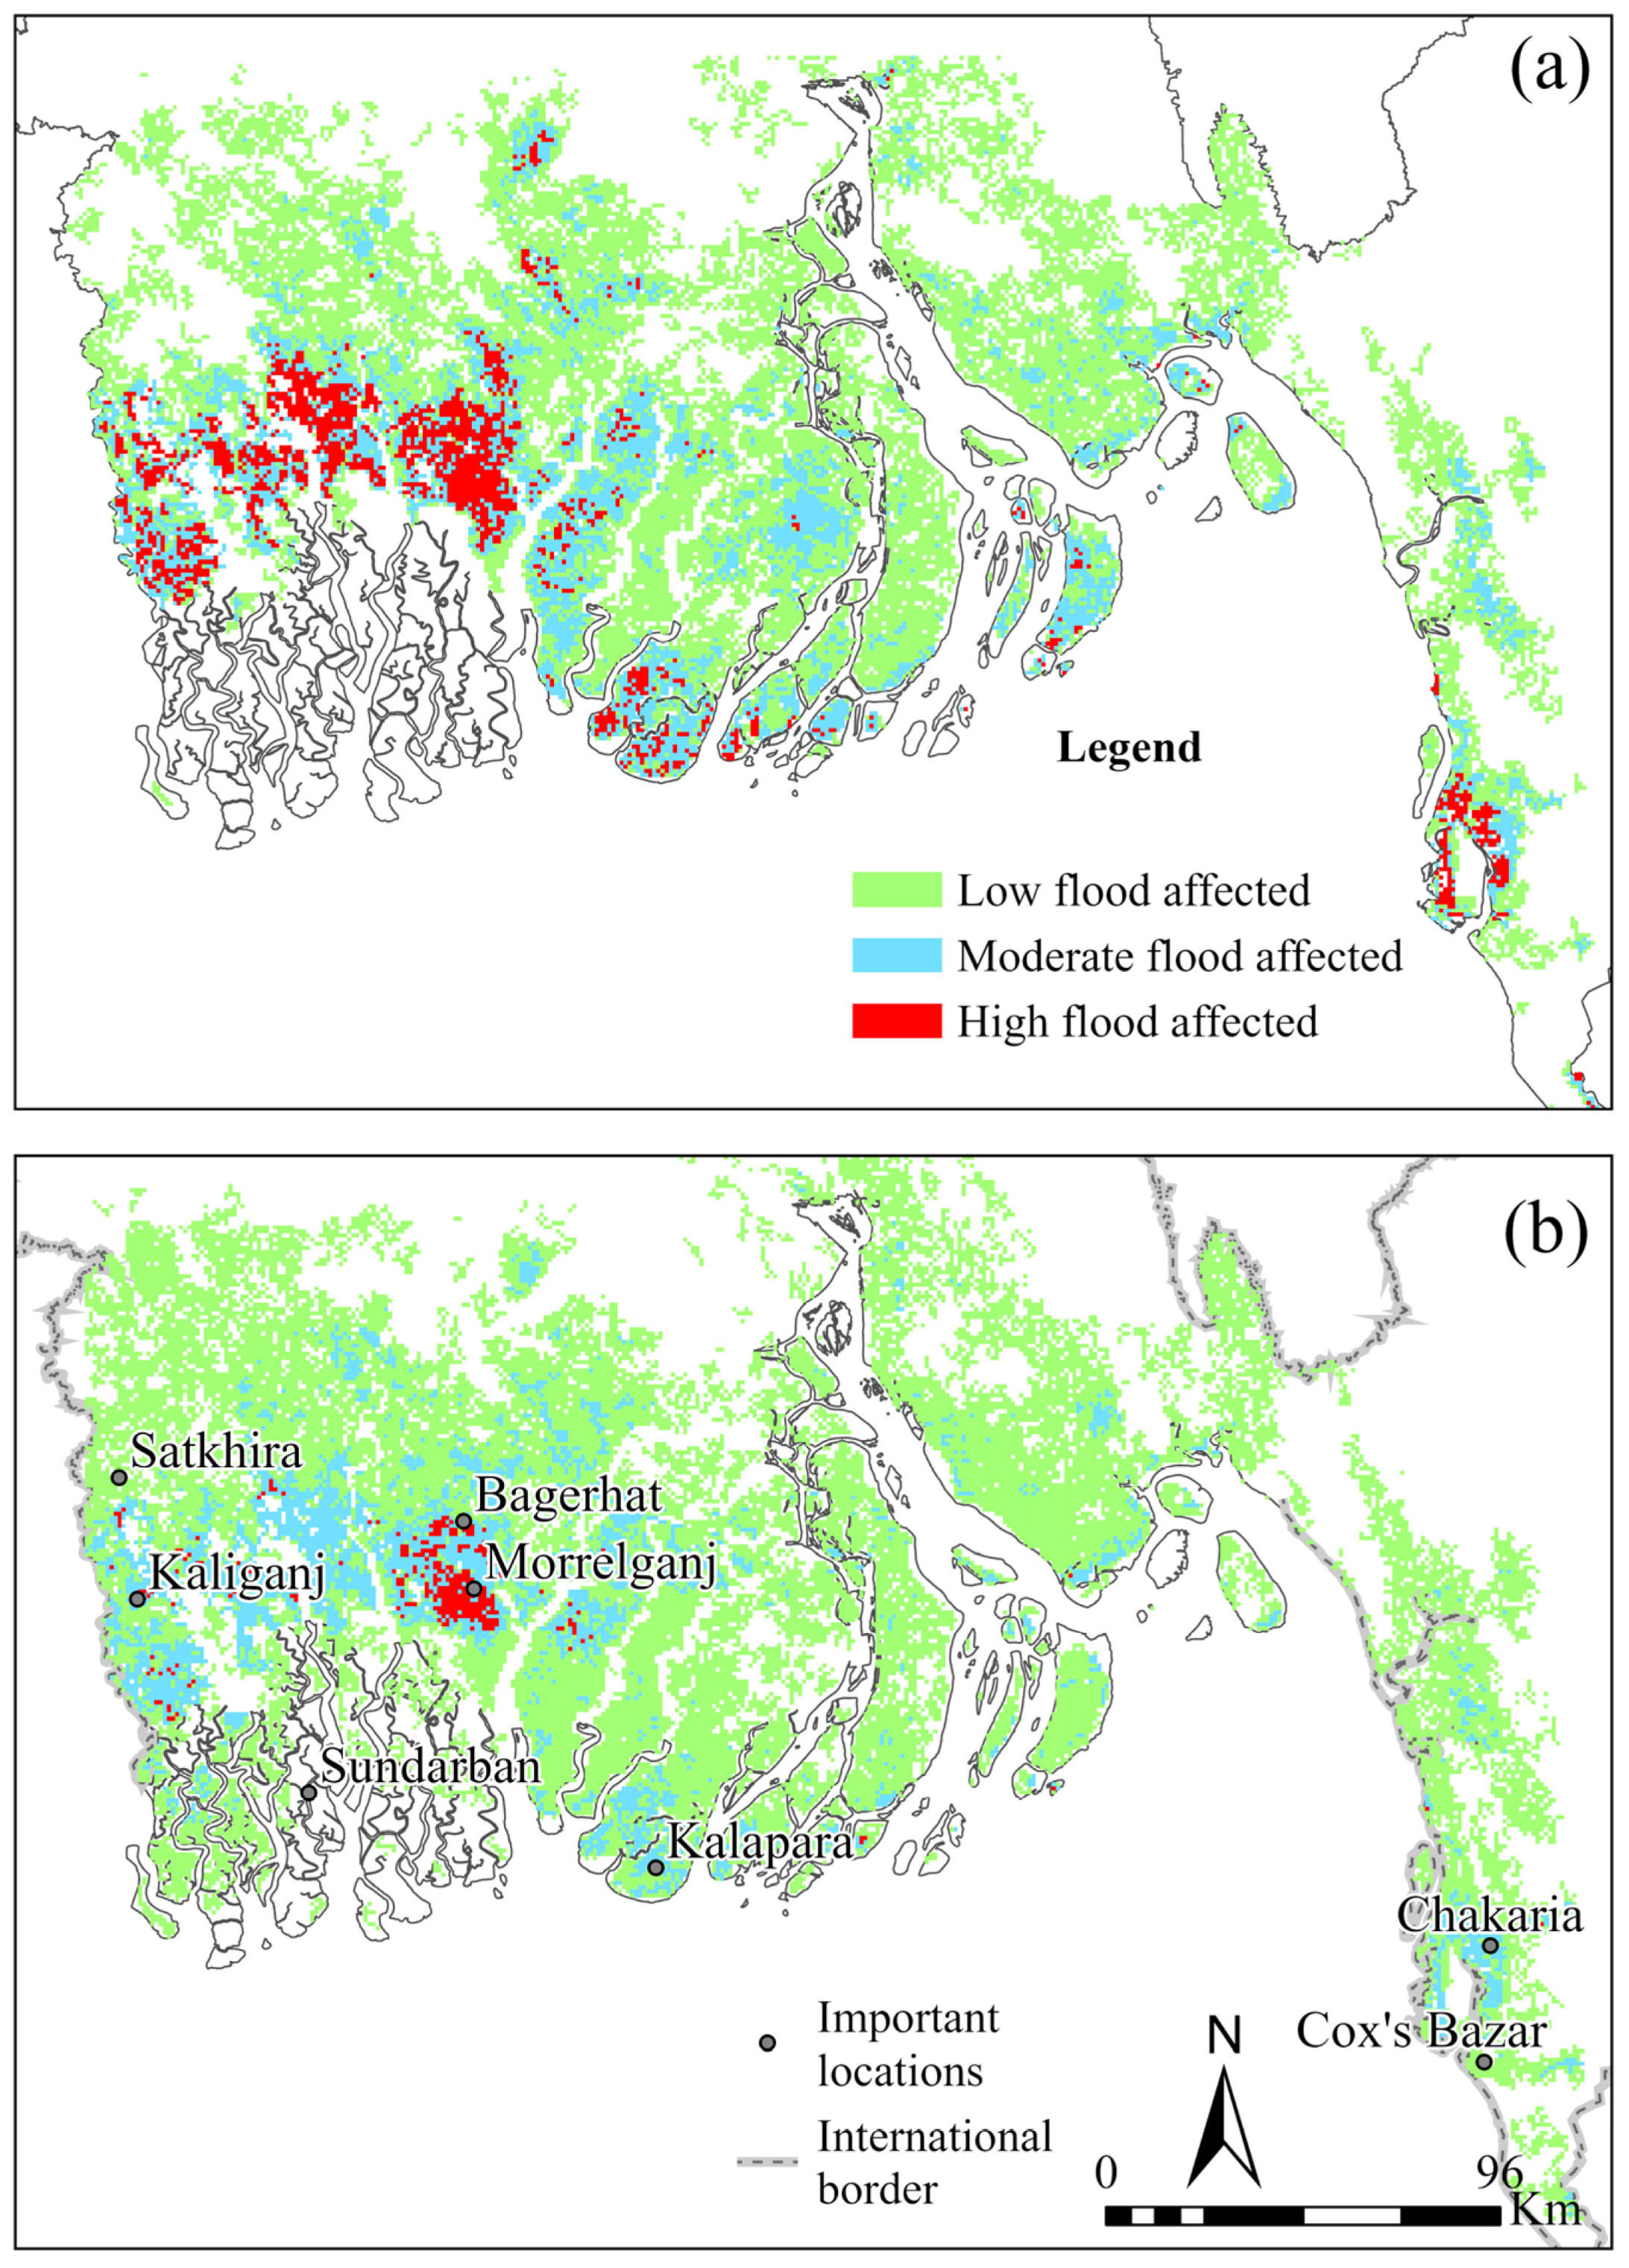
4.3. Assessment of Flood-Affected Zones
5. Discussion
6. Conclusions
Author Contributions
Funding
Data Availability Statement
Acknowledgments
Conflicts of Interest
References
- Rudra, K. Flood in the GBM Delta. In Rivers of the Ganga-Brahmaputra-Meghna Delta; Springer: Cham, Switzerland, 2018; pp. 125–136. [Google Scholar] [CrossRef]
- Singha, M.; Dong, J.; Sarmah, S.; You, N.; Zhou, Y.; Zhang, G.; Doughty, R.; Xiao, X. Identifying Floods and Flood-Affected Paddy Rice Fields in Bangladesh Based on Sentinel-1 Imagery and Google Earth Engine. ISPRS J. Photogramm. Remote Sens. 2020, 166, 278–293. [Google Scholar] [CrossRef]
- Chakma, P.; Akter, A. Flood Mapping in the Coastal Region of Bangladesh Using Sentinel-1 SAR Images: A Case Study of Super Cyclone Amphan. J. Civ. Eng. Forum 2021, 7, 267. [Google Scholar] [CrossRef]
- Haque, A.; Nicholls, R.J. Floods and the Ganges-Brahmaputra-Meghna Delta. In Ecosystem Services for Well-Being in Deltas: Integrated Assessment for Policy Analysis; Nicholls, R.J., Hutton, C.W., Adger, W.N., Hanson, S.E., Rahman, M.M., Salehin, M., Eds.; Springer International Publishing: Cham, Switzerland, 2018; pp. 147–159. ISBN 978-3-319-71093-8. [Google Scholar]
- Islam, A.S.; Haque, A.; Bala, S.K. Hydrologic Characteristics of Floods in Ganges-Brahmaputra-Meghna (GBM) Delta. Nat. Hazards 2010, 54, 797–811. [Google Scholar] [CrossRef]
- Woodruff, J.D.; Irish, J.L.; Camargo, S.J. Coastal Flooding by Tropical Cyclones and Sea-Level Rise. Nature 2013, 504, 44–52. [Google Scholar] [CrossRef]
- Yilmaz, K.K.; Adler, R.F.; Tian, Y.; Hong, Y.; Pierce, H.F. Evaluation of a Satellite-Based Global Flood Monitoring System. Int. J. Remote Sens. 2010, 31, 3763–3782. [Google Scholar] [CrossRef]
- Chowdhury, E.H.; Hassan, Q.K. Use of Remote Sensing Data in Comprehending an Extremely Unusual Flooding Event over Southwest Bangladesh. Nat. Hazards 2017, 88, 1805–1823. [Google Scholar] [CrossRef]
- Sunkpho, J.; Ootamakorn, C. Real-Time Flood Monitoring and Warning System. Songklanakarin J. Sci. Technol. 2011, 33, 227–235. [Google Scholar]
- Dewan, A.; Kankam-Yeboah, K.; Nishigaki, M. Using Synthetic Aperture Radar (SAR) Data for Mapping River Water Flooding in an Urban Landscape: A Case Study of Greater Dhaka, Bangladesh. J. Japan Soc. Hydrol. Water Resour. 2006, 19, 44–54. [Google Scholar] [CrossRef]
- Voigt, S.; Giulio Tonolo, F.; Lyons, J.; Kucera, J.; Jones, B.; Schneiderhan, T.; Platzeck, G.; Kaku, K.; Hazarika, M.; Czaran, L.; et al. Global Trends in Satellite-Based Emergency Mapping. Science 2016, 353, 247–252. [Google Scholar] [CrossRef]
- Liang, J.; Liu, D. A Local Thresholding Approach to Flood Water Delineation Using Sentinel-1 SAR Imagery. ISPRS J. Photogramm. Remote Sens. 2020, 159, 53–62. [Google Scholar] [CrossRef]
- Wilson, B.; Rashid, H. Monitoring the 1997 Flood in the Red River Valley Using Hydrologic Regimes and RADARSAT Imagery. Can. Geogr./Le Géographe Can. 2005, 49, 100–109. [Google Scholar] [CrossRef]
- Greifeneder, F.; Wagner, W.; Sabel, D.; Naeimi, V. Suitability of SAR Imagery for Automatic Flood Mapping in the Lower Mekong Basin. Int. J. Remote Sens. 2014, 35, 2857–2874. [Google Scholar] [CrossRef]
- Tripathi, G.; Pandey, A.C.; Parida, B.R.; Kumar, A. Flood Inundation Mapping and Impact Assessment Using Multi-Temporal Optical and SAR Satellite Data: A Case Study of 2017 Flood in Darbhanga District, Bihar, India. Water Resour. Manag. 2020, 34, 1871–1892. [Google Scholar] [CrossRef]
- Dasari, K.; Anjaneyulu, L.; Jayasri, P.V.; Prasad, A.V.V. Importance of Speckle Filtering in Image Classification of SAR Data. In Proceedings of the 2015 International Conference on Microwave, Optical and Communication Engineering (ICMOCE), Bhubaneswar, India, 18–20 December 2015; pp. 349–352. [Google Scholar] [CrossRef]
- Shen, X.; Wang, D.; Mao, K.; Anagnostou, E.; Hong, Y. Inundation Extent Mapping by Synthetic Aperture Radar: A Review. Remote Sens. 2019, 11, 879. [Google Scholar] [CrossRef]
- Farhadi, H.; Esmaeily, A.; Najafzadeh, M. Flood Monitoring by Integration of Remote Sensing Technique and Multi-Criteria Decision Making Method. Comput. Geosci. 2022, 160, 105045. [Google Scholar] [CrossRef]
- Esfandiari, M.; Jabari, S.; McGrath, H.; Coleman, D. Flood Mapping Using Random Forest and Identifying the Essential Conditioning Factors; A Case Study in Fredericton, New Brunswick, Canada. ISPRS Ann. Photogramm. Remote Sens. Spat. Inf. Sci. 2020, V-3–2020, 609–615. [Google Scholar] [CrossRef]
- Malinowski, R.; Groom, G.; Schwanghart, W.; Heckrath, G. Detection and Delineation of Localized Flooding from WorldView-2 Multispectral Data. Remote Sens. 2015, 7, 14853–14875. [Google Scholar] [CrossRef]
- Xie, M.; Jiang, Z.; Sainju, A.M. Geographical Hidden Markov Tree for Flood Extent Mapping. In Proceedings of the 24th ACM SIGKDD International Conference on Knowledge Discovery & Data Mining, London, UK, 19–23 August 2018; Association for Computing Machinery: New York, NY, USA, 2018; pp. 2545–2554. [Google Scholar]
- Lim, J.; Lee, K. Flood Mapping Using Multi-Source Remotely Sensed Data and Logistic Regression in the Heterogeneous Mountainous Regions in North Korea. Remote Sens. 2018, 10, 1036. [Google Scholar] [CrossRef]
- Lin, K.; Chen, H.; Xu, C.-Y.; Yan, P.; Lan, T.; Liu, Z.; Dong, C. Assessment of Flash Flood Risk Based on Improved Analytic Hierarchy Process Method and Integrated Maximum Likelihood Clustering Algorithm. J. Hydrol. 2020, 584, 124696. [Google Scholar] [CrossRef]
- Rana, V.K.; Suryanarayana, T.M.V. Evaluation of SAR Speckle Filter Technique for Inundation Mapping. Remote Sens. Appl. Soc. Environ. 2019, 16, 100271. [Google Scholar] [CrossRef]
- Tanim, A.H.; McRae, C.B.; Tavakol-davani, H.; Goharian, E. Flood Detection in Urban Areas Using Satellite Imagery and Machine Learning. Water 2022, 14, 1140. [Google Scholar] [CrossRef]
- Novianti, L.; Ermatita; Abdiansah; Handyani, A.S.; Rahmadani, N.; Husni, N.L. Machine Learning Application of Flood Detecting and Mapping in Urban Area with Geographic Information Data. In Proceedings of the 8th International Conference on Global Innovations (FIRST-ESCSI 2024), Palembang, Indonensia, 21–22 October 2024; Atlantis Press: Dordrecht, The Netherlands, 2025; pp. 374–384. [Google Scholar]
- Zhang, X.; Chan, N.W.; Pan, B.; Ge, X.; Yang, H. Mapping Flood by the Object-Based Method Using Backscattering Coefficient and Interference Coherence of Sentinel-1 Time Series. Sci. Total Environ. 2021, 794, 148388. [Google Scholar] [CrossRef] [PubMed]
- Soria-Ruiz, J.; Fernandez-Ordoñez, Y.M.; Ambrosio-Ambrosio, J.P.; Escalona-Maurice, M.J.; Medina-García, G.; Sotelo-Ruiz, E.D.; Ramirez-Guzman, M.E. Flooded Extent and Depth Analysis Using Optical and SAR Remote Sensing with Machine Learning Algorithms. Atmosphere 2022, 13, 1852. [Google Scholar] [CrossRef]
- Halder, K.; Ghosh, A.; Srivastava, A.K.; Pal, S.C.; Chatterjee, U.; Bisai, D.; Ewert, F.; Gaiser, T.; Islam, A.R.M.T.; Alam, E.; et al. SAR-Driven Flood Inventory and Multi-Factor Ensemble Susceptibility Modelling Using Machine Learning Frameworks. Geomat. Nat. Hazards Risk 2024, 15, 2409202. [Google Scholar] [CrossRef]
- Aristizabal, F.; Judge, J.; Monsivais-Huertero, A. High-Resolution Inundation Mapping for Heterogeneous Land Covers with Synthetic Aperture Radar and Terrain Data. Remote Sens. 2020, 12, 900. [Google Scholar] [CrossRef]
- Liu, B.; Li, X.; Zheng, G. Automatic Mapping of Tropical Cyclone-Induced Coastal Inundation in SAR Imagery Based on Clustering of Deep Features. In Proceedings of the IGARSS 2020—2020 IEEE International Geoscience and Remote Sensing Symposium, Waikoloa, HI, USA, 26 September–2 October 2020; pp. 5765–5768. [Google Scholar]
- Rahman, M.; Ningsheng, C.; Islam, M.M.; Dewan, A.; Iqbal, J.; Washakh, R.M.A.; Shufeng, T. Flood Susceptibility Assessment in Bangladesh Using Machine Learning and Multi-Criteria Decision Analysis. Earth Syst. Environ. 2019, 3, 585–601. [Google Scholar] [CrossRef]
- Rana, S.M.; Kamruzzaman, M.; Rajib, M.A.; Rahman, M.M. Changes in Cyclone Pattern with Climate Change Perspective in the Coastal Regions of Bangladesh. Environ. Res. Eng. Manag. 2011, 56, 20–27. [Google Scholar] [CrossRef]
- Chan, F.K.S.; Paszkowski, A.; Wang, Z.; Lu, X.; Mitchell, G.; Tran, D.D.; Warner, J.; Li, J.; Chen, Y.D.; Li, N.; et al. Building Resilience in Asian Mega-Deltas. Nat. Rev. Earth Environ. 2024, 5, 522–537. [Google Scholar] [CrossRef]
- Alam, E.; Dominey-Howes, D. A New Catalogue of Tropical Cyclones of the Northern Bay of Bengal and the Distribution and Effects of Selected Landfalling Events in Bangladesh. Int. J. Climatol. 2015, 35, 801–835. [Google Scholar] [CrossRef]
- Alam, M.M.; Hossain, M.A.; Shafee, S. Frequency of Bay of Bengal Cyclonic Storms and Depressions Crossing Different Coastal Zones. Int. J. Climatol. 2003, 23, 1119–1125. [Google Scholar] [CrossRef]
- Dastagir, M.R. Modeling Recent Climate Change Induced Extreme Events in Bangladesh: A Review. Weather Clim. Extrem. 2015, 7, 49–60. [Google Scholar] [CrossRef]
- MoEF Bangladesh Cimate Change Strategy and Action Plan 2009; Government of the People’s Republic of Bangladesh: Dhaka, Bangladesh, 2009; pp. 80–85.
- Nasher, N.R.; Karim, K.R.; Islam, M.Y. Spatio-Temporal Variation of Cyclone Intensity over the Coastal Region of Bangladesh Using 134 Years Track Analysis. Trop. Cyclone Res. Rev. 2022, 11, 16–25. [Google Scholar] [CrossRef]
- Rahaman, M.; Esraz-Ul-Zannat, M. Evaluating the Impacts of Major Cyclonic Catastrophes in Coastal Bangladesh Using Geospatial Techniques. SN Appl. Sci. 2021, 3, 727. [Google Scholar] [CrossRef]
- Wu, S.; Zhou, X.; Reyns, J.; Yamazaki, D.; Yin, J.; Li, X. Climate Change and Urban Sprawl: Unveiling the Escalating Flood Risks in River Deltas with a Deep Dive into the GBM River Delta. Sci. Total Environ. 2024, 947, 174703. [Google Scholar] [CrossRef]
- Chowdhury, M.R. An Assessment of Flood Forecasting in Bangladesh: The Experience of the 1998 Flood. Nat. Hazards 2000, 22, 139–163. [Google Scholar] [CrossRef]
- Flood Forecasting & Warning Centre, BWDB, Bangladesh. Available online: https://www.ffwc.gov.bd/ (accessed on 18 June 2025).
- FFWC. Annual Flood Report. 2021. Available online: http://www.ffwc.gov.bd/images/annual21.pdf (accessed on 18 June 2025).
- FFWC. Annual Flood Report 2014; FFWC: Dhaka, Bangladesh, 2014. [Google Scholar]
- Paszkowski, A.; Goodbred, S.; Borgomeo, E.; Khan, M.S.A.; Hall, J.W. Geomorphic Change in the Ganges–Brahmaputra–Meghna Delta. Nat. Rev. Earth Environ. 2021, 2, 763–780. [Google Scholar] [CrossRef]
- Rahman, S.; Islam, A.K.M.S.; Saha, P.; Tazkia, A.R.; Krien, Y.; Durand, F.; Testut, L.; Islam, G.M.T.; Bala, S.K. Projected Changes of Inundation of Cyclonic Storms in the Ganges–Brahmaputra–Meghna Delta of Bangladesh Due to SLR by 2100. J. Earth Syst. Sci. 2019, 128, 145. [Google Scholar] [CrossRef]
- Brown, S.; Nicholls, R.J. Subsidence and Human Influences in Mega Deltas: The Case of the Ganges-Brahmaputra-Meghna. Sci. Total Environ. 2015, 527–528, 362–374. [Google Scholar] [CrossRef]
- Kausher, A.; Kay, R.C.; Asaduzzaman, M.; Paul, S. Climate Change and Sea-Level Rise: The Case of the Coast. In The Implications of Climate and Sea–Level Change for Bangladesh; Springer: Dordrecht, The Netherlands, 1996; pp. 335–405. [Google Scholar]
- Reitz, M.D.; Pickering, J.L.; Goodbred, S.L.; Paola, C.; Steckler, M.S.; Seeber, L.; Akhter, S.H. Effects of Tectonic Deformation and Sea Level on River Path Selection: Theory and Application to the Ganges-Brahmaputra-Meghna River Delta. J. Geophys. Res. Earth Surf. 2015, 120, 671–689. [Google Scholar] [CrossRef]
- Sarker, M.H.; Akter, J.; Ferdous, M.R.; Noor, F. Sediment Dispersal Processes and Management in Coping with Climate Change in the Meghna Estuary, Bangladesh. IAHS-AISH Publ. 2011, 349, 203–217. [Google Scholar]
- Rahman, R.; Salehin, M. Flood Risks and Reduction Approaches in Bangladesh BT. In Disaster Risk Reduction Approaches in Bangladesh; Shaw, R., Mallick, F., Islam, A., Eds.; Springer: Tokyo, Japan, 2013; pp. 65–90. ISBN 978-4-431-54252-0. [Google Scholar]
- IFRC. Emergency Appeal: Cyclone Remal. 2024. Available online: https://adore.ifrc.org/Download.aspx?FileId=839180 (accessed on 4 May 2025).
- Ahmed, B. The Root Causes of Landslide Vulnerability in Bangladesh. Landslides 2021, 18, 1707–1720. [Google Scholar] [CrossRef]
- Wang, G.; Hu, H.; Islam, A.R.M.T.; Akter, M.Y.; Fattah, M.A.; Kabir, Z.; Hasan, M.G.; Islam, M.A.; Arabameri, A.; Pal, S.C.; et al. Spatiotemporal Rainfall Concentration and Erosivity in a Tropical Monsoon Country. Theor. Appl. Climatol. 2025, 156, 251. [Google Scholar] [CrossRef]
- Azad, M.A.K.; Islam, A.R.M.T.; Ayen, K.; Rahman, M.S.; Shahid, S.; Mallick, J. Changes in Monsoon Precipitation Patterns over Bangladesh and Its Teleconnections with Global Climate. Theor. Appl. Climatol. 2022, 148, 1261–1278. [Google Scholar] [CrossRef]
- Sentinel-1 Algorithms|Google Earth Engine. Available online: https://developers.google.com/earth-engine/guides/sentinel1 (accessed on 18 June 2025).
- Haibo, H.; Garcia, E.A. Learning from Imbalanced Data. IEEE Trans. Knowl. Data Eng. 2009, 21, 1263–1284. [Google Scholar] [CrossRef]
- Tsamardinos, I.; Greasidou, E.; Borboudakis, G. Bootstrapping the Out-of-Sample Predictions for Efficient and Accurate Cross-Validation. Mach. Learn. 2018, 107, 1895–1922. [Google Scholar] [CrossRef]
- Bakirarar, B.; Elhan, A.H. Class Weighting Technique to Deal with Imbalanced Class Problem in Machine Learning: Methodological Research. Turkiye Klin. J. Biostat. 2023, 15, 19–29. [Google Scholar] [CrossRef]
- Breiman, L. Random Forests. Mach. Learn. 2001, 45, 5–32. [Google Scholar] [CrossRef]
- Cortes, C.; Vapnik, V. Support-Vector Networks. Mach. Learn. 1995, 20, 273–297. [Google Scholar] [CrossRef]
- Evgeniou, T.; Pontil, M. Support Vector Machines: Theory and Applications. In Machine Learning and Its Applications; Springer Science & Business Media: Berlin/Heidelberg, Germany, 2001; pp. 249–257. [Google Scholar]
- Mucherino, A.; Papajorgji, P.J.; Pardalos, P.M. K-Nearest Neighbor Classification. In Data Mining in Agriculture; Springer: New York, NY, USA, 2009; pp. 83–106. [Google Scholar]
- Fawcett, T. An Introduction to ROC Analysis. Pattern Recognit. Lett. 2006, 27, 861–874. [Google Scholar] [CrossRef]
- Bradley, A.P. The Use of the Area under the ROC Curve in the Evaluation of Machine Learning Algorithms. Pattern Recognit. 1997, 30, 1145–1159. [Google Scholar] [CrossRef]
- Ross, A.; Willson, V.L. Paired Samples T-Test. In Basic and Advanced Statistical Tests; SensePublishers: Rotterdam, The Netherlands, 2017; pp. 17–19. [Google Scholar]
- Bangladesh Meteorological Department (BMD). Available online: https://live8.bmd.gov.bd/ (accessed on 14 May 2025).
- Indian Meteorological Department (IMD). Available online: https://mausam.imd.gov.in/ (accessed on 14 May 2025).
- IFRC. Information Bulletin: Bangladesh Monsoon Floods. 2019. Available online: https://www.ifrc.org/docs/Appeals/16/IBBDmf160719.pdf (accessed on 4 May 2025).
- BRAC. Heavy Rainfall Across Rohingya Camps. 2021. Available online: https://fscluster.org/sites/default/files/documents/sitrep2-heavy-rainfall-at-camps-28-july-2021.pdf (accessed on 4 May 2025).
- ICCG. Bangladesh: Eastern Flash Floods. 2024. Available online: https://www.unocha.org/publications/report/bangladesh/bangladesh-eastern-flash-floods-2024-situation-report-no-02-30-august-2024 (accessed on 4 May 2025).
- IFRC. Emergency Plan of Action (EPoA) Bangladesh: Cyclone Mora. 2017. Available online: https://adore.ifrc.org/Download.aspx?FileId=163347 (accessed on 4 May 2025).
- IFRC. Bangladesh: Cyclone Amphan Report. 2021. Available online: https://reliefweb.int/report/bangladesh/bangladesh-cyclone-final-report-early-action-eap2018bd01 (accessed on 26 April 2025).
- NAWG; IMWG. Cyclone Yaas—Light Coordinated Joint Needs Analysis. 2021. Available online: https://reliefweb.int/report/bangladesh/cyclone-yaas-light-coordinated-joint-needs-analysis-needs-assessment-working-group (accessed on 26 April 2025).
- IFRC. Operation Update Report. 2024. Available online: https://adore.ifrc.org/Download.aspx?FileId=839986 (accessed on 4 May 2025).


| Year | Monsoon Rainfall Events | Cyclone Events | |||||
|---|---|---|---|---|---|---|---|
| Peak Rainfall Date | Area Averaged Rainfall Magnitude (mm/Day) | SAR Image Acquisition Date | Name of Cyclone | Landfall Date | Sustained Winds (3-min Sustained) | SAR Image Acquisition Date | |
| 2017 | 24 July | 110 mm | 24 July to 29 July | Mora | 30 May | 110 km/h | 30 May to 5 June |
| 2018 | 10 June | 112 mm | 11 June to 18 June | Titli | 10 October | 165 km/h | 9 October to 16 October |
| 2019 | 5 June | 40 mm | 1 June to 8 June | Fani | 3 May | 185 km/h | 26 April to 3 May |
| 2020 | 22 October | 110 mm | 22 October to 29 October | Amphan | 20 May | 240 km/h | 19 May to 26 May |
| 2021 | 27 July | 98 mm | 27 July to 01 August | Yaas | 26 May | 140 km/h | 21 May to 28 May |
| 2022 | 9 June | 50 mm | 9 June to 14 June | Sitrang | 24 October | 85 km/h | 24 October to 26 October |
| 2023 | 7 August | 90 mm | 8 August to 10 August | Midhili | 17 November | 95 km/h | 14 November to 19 November |
| 2024 | 1 August | 110 mm | 2 August to 4 August | Remal | 26 May | 110 km/h | 24 May to 29 May |
| Metric | RF | KNN | SVM |
|---|---|---|---|
| t-test p-value | 0.0022 * | 0.0036 * | 0.0005 * |
| McNemar’s p-value | 0.0020 * | 0.0026 * | 0.0016 * |
| Category of Inundation | Area (sq. km) | |
|---|---|---|
| Monsoon Rainfall | Cyclone | |
| Low | 13,829 | 19,085 |
| Moderate | 4054 | 3459 |
| High | 1626 | 255 |
Disclaimer/Publisher’s Note: The statements, opinions and data contained in all publications are solely those of the individual author(s) and contributor(s) and not of MDPI and/or the editor(s). MDPI and/or the editor(s) disclaim responsibility for any injury to people or property resulting from any ideas, methods, instructions or products referred to in the content. |
© 2025 by the authors. Licensee MDPI, Basel, Switzerland. This article is an open access article distributed under the terms and conditions of the Creative Commons Attribution (CC BY) license (https://creativecommons.org/licenses/by/4.0/).
Share and Cite
Shampa; Nasir, N.N.; Winey, M.M.; Dey, S.; Zahid, S.M.T.; Tasnim, Z.; Islam, A.K.M.S.; Hussain, M.A.; Hossain, M.P.; Muktadir, H.M. Integration of Remote Sensing and Machine Learning Approaches for Operational Flood Monitoring Along the Coastlines of Bangladesh Under Extreme Weather Events. Water 2025, 17, 2189. https://doi.org/10.3390/w17152189
Shampa, Nasir NN, Winey MM, Dey S, Zahid SMT, Tasnim Z, Islam AKMS, Hussain MA, Hossain MP, Muktadir HM. Integration of Remote Sensing and Machine Learning Approaches for Operational Flood Monitoring Along the Coastlines of Bangladesh Under Extreme Weather Events. Water. 2025; 17(15):2189. https://doi.org/10.3390/w17152189
Chicago/Turabian StyleShampa, Nusaiba Nueri Nasir, Mushrufa Mushreen Winey, Sujoy Dey, S. M. Tasin Zahid, Zarin Tasnim, A. K. M. Saiful Islam, Mohammad Asad Hussain, Md. Parvez Hossain, and Hussain Muhammad Muktadir. 2025. "Integration of Remote Sensing and Machine Learning Approaches for Operational Flood Monitoring Along the Coastlines of Bangladesh Under Extreme Weather Events" Water 17, no. 15: 2189. https://doi.org/10.3390/w17152189
APA StyleShampa, Nasir, N. N., Winey, M. M., Dey, S., Zahid, S. M. T., Tasnim, Z., Islam, A. K. M. S., Hussain, M. A., Hossain, M. P., & Muktadir, H. M. (2025). Integration of Remote Sensing and Machine Learning Approaches for Operational Flood Monitoring Along the Coastlines of Bangladesh Under Extreme Weather Events. Water, 17(15), 2189. https://doi.org/10.3390/w17152189