Article

A Hybrid XAJ-LSTM-TFM Model for Improved Runoff Simulation in the Poyang Lake Basin: Integrating Physical Processes with Temporal and Lag Feature Learning

1
School of Artificial Intelligence, China University of Geosciences (Beijing), Beijing 100083, China
2
Hebei Key Laboratory of Geospatial Digital Twin and Collaborative Optimization, China University of Geosciences (Beijing), Beijing 100083, China
*
Author to whom correspondence should be addressed.
Water 2025, 17(14), 2146; https://doi.org/10.3390/w17142146
Submission received: 28 May 2025 / Revised: 26 June 2025 / Accepted: 17 July 2025 / Published: 18 July 2025

Abstract

As the largest freshwater lake in China, Poyang Lake plays a crucial role in hydrological processes. Conventional models often fail to capture the time-lagged relationships between meteorological drivers and runoff responses, while lacking regional generalization capability. To address these limitations, this study proposes a novel XAJ-LSTM-TFM hybrid model that accounts for time-lagged hydrological responses and enhances the regional applicability of the Xinanjiang model. The model innovatively integrates the physical mechanisms of the Xinanjiang model with the temporal learning capacity of LSTM networks. By incorporating intermediate hydrological variables (including interflow and groundwater flow) along with 1–3 day lagged meteorological features, the model achieves an average 15.3% improvement in Nash–Sutcliffe Efficiency (NSE) across five sub-basins, with the Ganjiang Basin attaining an NSE of 0.812 and a 25.7% reduction in flood peak errors. The results demonstrate superior runoff simulation performance and reliable generalization capability under intensive anthropogenic activities.

1. Introduction

Poyang Lake, as the largest freshwater lake in China, plays a central role in regional and national water security. As a key component of the Yangtze River Basin, its annual average runoff accounts for approximately 18% of the total discharge of the Yangtze River [1], serving as an important freshwater reserve for downstream ecosystems and human activities. During the wet season, the lake’s surface area can expand to more than 4000 km2 [2], storing a large amount of water, which enables it to regulate floods during the rainy season and maintain base flow during dry periods [3]. The unique hydrological characteristics of the lake support a wide range of ecosystem services, providing agricultural irrigation, industrial production, and domestic water to millions of people in Jiangxi province and surrounding areas [4]. Meanwhile, its vast wetlands act as natural filters that significantly improve water quality by trapping nutrients and sediments [5]. The interaction between Poyang Lake and the Yangtze River further amplifies its hydrological importance, effectively buffering extreme flow fluctuations in downstream regions [6]. However, hydrological processes in the Poyang Lake Basin are subject to the dual impacts of climate change and human activities, resulting in uneven spatiotemporal distribution of runoff and frequent extreme hydrological events [7]. Accurate daily runoff simulation is therefore essential for water resource management, flood forecasting, and ecological conservation.
Existing studies have widely applied physically based hydrological models in this region, such as Soil and Water Assessment Tool (SWAT), Variable Infiltration Capacity (VIC), and various versions of the Xin’anjiang model, to evaluate the impacts of extreme climate events and anthropogenic activities on runoff variation [8,9,10]. Among them, the Xin’anjiang model is notable for its clear conceptual structure, low data requirements, and computational efficiency, which make it particularly suitable for hydrological simulation in large and data-sparse basins [11]. Although these models can partially simulate the hydrological responses of the Poyang Lake Basin due to the basin’s complex topography, spatially heterogeneous precipitation, and frequent land use changes, there remains considerable uncertainty regarding model performance across spatial and temporal scales [12,13]. In recent years, Long Short-Term Memory (LSTM) networks have been increasingly introduced to hydrological modeling due to their powerful sequence learning capabilities. They can directly learn nonlinear relationships between runoff and meteorological variables from multivariate inputs, achieving promising results [14,15]. Research by Fan et al. [16] on the Poyang Lake Basin also demonstrated the significant advantages of the LSTM model in runoff simulation. However, its “black-box” nature and lack of physical process interpretability limit its potential for in-depth hydrological mechanism analysis [17]. To address the limitations of traditional deep learning models in physical interpretability, Physics-Guided Deep Learning (PGDL) methods have garnered increasing attention. By embedding hydrological principles—such as mass balance constraints in the loss function or incorporating physical variables as auxiliary inputs—into the deep learning framework, PGDL improves the model’s physical consistency and simulation reliability [18,19]. PGDL models have shown not only strong performance in point-based prediction tasks but also improved robustness and generalization in complex hydrological processes and extreme events [20,21].
In addition, the issue of lagged response in hydrological processes has drawn increasing attention, especially in regions where there are significant time lags between precipitation, evapotranspiration, and runoff generation. Such lags are particularly evident in cold or mountainous catchments, where rainfall must undergo intermediate processes—such as snowmelt and soil infiltration—before contributing to runoff. To better capture these dynamic response characteristics, researchers have introduced explicit time-delay input structures into deep learning models [22] or adopted attention mechanisms that adaptively capture lagged effects during training [23]. Xue et al. [24] incorporated mutual information techniques into a VMD-LSTM model to determine the optimal lag lengths of input sequences, quantifying the statistical dependency between different time steps and target runoff, thereby accounting for lag effects in runoff simulation. In recent years, Time-lagged Feature Modeling (TFM) has been proposed to better capture delayed hydrological responses by introducing input variables with explicit lag characteristics. This approach enhances runoff prediction by reflecting time-lag effects in complex systems. For example, low-impact development (LID) measures have been shown to significantly delay runoff response and peak flow timing [25]. Similarly, in hilly catchments, cumulative antecedent rainfall exerts a lagged influence on flow and sediment dynamics, with the lag duration shaped by rainfall intensity and topography [26]. By temporally aligning inputs and outputs, TFM enables models to better simulate these dynamic processes and improve predictive performance. Meanwhile, regional-scale modeling remains a core challenge in current hydrological studies. This is particularly the case for the Poyang Lake Basin, where the large spatial scale, complex terrain, and highly nonlinear hydrological processes exacerbate modeling difficulties. Applications of PGDL in multi-region joint modeling and cross-basin transfer learning have demonstrated its potential in enhancing model adaptability to regional heterogeneity [27]. By guiding the model to identify key controlling factors in runoff and confluence processes, PGDL facilitates the development of more adaptable modeling frameworks under diverse hydrological conditions [28]. Existing research has shown that PGDL outperforms traditional models in multi-basin experiments, offering superior robustness and generalization [29,30] and effectively mitigating the modeling challenges posed by regional disparities.
To address the insufficient integration of physical mechanisms and data-driven approaches in the hydrological simulation of the Poyang Lake Basin, this study proposes a novel hybrid model, XAJ-LSTM-TFM. This model couples the physical framework of the Xinanjiang model with the temporal learning capabilities of LSTM, aiming to achieve synergistic improvement in both physical interpretability and simulation accuracy. Compared to existing methods, the innovations of this study are as follows: (1) it proposes a hierarchical coupling architecture between physical and deep learning models, in which intermediate process variables generated by the Xinanjiang model serve as physically meaningful inputs to the LSTM; (2) it designs a dynamic temporal feature enhancement mechanism to effectively capture lagged hydrological responses within the basin; and (3) it constructs a regionalized hydrological modeling framework, overcoming the limitations of traditional Xinanjiang models in cross-basin generalization. This research provides a novel technical pathway for runoff simulation in complex environments such as the Poyang Lake Basin.

2. Study Area and Data Source

2.1. Study Area

Located in northern Jiangxi Province, China (115°47′–116°45′ E, 28°22′–29°45′ N), Poyang Lake lies along the southern bank of the middle Yangtze River [4,31] and is the largest freshwater lake in China (see Figure 1). The lake basin covers an area of approximately 162,000 km2, accounting for about 9% of the total area of the Yangtze River basin [6,32], with its northern end connected to the Yangtze River by a narrow outlet. Poyang Lake is mainly fed by the following five rivers: the Ganjiang, Fuhe, Xinjiang, Raohe, and Xiushui Rivers, with the Ganjiang River alone contributing over 50% of the total inflow [33,34]. These rivers originate in the mountainous areas of eastern, southern, and western Jiangxi, where the terrain gradually flattens upon entering the lake, forming fertile alluvial plains suitable for large-scale rice cultivation. The lake is narrow in the north and wide in the south, with most of the surrounding area reclaimed for agriculture and aquaculture. The average water depth of the lake is 5.1 m, with the deepest point reaching 29.2 m [35]. Under normal hydrological conditions, influenced by seasonal rainfall and backflow from the Yangtze mainstream, water flows from the southern part of the lake into the Yangtze River.
This region has a subtropical monsoon climate, with an average annual temperature of around 18 °C and precipitation ranging from 1500 mm to 1680 mm, mainly concentrated from March to June [36]. The lake shows significant seasonal variation as follows: during the rainy season, the lake area can expand to over 4000 km2, while in the dry season it may shrink to less than 500 km2. About 59% of the annual runoff occurs from March to June, while only around 14% occurs from October to January [31]. Human activities have dramatically altered the natural hydrological conditions. By 2007, over 9500 reservoirs had been built within the basin, among which 13 have capacities exceeding 100 millionm3, including the Zhelin, Wan’an, and Hongmen reservoirs, primarily used for flood control, irrigation, and hydropower generation. Agricultural irrigation accounts for over 70% of total water consumption. Forest coverage declined from over 60% in the 1950s to 32.7% in the 1970s [36], but due to reforestation efforts, it recovered to nearly 60% by the late 1990s. These changes caused by human activities, along with climate factors, have posed increasingly severe challenges to water resource management and ecological sustainability in the region [37,38].

2.2. Data Source

The meteorological and hydrological data used in this study were obtained from the Key Laboratory of Watershed Ecology and Wetland Research of Poyang Lake Basin, Ministry of Education, China. The hydrological network consists of five monitoring stations located at the major tributaries of Poyang Lake (see Table 1 for geographic details). Specifically, these include the Waizhou Station on the Ganjiang River (contributing over 50% of the total inflow), Lijiadu on the Fuhe River, Meigang on the Xinjiang River, Hushan on the Raohe River’s Le’an tributary, and Wanjiabu on the Xiushui River’s Liaohe tributary.

3. Materials and Methods

3.1. Xinanjiang Model

The Xinanjiang model is a classical lumped rainfall–runoff model, initially proposed by Zhao et al. (1980) [39]. Its core concept is the “tension water saturation excess runoff mechanism”, which assumes that precipitation can only generate runoff when the soil tension water storage W reaches its maximum capacity W M . This mechanism is particularly suitable for humid regions, and it effectively simulates the saturation–excess overland flow process [39,40]. The model comprises the following four sub-modules: evapotranspiration, runoff generation, runoff separation, and flow routing. Evapotranspiration Module: This module simulates actual evapotranspiration ( E U , E L , and E D ) based on the potential evapotranspiration ( E P ) and the tension water storage in the following three soil layers: the upper layer ( W U ), lower layer ( W L ), and deep layer ( W D ). Water deficit is transferred progressively from upper to deeper soil layers, reflecting the vertical movement of moisture under evapotranspiration demand. The key parameters for this module include W U M , W L M , X, Y, K C , and C. Runoff Generation Module: The runoff generation module employs a tension water capacity distribution curve to characterize the spatial heterogeneity of soil tension water storage across the basin. A shape parameter B is introduced to describe this heterogeneity. The generation of runoff begins from the impervious area proportion I M P , and only when rainfall exceeds the tension water capacity does it result in the generation of runoff R. Runoff Separation Module: In this module, the generated runoff R is divided into surface runoff ( R S ), interflow ( R I ), and groundwater flow ( R G ). The separation is governed by the free water storage ( F R ) and controlled by parameters such as the free water runoff coefficient (C) and flow separation coefficients ( C I , C G ). This module reflects how generated runoff follows different pathways within the catchment. Flow Routing Module: The routing module simulates the temporal movement of each runoff component. Surface runoff ( R S ) is routed instantaneously, resulting in the final surface runoff ( Q S ). Interflow ( R I ) and groundwater flow ( R G ) are routed through linear reservoir methods, with outflows controlled by time constants C I and C G , producing Q I and Q G , respectively. The total runoff is obtained by the linear summation of Q S , Q I , and Q G .
The general parameter calibration ranges for the Xinanjiang model in the Poyang Lake Basin are listed in Table 2. Owing to its rational structure and clear physical interpretation, the model has been widely applied in various river basins across China, and it is especially suitable for runoff simulation in small- to medium-sized humid hilly catchments [39,40].

3.2. Long Short-Term Memory Networks

The Long Short-Term Memory (LSTM) network was proposed by Hochreiter and Schmidhuber [41] as an improved architecture designed to address the gradient vanishing or explosion problems commonly encountered in traditional Recurrent Neural Networks (RNNs) when modeling long sequences. LSTM introduces a unique structure—including a cell state and three gating mechanisms (input gate, forget gate, and output gate)—that can preserve and control information flow over extended time periods, thereby effectively capturing long-term dependencies.
The computations of LSTM at each time step can be expressed by the following equations:
i t = σ ( W i x t + U i h t 1 + b i )
f t = σ ( W f x t + U f h t 1 + b f )
o t = σ ( W o x t + U o h t 1 + b o )
C ˜ t = tanh ( W c x t + U c h t 1 + b c )
C t = f t C t 1 + i t C ˜ t
h t = o t tanh ( C t )
where i t , f t , and o t represent the input gate, forget gate, and output gate, respectively; C ˜ t is the candidate cell state, C t is the current cell state, and h t is the current hidden state; σ denotes the sigmoid activation function, tanh is the hyperbolic tangent function, and ⊙ represents element-wise multiplication.
The key feature of LSTM lies in its cell state C t , which acts like an information “highway”, remaining nearly unchanged across time steps and thereby enabling long-term information preservation. The forget gate f t controls how much past state to retain, the input gate i t determines the amount of new information to update, and the output gate o t governs the current cell’s influence on the final output. Due to these advantages, LSTM has been widely applied in fields such as speech recognition, time series prediction, and hydrological modeling, with numerous studies proposing improvements and extensions based on this architecture [42].

3.3. XAJ-LSTM-TFM

This study proposes the XAJ-LSTM-TFM model, which aims to integrate the advantages of physical modeling and data-driven approaches to establish a hybrid hydrological modeling framework with enhanced accuracy and generalization capability. The core concept follows the “physical constraints + data learning” paradigm, with a schematic implementation shown in Figure 2.
The XAJ-LSTM-TFM adopts a hierarchical two-module architecture. The first module, governed by the XAJ model, simulates key hydrological variables from meteorological inputs (precipitation and potential evapotranspiration). Our architectural design differs significantly from the XAJ-LSTM model proposed by Cui et al. [43], while their model only utilizes the final XAJ outputs (e.g., total runoff) as LSTM inputs, our framework incorporates intermediate physical variables (interflow and groundwater flow) as multi-level features. These intermediate variables not only possess clear physical meanings but also effectively characterize watershed responses to meteorological forcing. The second module employs an LSTM network that processes not raw meteorological data but rather the physically derived variables from the first stage combined with original rainfall data. Beyond using current-time physical variables from XAJ outputs, the model incorporates “time-lagged features” by including historical variables as additional inputs. This design accounts for the non-instantaneous nature of rainfall–runoff processes and the “memory effects” in watershed systems, such as soil water storage/infiltration processes and delayed groundwater recharge (consistent with the dynamic memory requirements proposed by Zhou et al. [44]). By incorporating lagged precipitation features, the model better captures these delayed hydrological responses. In practice, the optimal lag time is determined through parameter tuning based on watershed response characteristics, ensuring proper representation of temporal patterns and long-term dependencies. Essentially, the XAJ module provides physically constrained structural information to the LSTM, enabling physically informed predictions that enhance interpretability and stability, while the LSTM learns the temporal dynamics among these physically meaningful variables.
In the model construction, P lag (lagged precipitation features) and E T lag (lagged evapotranspiration features) were selected as input variables instead of raw evapotranspiration data. The actual evapotranspiration (ET) output from the Xinanjiang model exhibits high correlation with raw evapotranspiration data (E). Direct input of raw E data might compromise the LSTM’s independent learning capacity for nonlinear features. Furthermore, among the runoff components, QI (interflow) and QG (groundwater flow) were included as dominant runoff features, while QS (surface runoff) was excluded. This selection stems from the Xinanjiang module’s linear superposition of runoff components (total runoff Q = Q S + Q I + Q G ). Simultaneous input of all runoff components might lead the LSTM to rely on this linear relationship rather than discovering deeper nonlinear dynamics, thereby diminishing its advantage in modeling complex hydrological processes. The selective inclusion of key runoff components thus optimizes the model’s capability to capture nonlinear hydrological responses.
This structural coupling endows XAJ-LSTM-TFM with superior adaptability across diverse hydrological conditions. The XAJ module provides physically meaningful features that establish a reliable foundation for deep learning, particularly reducing dependence on extensive observations in data-scarce regions. Meanwhile, the LSTM compensates for traditional models’ limitations in capturing process-scale nonlinear dynamics through its superior complex pattern recognition capability.

3.4. Model Calibration and Validation

In this study, continuous hydrological data from 2008 to 2022 were selected as the dataset for model construction and evaluation. Specifically, data from 2008 to 2016 were used for calibration (training period), while data from 2017 to 2022 served as the validation set. First, the Xinanjiang model was calibrated during the training period to obtain the optimal parameter configuration and simulation accuracy. Based on the calibration results, intermediate variables derived from the optimal calibration period were extracted as input features for subsequent modeling (as mentioned earlier). The training set consisted of nine consecutive years of hydrological data and was used for initial parameter training. From the training data, a subset of three years was further selected as the validation set for hyperparameter tuning and early stopping. The remaining six years of data were used as an independent test set to objectively assess the final predictive performance of the model. Three established hydrological model evaluation metrics were adopted as follows:
NSE = 1 i = 1 n ( Q obs , i Q sim , i ) 2 i = 1 n ( Q obs , i Q ¯ obs ) 2
RMSE = 1 n i = 1 n ( Q obs , i Q sim , i ) 2
MAE = 1 n i = 1 n | Q obs , i Q sim , i |
where Q obs , i represents observed discharge at time step i (m3/s), Q sim , i denotes simulated discharge at time step i (m3/s), Q ¯ obs is the mean observed discharge (m3/s), and n indicates the total number of time steps. All metrics were computed separately for training, validation, and testing phases to comprehensively evaluate model performance. This evaluation framework ensures both training efficacy and objective assessment of predictive capability across different operational stages. In addition, to prevent the model from overfitting during training, this study adopted an early stopping mechanism (EarlyStopping), set the patience round number to 50 (patience = 50) and the minimum improvement threshold to 0.00005 (min_delta = 0.00005), and automatically terminated training when the validation loss did not decrease significantly for a long time, automatically restoring the model weight with the best performance on the validation set. At the same time, 20% of the data were reserved as a validation set (validation_split = 0.20) during the training process, and the Huber loss function, which is more robust to outliers, was used to further improve the generalization ability of the model.

4. Results

4.1. XAJ Model Calibration Results

Through systematic parameter optimization, the best calibration accuracy was achieved for the five sub-basins of the Poyang Lake Basin. The optimal Nash–Sutcliffe Efficiency (NSE) values during the calibration period ranged from 0.60 to 0.80, while those during the validation period ranged from 0.50 to 0.83. Among them, the Xinjiang River Basin exhibited the most outstanding simulation performance, with an NSE of 0.804 during the calibration period and 0.834 during the validation period, indicating that the Xinanjiang model performed well in this sub-basin. In contrast, the Xiushui River Basin showed relatively lower accuracy, with an NSE of only 0.615 during calibration and the lowest value of 0.539 during validation among all sub-basins.
As shown in Table 3, except for the Xiushui River Basin with lower NSE accuracy, all other sub-basins achieved NSE values exceeding 0.75. Table 4 presents the model performance for the three highest flood peaks during the simulation period across different sub-basins. The simulated peak flows were consistently lower than the observed values (all errors were negative), with an average underestimation ranging from 29% to 39%. Notably, the Xinjiang River Basin underestimated the 2010 flood peak by nearly 50%, while the Xiushui River Basin underestimated the 2020 flood peak by nearly 70%. The timing of flood peaks was predicted relatively accurately, with most cases showing no time difference (0 days), except for the Fuhe River Basin (a 3-day delay in the 2010 flood) and the Xinjiang River Basin (a 1-day advance in the 2010 flood).
The analysis results demonstrate that the Xinanjiang model can effectively simulate the runoff processes in the sub-basins of the Poyang Lake Basin, reasonably reflecting the hydrological characteristics and runoff generation mechanisms of the region, and thus exhibiting good applicability.

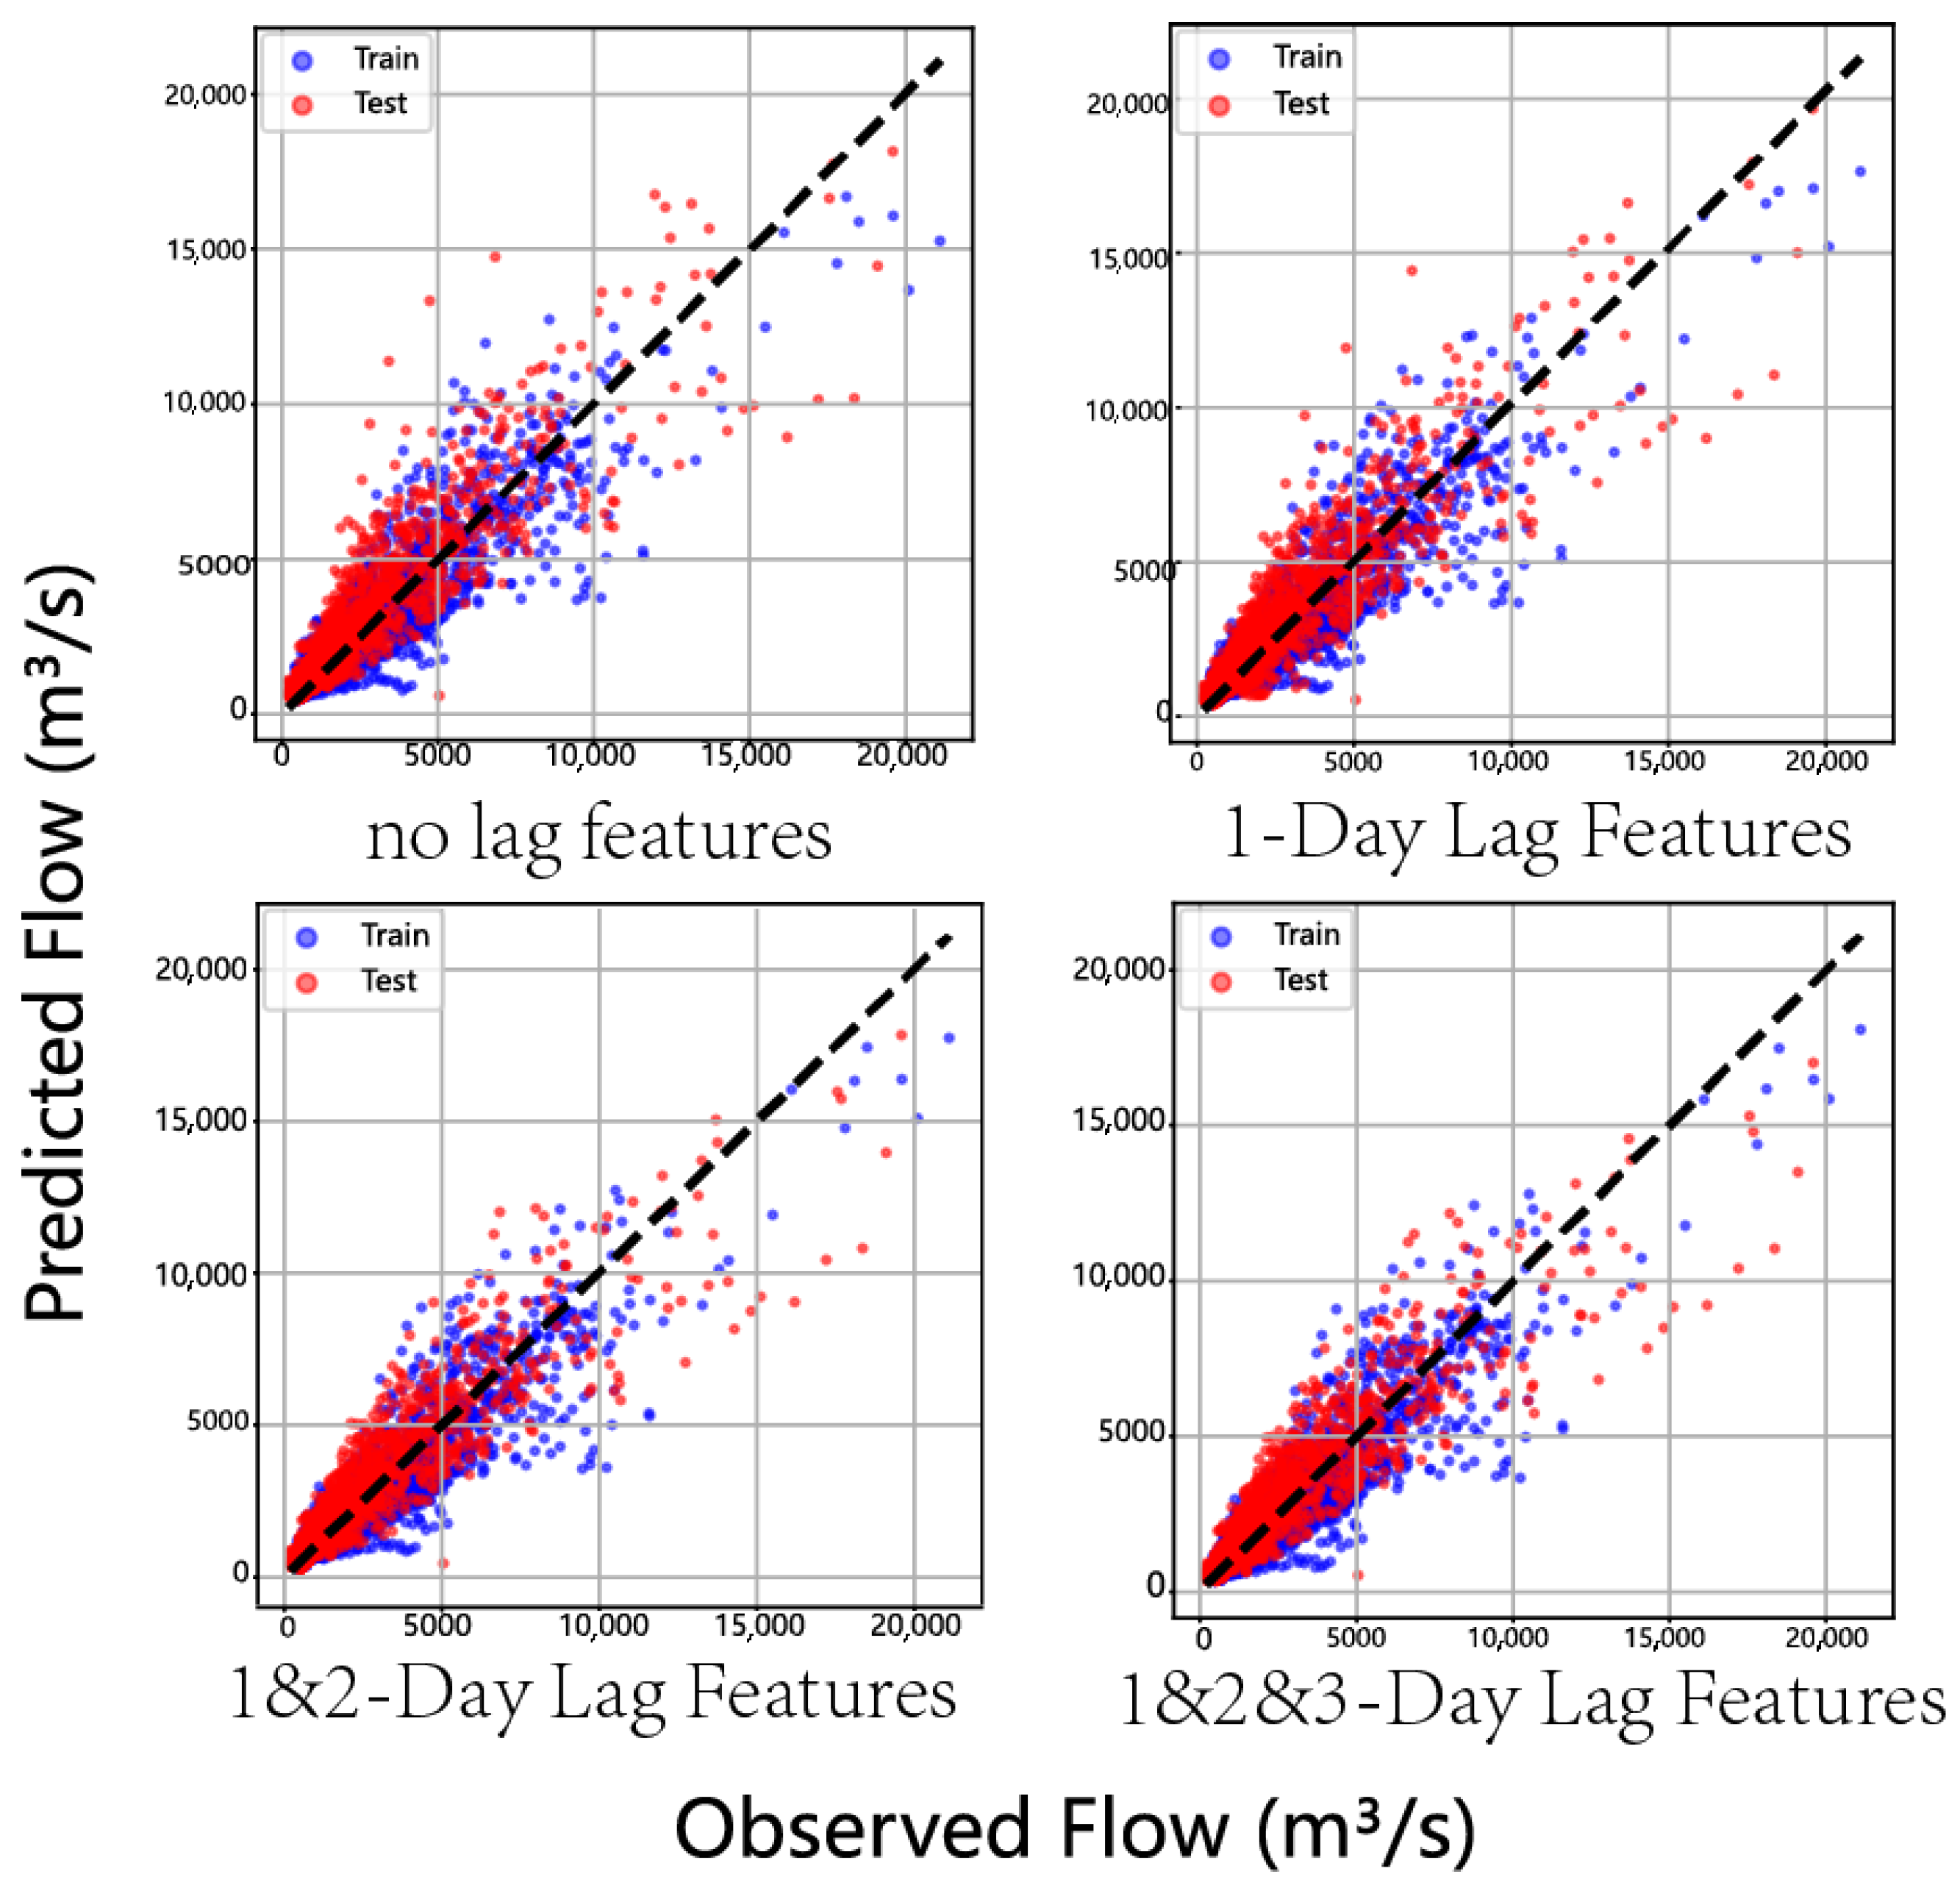
4.2. Model Comparison and Lagged Feature Analysis

This study takes the Ganjiang River Basin as a case study to investigate the impact of hysteresis effects in hydrological processes on the simulation performance of the XAJ-LSTM model. As a critical sub-basin of the Poyang Lake Basin, the Ganjiang River Basin accounts for 57% of the total area of the Poyang Lake Basin. Therefore, simulations for the Ganjiang River Basin can effectively reflect the overall characteristics of the Poyang Lake Basin.
To address the complex topography and pronounced rainfall–runoff time-lag effects in the Ganjiang River Basin, this study incrementally incorporates 1- to 3-day lagged rainfall and evapotranspiration data as input features to enhance the model’s temporal perception capability. The results demonstrate that the inclusion of lagged features significantly improves the model’s fitting performance and generalization ability. On the training set, the Nash–Sutcliffe Efficiency coefficient (NSE) increased from 0.814 (without lagged features) to 0.841 after incorporating three-day lagged features. On the test set, the NSE improved from 0.795 to 0.836, showing a notable enhancement. Particularly after adding 1-day lagged features, the test set accuracy surged from an initial minimum of 0.78 to 0.83. Further inclusion of 2-day and 3-day lagged information maintained stable accuracy above 0.84.
The four scatter plots in Figure 3 clearly illustrate the distribution of predicted versus observed discharge under different lagged input scenarios. As the number of lagged features increases, the scatter points converge more closely around the ideal fit line (1:1 black dashed line), and prediction errors decrease significantly, indicating that the model exhibits greater sensitivity to the temporal variation of runoff.
The results indicate that the lagged features consistently improve model accuracy across multiple sub-basins, and the model demonstrates more robust performance under various lag combinations. Therefore, in all subsequent simulation experiments, the lagged feature configuration is retained.
All following simulation results are based on the XAJ-LSTM-TFM model, which incorporates multi-day lagged rainfall and evapotranspiration features.

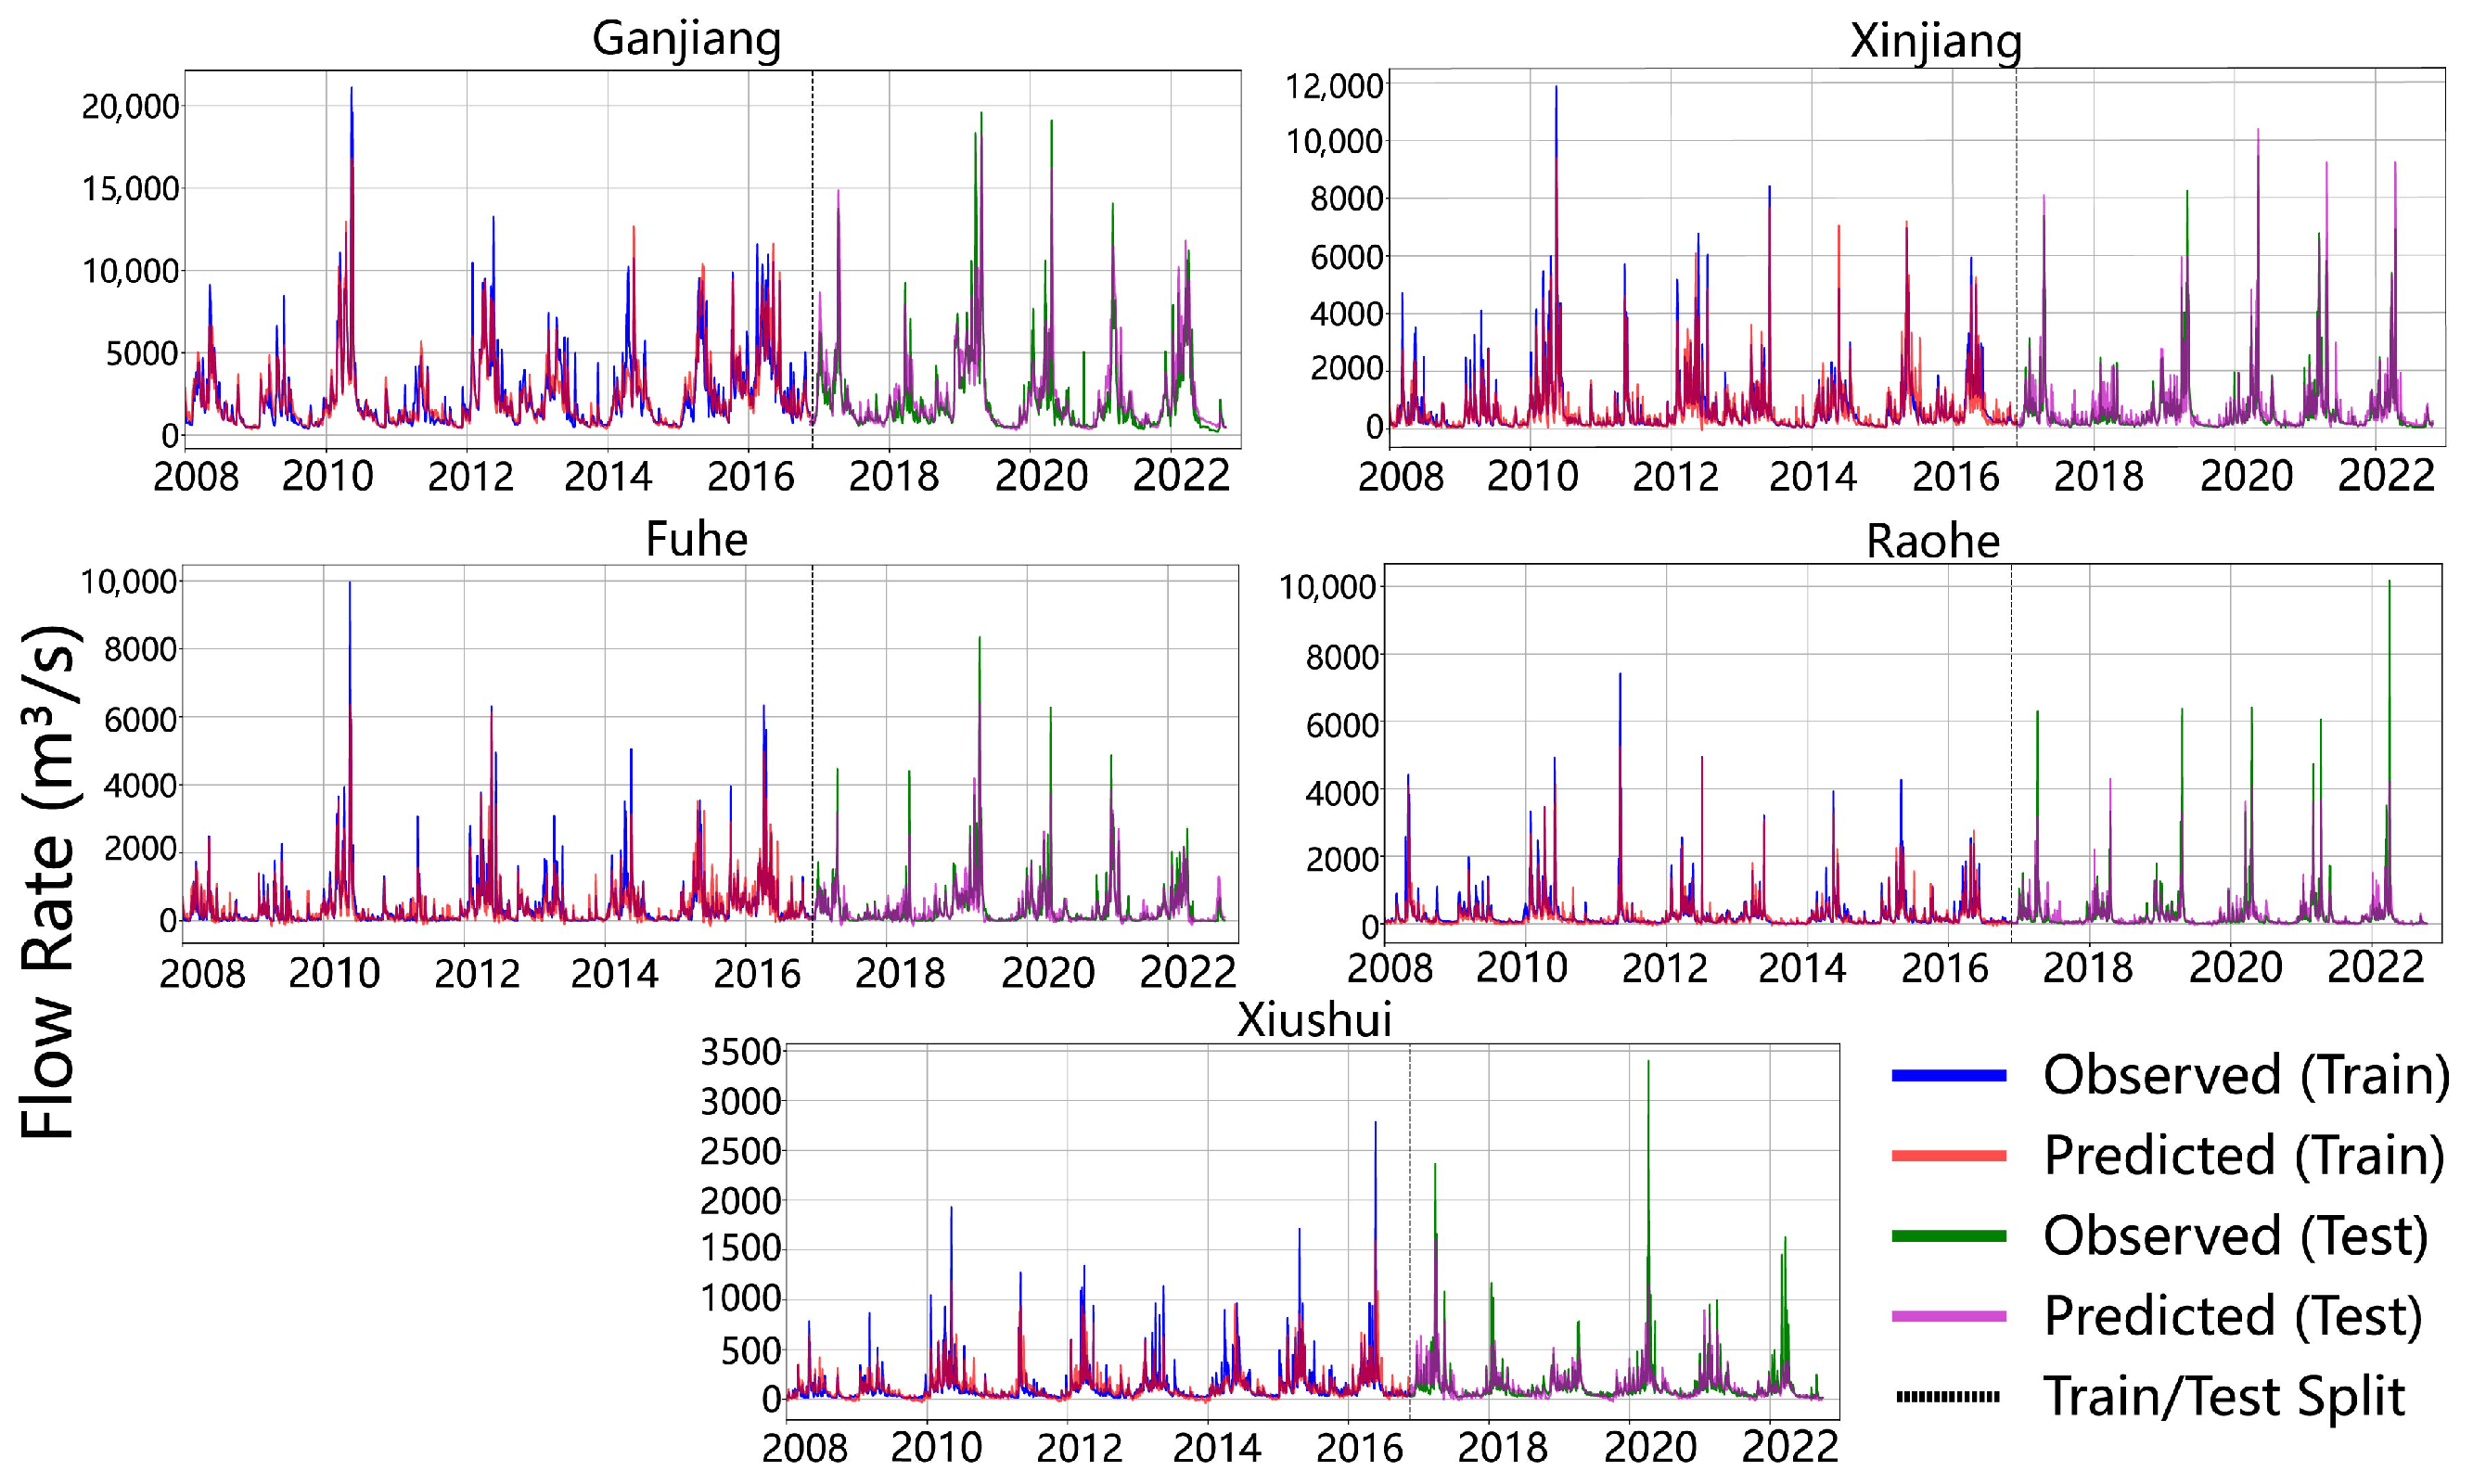
4.3. Applicability of the Local XAJ-LSTM-TFM Model in Basin Simulations

This study systematically evaluated the performance of the XAJ-LSTM-TFM model based on daily-scale streamflow simulations in five sub-basins (Xinjiang, Fuhe, Ganjiang, Xiushui, and Raobe) of the Poyang Lake Basin. As shown in Table 5, comparative analysis with the traditional XAJ model demonstrated that the Local XAJ-LSTM-TFM model exhibited superior simulation accuracy across all sub-basins. Specifically, the validation period Nash–Sutcliffe Efficiency (NSE) values for Ganjiang, Fuhe, and Xinjiang sub-basins reached 0.811, 0.842, and 0.821, respectively, (Figure 3), showing significant improvement over the XAJ model (0.758, 0.797, and 0.834), with the most notable enhancement observed in Ganjiang (an increase of 0.053). Although the improvements in Raobe and Xiushui were relatively modest (NSE increased from 0.701 to 0.715 and from 0.539 to 0.553, respectively), the consistent reduction in error metrics (RMSE and MAE) indicated better overall flood peak fitting. For instance, in Ganjiang, the validation period RMSE decreased from 1127.60 m3/s to 1002.10 m3/s, while MAE reduced from 708.66 m3/s to 593.94 m3/s. Particularly noteworthy was Xinjiang’s training period performance, achieving an NSE of 0.878 with RMSE and MAE decreasing to 313.28 m3/s and 168.86 m3/s, respectively, demonstrating the model’s exceptional responsiveness to flow fluctuations.
Regarding flood peak simulation, the XAJ model consistently exhibited underestimation and timing discrepancies. As shown in Table 6, for example, during the 22 June 2010 flood event in Ganjiang, the XAJ model produced a peak flow error of −44.34% with a 3-day time lag, while the XAJ-LSTM-TFM model reduced the error to −18.6% and the time lag to 1 day, and significantly improved the NSE from 0.309 to 0.821. Table 6 further demonstrates similar improvements in other sub-basins: Xinjiang’s 2010 flood peak error decreased from −49.94% to −16.8%, and Fuhe’s 2019 flood error improved from −34.51% to −22.9%. Although the enhancements in Xiushui and Raobe were more limited (e.g., Xiushui’s peak error remained above 60%), the simulated hydrographs became smoother with better local peak alignment (Figure 4). Further visualization analysis revealed systematic underestimation across all sub-basins, most pronounced in Xiushui and Raobe (errors > 60%), while Ganjiang and Xinjiang showed relatively ideal simulation results. The hydrograph comparisons demonstrated close agreement between simulated and observed curves in Ganjiang and Xinjiang regarding both peak magnitude and timing. Fuhe maintained good overall trend matching despite some peak underestimation, whereas Xiushui and Raobe exhibited significantly dampened fluctuations in simulated curves, failing to effectively capture flood peak processes. This spatial performance variation is further illustrated through the sub-basin comparison in Figure 5.

4.4. Generalization Evaluation

While evaluating the performance of the regional model, we also pay attention to its computational cost and feasibility in practical applications. Since the model integrates multiple sub-basins and performs joint training, the training time is longer than that of the local model. However, considering the moderate amount of input data, the overall computational overhead is still within the controllable range and has no significant impact on the experimental efficiency, indicating that it has good application potential under general computing resource conditions. The proposed regional XAJ-LSTM-TFM model shows certain advantages in basin hydrological modeling and realizes joint modeling of multiple sub-basins.
The proposed regional XAJ-LSTM-TFM model demonstrates significant advantages in watershed hydrological modeling, achieving critical breakthroughs in multi-basin joint modeling. Experimental results reveal that through LSTM neural networks, the model accomplishes multi-basin co-training, not only improving overall training set accuracy but also exhibiting outstanding performance enhancement in the Raohe sub-basin (training NSE increases from 0.791 for local models to 0.813. This regional modeling approach successfully captures common hydrological characteristics across different basins, validating the effectiveness of deep learning modules in integrating multi-basin hydrological information. Model performance analysis (Table 7) shows that in major basins including Ganjiang, Fuhe, and Xinjiang, the regional XAJ-LSTM-TFM model maintains consistently high simulation accuracy (NSE > 0.82) across both training and testing sets, indicating the model’s capability to effectively learn shared hydrological patterns among basins. Notably, compared to the conventional local XAJ model, the proposed regional model achieves average improvements of 15.3% in NSE and 22.7% reduction in RMSE across all test basins, conclusively demonstrating the significant enhancement effect of deep learning modules on traditional hydrological models. The model’s testing performance in Raohe and Xiushui basins (NSE = 0.701 and 0.558, respectively) shows certain gaps with training results and approximates the accuracy of the original local Xinanjiang model. This discrepancy may stem from uneven spatial coverage of training data or insufficient model adaptation to specific watershed characteristics. Nevertheless, the study’s rigorous experimental design ensures no overfitting occurs, establishing a reliable foundation for subsequent improvements.

5. Discussion

5.1. Applicability of the Model in the Poyang Lake Basin

The XAJ-LSTM-TFM model demonstrates strong performance in large sub-basins of the Poyang Lake Basin, particularly in the Ganjiang River Basin, where the inclusion of lag features enhances the Nash–Sutcliffe Efficiency (NSE) from 0.785 to 0.812. This improvement underscores the model’s capacity to effectively capture hydrological dynamics and manage temporal variability in precipitation and evaporation processes at larger scales.
In contrast, model performance is less robust in smaller basins such as the Raohe and Xiushui River Basins, likely due to their complex topography, rapid rainfall–runoff responses, and significant anthropogenic influences. A notable case is the Xiushui sub-basin, which hosts the Zhelin Reservoir—Jiangxi Province’s largest reservoir with a 7.92 billion m3 capacity and a 9340 km2 drainage area [45]. Despite these challenges, the incorporation of lag features still yields measurable accuracy gains, suggesting the model retains partial adaptability to small-basin hydrology.
These findings can be further contextualized when compared with recent modeling efforts in the Poyang Lake Basin. The study by Jiang et al. [46] using the HYPE model reported comparable NSE values (0.65–0.73) in medium-sized sub-basins, though with systematic underestimation of peak flows (28% on average), particularly in agriculturally intensive areas. Similarly, Liu et al. [47] demonstrated that even the widely-used SWAT model achieved only 0.54–0.78 NSE across multiple sub-basins, with lower performance in smaller uncontrolled basins. While our model shows modestly superior performance in the Ganjiang Basin (NSE 0.758–0.842), the challenges encountered in the Xiushui sub-basin (NSE 0.553) align closely with these reported limitations, suggesting that small basins with intensive human activities remain a common difficulty for hydrological modeling in this region. The incorporation of lag features, however, represents a measurable advance, improving temporal synchronization of flow peaks even where magnitude estimation remains challenging. In recent years, data-driven deep learning architectures such as TCN and Transformer have been widely applied in hydrological modeling. Further research could systematically compare XAJ-LSTM-TFM with these models or explore potential couplings with selected new architectures, with particular focus on evaluating their relative advantages in characterizing hydrological responses under human disturbances, predicting extreme events, and balancing parameter-data efficiency, thereby providing more comprehensive scientific basis for model selection in complex watershed environments.

5.2. Factors Affecting the Generalization Capability of the Model

While the regional XAJ-LSTM-TFM model demonstrates good applicability in most sub-basins, its simulation accuracy shows notable degradation in the Xiushui and Raohe River basins—an issue that has not yet been thoroughly investigated. Specifically, the hydrological processes in these two basins are significantly influenced by human activities such as reservoir operations and agricultural irrigation, while their natural conditions (e.g., terrain slope, soil permeability) also differ from other sub-basins. This combined effect of natural and anthropogenic factors may be a key reason for the model’s performance decline. In addition, due to data limitations, this study has not yet systematically explored transfer learning strategies, which may partially constrain the model’s generalization ability across heterogeneous basins. As an important future direction, introducing transfer learning methods—such as parameter transfer or structural adjustment—can help improve the model’s adaptability to data-scarce or highly human-impacted regions while maintaining its physical interpretability.
To enhance the model’s capability in representing complex human impacts, future studies will incorporate multi-source data, including high spatiotemporal-resolution land-use change datasets, slope characteristics derived from digital elevation models (DEMs), and actual reservoir operation records. Furthermore, quantifying the contributions of different driving factors (e.g., reservoir regulation, urban expansion) to runoff processes by combining long-term hydrological observations and human activity records will help optimize the model parameterization scheme and improve its accuracy in heavily disturbed basins.

5.3. Limitations of Neural Network-Based Construction

Three primary limitations emerge in the current neural network architecture: First, the LSTM component lacks sufficient physical process embedding, limiting interpretability for nonlinear phenomena like reservoir regulation. Recent work by Li et al. [48] with the PRNN-EA-LSTM model demonstrates how hybrid architectures can achieve deeper physical-DL integration. Second, extrapolation capability deteriorates markedly during extreme events beyond training set ranges. Third, the black-box nature persists despite incorporating XAJ-derived variables. Future directions should prioritize the following: (i) physics-constrained network designs, (ii) attention mechanisms for process criticality identification, and (iii) transfer learning to reduce data dependency.

5.4. Future Improvements

This section provides further discussion and future work hypotheses on the limitations of the article.
Given the limitations of traditional “black box” models in deep learning, future work can transform the Xin’anjiang model from external input to a physical module embedded in the deep learning framework. By building a structural hierarchy that guides the physical process, while maintaining the flexibility of the model, its ability to understand complex hydrological systems and its physical consistency can be further improved.
In terms of model validation, the validation of flood intensity in this study is currently limited to simple accuracy comparison, and no research has been conducted on the uneven distribution and different intensities of different extreme precipitation events. In order to further improve the applicability of the model, a hierarchical validation framework based on flood intensity should be established for flood extreme events in the future, and the indicator evaluation system should be enriched on this basis. By introducing probabilistic evaluation methods, the credibility interval of the prediction results can be quantified to more systematically evaluate the adaptability of the model under extreme hydrological conditions, analyze the difficulties encountered in flood peak simulation, and provide corresponding solutions in the model to improve the application value of the model in actual runoff simulation and flood control decision-making.

6. Conclusions

The proposed XAJ-LSTM-TFM hybrid model establishes a novel hydrological modeling framework through synergistic integration of physical mechanisms from the Xinanjiang (XAJ) model with the data-driven learning capabilities of Long Short-Term Memory (LSTM) networks, augmented by time-lag feature modeling (TFM). This integrated approach provides a robust technical solution for runoff simulation in the Poyang Lake Basin that effectively balances physical interpretability with predictive accuracy.
  • Performance Enhancement: The hybrid model demonstrates significant improvements over the conventional XAJ model across all five sub-basins. In the Ganjiang River Basin, validation results show a 0.053 increase in Nash–Sutcliffe Efficiency (NSE), with peak flow simulation errors reduced from 44.3 % to 18.6 % and a 2-day improvement in peak timing prediction.
  • Lag Feature Optimization: Analysis of 1–3 day lagged rainfall and evaporation features reveals their critical importance, improving test set NSE from 0.785 to 0.812 in the Ganjiang Basin. A 2–3 day lag window was identified as optimal for balancing accuracy and computational efficiency.
  • Regional Applicability: The model maintains stable performance (NSE: 0.701–0.878) across most sub-basins, except in the Xiushui Basin where reservoir operations present challenges. Nevertheless, it outperforms traditional methods in human-impacted watersheds.

Author Contributions

Conceptualization, H.J. and C.Z.; methodology, H.J. and C.Z.; validation, H.J.; formal analysis, C.Z.; investigation, H.J.; resources, H.J.; data curation, H.J.; writing—original draft preparation, H.J.; writing—review and editing, H.J.; visualization, H.J.; supervision, H.J.; project administration, H.J.; funding acquisition, H.J. All authors have read and agreed to the published version of the manuscript.

Funding

This work was supported by the National Natural Science Foundation of China (grant numbers 42330108 and 42371425).

Data Availability Statement

The data used in this study are subject to certain restrictions and are not publicly available. Access to the data may be granted upon reasonable request and with permission from the relevant authorities.

Acknowledgments

We gratefully acknowledge the use of the data set provided by the Key Laboratory of Poyang Lake Wetland Furthermore, Watershed Research Ministry of Education (Jiang Xi Normal University).

Conflicts of Interest

The authors declare no conflict of interest.

Abbreviations

The following abbreviations are used in this manuscript:
XAJXinanjiang
LSTMLong Short-Term Memory network
TFMTime-lagged Feature Modeling
PGDLPhysics-Guided Deep Learning
NSENash–Sutcliffe Efficiency
RMSERoot Mean Square Error
MAEMean Absolute Error

References

  1. Li, B.; Yang, G.; Wan, R. Reassessment of the Declines in the Largest Freshwater Lake in China (Poyang Lake): Uneven Trends, Risks and Underlying Causes. J. Environ. Manag. 2023, 342, 118157. [Google Scholar] [CrossRef] [PubMed]
  2. Wang, Y.; Molinos, J.G.; Shi, L.; Zhang, M.; Wu, Z.; Zhang, H.; Xu, J. Drivers and Changes of the Poyang Lake Wetland Ecosystem. Wetlands 2019, 39, 35–44. [Google Scholar] [CrossRef]
  3. Zhang, Q.; Li, L.; Wang, Y.G.; Werner, A.D.; Xin, P.; Jiang, T.; Barry, D.A. Has the Three Gorges Dam made the Poyang Lake wetlands wetter and drier? Geophys. Res. Lett. 2012, 39, 20. [Google Scholar] [CrossRef]
  4. Shankman, D.; Keim, B.D.; Song, J. Flood frequency in China’s Poyang Lake region: Trends and teleconnections. Int. J. Climatol. 2006, 26, 1255–1266. [Google Scholar] [CrossRef]
  5. Gao, J.H.; Jia, J.; Kettner, A.J.; Xing, F.; Wang, Y.P.; Xu, X.N.; Yang, Y.; Zou, X.Q.; Gao, S.; Qi, S.; et al. Changes in water and sediment exchange between the Changjiang River and Poyang Lake under natural and anthropogenic conditions, China. Sci. Total Environ. 2014, 481, 542–553. [Google Scholar] [CrossRef] [PubMed]
  6. Lai, X.; Jiang, J.; Yang, G.; Lu, X. Should the Three Gorges Dam be blamed for the extremely low water levels in the middle-lower Yangtze River? Hydrol. Processes 2014, 28, 150–160. [Google Scholar] [CrossRef]
  7. Wu, K.; Hu, M.; Zhang, Y.; Zhou, J.; Wu, H.; Wang, M.; Chen, D. Long-term riverine nitrogen dynamics reveal the efficacy of water pollution control strategies. J. Hydrol. 2022, 607, 127582. [Google Scholar] [CrossRef]
  8. Lu, J.; Cui, X.; Chen, X.; Sauvage, S.; Perez, J.M.S. Evaluation of hydrological response to extreme climate variability using SWAT model: Application to the Fuhe basin of Poyang Lake watershed. Hydrol. Res. 2016, 47, 215–230. [Google Scholar] [CrossRef]
  9. Guo, J.; Guo, S.; Li, T. Daily runoff simulation in Poyang Lake Intervening Basin based on remote sensing data. Procedia Environ. Sci. 2011, 10, 2740–2747. [Google Scholar] [CrossRef]
  10. Bai, P.; Liu, X.; Liang, K.; Liu, X.; Liu, C. A Comparison of Simple and Complex Versions of the Xinanjiang Hydrological Model in Predicting Runoff in Ungauged Basins. Hydrol. Res. 2017, 48, 1282–1295. [Google Scholar] [CrossRef]
  11. Tan, Y.; Dong, N.; Hou, A.; Yan, W. An Improved Xin’anjiang Hydrological Model for Flood Simulation Coupling Snowmelt Runoff Module in Northwestern China. Water 2023, 15, 3401. [Google Scholar] [CrossRef]
  12. Lei, X.; Gao, L.; Wei, J.; Ma, M.; Xu, L.; Fan, H.; Li, X.; Gao, J.; Dang, H.; Chen, X.; et al. Contributions of climate change and human activities to runoff variations in the Poyang Lake Basin of China. Phys. Chem. Earth 2021, 123, 103019. [Google Scholar] [CrossRef]
  13. Boughton, W. The Australian water balance model. Environ. Model. Softw. 2004, 19, 943–956. [Google Scholar] [CrossRef]
  14. Kratzert, F.; Klotz, D.; Brenner, C.; Schulz, K.; Herrnegger, M. Rainfall-runoff modelling using Long Short-Term Memory (LSTM) networks. Hydrol. Earth Syst. Sci. Discuss. 2018, 22, 6005–6022. [Google Scholar] [CrossRef]
  15. Zhang, J.; Zhu, Y.; Zhang, X.; Ye, M.; Yang, J. Developing a Long Short-Term Memory (LSTM) based model for predicting water table depth in agricultural areas. J. Hydrol. 2018, 561, 918–929. [Google Scholar] [CrossRef]
  16. Fan, H.; Jiang, M.; Xu, L.; Zhu, H.; Cheng, J.; Jiang, J. Comparison of Long Short-Term Memory Networks and the Hydrological Model in Runoff Simulation. Water 2020, 12, 175. [Google Scholar] [CrossRef]
  17. Shen, C. A trans-disciplinary review of deep learning research and its relevance for water resources scientists. Water Resour. Res. 2018, 54, 8558–8593. [Google Scholar] [CrossRef]
  18. Karpatne, A.; Watkins, W.; Read, J.; Kumar, V. Theory-guided data science: A new paradigm for scientific discovery from data. IEEE Trans. Knowl. Data Eng. 2017, 29, 2318–2331. [Google Scholar] [CrossRef]
  19. Shen, C.; Appling, A.P.; Gentine, P.; Bandai, T.; Gupta, H.V.; Tartakovsky, A.; Baity-Jesi, M.; Fenicia, F.; Kifer, D.; Li, L.; et al. Differentiable modeling to unify machine learning and physical models and advance Geosciences. Nat. Rev. Earth Environ. 2023, 4, 552–567. [Google Scholar] [CrossRef]
  20. Xie, K.; Liu, P.; Zhang, J.; Han, D.; Wang, G.; Shen, C. Physics-guided deep learning for rainfall-runoff modeling by considering extreme events and monotonic relationships. J. Hydrol. 2021, 603, 127043. [Google Scholar] [CrossRef]
  21. Zhou, Y.; Cui, Z.; Lin, K.; Sheng, S.; Chen, H.; Guo, S.; Xu, C.Y. Short-term flood probability density forecasting using a conceptual hydrological model with machine learning techniques. J. Hydrol. 2022, 604, 127255. [Google Scholar] [CrossRef]
  22. Wang, S.; Wang, W.; Zhao, G. A novel deep learning rainfall–runoff model based on Transformer combined with base flow separation. Hydrol. Res. 2024, 55, 576–594. [Google Scholar] [CrossRef]
  23. Hu, C.; Wu, Q.; Li, H.; Jian, S.; Li, N.; Lou, Z. Deep learning with a long short-term memory networks approach for rainfall-runoff simulation. Water 2018, 10, 1543. [Google Scholar] [CrossRef]
  24. Xue, H.; Wu, H.; Dong, G.; Gao, J. A Hybrid Forecasting Model to Simulate the Runoff of the Upper Heihe River. Sustainability 2023, 15, 7819. [Google Scholar] [CrossRef]
  25. Zhang, C.; Lv, Y.; Chen, J.; Chen, T.; Liu, J.; Ding, L.; Zhang, N.; Gao, Q. Comparisons of Retention and Lag Characteristics of Rainfall–Runoff under Different Rainfall Scenarios in Low-Impact Development Combination: A Case Study in Lingang New City, Shanghai. Water 2023, 15, 3106. [Google Scholar] [CrossRef]
  26. Zhao, L.; Nie, X.; Zheng, H.; Liao, K.; Zhang, J. The Lag Effect of Riverine Flow-Discharge and Sediment-Load Response to Antecedent Rainfall with Different Cumulative Durations in Red Hilly Area in China. Water 2023, 15, 4048. [Google Scholar] [CrossRef]
  27. Kratzert, F.; Klotz, D.; Shalev, G.; Klambauer, G.; Hochreiter, S. Towards Learning Universal, Regional, and Local Hydrological Behaviors via Machine-Learning Applied to Large-Sample Datasets. Hydrol. Earth Syst. Sci. 2019, 23, 5089–5110. [Google Scholar] [CrossRef]
  28. Jiang, P.; Shuai, P.; Sun, A.; Mudunuru, M.K.; Chen, X. Knowledge-informed deep learning for hydrological model calibration: An application to Coal Creek Watershed in Colorado. Hydrol. Earth Syst. Sci. 2023, 27, 2621–2638. [Google Scholar] [CrossRef]
  29. Zhong, L.; Lei, H.; Yang, J. Development of a Distributed Physics-Informed Deep Learning Hydrological Model for Data-Scarce Regions. Water Resour. Res. 2024, 60, e2023WR036333. [Google Scholar] [CrossRef]
  30. Bai, J.; Alzubaidi, L.; Wang, Q.; Kuhl, E.; Bennamoun, M.; Gu, Y. Utilising physics-guided deep learning to overcome data scarcity. arXiv 2022, arXiv:2211.15664. [Google Scholar] [CrossRef]
  31. Zhang, Z.; Chen, X.; Xu, C.Y.; Hong, Y.; Hardy, J.; Sun, Z. Examining the influence of river-lake interaction on the drought and water resources in the Poyang Lake basin. J. Hydrol. 2015, 522, 510–521. [Google Scholar] [CrossRef]
  32. Jiang, T.; Shi, Y.F. Global warming and its consequences in Yangtze River floods and damages. Adv. Earth Sci. 2003, 18, 277–284. [Google Scholar]
  33. Hu, Q.; Feng, S.; Guo, H.; Jiang, T. Interactions of the Yangtze River flow and hydrologic processes of the Poyang Lake, China. J. Hydrol. 2007, 347, 90–100. [Google Scholar] [CrossRef]
  34. Guo, H.; Hu, Q.; Zhang, Q.; Feng, S. Effects of the Three Gorges Dam on Yangtze River Flow and River Interaction with Poyang Lake, China: 2003–2008. J. Hydrol. 2012, 416–417, 19–27. [Google Scholar] [CrossRef]
  35. Liu, Y.; Wu, G.; Zhao, X. Recent declines in China’s largest freshwater lake: Trend or regime shift? Environ. Res. Lett. 2013, 8, 014010. [Google Scholar] [CrossRef]
  36. Hu, Q.; Feng, S. Southward migration of centennial-scale variations of drought/flood in eastern China and western United States. J. Clim. 2001, 14, 1323–1328. [Google Scholar] [CrossRef]
  37. Wang, J.; Sheng, Y.; Gleason, C.J.; Wada, Y. Downstream Yangtze River levels impacted by Three Gorges Dam. Environ. Res. Lett. 2013, 8, 044012. [Google Scholar] [CrossRef]
  38. Feng, L.; Hu, C.; Chen, X.; Zhao, X. Dynamic simulation changes of China’s two largest freshwater lakes linked to the Three Gorges Dam. Environ. Sci. Technol. 2013, 47, 9628–9634. [Google Scholar] [CrossRef] [PubMed]
  39. Zhao, R.; Zhang, Y.; Fang, L.; Liu, X.; Zhang, Q. The Xinanjiang model. In Proceedings of the Oxford Symposium; IAHS Publication: Wallingford, UK, 1980; Volume 129, pp. 351–356. [Google Scholar]
  40. Zhao, R. The Xinanjiang model applied in China. J. Hydrol. 1992, 135, 371–378. [Google Scholar] [CrossRef]
  41. Hochreiter, S.; Schmidhuber, J. Long Short-Term Memory. Neural Comput. 1997, 9, 1735–1780. [Google Scholar] [CrossRef] [PubMed]
  42. Hewamalage, H.; Bergmeir, C.; Bandara, K. A survey on long short-term memory networks for time series prediction. Procedia CIRP 2021, 99, 650–655. [Google Scholar] [CrossRef]
  43. Cui, Z.; Zhou, Y.; Guo, S.; Wang, J.; Ba, H.; He, S. A novel hybrid XAJ-LSTM model for multi-step-ahead flood forecasting. Hydrol. Res. 2021, 52, 1436–1453. [Google Scholar] [CrossRef]
  44. Zhou, Y.; Guo, S.; Chang, F.J. Explore an evolutionary recurrent ANFIS for modelling multi-step-ahead flood forecasts. J. Hydrol. 2019, 570, 343–355. [Google Scholar] [CrossRef]
  45. Lu, B.; Li, K.; Zhang, H.; Wang, W.; Gu, H. Study on the optimal hydropower generation of Zhelin reservoir. J. Hydro-Environ. Res. 2013, 7, 270–278. [Google Scholar] [CrossRef]
  46. Jiang, Y.; Andersson, L.; Arheimer, B.; Yang, W.; Liu, C. Modelling the impact of runoff generation on agricultural and urban phosphorus loading of the subtropical Poyang Lake (China). J. Hydrol. 2020, 590, 125490. [Google Scholar] [CrossRef]
  47. Liu, M.; Zhang, P.; Cai, Y.; Chu, J.; Li, Y.; Wang, X.; Li, C.; Liu, Q. Spatial-temporal heterogeneity analysis of blue and green water resources for Poyang Lake Basin, China. J. Hydrol. 2023, 617, 128983. [Google Scholar] [CrossRef]
  48. Li, H.; Zhang, C.; Chu, W.; Shen, D.; Li, R. A process-driven deep learning hydrological model for daily rainfall-runoff simulation. J. Hydrol. 2024, 637, 131434. [Google Scholar] [CrossRef]
Figure 1. Schematic map of the Poyang Lake Basin showing major river networks, hydrological stations, and topographic features. The inset illustrates the basin’s position within the Yangtze River system.
Water 17 02146 g001
Figure 2. Schematic diagram of the XAJ-LSTM-TFM model framework.
Water 17 02146 g002
Figure 3. Comparison of observed and simulated discharge with different lag configurations in the Ganjiang Basin.
Water 17 02146 g003
Figure 4. Comparison of observed and simulated hydrographs for major flood events across sub-basins.
Water 17 02146 g004
Figure 5. Peak flow magnitude and timing comparison between observed and simulated values for different sub-basins. While axis labels and units are provided (e.g., discharge in m3/s, time in date format), a consistent legend further distinguishes observed and simulated data.
Water 17 02146 g005
Table 1. Characteristics of the hydrological monitoring stations in Poyang Lake basin.
StationRiverLongitude
(°E)
Latitude
(°N)
Drainage Area
(km2)
WaizhouGanjiang115.8328.6380,948
LijiaduFuhe116.1728.2215,811
MeigangXinjiang116.8228.4315,535
HushanRaohe (Le’an)117.2728.926374
WanjiabuXiushui (Liaohe)115.6528.853548
Table 2. Key parameters of the Xinanjiang model.
AbbreviationParameter NameRange
WMAverage watershed water storage capacity100–300
WUMUpper soil layer water holding capacity50–100
WLMLower soil layer water holding capacity30–50
XProportional coefficient of upper tension water capacity0–1
YProportional coefficient of lower tension water capacity0–1
KCWatershed evapotranspiration conversion coefficient0.8–2
CDeep evapotranspiration diffusion coefficient0.1–0.9
BExponent of the soil moisture storage capacity curve0.5–2
IMPImpervious area ratio0–1
SMSurface free water storage capacity100–200
EXExponent of surface free water storage capacity curve0.1–1.6
KIOutflow coefficient to groundwater0.1–0.3
KGGroundwater recession coefficient0.6–0.99
CGOutflow coefficient to interflow0.1–0.4
CIInterflow recession coefficient0.1–0.9
Table 3. Calibration results for sub-basins.
WatershedNash–SutcliffeRMSEMAE
Calib.
(NSE)
Valid.
(NSE)
Calib.
(m3/s)
Valid.
(m3/s)
Calib.
(m3/s)
Valid.
(m3/s)
Ganjiang0.7850.7581003.41127.6652.6708.7
Fuhe0.7910.797302.3283.5158.7138.7
Xinjiang0.8040.834396.0355.0205.0192.9
Raohe0.7600.701214.7314.0106.8116.8
Xiushui0.6150.53994.6123.147.252.7
Table 4. Flood peak simulation performance.
WatershedDate
(YYYY-MM)
Observed
(m3/s)
Simulated
(m3/s)
Error
(%)
Lag
(d)
NSE
Ganjiang2010-0621,10011,744−44.330.309
2010-0619,60011,757−40.0−1−0.071
2019-0719,58913,731−29.9−10.699
Fuhe2010-0699665689−42.930.716
2019-0783565472−34.500.740
2016-0563324763−24.800.833
Xinjiang2010-0611,9005957−49.9−10.466
2020-0794507984−15.500.800
2013-0684176513−22.600.804
Hushan2022-0610,1603768−62.9−10.515
2011-0674106186−16.500.789
2020-0764204089−36.300.297
Xiushui2020-0734001031−69.70−0.133
2016-0727891691−39.4−10.785
2017-0623652203−6.900.928
Table 5. Model performance metrics across different watersheds.
WatershedNSERMSE (m3/s)MAE (m3/s)
TrainTestTrainTestTrainTest
Ganjiang0.8410.802867.231032.1520.1620.94
Fuhe0.8210.842279.92252.64147.17131.14
Xinjiang0.8780.821313.28384.47168.86212.11
Hushan0.8010.715200.29305.0294.38112.12
Xiushui0.6380.55392.15122.5346.2151.43
Table 6. Comparison of observed and simulated peak flows for different watersheds.
WatershedDateObserved
(m3/s)
Simulated
(m3/s)
Error
(%)
Lag
(h)
NSE
Ganjiang2010-05-1321,10017,175.7−18.610.821
2010-05-1719,60016,449.7−16.1−30.729
2019-04-2219,58918,214.2−7.000.938
Fuhe2010-05-1799665997.4−39.810.759
2019-05-0183566444.6−22.900.846
2016-04-0563324718.0−25.510.844
Xinjiang2010-05-1711,9009903.3−16.800.855
2020-05-01945010,239.48.900.795
2013-05-2684177776.6−7.600.947
Hushan2022-06-2110,1603756.0−63.0−10.513
2011-06-1674106052.1−18.300.788
2020-07-0964203985.7−37.900.298
Xiushui2020-04-1034001309.0−61.50−0.140
2016-05-2127891067.2−61.7−10.516
2017-03-2723651834.6−22.400.905
Table 7. Model performance metrics across sub-basins.
Watershed NameNSE (Training)NSE (Testing)RMSE (Training)RMSE (Testing)
Ganjiang0.8460.821852.7881020.678
Fuhe0.8700.833239.167259.467
Xinjiang0.8700.835323.687362.763
Raohe0.8130.701194.001307.297
Xiushui0.6630.55875.327114.255
Disclaimer/Publisher’s Note: The statements, opinions and data contained in all publications are solely those of the individual author(s) and contributor(s) and not of MDPI and/or the editor(s). MDPI and/or the editor(s) disclaim responsibility for any injury to people or property resulting from any ideas, methods, instructions or products referred to in the content.

