1. Introduction
Water is essential for sustaining life and supporting a wide range of domestic, agricultural, and industrial activities [
1]. Although approximately 71% of the Earth’s surface is covered by water, less than 0.5% is readily accessible and suitable for human consumption, as most of it exists as saltwater or is locked in glaciers and polar ice caps [
2]. Surface water constitutes the predominant supply of potable water for people, primarily located in lakes, rivers, and streams, with an excess of 321 billion gallons utilized daily [
3]. This scarcity has profound socioeconomic impacts, particularly in regions like India and northern China, where water access is severely constrained, affecting health, education, and economic development [
4,
5].
In the Philippines, surface water constitutes the primary water source for Filipinos, comprising around 125.8 billion cubic meters of their yearly water supply [
6]. The country relies predominantly on surface water for agricultural, household, and industrial purposes, supported by its 421 rivers, 221 lakes, and 15 operating large-scale dams [
7]. Metro Manila, the capital of the nation, primarily obtains its water supply from Angat Dam, a 131 m embankment situated in the Norzagaray area of Bulacan [
8]. This unique reservoir, which gathers water from the Angat watershed, fulfills 98% of the water needs of the National Capital Region (NCR) and its 13.5 million inhabitants, while also providing irrigation for thousands of hectares of agricultural land in Bulacan and Pampanga provinces [
9,
10,
11]. In addition to its hydropower functions, Angat Dam influences the livelihoods of many Filipinos [
12].
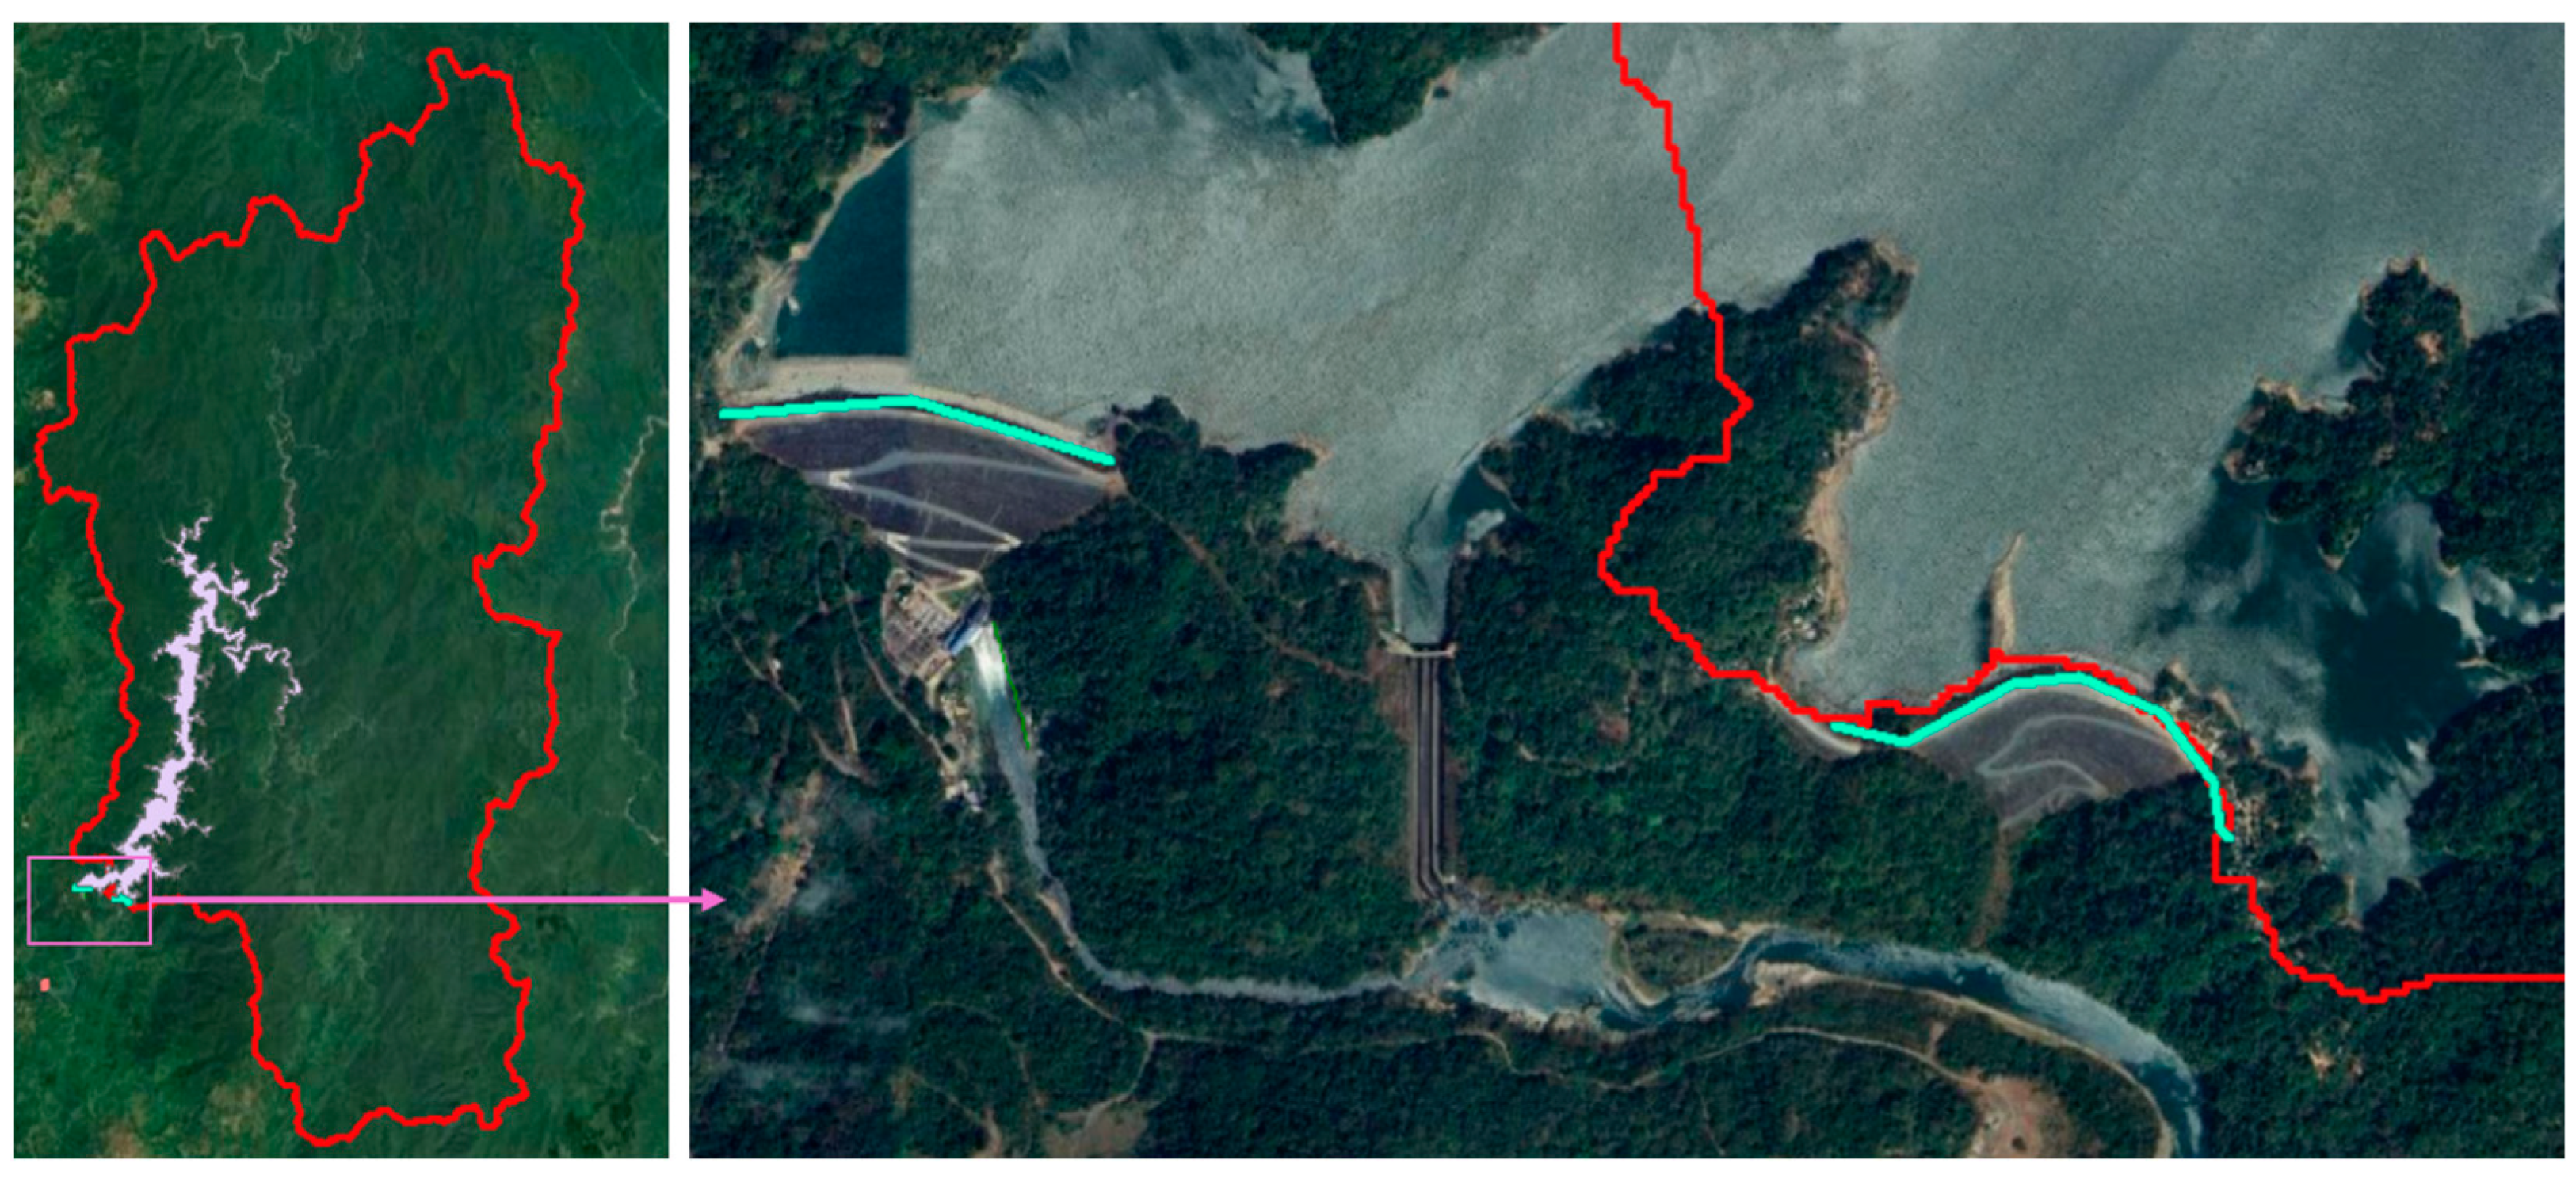
The Angat Reservoir and the larger Angat watershed (bounded in red), as presented in
Figure 1, rely exclusively on rainfall and precipitation for water recharge, resulting in a supply that is erratic and heavily contingent upon local climatic conditions [
13]. The Philippine archipelago, due to its location in the tropical monsoon zone, is vulnerable to the impacts of climate change, particularly in the form of altered precipitation patterns and extreme weather events such as typhoons and droughts [
14,
15]. While the most significant temperature increases have been observed in Arctic regions, and arid zones face acute water stress due to evaporation, tropical areas like the Philippines face distinct risks from rainfall variability and seasonal extremes. These are exacerbated by human activities that increase greenhouse gas emissions [
16]. These emissions, primarily carbon dioxide, methane, and nitrous oxide, are largely attributed to fossil fuel combustion, deforestation, and industrial processes, leading to a rise in global temperatures and altered weather patterns [
17,
18].
The Angat catchment experiences a tropical monsoon climate characterized by distinct wet and dry seasons, primarily governed by the southwest (
Habagat) and northeast (
Amihan) monsoons. Annual precipitation in the region typically ranges from 2000 to 4000 mm, with approximately 80% falling during the wet season (May to October) [
19]. This strong seasonal concentration of rainfall results in a pronounced variability in water inflow to the reservoir, making the system highly sensitive to both inter-annual climate variability and long-term changes in precipitation patterns. During the dry season (November to April), significantly reduced rainfall coincides with higher water demand, rendering the system particularly vulnerable to shortages [
20].
In addition to rainfall, seasonal variations in air temperature influence evapotranspiration rates, which affect the net water balance. Although the Philippines exhibits relatively stable annual temperature patterns, monthly variations—typically ranging from 24 °C to 32 °C—contribute to increased evaporation losses during the dry season, further intensifying water scarcity risks [
20,
21]. The watershed is predominantly covered by forested areas, which play a vital role in regulating runoff and enhancing natural water retention. However, parts of the lower catchment also include agricultural lands and peri-urban developments, which introduce areas of reduced infiltration and increased surface runoff. These land cover characteristics, in conjunction with climatic factors, shape the watershed’s hydrologic response and underline the importance of accurate rainfall forecasting and long-term climate projections in sustaining water availability [
22].
The El Niño-Southern Oscillation (ENSO) significantly affects the region, causing arid conditions and droughts during El Niño and excessive rainfall during La Niña, which can lead to water scarcity or flooding, impacting reservoir levels [
23]. The Anthropocene epoch, characterized by human dominance over environmental changes, has seen an increase in the frequency and intensity of natural disasters, including droughts and floods, due to climate change [
24]. These climatic shifts are part of a broader global environmental change, driven by both biophysical and anthropogenic factors, which are intricately linked to societal, economic, and technological developments [
23]. The consequences of these changes are profound, affecting biodiversity, ecosystems, and human societies, necessitating sustainable mitigation measures and adaptive strategies to manage future impacts [
18,
25]. Addressing these challenges requires a collaborative effort across governments, businesses, and communities to reduce emissions and foster sustainable practices, ensuring a resilient and equitable future [
18].
In the Philippine context, the water supply of Metro Manila is jeopardized by the uncertainties surrounding Angat Dam and its water reservoir in the foreseeable future. Historical data demonstrate that the watershed is vulnerable to anomalous weather events [
26]. In September 2009, during the extreme rainfall event brought by Typhoon Ondoy (a statistically rare event with an estimated return period of more than 50 years), the Angat Dam reached critical water levels, prompting emergency releases to maintain structural safety. Although specific water surface elevations were not officially reported, such releases are typically triggered when the reservoir approaches or exceeds its spilling level of 210 m above sea level, contributing to downstream flooding in the low-lying areas of Bulacan province [
27]. Conversely, in July 2010, during the prolonged drought conditions associated with the El Niño phenomenon, the reservoir reached a historically low elevation of 157.8 m. This level fell significantly below the dam’s minimum operating level for power generation (approximately 180 m), resulting in the temporary suspension of hydroelectric operations due to insufficient water head [
28]. These precedents underscore the necessity of examining climate change and predicting its impacts on one of the nation’s principal supplies of potable water.
Several modeling efforts have been conducted to analyze the behavior of water levels and inflows in the Angat watershed. Elizaga et al. (2014) employed exponential smoothing and artificial neural networks (ANN) to forecast 24 h inflows, showing high predictive accuracy (r = 0.959) [
29]. Tejada et al. (2023) applied Seasonal ARIMA (SARIMA) to predict monthly reservoir levels, highlighting seasonal trends and dry-season vulnerability [
30]. Ibañez et al. (2022) introduced deep learning approaches such as LSTM and DNN for medium-range forecasting, integrating rainfall and Niño Index inputs but lacking hydrological transparency [
31]. Tejada et al. (2023) also conducted a spatiotemporal analysis of drought severity, emphasizing prolonged low-rainfall periods lasting up to 33 months in the Angat watershed [
30].
Beyond the Philippines, similar challenges have prompted the development of innovative water level forecasting methods. Xu et al. (2021) combined Sentinel-3 altimetry and remote sensing to estimate water levels across Asian reservoirs, showing the utility of satellite data in regional monitoring [
32]. Krishnan et al. (2025) developed a hybrid LSTM-PSO model for water level prediction in tropical climates, offering improved seasonal forecasting [
33]. While these studies enhance prediction accuracy, they primarily rely on black-box models and rarely integrate physical runoff processes or long-term climate scenarios. Despite these advances, a key research gap remains: most existing models are short-term or statistical in nature and do not incorporate future climate projections or physically-based hydrologic behavior. This is particularly critical in the context of long-range water planning and climate resilience.
There is limited work in the Philippines—and none focused on Angat Dam—that uses a physically-based simulation tool like HEC-HMS combined with downscaled climate scenarios to assess future reservoir inflows.
By concentrating on the Angat watershed, this study addresses a critical need for localized analysis and provides a replicable model for evaluating the resilience of other water resources across the country.
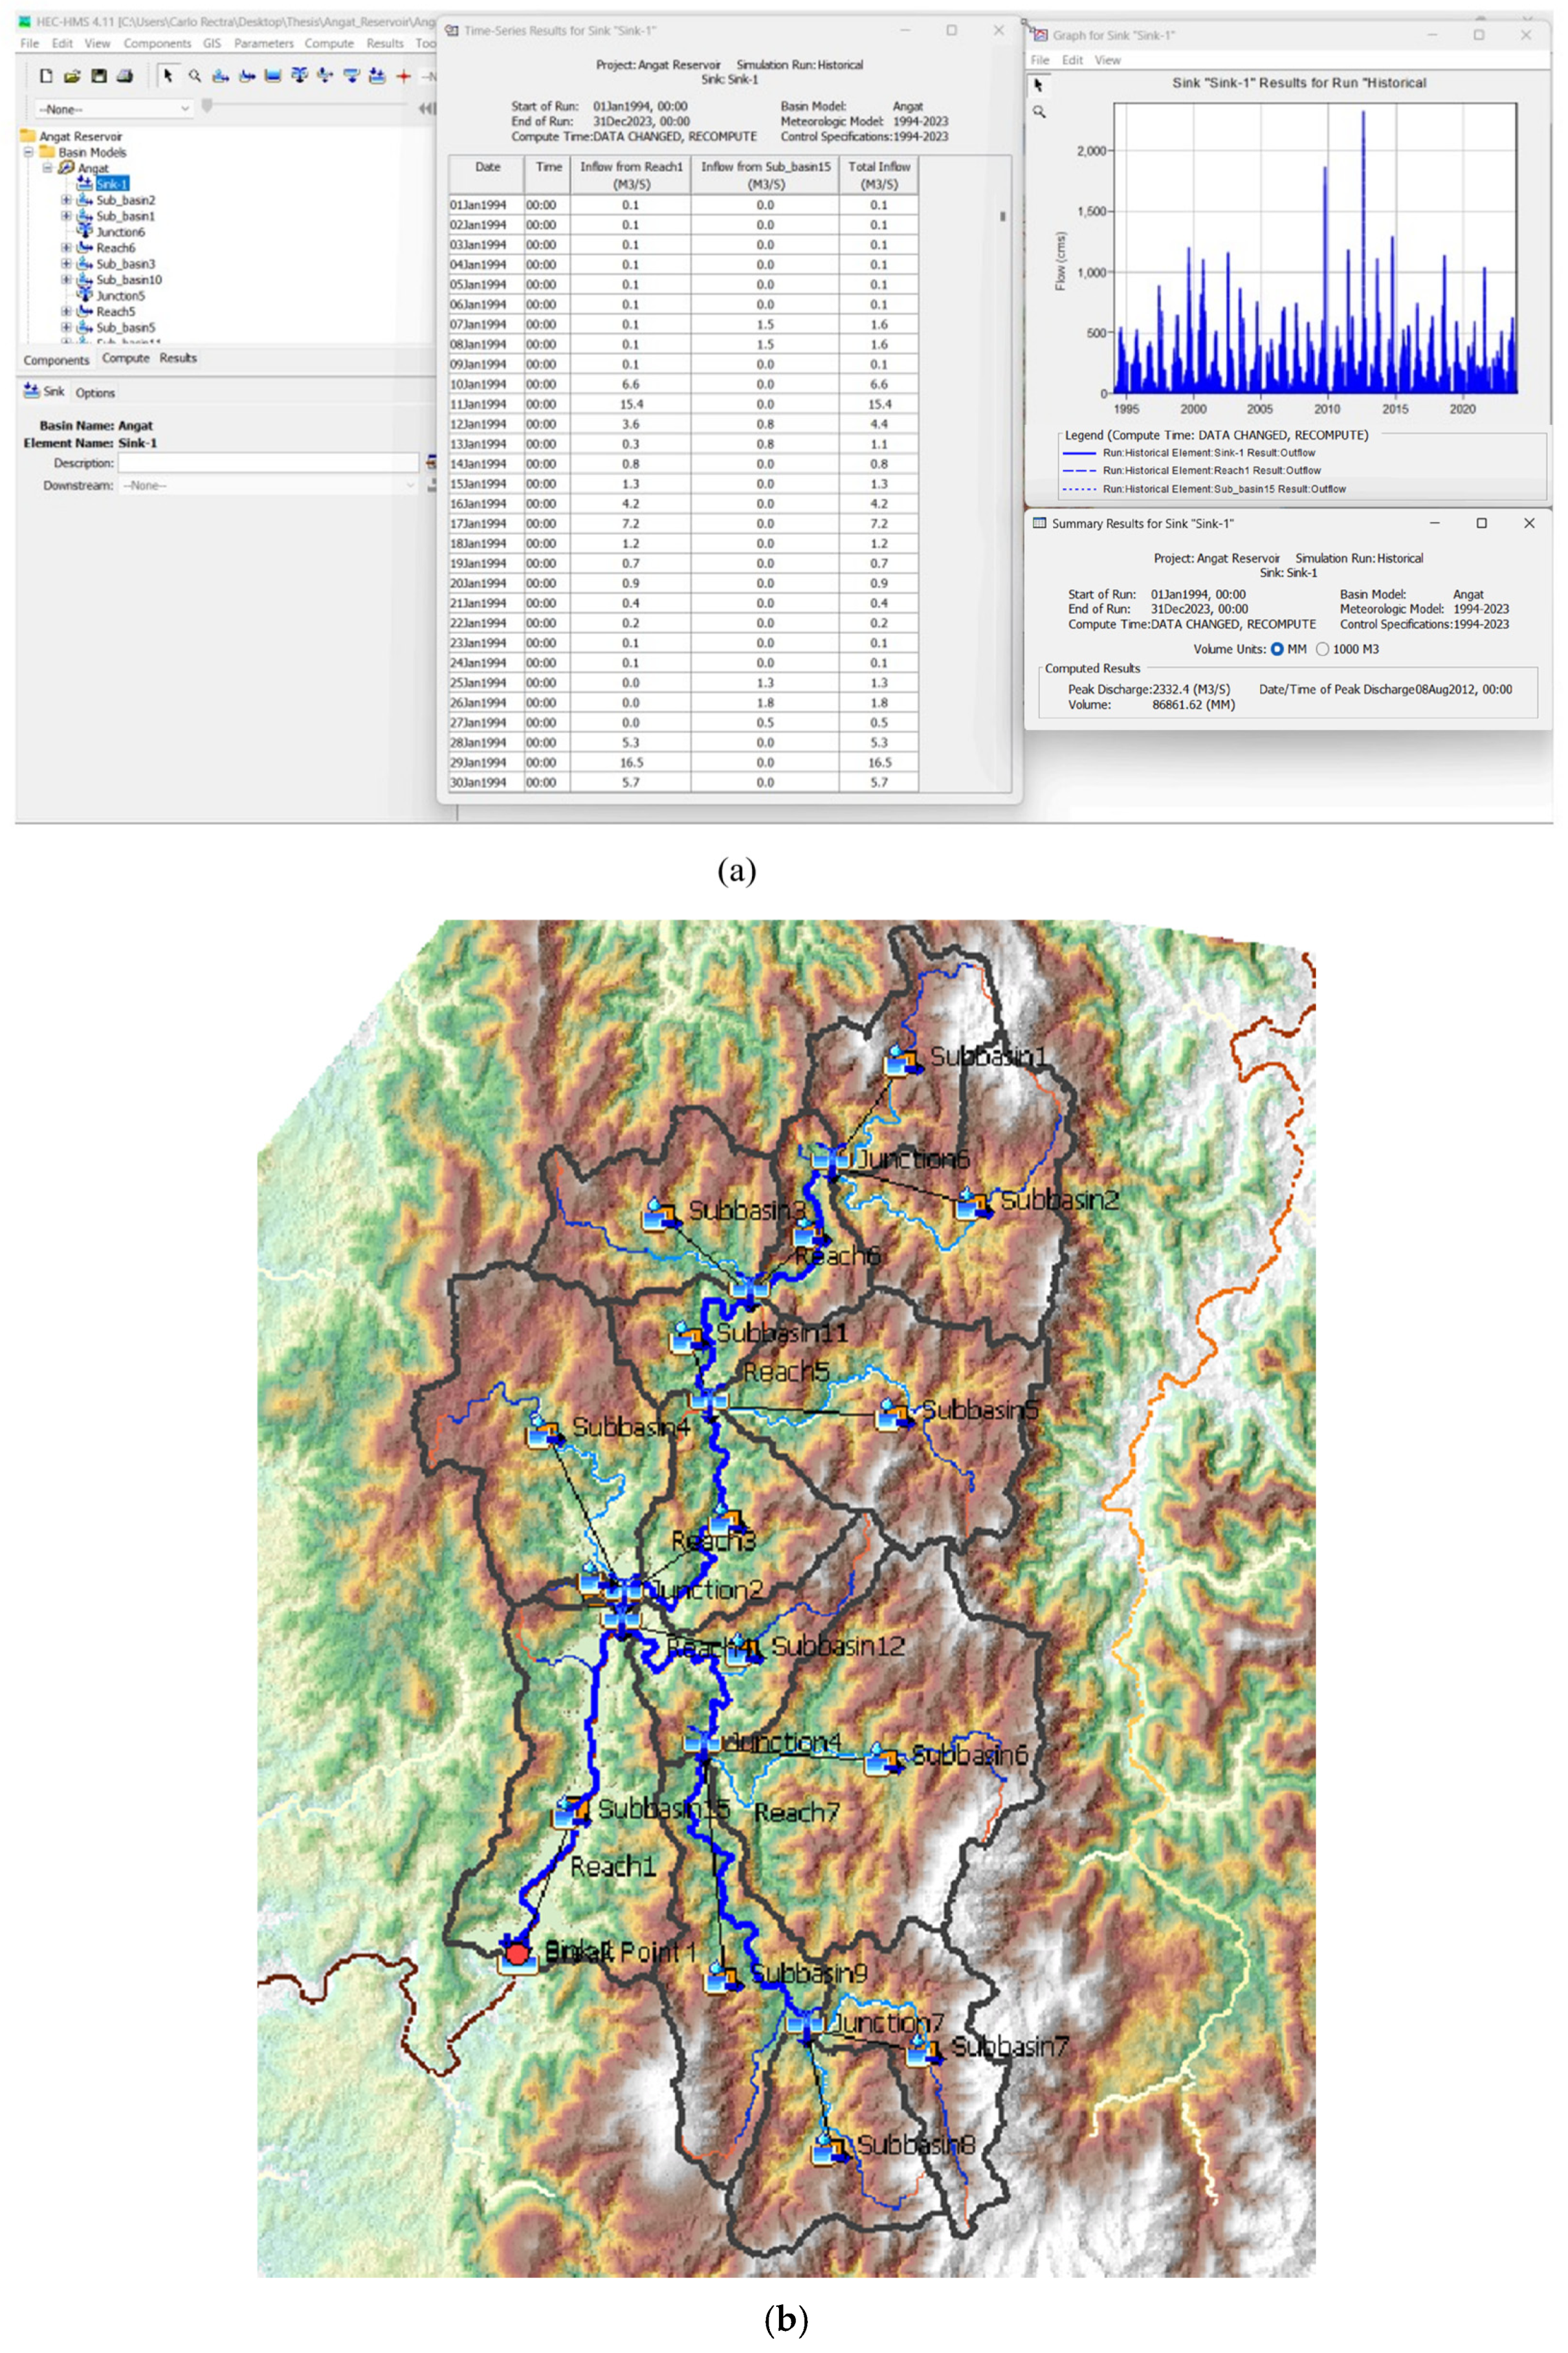
This research aims to evaluate the long-term impacts of climate change on the Angat Reservoir’s water availability using hydrological modeling through the Hydrologic Engineering Center-Hydrologic Modeling System (HEC-HMS) software, a widely used tool for simulating the hydrologic processes of watersheds [
34]. Developed by the U.S. Army Corps of Engineers, HEC-HMS integrates rainfall data, terrain features, and other hydrological inputs to generate hydrographs and evaluate watershed responses [
35]. By combining historical rainfall data with future projections from the Philippine Atmospheric, Geophysical, and Astronomical Services Administration (PAGASA), HEC-HMS allows for a detailed assessment of potential changes in the Angat Reservoir’s inflow and outflow patterns under climate change scenarios.
The significance of this research extends across multiple domains. For water resources engineering, it contributes valuable data for managing watersheds and reservoirs in changing climates. Academically, the study deepens the understanding of how climate variability influences hydrological systems, filling a gap in Philippine-focused research. At the community level, the findings can inform policies to mitigate potential water shortages, offering a replicable framework for water supply predictions in other critical watersheds across the country.
3. Results of Hydrological Simulation
3.1. Historical Rainfall and Outflows
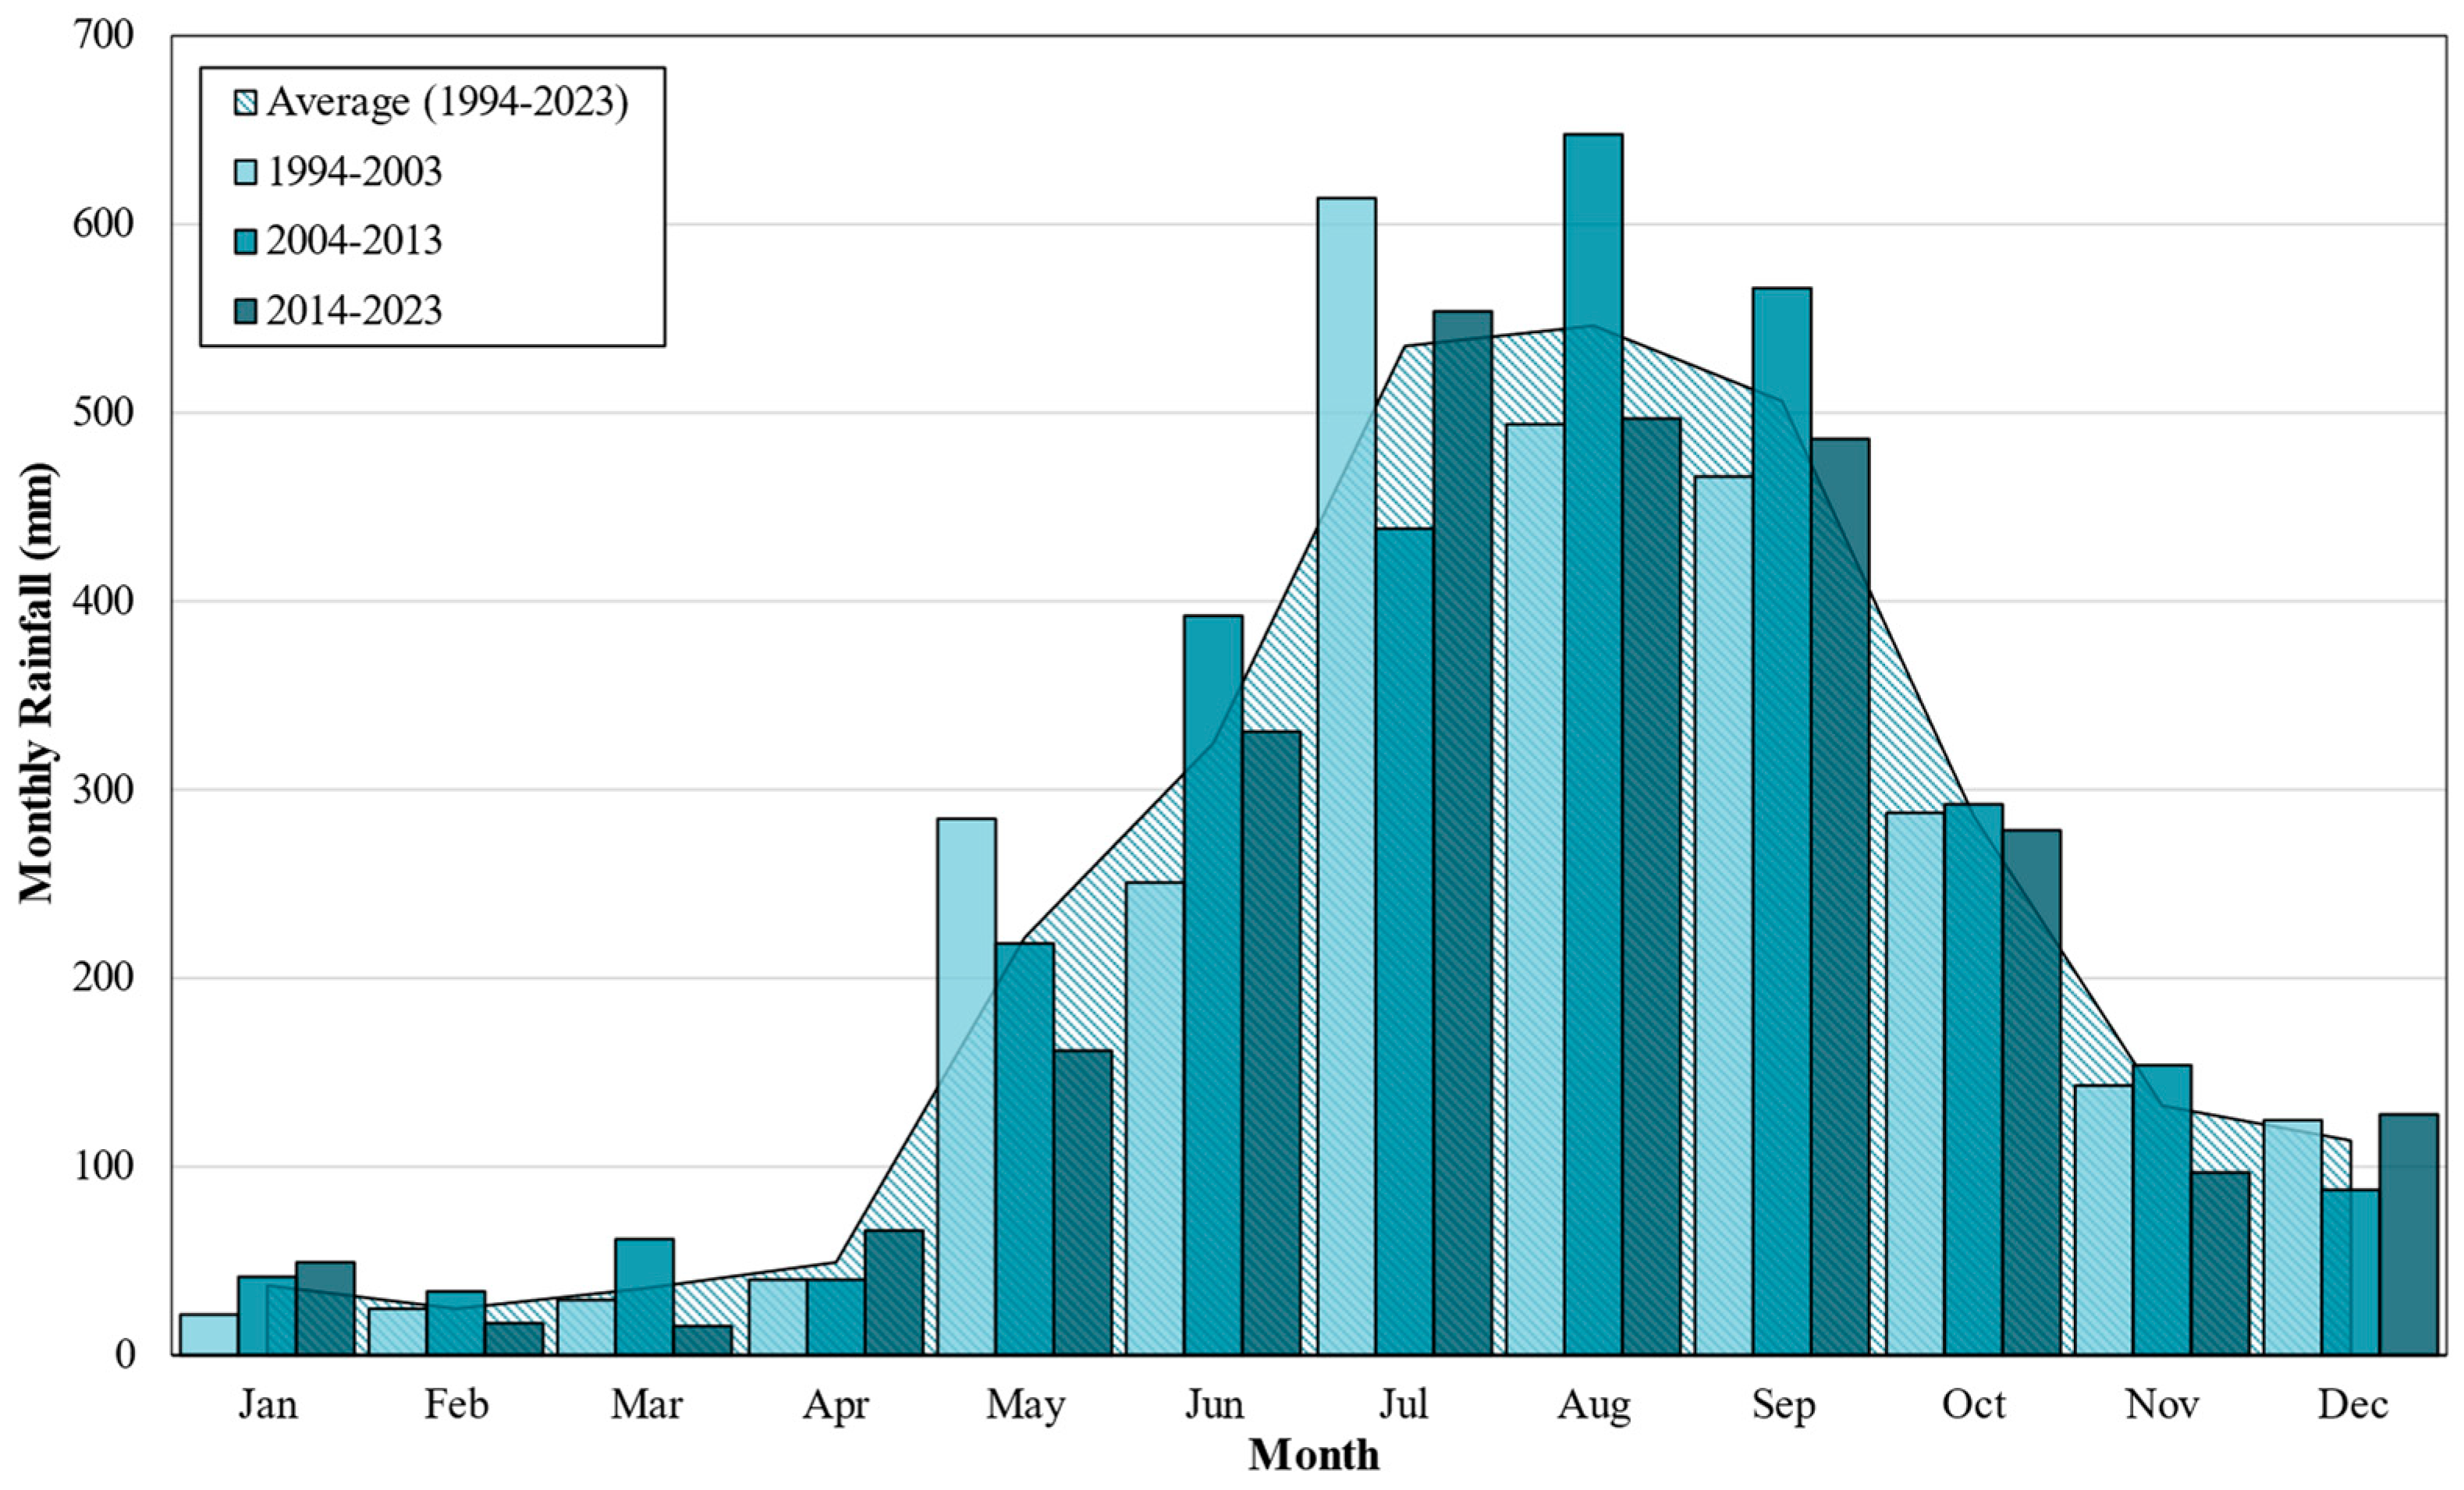
The average monthly rainfall data for the Angat watershed (1994–2023), presented in
Figure 4, reveals pronounced seasonal variability. During the wet season (May–October), rainfall peaked in July and August, with monthly totals exceeding 16,000 mm and daily averages reaching 17 mm. Conversely, the dry season (January–April) exhibited significantly lower rainfall, with monthly totals ranging from 724.10 mm to 1441.60 mm and daily averages below 2 mm. These trends reflect the monsoonal nature of precipitation in the watershed. The regional climate is primarily governed by the interaction of three major atmospheric systems: the southwest monsoon (locally referred to as Habagat), the northeast monsoon (Amihan), and the Pacific trade winds. These systems contribute to the distinct seasonal weather patterns observed throughout the year.
From May to October, the climate is predominantly influenced by the southwest monsoon, a warm and humid equatorial maritime air mass that originates from the northern Indian Ocean. This period corresponds to the wet season, characterized by frequent and intense rainfall events, particularly in the western portions of the region. Precipitation during this time is further enhanced by the formation of the shear line, a convergence zone where the South Pacific trade winds and the southeast monsoon meet, often resulting in heavy downpours and widespread moisture influx.
Conversely, from October to March, the northeast monsoon becomes dominant. Originating from the Siberian High, this air mass brings cooler and generally drier conditions as it traverses the East Asian mainland and gains moisture over the Pacific Ocean. The northeast monsoon peaks in intensity between January and February, defining the dry season in most parts of the country. However, some eastern coastal areas may continue to experience precipitation due to orographic lifting and the moisture-laden monsoon winds.
During the inter-monsoon period, typically from April to early May, the prevailing winds shift to the Pacific trade winds. These winds bring relatively stable atmospheric conditions, with occasional localized convective rainfall. The transitional nature of this period often results in variable weather patterns.
Overall, the dynamic interplay between these atmospheric systems exerts a profound influence on regional climatic conditions. These include not only the delineation of wet and dry seasons but also the modulation of extreme weather events such as typhoons, prolonged rainfall, and seasonal droughts. Understanding the behavior of these monsoonal systems is therefore essential for climate characterization, water resources planning, and disaster risk reduction in the region.
To statistically characterize this seasonal variation, a 5th-degree polynomial regression was fitted to the monthly (M) rainfall (P) distribution. The regression equation is shown in Equation (1) with a coefficient of determination of 0.9887. This model captures the pronounced monsoonal peak between July and September and provides a high-fidelity representation of monthly rainfall trends. The use of a higher-order polynomial is appropriate given the cyclic, non-linear nature of seasonal rainfall patterns in the region.
Hydrological simulations, using the historical rainfall data as input, produced corresponding outflows summarized in
Table 2. The wet season generated the highest outflows, with July and August reaching totals of 101,460.50 m
3/s and 106,515.50 m
3/s, respectively. These months also exhibited the highest daily average outflows, exceeding 109 m
3/s, as shown in
Table 2. In contrast, outflows during the dry season were significantly lower, with February showing the lowest monthly total (4948.60 m
3/s) and daily average (5.84 m
3/s). The data indicate that the primary source of water in the reservoir is surface runoff, with minimal contribution from groundwater flow. The establishment of a reservoir in this area is particularly significant given the pronounced seasonal variability in water availability characterized by periods of excess rainfall during the wet season and water scarcity during the dry season. The presence of a storage facility plays a critical role in mitigating these fluctuations by capturing excess runoff during peak rainfall months and providing a reliable water supply during drier periods. This regulation of seasonal water availability is essential for ensuring water security, supporting agricultural productivity, and enhancing the resilience of local communities to hydrological extremes.
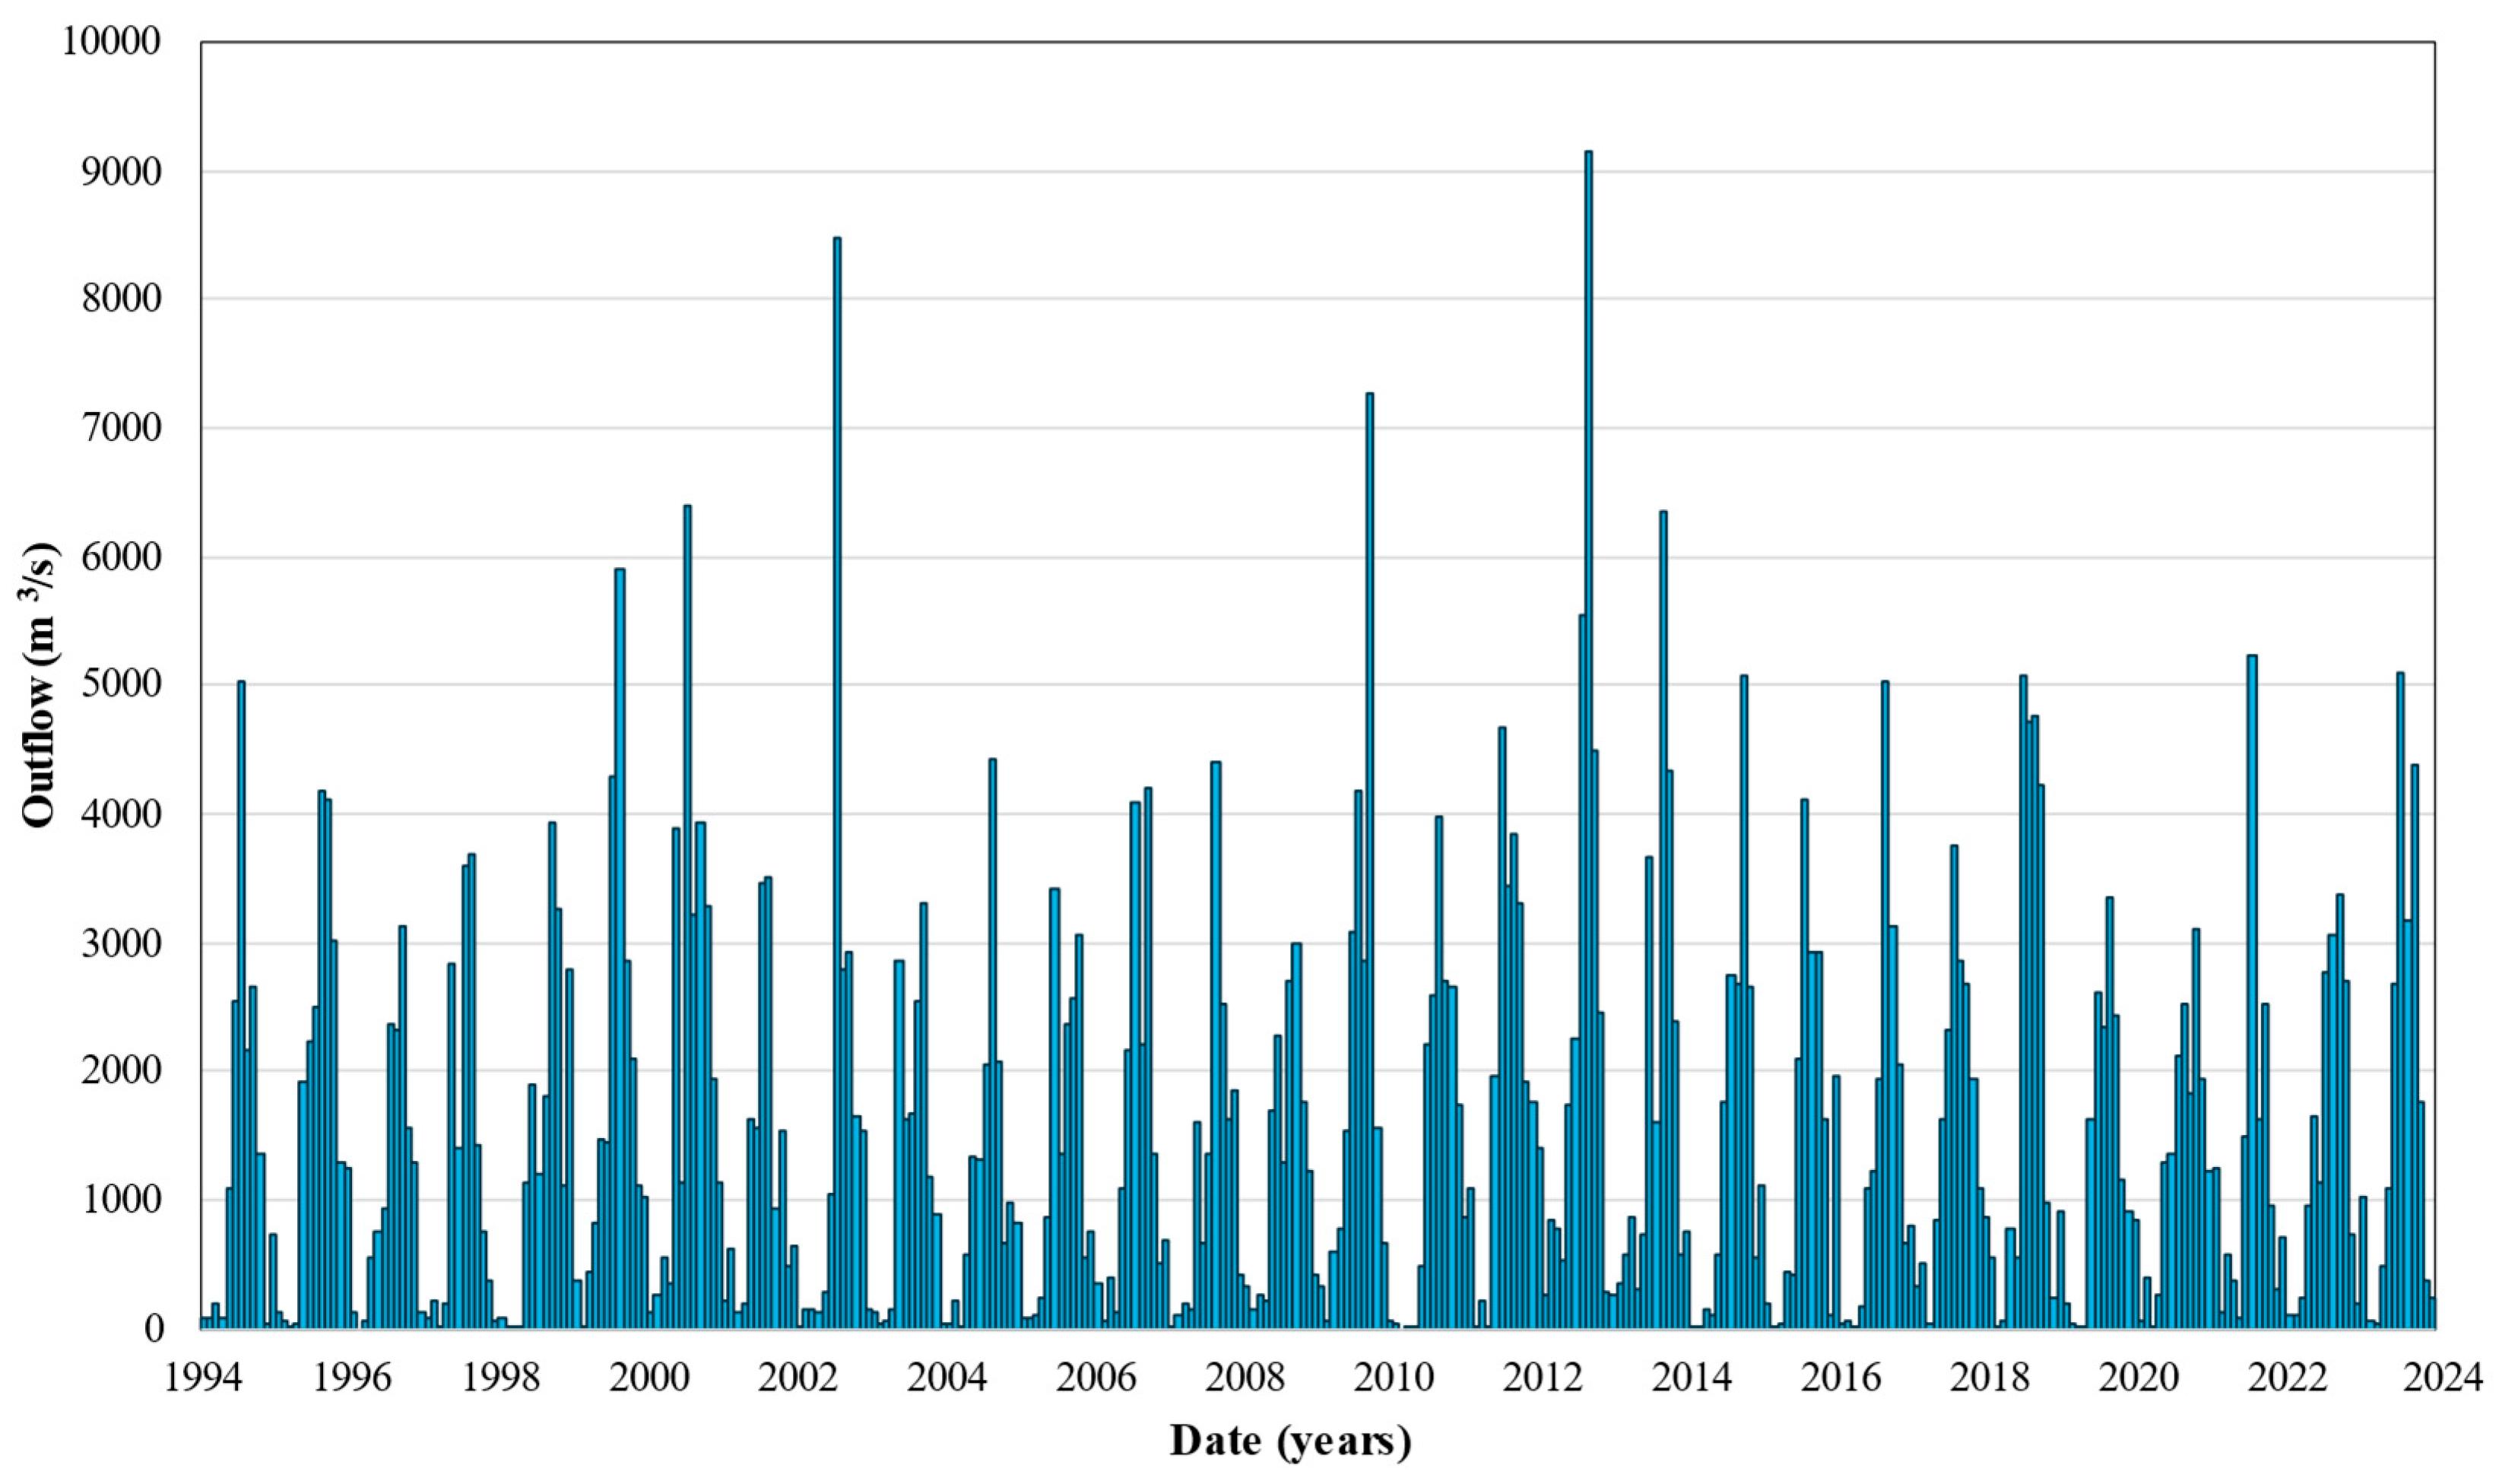
The seasonal relationship between rainfall and outflows is further illustrated in the historical hydrograph (
Figure 5), which shows distinct peaks corresponding to wet-season rainfall maxima. The highest recorded outflow occurred in August 2012, at 2332.4 m
3/s, attributed to intense tropical storm activity during that month. Over the 30-year period, the total outflow was 86,861.62 mm, while periods of low outflow were frequently observed during the dry season, reflecting minimal rainfall and baseflow contributions.
The relationship between rainfall and outflow was further examined through a scatter plot (
Figure 6), revealing a strong positive correlation (r = 0.89) and coefficient of determination of 0.99. This indicates that rainfall is the dominant factor driving hydrological responses in the Angat watershed. Months with lower rainfall cluster in the lower-left corner of the plot, while wet-season months (July–September) form the upper-right cluster. The relatively linear alignment of points suggests a direct runoff response to rainfall. Deviations from this trend may reflect influences such as reservoir operations or catchment infiltration characteristics. This suggests that the hydrological response of the watershed is primarily driven by surface runoff rather than baseflow contributions from groundwater.
3.2. Projected Rainfall over Angat Watershed
Rainfall projections for the mid-21st century (2036–2065) under the Representative Concentration Pathways (RCP) 8.5 and RCP 4.5 reveal significant changes in both the seasonal distribution and magnitude of precipitation across the Angat watershed as presented in
Table 3. This watershed is crucial for water resource management in the Philippines, supporting domestic water supply, irrigation, and hydropower generation. The varying trends between the high-emission (RCP 8.5) and moderate-emission (RCP 4.5) scenarios point to the need for adaptive management approaches that address future hydrologic variability.
During the wet season, particularly from June to September, the projections show considerable variation in total rainfall and daily intensity. Under RCP 8.5, total rainfall in July, August, and September is projected to be 13,105.66 mm, 13,357.79 mm, and 13,773.63 mm, respectively. Corresponding daily averages range from 14.09 mm to 15.30 mm, indicating a relatively stable rainfall pattern. In contrast, under RCP 4.5, the same months show slightly higher total rainfall in July and August at 14,197.38 mm and 14,943.72 mm, respectively, while September shows a slightly lower total of 13,864.65 mm. However, the daily average rainfall under RCP 4.5 reaches up to 16.07 mm in August, slightly higher than in RCP 8.5. These values suggest that while the overall amount of rainfall may remain consistent or slightly increase under RCP 4.5, the rainfall is likely to occur in more intense events spread across fewer days. This change in rainfall behavior may lead to an increased risk of flash floods and altered runoff dynamics in the watershed.
In the dry season, from January to April, both scenarios reflect minimal changes from historical trends in terms of total rainfall, but differences in daily intensity remain evident. Under RCP 8.5, monthly rainfall totals range from 709.62 mm in February to 1343.57 mm in April, with daily averages remaining below 1.5 mm. Meanwhile, under RCP 4.5, these months show slightly higher totals up to 1441.60 mm in April and marginal increases in daily average rainfall, with April reaching 1.60 mm/day. Although these changes seem modest, the potential for short-duration, high-intensity rainfall even during dry months could reduce recharge efficiency, increase surface runoff, and complicate reservoir operations.
For transitional months such as May, October, and November, the projections continue to show mixed patterns. May is projected to receive higher rainfall under RCP 8.5 (6182.61 mm) compared to RCP 4.5 (5094.68 mm), while October shows nearly equivalent rainfall across both scenarios, with a slight increase under RCP 4.5. November and December exhibit higher projected rainfall under RCP 4.5, particularly November with 4109.50 mm compared to 3574.16 mm under RCP 8.5. This suggests that the wet season may extend longer under RCP 4.5, potentially increasing the likelihood of prolonged wet conditions and late-season flooding.
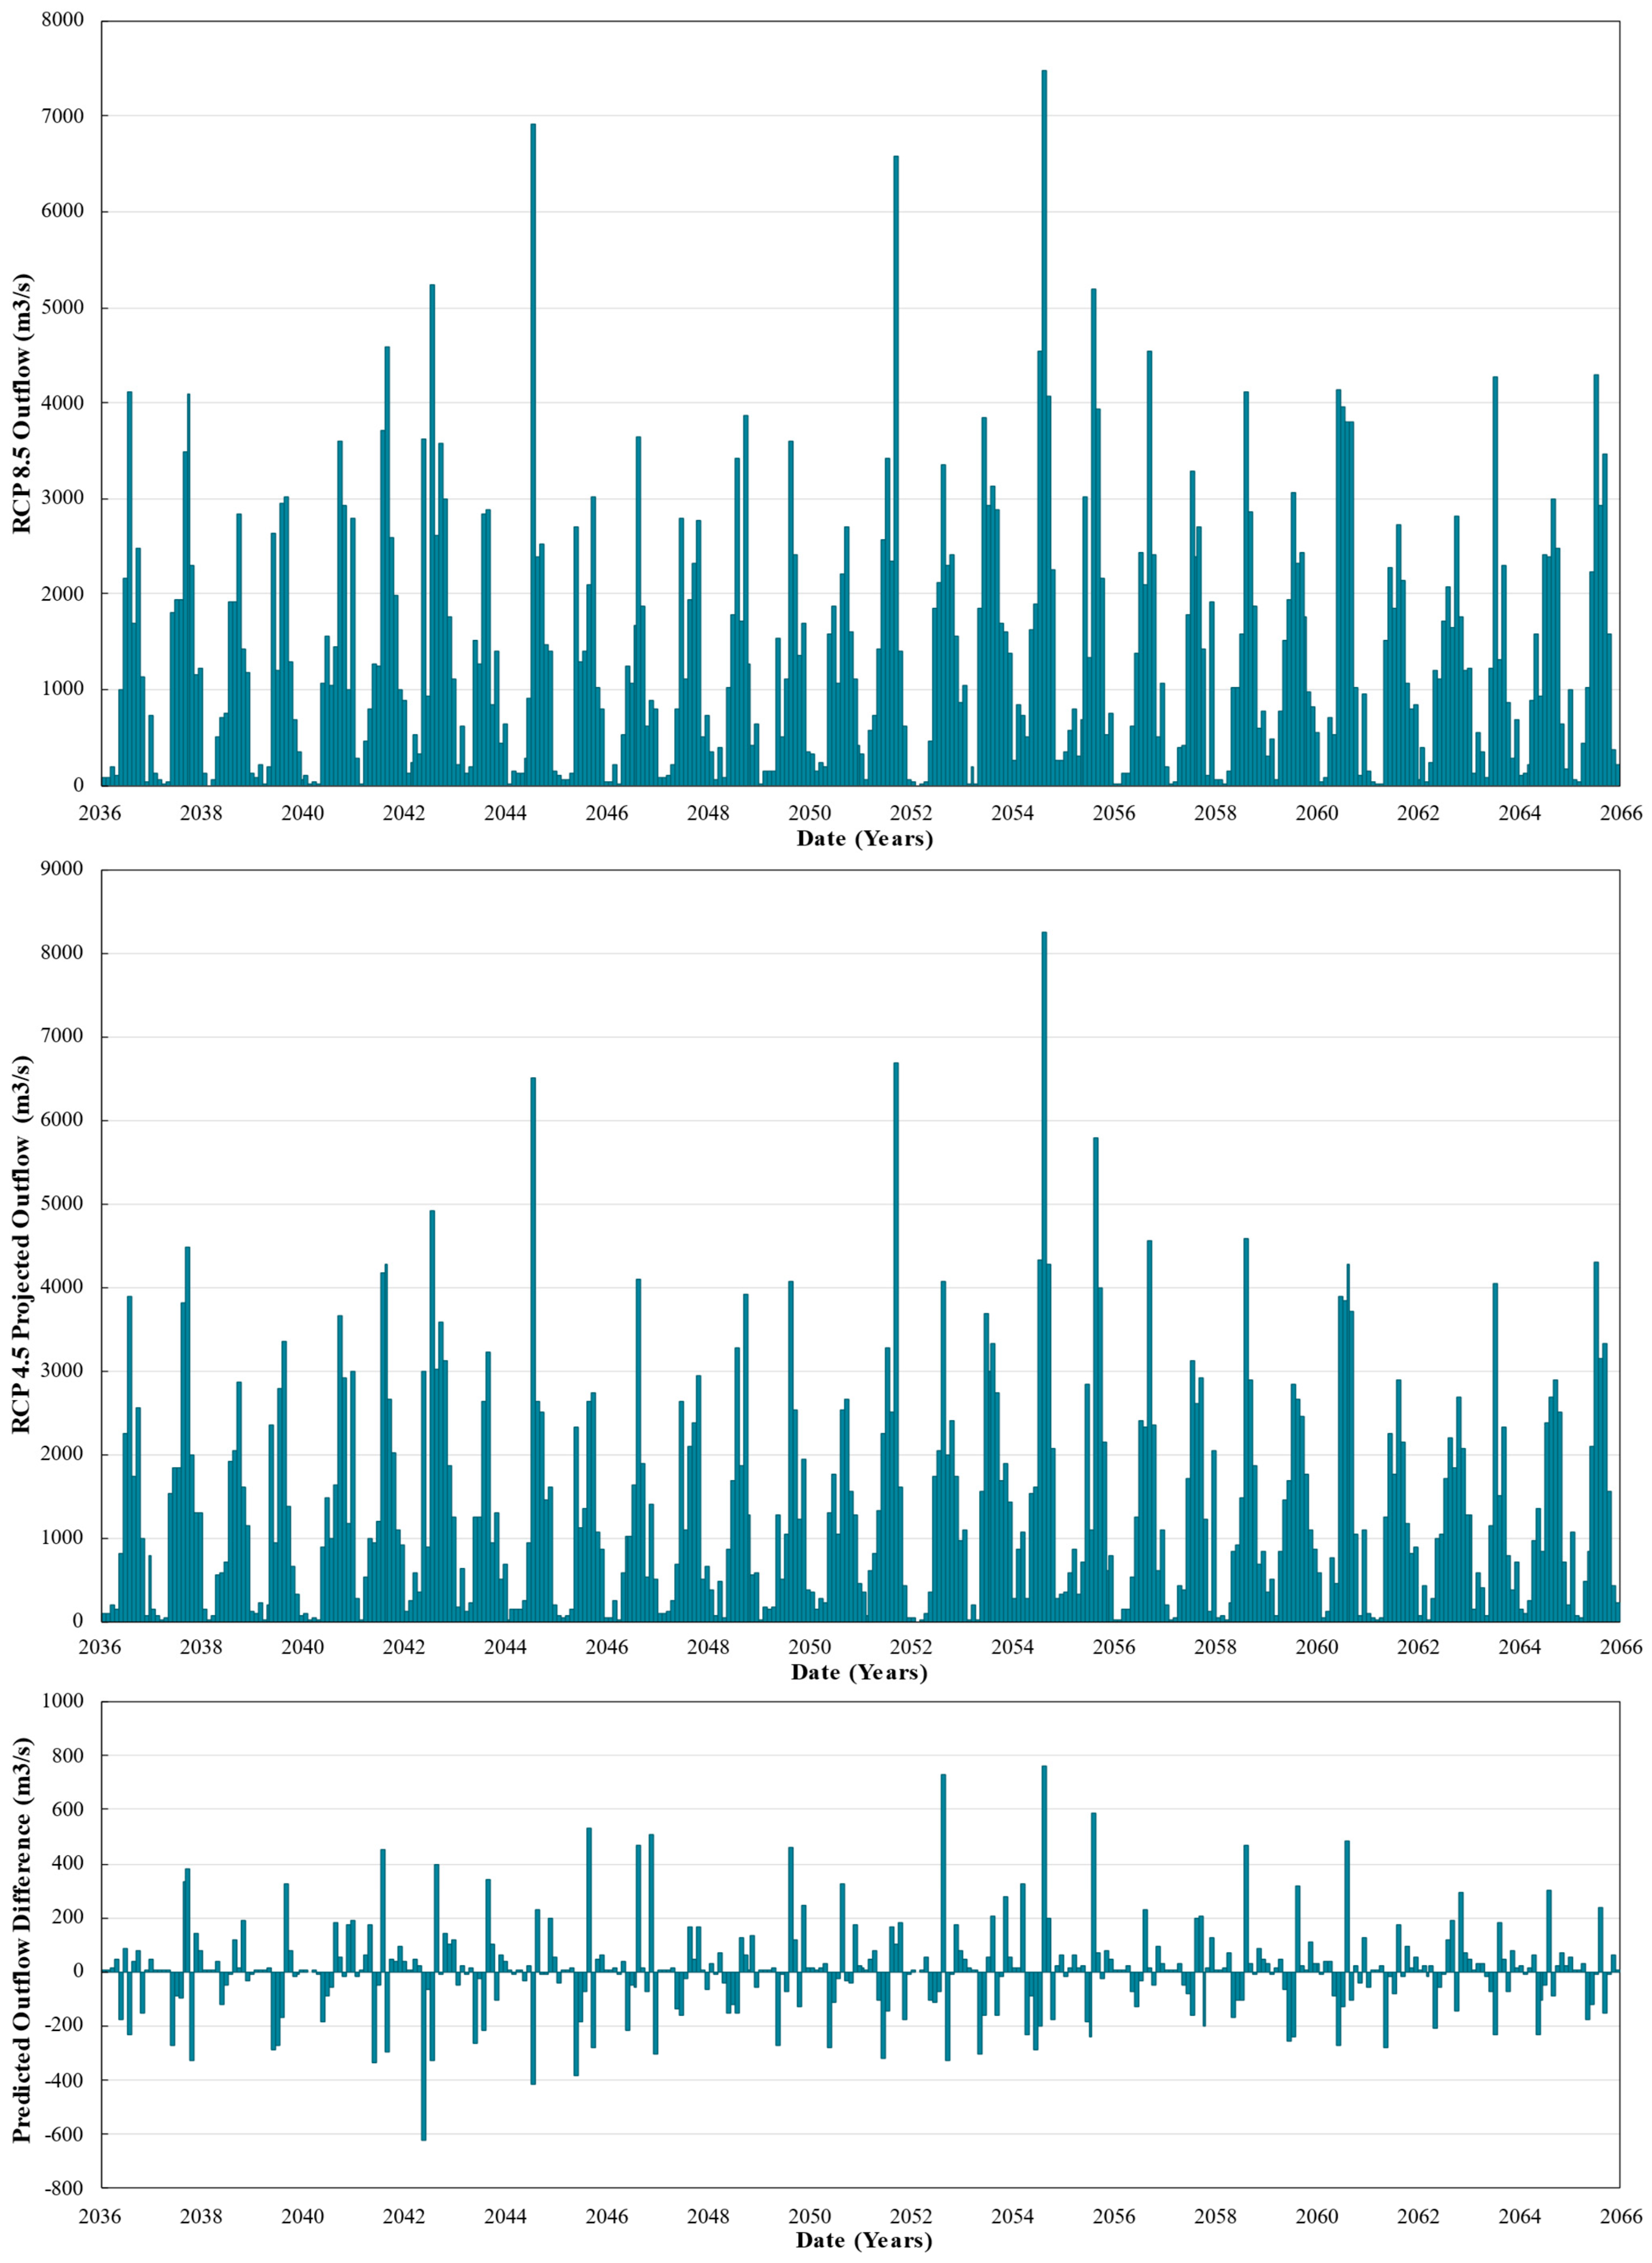
The simulated hydrographs for the projected period (2036–2065), as shown in
Figure 7, reflect noticeable shifts in the Angat watershed’s hydrological behavior under climate change conditions. The 30-year total outflows, summarized in
Table 4, indicate significant variation in projected discharge levels under both RCP 8.5 and RCP 4.5 scenarios, with important implications for future water resource management.
Under the RCP 8.5 high-emission scenario, the watershed is projected to experience substantial reductions in monthly outflows, particularly during the traditionally wet months. July and August, typically peak discharge months, show projected outflows of 82,830.00 m3/s and 87,083.10 m3/s, respectively, representing declines of −18.362% and −18.244% compared to historical peaks. June also follows this trend with a −17.916% reduction. These significant reductions suggest that even during periods of high rainfall, the watershed’s runoff response may be diminished—potentially due to altered rainfall intensity–duration patterns or increased evapotranspiration. This could severely affect the ability of the Angat Dam to capture and store adequate water for distribution in the succeeding dry months.
In contrast, under the RCP 4.5 moderate-emission scenario, the projections indicate a more favorable outlook, especially during the wet season. For instance, August outflow is expected to reach 97,355.17 m3/s, which is 8.986% higher than historical records. Similarly, September and October are also projected to exceed historical values by 8.986%, suggesting more intense and possibly more frequent runoff events during these months. This pattern points to a more robust wet season, albeit with possible implications for increased flood risk and a need for adaptive reservoir operation rules to capture excess inflow efficiently.
During the transitional and dry season months, RCP 8.5 continues to project negative deviations. March to May show consistent decreases in outflow (ranging from −6.779% to −6.923%), highlighting concerns over early season water availability. November and December also show reductions of around −9% to −2%, further stressing the challenge of building up storage ahead of the dry months. Conversely, RCP 4.5 projects minimal to moderate increases during these periods. Notably, May under RCP 4.5 shows a dramatic increase of 26.244%, with a projected outflow of 31,461.81 m3/s, suggesting anomalous early-season rainfall or runoff that may assist in reservoir replenishment.
These comparative projections demonstrate that RCP 4.5 offers a relatively more optimistic outlook, with increased outflows across most months, especially from May to November, while RCP 8.5 presents a scenario of generalized decline, especially during the wet season, when water capture is most critical. The discrepancy in trends between the two RCPs emphasizes the uncertainty surrounding future climate impacts and the sensitivity of the Angat watershed to emission pathways.
The implications of these findings are far-reaching. Under RCP 8.5, the reduction in peak and transitional month outflows could undermine the watershed’s capacity to sustain municipal supply, agricultural irrigation, and hydropower generation. The reduced discharge during transitional months (e.g., March and April) would limit early reservoir replenishment opportunities and could complicate operational scheduling. Meanwhile, the potential increases in runoff under RCP 4.5 may require adjustments in dam operation rules to manage possible surplus inflows and ensure flood control without compromising dry season storage.
Furthermore, as shown in
Table 5, analysis of the average monthly differences in projected outflows between RCP 4.5 and RCP 8.5 reveals distinct seasonal patterns and notable variations across decades. The results indicate that during May to July, RCP 8.5 consistently projects higher outflows than RCP 4.5, suggesting an earlier onset and intensification of the wet season under a high-emission scenario. Conversely, August exhibits significantly higher outflows under RCP 4.5, indicating that peak flows may shift later in the season under moderate emissions. These differences are less pronounced during the dry months, where both scenarios show relatively smaller deviations. The presence of large negative differences in months like May highlights the potential for intensified runoff and early flood risks under RCP 8.5, while the positive differences in August under RCP 4.5 point to possible surges in inflows later in the wet season. Such shifts underscore the critical importance of adaptive water management strategies to accommodate changes not only in annual totals but also in the seasonal timing and magnitude of flows under future climate conditions.
These projections underscore the need to integrate scenario-based climate modeling into long-term hydrologic, reservoir, and infrastructure planning. Designing adaptive strategies that consider both emission trajectories will be essential to building resilient water resource systems capable of withstanding diverse and uncertain future climatic conditions.
3.3. Result of Statistical Analysis
A paired t-test was performed to compare historical and projected outflows, confirming significant reductions in discharge under future climate scenarios. Under RCP 8.5, the analysis yielded a mean difference of −6.51 m
3/s, with a
p-value of 7.28 × 10
−22, indicating that the observed changes in outflows are statistically significant. Similarly, under RCP 4.5, the mean difference was −6.28 m
3/s, with a
p-value effectively equal to zero, further confirming significant projected reductions in reservoir outflows relative to historical conditions (
Table 6).
The wet season exhibited the most pronounced declines, with July, August, and September showing reductions of −18.36%, −18.24%, and −17.92%, respectively. These reductions align with the monthly outflow projections in
Table 4, which reveal consistent decreases across all months compared to historical averages.
The statistical results summarized in
Table 6 confirm a significant shift in discharge behavior under both moderate and high emission scenarios, highlighting the potential impacts of climate change on regional hydrology. While
Figure 5 and
Figure 6 present historical hydrograph patterns and the relationship between rainfall and runoff, they underscore the watershed’s strong dependence on seasonal precipitation, helping contextualize the magnitude of projected changes. The reductions in wet-season outflows, combined with increased variability in the dry season, emphasize the critical role of seasonal rainfall in sustaining water availability.
These findings underscore the urgency of integrating climate resilience into water resource management and policy planning for the Angat Reservoir, considering both moderate and extreme climate futures to ensure robust and adaptive strategies.
4. Discussion
The results presented in
Section 3 underscore the substantial influence of climate change on rainfall dynamics and reservoir inflows within the Angat watershed. Historical observations from 1994 to 2023 confirm a strong seasonal rainfall pattern, with peak inflows typically occurring between July and September. To project future hydrologic responses, this study employed rainfall data from the Philippine Atmospheric, Geophysical and Astronomical Services Administration (PAGASA), which provides statistically downscaled and validated climate projections based on selected CMIP5 General Circulation Models under the RCP8.5 scenario. These projections, which reflect regionally calibrated climatic conditions, served as the primary inputs to the hydrologic model used to simulate watershed outflows for the 2036–2065 period.
The simulations indicate significant declines in wet-season precipitation, leading to reductions in reservoir outflows of up to 18% during key recharge months. This projected decrease is particularly critical, as it coincides with the monsoon season that historically sustains the reservoir’s water levels. Statistical analysis using a paired t-test revealed a significant difference (p < 0.05) between historical and future monthly outflows, highlighting the potential long-term vulnerability of the Angat Reservoir to climate-induced hydrologic shifts. These findings not only reinforce the importance of integrating climate projections into reservoir operation and planning but also provide a basis for comparison with existing studies on regional water security and climate resilience.
4.1. Comparison with Existing Studies
The findings of this study are consistent with several previous studies focused on water availability, reservoir dynamics, and climate variability in the Angat watershed. However, this study contributes a longer-term, climate scenario-driven perspective using a physically based model (HEC-HMS), which complements the predominantly short-term and statistical modeling approaches used in earlier works.
Juanillo (2011) provided one of the earliest empirical assessments of Angat Dam’s vulnerability during the 1997–1998 El Niño event [
38]. The dam’s output was reduced from 37 m
3/s to 22 m
3/s, which forced the implementation of water rationing in Metro Manila and triggered increased groundwater extraction. This historical observation supports the present study’s projected increase in dry-season risk and reduction in reservoir outflows under prolonged dry periods. Juanillo’s analysis demonstrates how climate anomalies translate into service-level crises, validating the practical relevance of simulated low-flow events in this research [
38].
In contrast, Elizaga et al. (2014) developed a short-term inflow forecasting model using exponential smoothing and artificial neural networks (ANN) [
29]. While they achieved high predictive accuracy (correlation coefficient r = 0.959), their method focused solely on 24 h inflow forecasting for operational planning. Their model lacked the ability to simulate responses to future climate scenarios or long-term rainfall variability. The present study addresses this gap by integrating downscaled climate projections under RCP8.5 to assess decadal-scale inflow variability and reservoir behavior [
29].
Similarly, Tejada et al. (2023) employed a Seasonal ARIMA (SARIMA) model to forecast monthly water levels in Angat Dam using historical observations from 1990 to 2021 [
30]. Their analysis confirmed seasonal patterns and emphasized sharp declines during the dry months. While their findings are consistent with the current study’s seasonal outflow trends, the SARIMA model is purely statistical and does not incorporate climate projection inputs. Thus, while useful for short- to mid-term forecasting, it cannot assess the influence of greenhouse gas-driven climate change on water availability [
30].
Ibañez et al. (2022) applied deep learning models—specifically Long Short-Term Memory (LSTM) and Deep Neural Networks (DNN)—to forecast water levels up to 180 days in advance [
31]. Their models integrated meteorological data, such as rainfall and the Oceanic Niño Index, and achieved a mean absolute error (MAE) of 6.7 m. This machine learning approach offers precision and adaptability but functions as a black box without physical representation of watershed processes. The present study complements such work by using HEC-HMS to explicitly simulate rainfall–runoff mechanisms, thus providing not only forecasted values but also interpretable hydrological behavior under changing climate inputs [
31].
The most relevant large-scale climate comparison comes from Tejada et al. (2023), whose spatiotemporal analysis of extreme rainfall and drought in the Philippines revealed intensified seasonal variability [
30,
39]. Their work documented up to 33-month meteorological droughts in the Angat watershed and rainfall reductions exceeding 60% during strong El Niño events. These findings align with the dry-season inflow vulnerabilities highlighted in this study and reinforce the need to incorporate ENSO-related rainfall anomalies into future water security planning [
30,
39].
Taken together, these studies establish a consistent narrative: Angat Dam is highly sensitive to rainfall variability and climate extremes. However, prior research has largely focused on short-term forecasts, historical event analyses, or statistical time-series modeling. In contrast, the current study uniquely integrates physically based rainfall–runoff simulation (HEC-HMS) with RCP-based climate projections, offering a long-term, process-based, and scenario-driven evaluation of water availability. The results not only confirm earlier findings but also expand on them by quantifying future risks and enabling adaptive water management strategies.
A comparative overview of these studies is summarized in
Table 7, highlighting differences in modeling approaches, time scales, and key findings relative to the present work.
4.2. Implications for Water Security
The projected changes in rainfall patterns present both challenges and opportunities for water security in Metro Manila and neighboring provinces. While reductions in wet-season inflows may appear concerning, particularly for reservoir replenishment, they may also result in lower flood risks during intense monsoon periods—representing a potential positive outcome of climate change. Retention reservoirs like Angat are specifically designed to buffer seasonal fluctuations, storing excess wet-season runoff for use during drier months. The more pressing concern lies in the observed and projected decline in inflows during the dry season, when rainfall is already limited and water demand remains high. This increased frequency of low-flow days during critical supply periods could intensify supply stress and warrants proactive management strategies. This concern is not merely theoretical. The 2019 Metro Manila water crisis serves as a cautionary example of what can occur when structural, environmental, and governance vulnerabilities converge. The crisis, which emerged in March 2019, stemmed from both El Niño-induced rainfall deficits and long-standing infrastructural challenges, such as delays in raw water source development, ambiguities in water concession agreements, and misalignments between public–private sector operations [
40,
41]. While the privatization of the Metropolitan Waterworks and Sewerage System (MWSS) in 1997 was intended to improve efficiency and service delivery, it resulted in mixed outcomes. On one hand, access to water services expanded; on the other, tariff increases, service inconsistencies, and the exclusion of marginalized communities revealed persistent governance gaps [
42]. In response to these failures, community-led initiatives—especially in poorer areas—emerged to fill service gaps. Notably, community-based water cooperatives stepped in to manage water provisioning; however, these groups also faced challenges related to governance capacity and financial sustainability [
42]. The experience of 2019 demonstrated that climate shocks like El Niño can expose and intensify existing structural vulnerabilities, making the case for a resilient, diversified, and climate-adaptive water strategy all the more urgent.
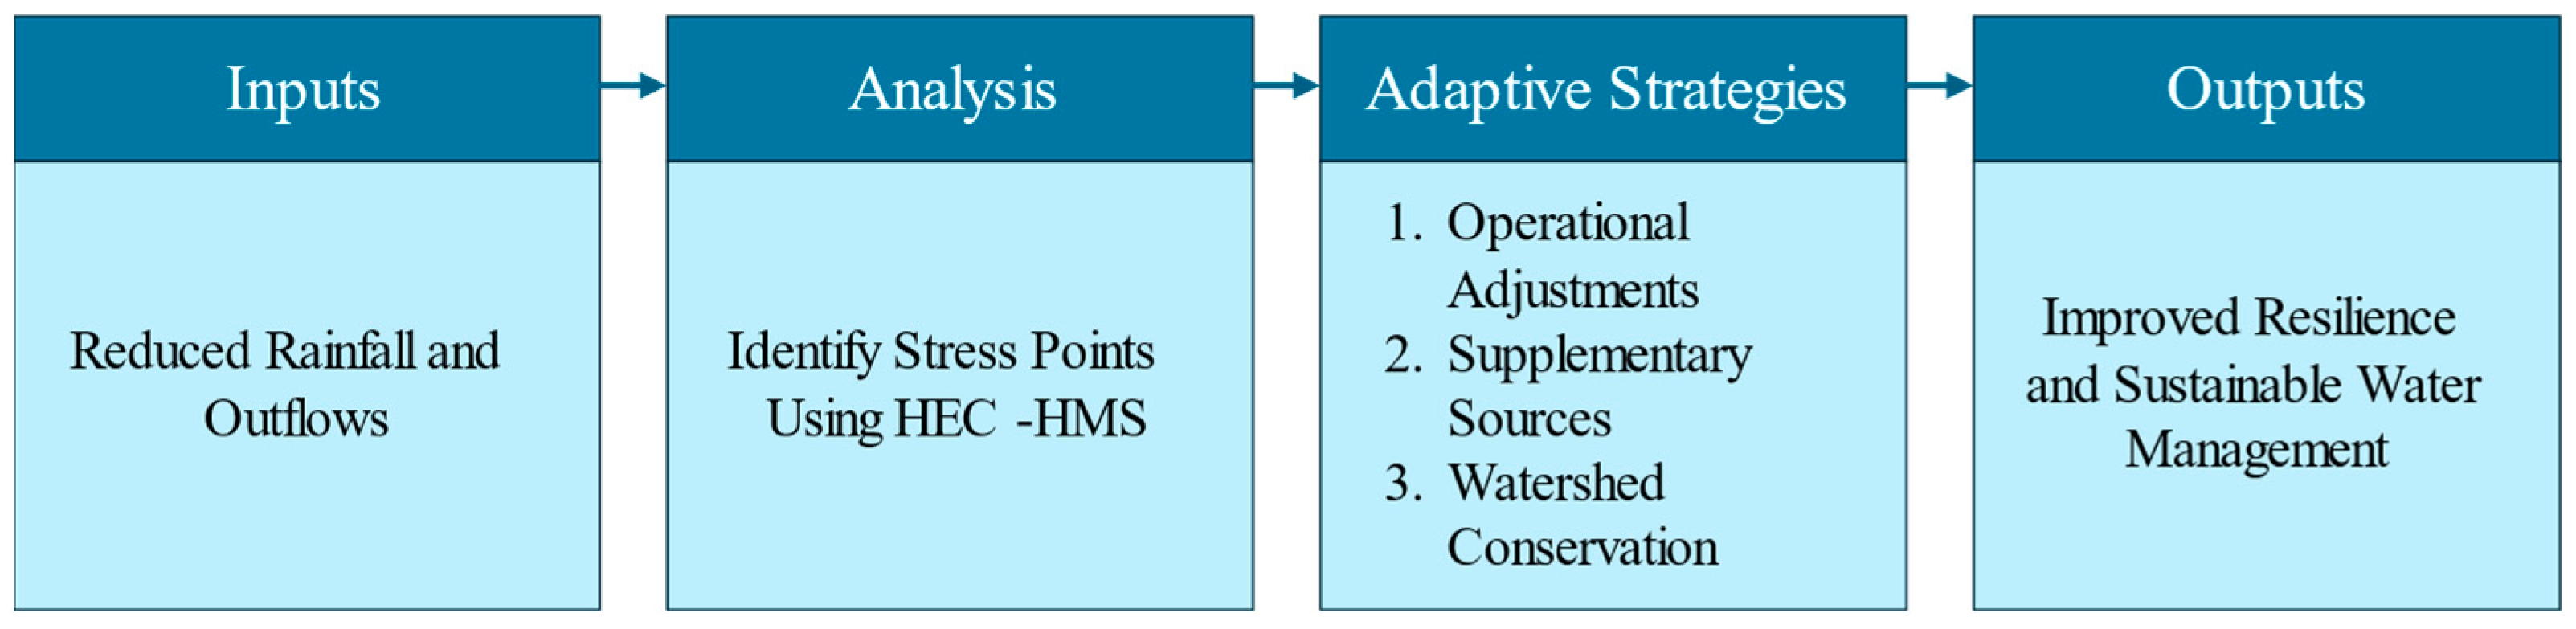
To mitigate these risks, adaptive reservoir management strategies must be prioritized to ensure the sustainable use of water resources.
Figure 8 presents a sample workflow of adaptive reservoir management strategies for the Angat watershed. Climate projections and hydrological modeling results, such as those from this study, can serve as key inputs for optimizing reservoir operations. For instance, during wet-season months, when inflows are highest, water storage must be maximized to secure reserves for drier periods. Similarly, controlled releases during the dry season can help manage supply without exacerbating shortages.
Beyond operational strategies, long-term water security depends on diversifying sources and enhancing watershed resilience. Investments in supplementary water supply systems, such as desalination, rainwater harvesting, and managed aquifer recharge, are crucial in reducing overreliance on a single reservoir system. Equally important are nature-based solutions—notably reforestation and watershed conservation. In this regard, the National Greening Program (NGP) of the Philippines offers valuable insights. As the country’s most extensive reforestation initiative, the NGP has aimed to combat climate change and promote environmental sustainability by increasing vegetation cover across priority watersheds. Its implementation in the Angat watershed, managed by the National Power Corporation, has demonstrated positive results in reducing erosion and enhancing catchment resilience [
43,
44]. Broader success stories in areas like Zambales and Northern Isabela, where vegetation density and species survival rates have improved, underscore the program’s ecological benefits [
45].
However, challenges remain. While the NGP has contributed to modest improvements in household income and occupational skills, socioeconomic gains have been uneven across regions [
46]. The program’s long-term effectiveness depends on addressing coordination issues, establishing dedicated forest management units, and embedding sustainable livelihood components that ensure community buy-in. Furthermore, the integration of local knowledge and community participation—as demonstrated in international watershed projects—remains essential for sustaining these gains [
47].
In sum, ensuring water security for Metro Manila under climate uncertainty will require a multi-pronged approach: climate-responsive reservoir operations, diversified water sources, strengthened reforestation programs, and inclusive governance reforms. The convergence of historical lessons, modeling projections, and nature-based solutions makes clear that a reactive approach is no longer sufficient. Systemic, forward-looking, and participatory planning is essential to protect one of the country’s most vital water supply systems.
It should be clarified, however, that in this study, the assumption of uniform monthly percentage changes for daily rainfall projections may oversimplify intramonthly variability, potentially affecting the accuracy of simulated hydrographs. Similarly, the reliance on a single climate scenario (RCP8.5) limits the scope of the analysis, as alternative pathways may produce different results. Future research should address these limitations by incorporating multiple climate scenarios (e.g., RCP6.0) to provide a broader range of potential outcomes. The use of advanced statistical downscaling models (e.g., SDSM) or machine learning approaches could improve the resolution and accuracy of daily rainfall projections. Additionally, expanding the hydrological model to include other parameters, such as evapotranspiration and soil moisture, would enhance the robustness of simulations and provide a more comprehensive understanding of the watershed’s response to climate change.
5. Conclusions
This study highlights the substantial impacts of climate change on the hydrologic regime of the Angat watershed and its implications for sustainable water resource management. Using downscaled and validated climate projections from PAGASA as inputs into HEC-HMS hydrologic modeling, the analysis reveals that future rainfall patterns—particularly under the high-emission RCP 8.5 scenario—are likely to result in significant reductions in wet-season precipitation and corresponding declines in reservoir outflows. Specifically, projected outflows during peak recharge months such as July and August may decrease by up to 18%, posing a critical challenge to the Angat Reservoir’s ability to meet competing water demands for domestic supply, irrigation, and hydropower generation.
The findings emphasize that the watershed’s vulnerability stems not only from reduced rainfall volumes during the wet season but also from the increased frequency of low-flow days during the dry months. This dual stressor could significantly disrupt reservoir operations, especially during periods of high demand. The observed variability in rainfall intensity and timing suggests a future hydrologic regime characterized by less predictable inflow behavior, necessitating more dynamic and adaptive management responses.
The study also underscores the statistical significance of the projected hydrologic changes. A paired t-test between historical and projected reservoir outflows confirms a mean difference of −6.51 m3/s and −6.281 m3/s, with a p-value of 7.28 × 10⁻²² and 0.000 for RCP 8.5 and 4.5, respectively, indicating a robust and statistically significant trend. These quantitative findings provide evidence-based support for integrating climate projections into long-term reservoir planning and policy formulation.
Given these anticipated shifts in hydrologic conditions, there is an urgent need to transition toward more sustainable and climate-resilient reservoir operations. Adaptive management strategies should include the revision of reservoir rule curves, real-time inflow forecasting, flexible water allocation protocols, and the promotion of demand-side water conservation measures. Infrastructural improvements—such as enhancing storage capacity, integrating auxiliary reservoirs, or optimizing spillway operations—should also be explored to increase the system’s resilience.
Furthermore, the study identifies areas for continued research. Future work should prioritize the refinement of model inputs through the integration of more localized climate projections and land use data. Expanding uncertainty analyses by incorporating multi-model ensembles and different emission scenarios will improve the robustness of planning outputs. Additionally, exploring alternative reservoir operation scenarios and conducting multi-objective optimization analyses can help identify strategies that balance competing water uses under dynamic climate conditions.
In conclusion, the Angat watershed is demonstrably vulnerable to future climate change, and proactive, science-informed adaptation is necessary to safeguard its role in regional water security. This study serves as a foundation for informed decision-making and reinforces the need for integrated water resources management that is flexible, forward-looking, and resilient to climatic uncertainties.


