Article

Controlling Factors of Spatiotemporal Variations in Transpiration on a Larch Plantation Hillslope in Northwest China

1
Key Laboratory of Forest Ecology and Environment of National Forestry and Grassland Administration, Ecology and Nature Conservation Institute, Chinese Academy of Forestry, Beijing 100091, China
2
School of Soil and Water Conservation, Beijing Forestry University, Beijing 100083, China
3
School of Landscape and Ecological Engineering, Hebei University of Engineering, Handan 056038, China
4
Shaanxi Forestry Survey and Planning Institute, Xi’an 710082, China
*
Authors to whom correspondence should be addressed.
Water 2025, 17(12), 1756; https://doi.org/10.3390/w17121756
Submission received: 9 April 2025 / Revised: 8 June 2025 / Accepted: 10 June 2025 / Published: 11 June 2025
(This article belongs to the Section Ecohydrology)

Abstract

:
Clarifying spatiotemporal variations in transpiration and their influencing mechanisms is highly valuable for the accurate assessment of hillslope-scale transpiration and for the effective management of forest–water coordination. Here, the sap flow density, meteorological conditions, and soil moisture downslope and upslope of a Larix gmelinii var. principis-rupprechtii plantation hillslope were observed during the growing season (June to September) in 2023, China. The results revealed that transpiration per unit leaf area (TL) was significantly lower at the upslope position than at the downslope position, with mean values of 0.21 and 0.31 mm·d−1, respectively; these data were associated with the lower canopy conductance per unit leaf area induced by the higher vapor pressure deficit (VPD) and lower soil water content at the 40–60 cm soil depth at the upslope position. The temporal variations in the TL were controlled by solar radiation, VPD, air temperature, and soil moisture at both slope positions, and the quantitative relationships established from these factors explained 89% of the variation in the TL. The slope position did not affect the response functions between the TL and the controlling factors but changed the contribution to the TL. Compared with those at the downslope position, the contributions from solar radiation and VPD (air temperature) decreased (increased) at the upslope position, and the contribution of soil moisture was essentially similar at both slope positions. Transpiration mainly utilized water from the 20–60 cm soil depth; these results indicated that the soil water content at the 20–40 and 40–60 cm soil depths contributed more to the TL than did that at the 0–20 cm soil depth. Based on our findings, changes in the environmental conditions caused by slope position have a critical impact on transpiration and can contribute to the development of hillslope-scale transpiration estimates and precise integrated forest and water management.

1. Introduction

In water-limited areas, large-scale afforestation initiatives have been extensively implemented as a strategic approach to ecological restoration, particularly in China. However, the sustainability of such efforts is significantly constrained by limited water availability, which is insufficient to maintain the healthy growth and long-term survival of afforested trees [1,2], and vegetation restoration has approached the carrying capacity of water resources on the Loess Plateau of China [3]. Therefore, forest and water management needs to be performed on the basis of the understanding of the forest–water relationship [4]. However, previous studies have focused more on the theoretical basis and technological development of forest water management at the stand/plot scale without considering the impact of topography [5]. In practice, most afforestation activities are carried out along hillslopes to reduce soil erosion; however, slope topography (e.g., slope position) affects not only the distribution of vegetation structure but also a series of hydrological processes by altering micrometeorology and soil water availability [6,7,8]. Transpiration is the main pathway of forest water loss and varies at different slope positions [8,9,10]; this inevitably affects the pattern of water redistribution along hillslopes. Thus, an in-depth understanding of the spatiotemporal variations in forest transpiration along hillslopes is highly valuable for the development of precise integrated forest and water management measures at the hillslope scale.
In terms of temporal dynamics, meteorological conditions and soil moisture are the major drivers of transpiration among a series of environmental factors [11,12]. Several studies have reported that vapor pressure deficit (VPD) and solar radiation are the major factors driving transpiration in many coniferous and broad-leaved forests [13,14]. In water-limited areas, soil moisture plays an important role in controlling transpiration and even limits the response of transpiration to VPD [15]. However, the role of environmental factors in controlling transpiration may vary with different hydrothermal conditions. For example, transpiration in Robinia pseudoacacia L. plantations is more strongly related to meteorological conditions at subhumid sites than at semiarid sites [16]; Chen et al. [17] reported that the main controlling factors affecting transpiration varied under different environmental conditions (i.e., various VPDs and soil moisture levels). Moreover, the effect of the soil water content on transpiration depends on the soil moisture. When soil moisture is adequate, changes in water content have little impact on transpiration; however, under insufficient moisture conditions, variations in soil water content significantly influence transpiration [18]. Owing to the impacts of topographic shading and water redistribution, hydrothermal conditions (e.g., solar radiation, VPD, and soil moisture) vary at different slope positions [7,19,20]. However, whether the effects of these factors on transpiration and their contributions vary with slope position remain unclear.
Stand transpiration varies at different slope positions due to differences in sapwood area [8]. However, since leaf area is linearly correlated with sapwood area [21], the slope differences in transpiration per unit leaf area are generally influenced mainly by environmental conditions and species-specific physiological adaptations. However, findings on the dominant factors of transpiration along hillslopes are diverse. For example, Liu et al. [22] reported that differences in transpiration along hillslopes are driven by soil moisture. Mitchell et al. [23] reported that atmospheric demand is the major determinant of transpiration distribution along hillslopes, whereas some studies reported that transpiration differences across slope positions are associated primarily with variations in canopy conductance. As reported by Kumagai et al. [9], the greater transpiration at downslope positions can be attributed to differential responses of canopy conductance to VPD between the upslope and downslope positions. Consequently, more studies are clearly needed to rigorously examine the mechanisms of transpiration variation at hillslopes. Additionally, the factors dominating transpiration variations may differ in time and space and are rarely explored simultaneously.
As a major afforestation species in northern China, Larix gmelinii var. principis-rupprechtii (Mayr) (larch) plays an important role in the Three-North Shelterbelt Forest System—a large-scale ecological program launched in 1978 to combat desertification, soil erosion, and sandstorms across the northwestern, northern, and northeastern regions [24]. In the Liupan Mountains, larch plantations currently cover more than 60,000 ha and are distributed mainly on hillslopes. Higher stand densities, coupled with limited water resources, lead to prominent forest–water conflicts and require forest water management at the hillslope scale. Previous studies have shown that soil moisture and solar radiation vary along hillslopes in the Liupan Mountains; these factors might affect the slope variation in transpiration [25,26]. Therefore, clarifying the spatiotemporal variations in transpiration and their controls on hillslopes is crucial for the scientific development of forest water management decisions. The aims of this study are to (1) clarify the spatiotemporal variations in transpiration per unit leaf area (TL) on a hillslope, (2) identify the key biophysical and environmental drivers of variations in TL induced by topographic positions, and (3) quantify the impact of environmental factors on the temporal variation in TL across slope positions.

2. Materials and Methods

2.1. Study Site

This study was conducted in the Xiangshui small watershed (XSW, 106°12′–106°16′ E, 35°27′–35°33′ N; 2010–2942 m a.s.l.), with an area of 43.7 km2, in the Liupan Mountains in the Ningxia Hui Autonomous Region. The mean temperature and mean annual precipitation are 5.8 °C and 618 mm (1981–2010), respectively, indicating a semihumid climate [4]. The main tree species in the XSW include Larix gmelinii var. principis-rupprechtii, Pinus tabuliformis Carrière, Pinus armandii Franch., Quercus liaotungensis Koidz., Betula albosinensis Burkill, and Betula platyphylla Sukaczev. Larix gmelinii var. principis-rupprechtii is the main plantation species and accounts for more than 90% of the plantation area. The major soil type is haplic greyxems [4].
In the XSW, a southeast-oriented hillslope with an even-aged 42-year-old larch pure plantation was selected (Figure 1), and a 900 m2 plot was set up downslope (1106°13′30″ E, 35°30′50″ N) and upslope (106°13′14″ E, 35°30′49″ N). The elevations of the two plots are 2279 and 2472 m a.s.l., respectively, and the horizontal distance between the two plots is approximately 400 m. The upslope plot is close to the hilltop/ridge, whereas the downslope plot is located at the toe of the slope, approximately 50 m from the stream. The understorey vegetation of the two plots mainly consisted of Cotoneaster zabelii C. K. Schneid., Viburnum mongolicum (Pall.) Rehder, Fargesia spathacea Franch., and Fragaria orientalis Losinsk. Information on the stand and soil characteristics of the two plots is listed in Table 1. Measurements were carried out during the main growing season (1 June to 30 September) of 2023, lasting 122 days, during which the total precipitation was 301 mm.

2.2. Meteorological and Soil Moisture Measurements

One all-in-one weather sensor (ATMOS 41, Metre, Pullman, WA, USA) was set up above the stand at each slope position to monitor the meteorological conditions at the downslope and upslope positions. The height of the weather sensors from the ground level of the plots was approximately 22 m to avoid shading by the forest canopy. The observed meteorological indicators included air temperature (Ta, °C; range: −40 to +60 °C; accuracy: ±0.6 °C), relative air humidity (RH, %; range: 0–100%; accuracy: ±1.5% between 10–90% RH at 20 °C), solar radiation (Rs, w·m−2; range: 0–1750 w·m−2; accuracy: ±5% of measurement typical), and wind speed (m·s−1; range: 0–60 m·s−1; accuracy: ±0.3 m·s−1), and the data were recorded at 10 min intervals using a datalogger (CR1000X, Campbell, Logan, UT, USA). The vapor pressure deficit (VPD, kPa) was calculated using Ta and RH via the following equation:
V P D = 0.611 × ( 1 R H 100 ) × exp ( 17.502 T a T a + 240.97 )
Soil moisture probes (ML3, Delta-T Devices, Cambridge, UK) were deployed in each plot at the two slope positions to monitor the volumetric soil water content (SWC, %) in the 0–20, 20–40, and 40–60 cm soil layers, and the data were recorded at 10 min intervals using a datalogger (CR1000X).

2.3. Sap Flow Measurements and Transpiration Estimates

Six sample trees from each plot, for a total of twelve trees, were selected for the sap flow measurements, and their mean diameter at breast height (DBH) was close to the mean DBH of the sample plot (Table 2). The sap flux density of each tree at a 20 mm sapwood depth (Js0–20, g·cm−2·s−1; range: 0–0.083 g·cm−2·s−1; ±10% of measurement typical) was measured using a thermal dispersion probe with four 20 mm sensors named S0, S1, S2, and S3 (SF-L, Ecomatik, Dachau, Germany). The data were recorded at 10 min intervals using a datalogger (CR1000X). Js0–20 was calculated on the basis of the observed temperature difference via Baseline 3.0.7 software (Yavor Parashkevov, Duke University, Durham, NC, USA) using Granier’s original equation (Equation (2)) [27].
J s 0 20 = 0.0119 × ( T m T 1 ) 1.231
where ΔTm (°C) is the maximum temperature difference and ΔT (°C) is the actual temperature difference and is calculated using the following equation:
T = T 0 T 1 + T 2 2
where ΔT0 (°C) is the temperature difference between sensors S0 and S1, ΔT1 (°C) is the temperature difference between sensors S2 and S1, and ΔT2 (°C) is the temperature difference between sensors S3 and S1.
If the sapwood depth was greater than 20 mm, the sap flux density at the 20–40 mm sapwood depth (Js20–40, g·cm−2·s−1) was calculated using the relationship between Js0–20 and Js20–40 developed at this site by Tian et al. [25]. The sap flux density at the 0–40 mm sapwood depth (Js0–40, g·cm−2·s−1) was calculated using Equation (4). The sapwood depth of all the trees in the two plots did not exceed 40 mm. Additionally, a recent study in our XSW by Liu et al. [28] revealed that the use of six sample trees to estimate stand-scale sap flux density can be acceptable when the stand density of larch plantations is greater than 933 stem·ha−1. Thus, the sap flux density of the plot (Ja, g·cm−2·s−1) was estimated by the mean sap flux density of the sample trees.
J s 0 40 = A s 0 20 J s 0 20 + A s 20 40 J s 20 40 A s 0 20 + A s 20 40
where As0–20 (cm2) and As20–40 (cm2) are the sapwood areas at depths of 0–20 and 20–40 cm, respectively.
Canopy transpiration (T, mm·d−1) was calculated using the following equation:
T = 240 J a A s p A p
where Asp (cm2) is the total sapwood area of the plot; the sapwood area of each tree in the plot was extrapolated on the basis of the relationship between As and DBH (downslope: As = 1.2735DBH1.5806, R2 = 0.95, n = 20; upslope: As = 0.4644DBH1.9194, R2 = 0.97, n = 16); and Ap (m2) is the area of the plot.
In this study, the transpiration per unit leaf area (TL, mm·d−1) was used to compare the differences in transpiration rates among different slope positions, and interference from the stand structure was excluded [10]. TL was determined by dividing canopy transpiration by the leaf area index (LAI). The LAI (range: 0–10; accuracy: ±10% for an LAI < 6) was measured by a plant canopy analyzer (LAI-2200C, LI-COR, Lincoln, NE, USA). Fifteen fixed observation points in each plot were identified for the LAI measurements, and the measurements were collected every 7–15 days. The LAI of the plot was the average of the observed LAIs at the 15 points. The relationships between the observed plot LAI and the corresponding day of the year (DOY) (downslope: LAI = −2.224 × 10⁻⁴ DOY2 + 8.576 × 10⁻²DOY – 4.945, R2 = 0.88, n = 15; upslope: LAI = −2.357 × 10⁻⁴DOY2 + 9.306 × 10⁻²DOY – 5.251, R2 = 0.82, n = 15) were established for interpolation to estimate the daily LAIs at the downslope and upslope positions.
Accordingly, to further clarify the variations in canopy conductance at different slope positions, the canopy conductance per unit leaf area (GL, mm·s−1) was estimated using a simplified inverted Penman–Monteith equation [29]:
G L = K G T L V P D
where KG (kPa·m3·kg−1) is the conductance coefficient and is estimated using the relationship with the air temperature (KG = 115 + 0.4236Ta). The assumptions for applying this equation included the following: (1) VPD was close to the leaf-to-air VPD when the boundary layer conductance was high; (2) the vertical gradient of VPD within the canopy and water storage above the sap flow measurement point was negligible. A prior study at our study site indicated that the decoupling coefficient of Larix gmelinii var. principis-rupprechtii varied from 0.016 to 0.081 [30]; these results indicated that the canopy of this tree species was highly coupled to the atmosphere; thus, the GL could be estimated via Equation (6). Furthermore, to minimize relative errors (<10%), the periods within a day that satisfy VPD ≥ 0.6 kPa were filtered to calculate the daily mean GL [10,22].

2.4. Data Analysis

Paired samples t-tests performed with SPSS software (version 26.0, IBM SPSS, Chicago, IL, USA) were used to test for differences in the mean values of TL, GL, and environmental variables (Ta, Rs, VPD, and SWC) between the two slope positions [31,32,33]. The sensitivity of the GL to VPD was determined on the basis of a linear function between the GL and lnVPD [34]:
G L = G R m × l n V P D
where GR and m are the fitting parameters. GR denotes the potential reference value of GL at VPD = 1.0 kPa. m reflects the sensitivity of GL to VPD. Analysis of covariance (ANCOVA) performed with SPSS software (version 26.0) was used to determine the differences in GR and m between two slope positions.
The upper boundary line (UBL) method [35] was used to determine the response relationship of the TL to a single environmental variable. The specific method was as follows: first, the data of the TL response to environmental variables were divided into 5 or 6 segments on the basis of the variation range of the environmental variables; additionally, all data with TL values higher than the mean value plus one standard error in each segment were selected. The highest point was selected if no points existed that met this requirement in the segments with sparse points. If multiple points met this requirement within a segment, these points were averaged as the vertical coordinate points, and then the midpoint of each segment was used as the horizontal coordinate point. The line fitted based on these points represents the response relationship of the TL to a single environmental variable.
The general equation was developed on the basis of the modified Jarvis-Stewart (J-S) equation [36] to describe the coupled impact of controlling factors on TL across slope positions:
T L = f ( T a ) × f ( R s ) × f ( V P D ) × f S W C 0 20 + f S W C 20 40 + f ( S W C 40 60 )
where f(Ta), f(Rs), f(VPD), f(SWC0–20), f(SWC20–40), and f(SWC40–60) are the response relationships of the TL to Ta, Rs, VPD, and SWC at depths of 0–20 cm (SWC0–20), 20–40 cm (SWC20–40), and 40–60 cm (SWC40–60), respectively, as determined with the UBL method.
The relative contributions of the environmental variables to the TL were determined using the “relaimpo” package with the “lmg” function in R software (version 4.4.1) [37]. The “lmg” function, which is implemented in the relaimpo R package, quantifies the importance of each variable by averaging the incremental R2 contributions across all possible permutations of the order in which the variables are entered, in accordance with Shapley value principles [38]. This approach addresses multicollinearity issues by equitably distributing shared variance among correlated predictors.

3. Results

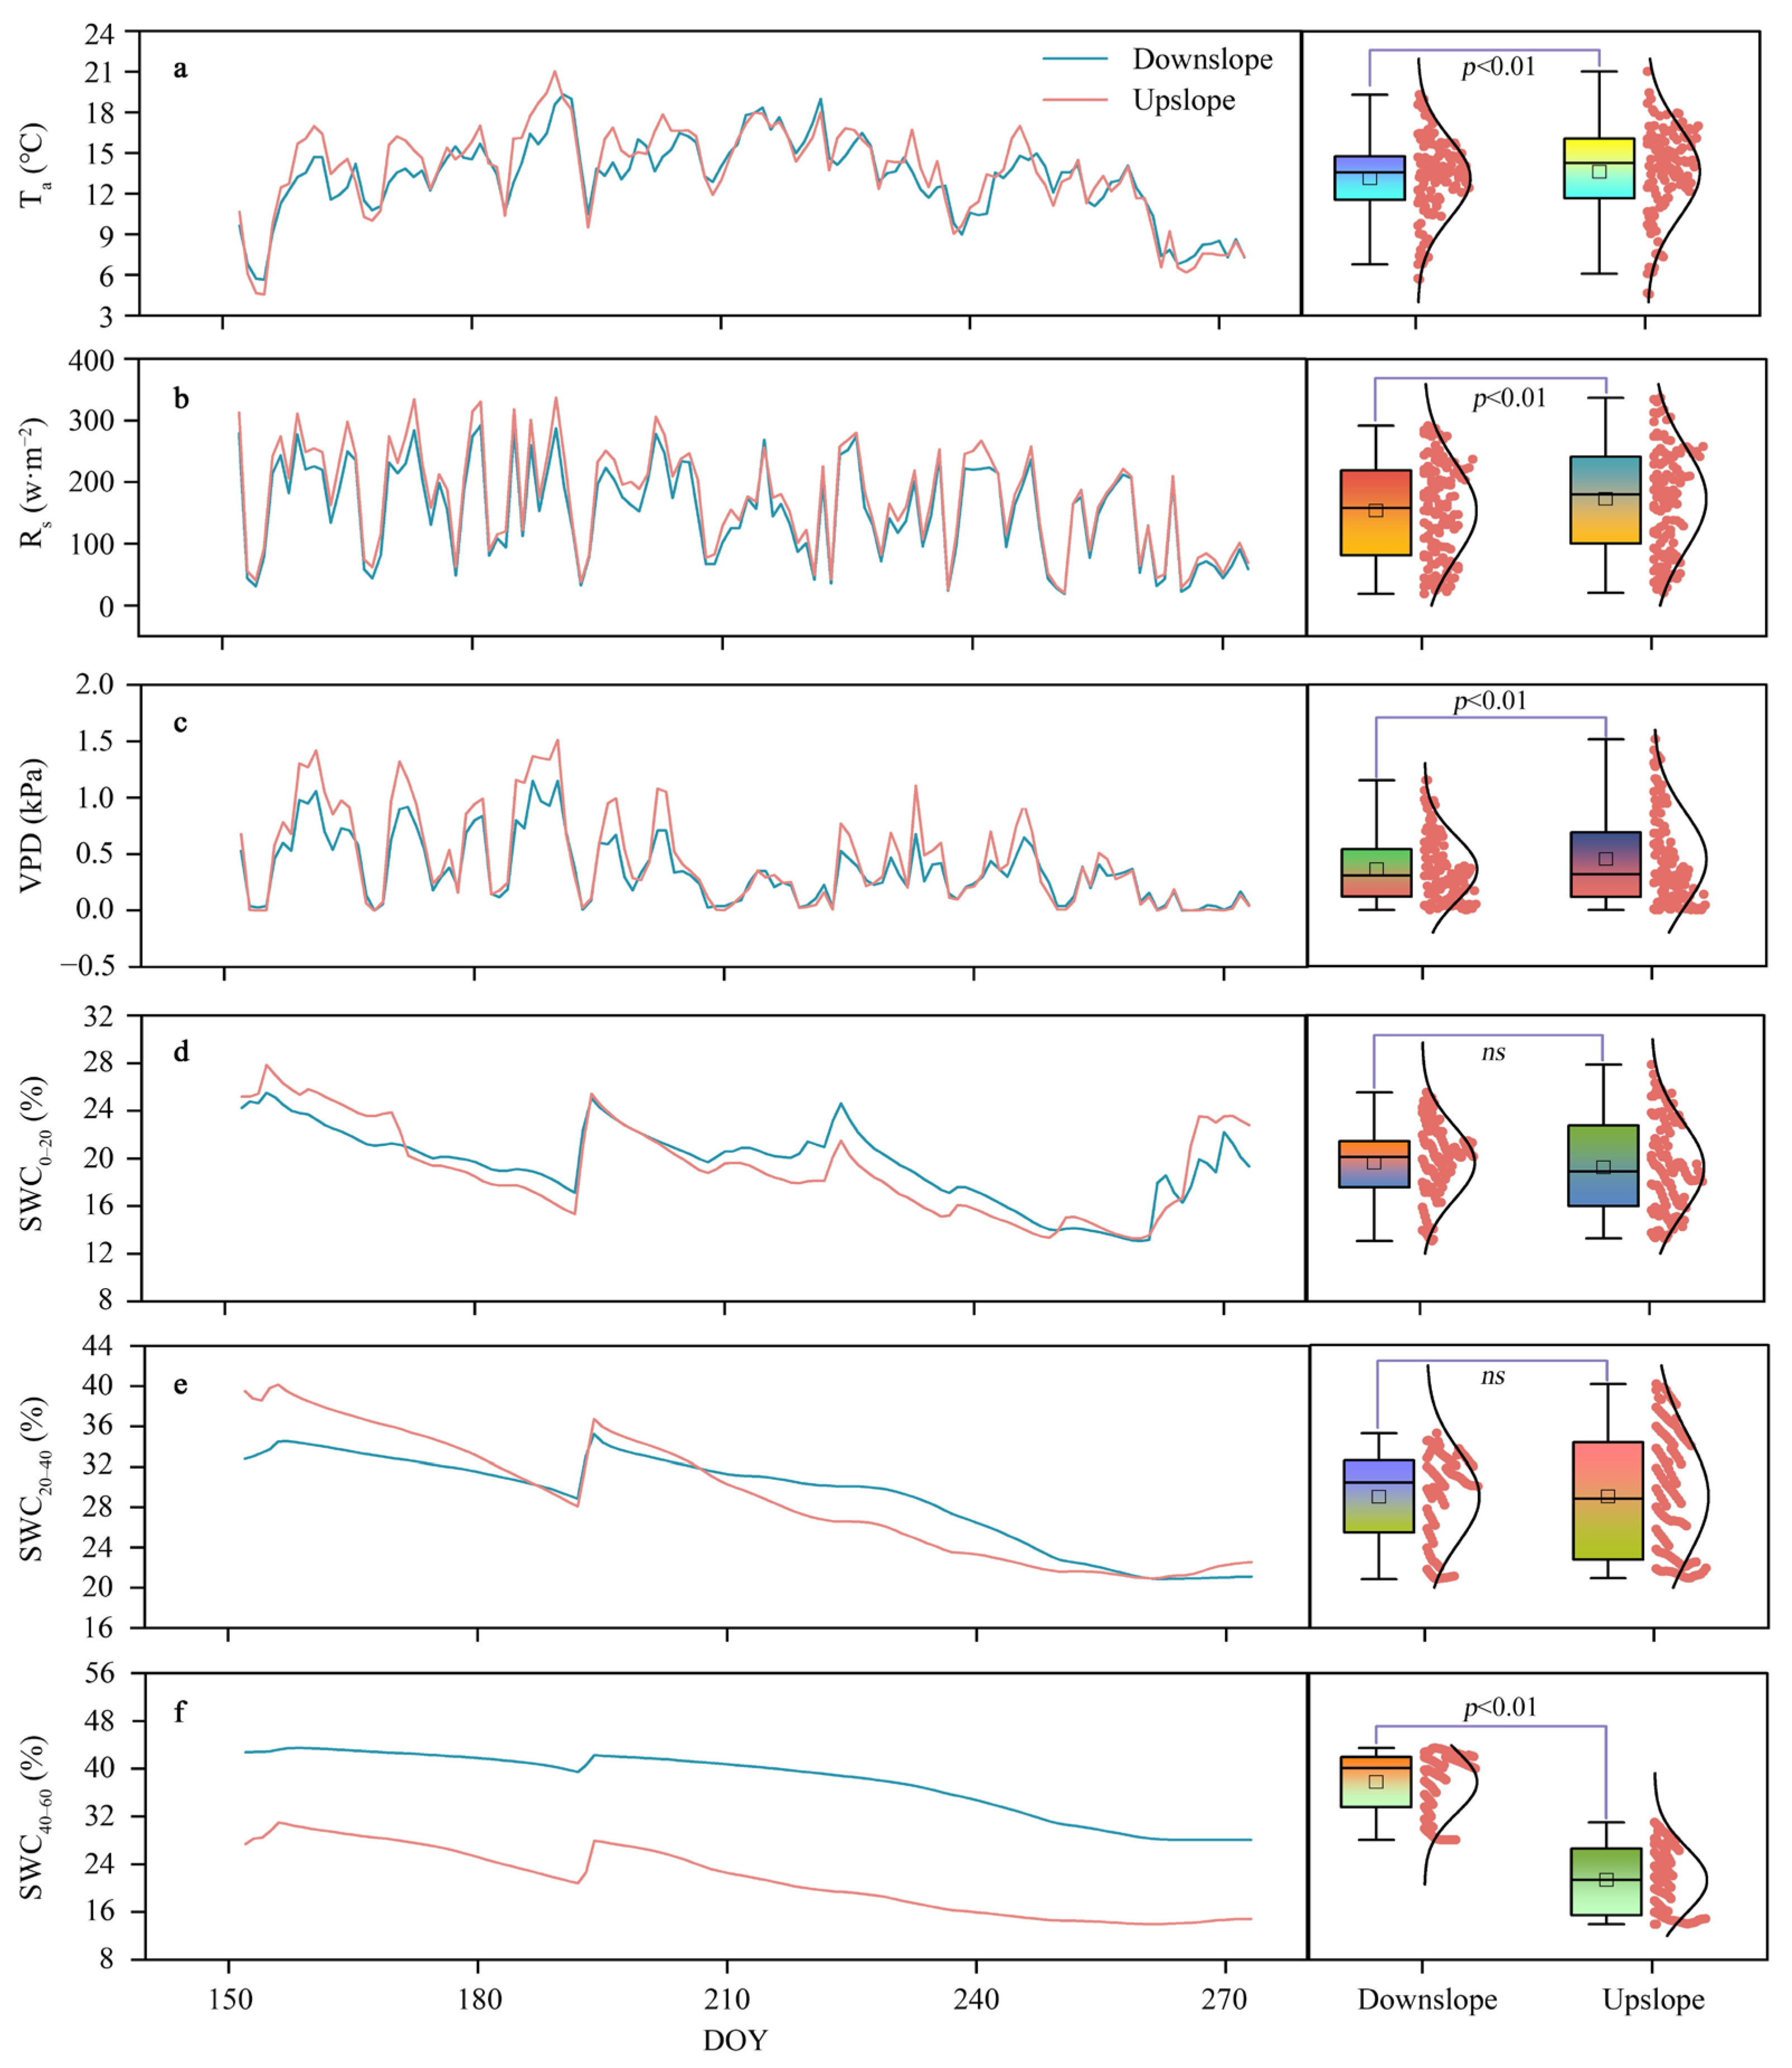
3.1. Variations in the Meteorological Conditions and Soil Moisture at the Two Slope Positions

During the study period, the daily mean Ta was significantly (p < 0.01) greater at the upslope position than at the downslope position. It varied from 4.6 to 21.0 °C and from 5.6 to 19.3 °C, with mean values of 13.6 and 13.2 °C, respectively. The coefficients of variation (CVs) of Ta at the upslope and downslope positions throughout the growing season were 0.25 and 0.23, respectively (Figure 2a).
The range variations (CVs) in daily mean Rs at the upslope and downslope positions were 20.6–337.1 w·m−2 (0.49) and 18.9–292.2 w·m−2 (0.50), respectively. Rs was significantly greater (p < 0.01) at the upslope position than at the downslope position, with mean values of 173.4 and 154.1 w·m−2, respectively (Figure 2b).
The daily mean VPD ranged from zero to 1.51 kPa and from zero to 1.15 kPa at the upslope and downslope positions, with CVs of 0.91 and 0.80, respectively. The VPD was significantly (p < 0.01) greater at the upslope position than at the downslope position, with mean values of 0.45 and 0.36 kPa, respectively (Figure 2c).
The mean values (range of variation) of the daily mean SWC at the upslope and downslope positions during the study period were 19.2% (13.3–27.9%) and 19.6% (13.1–25.5%) at the 0–20 cm soil depth, 29.1% (20.9–40.2%) and 29.0% (20.9–35.3%) at the 20–40 cm soil depth, and 21.4% (14.0–31.1%) and 37.8% (28.1–43.5%) at the 40–60 cm soil depth, respectively. The CVs of the SWC at the upslope and downslope positions were 0.20 and 0.16 at the 0–20 cm soil depth, 0.21 and 0.16 at the 20–40 cm soil depth, and 0.26 and 0.14 at the 0–20 cm soil depth, respectively. No significant difference was detected in the SWC between the upslope and downslope positions at the 0–20 and 20–40 cm soil depths, but a significant (p < 0.01) difference was detected at the 40–60 cm soil depth (Figure 2d–f).

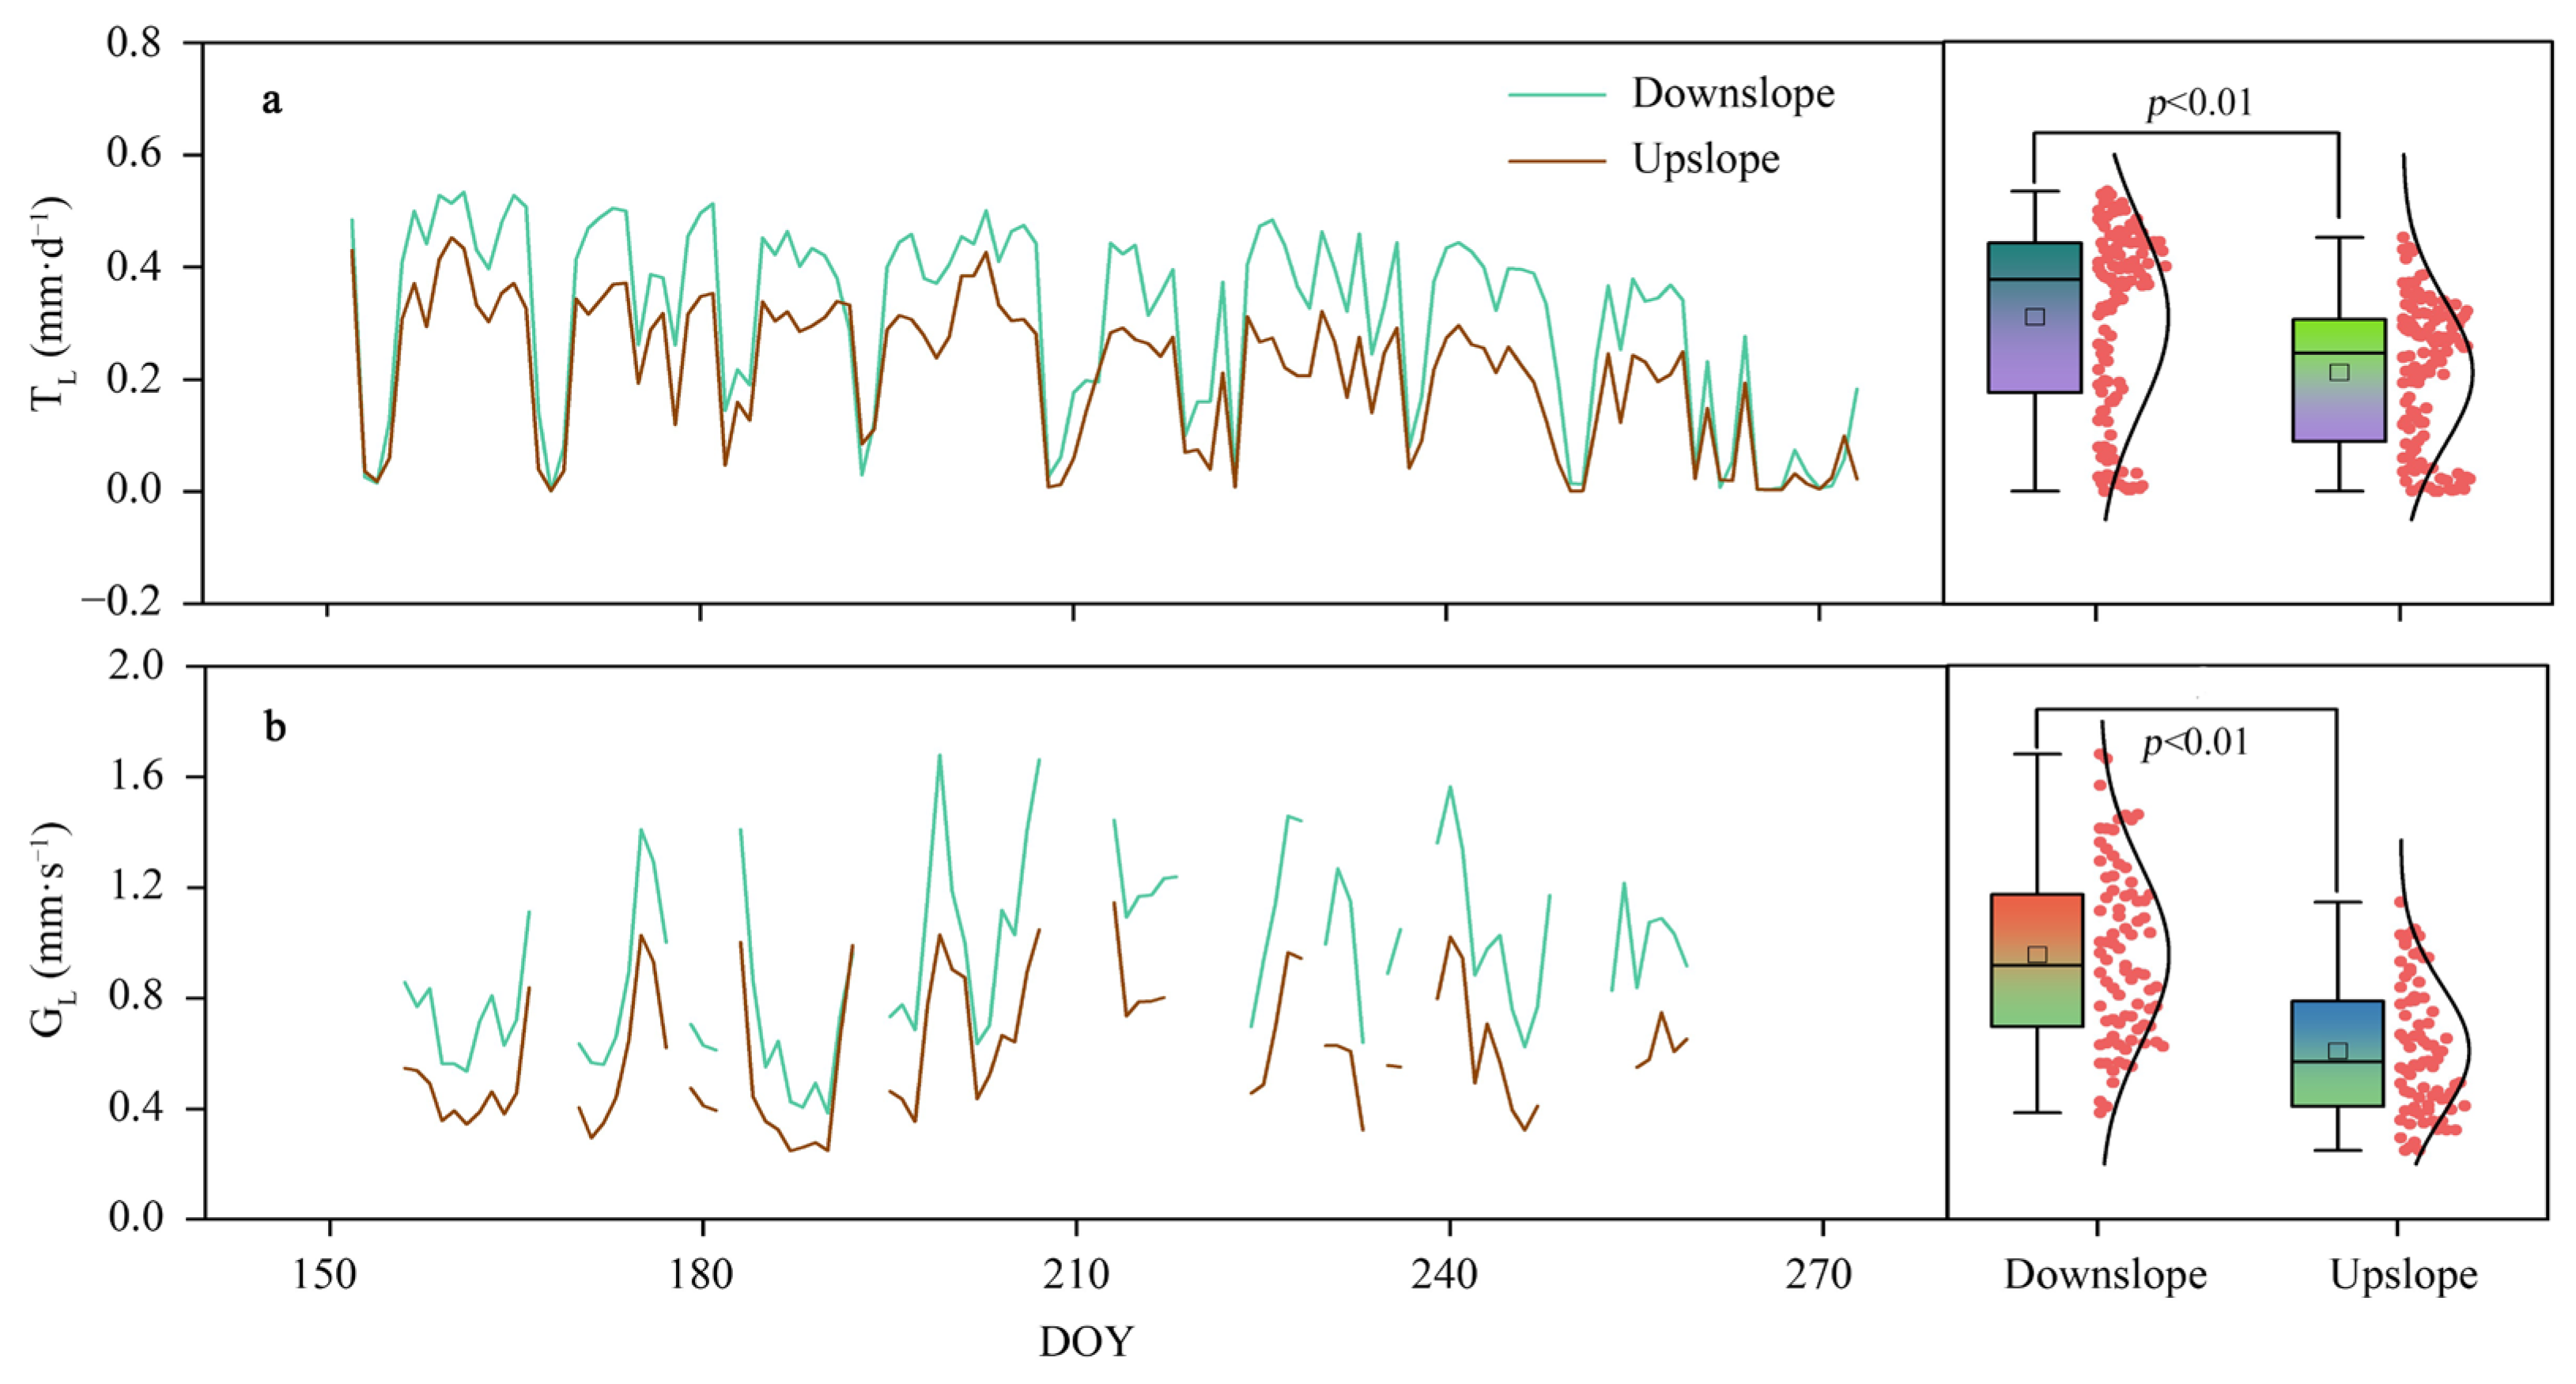
3.2. TL Variations and the Main Controlling Factors Affecting Slope Differences

Temporally, the dynamics of TL at both slope positions were essentially the same; i.e., from June to September, the TL generally gradually decreased. The daily mean TLs during the study period at the upslope and downslope positions varied from zero to 0.45 mm·d−1 and from zero to 0.53 mm·d−1, respectively (Figure 3a), with CVs of 0.60 and 0.53, respectively. Spatially, the TLs were significantly (p < 0.01) lower at the upslope position than at the downslope position, with mean values of 0.21 and 0.31 mm·d−1, respectively (Figure 3a). By combining the variations in the environmental conditions at the two slope positions (Figure 2), the differences in TL along the hillslope are likely dominated by both the atmospheric evaporative demand (Ta, Rs, and VPD) and SWC at the 40–60 cm soil depth. However, the upslope position characterized by higher atmospheric evaporative demand presented a lower TL, suggesting that the differences in the TL along the hillslope may be regulated by stomatal mechanisms. Consequently, the differences in the GL and its response to VPD at the two slope positions were further analyzed.
Temporally, the dynamics of the GL at both slope positions generally tended to initially increase but then decreased from June to September. The daily mean GL during the study period at the upslope and downslope positions varied from 0.25 to 1.15 mm·s−1 and from 0.39 to 1.68 mm·s−1, respectively (Figure 3b), with CVs of 0.39 and 0.33, respectively. Spatially, the GL was significantly (p < 0.01) lower at the upslope position than at the downslope position, with mean values of 0.61 and 0.95 mm·s−1, respectively (Figure 3b). The relationships between the GL and VPD at the two slope positions are shown in Figure 4. As the VPD increased, the GL initially rapidly decreased, followed by a gradual decrease at both positions. The VPD explained 76.8% and 81.6% of the variation in the GL at the upslope and downslope positions, respectively. The m (sensitivity of the GL to lnVPD) and GR (reference canopy conductance at VPD = 1.0 kPa) values were significantly (p < 0.01) lower at the upslope position than at the downslope position, indicating that the stomatal sensitivity to VPD varied across different slope positions, with greater sensitivity downslope.
On the basis of the comprehensive analysis above, the differences in the TLs along the hillslope are dominated by both the VPD-regulated GL and the SWC at the 40–60 cm soil depth.

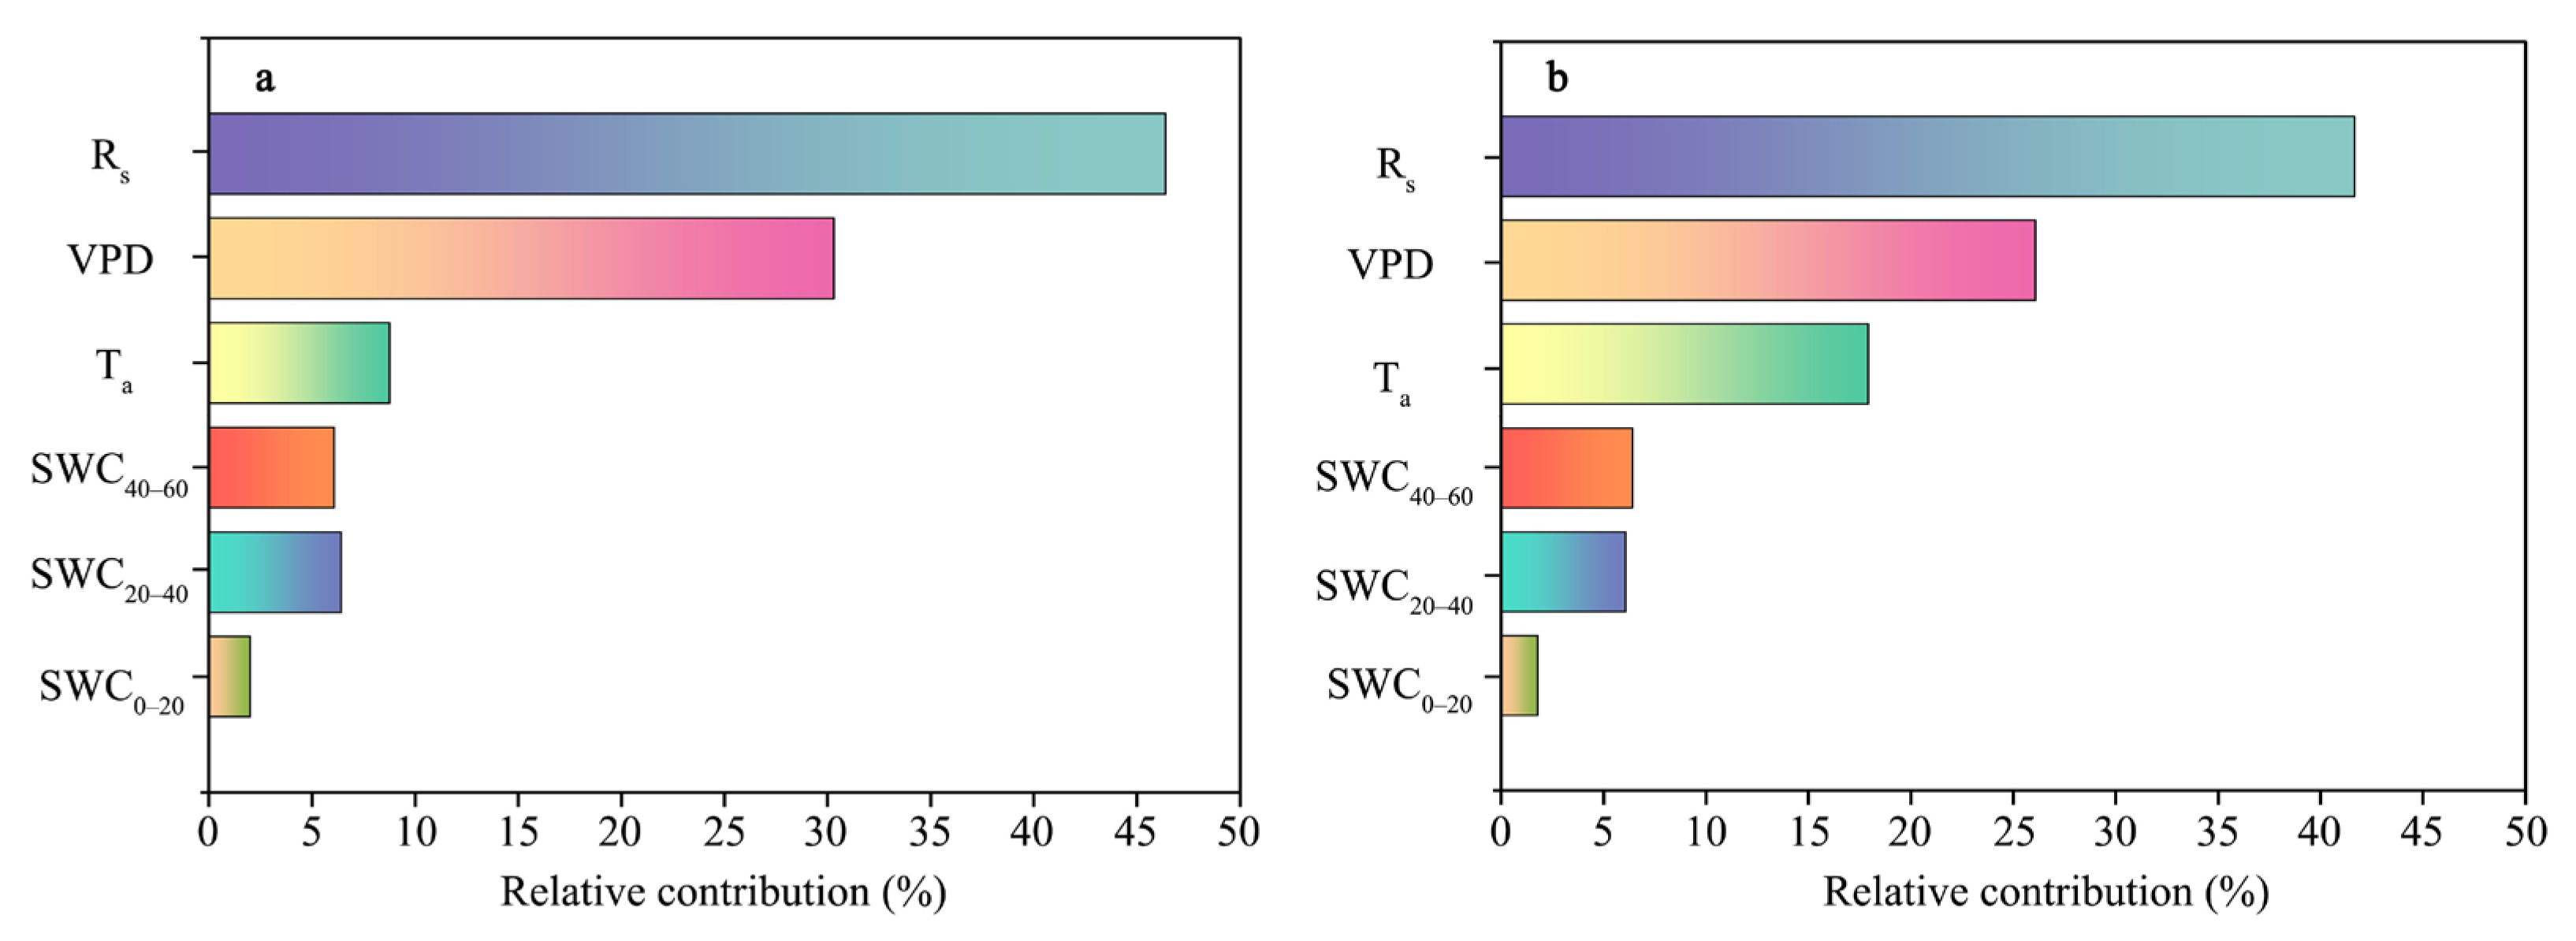
3.3. Impact and Contribution of the Dominant Factors to the Temporal Variations in the TL at the Two Positions

The responses of the daily TLs to the environmental factors at the two slope positions are shown in Figure 5. TL showed an exponentially saturated response to Ta and VPD at the downslope and upslope positions; specifically, the TL sharply increased with increasing Ta (or VPD) and subsequently stabilized after Ta (or VPD) reached higher values. TL logarithmically increased with increasing Rs values for the downslope and upslope positions. TL linearly increased as SWC increased in each soil layer at the two slope positions.
On the basis of the response of the TL to individual environmental factors, a comprehensive model framework (TL = (a1 + b1 × (1 − exp(−c1 × Ta))) × (a2 × ln(Rs) − b2) × (a3 × (1 − exp(−b3 × VPD))) × (a4 × SWC0–20 + b4 × SWC20–40 + c4 × SWC40–60 + d4)) based on the modified J-S equation was developed to quantify the synergistic effects of multiple interacting factors on TL dynamics. Through rigorous parameter optimization using field-observed data from downslope and upslope positions, multifactorial coupling relationships at the two slope positions were established that can effectively characterize the impacts of dominant factors on the temporal variations in the TL across different slope positions (Table 3).
The relative contributions of each major factor to the TL were determined at the two slope positions (Figure 6). Rs and VPD contributed the most to the TL variation at both slope positions, with contributions of 67.8% at the upslope position and 76.7% at the downslope position. The contribution of Ta to the TL at the upslope position was twice as large as that at the downslope position, with contributions of 17.9% at the upslope position and 8.8% at the downslope position. SWC contributed like TL at both slope positions (14.3% upslope vs. 14.5% downslope), mainly from the 20–60 cm depth.

4. Discussion

4.1. Controls of Slope Variations in Canopy Transpiration

Several studies have shown that canopy transpiration varies across slope positions and is usually lower at the upslope position than at the downslope position [8,10,22]. A similar pattern was found in our study; specifically, the transpiration per unit leaf area (TL) was significantly lower at the upslope position than at the downslope position. Fabiani et al. [39] reported that atmospheric evaporative demand (i.e., VPD) and soil moisture were the determinants of the differences in TLs along the hillslope in Fagus sylvatica L. forests; Kume et al. [40] reported that the differences in TLs between the upslope and downslope positions were caused by the differences in canopy conductance per leaf area (GL) in Chamaecyparis obtusa forests. In our study, significant slope differences in Ta, Rs, VPD, and SWC at the 40–60 cm soil depth were found, but elevated atmospheric evaporative demand at the upslope positions did not increase transpiration but instead suppressed transpiration through reduced GL, which was significantly lower upslope compared than downslope. Generally, the GL is predominantly regulated by the VPD, exhibiting an inverse relationship where an elevated VPD consistently reduces the GL [41]. In our study, the GL progressively decreased with increasing VPD, and the VPD explained 76.8–81.6% of the variation in the GL (Figure 4). This indicates that the GL was predominantly controlled by the VPD, with comparatively minor independent influences from Ta and Rs. These findings align with those of Novick et al. [42], who reported that while GL shows measurable sensitivity to variations in Ta and Rs, these dependencies become negligible compared with the dominant effect of VPD in forest ecosystems. Therefore, atmospheric evaporative demand (mediated through VPD) regulated hillslope transpiration patterns primarily via its control over canopy conductance in our study. A reduction in the soil water content increases the hydraulic resistance between the roots and soil and thus reduces transpiration. Wu et al. [43] reported that the reduction in transpiration was related mainly to the water availability in deeper soils. Tromp-van Meerveld and McDonnell [44] reported that transpiration was limited by soil moisture at the upslope position with shallower soil. In our study, the upslope position had a shallower soil depth than the downslope position did, and the soil moisture reduction (particularly at a depth of 40–60 cm, one of the major water sources for transpiration in larch plantations) slightly reduced the amount of water used for transpiration. Thus, the reduced TL at the upslope position was associated with the GL limitation induced by elevated VPD coupled with diminished SWC at the 40–60 cm soil depth.

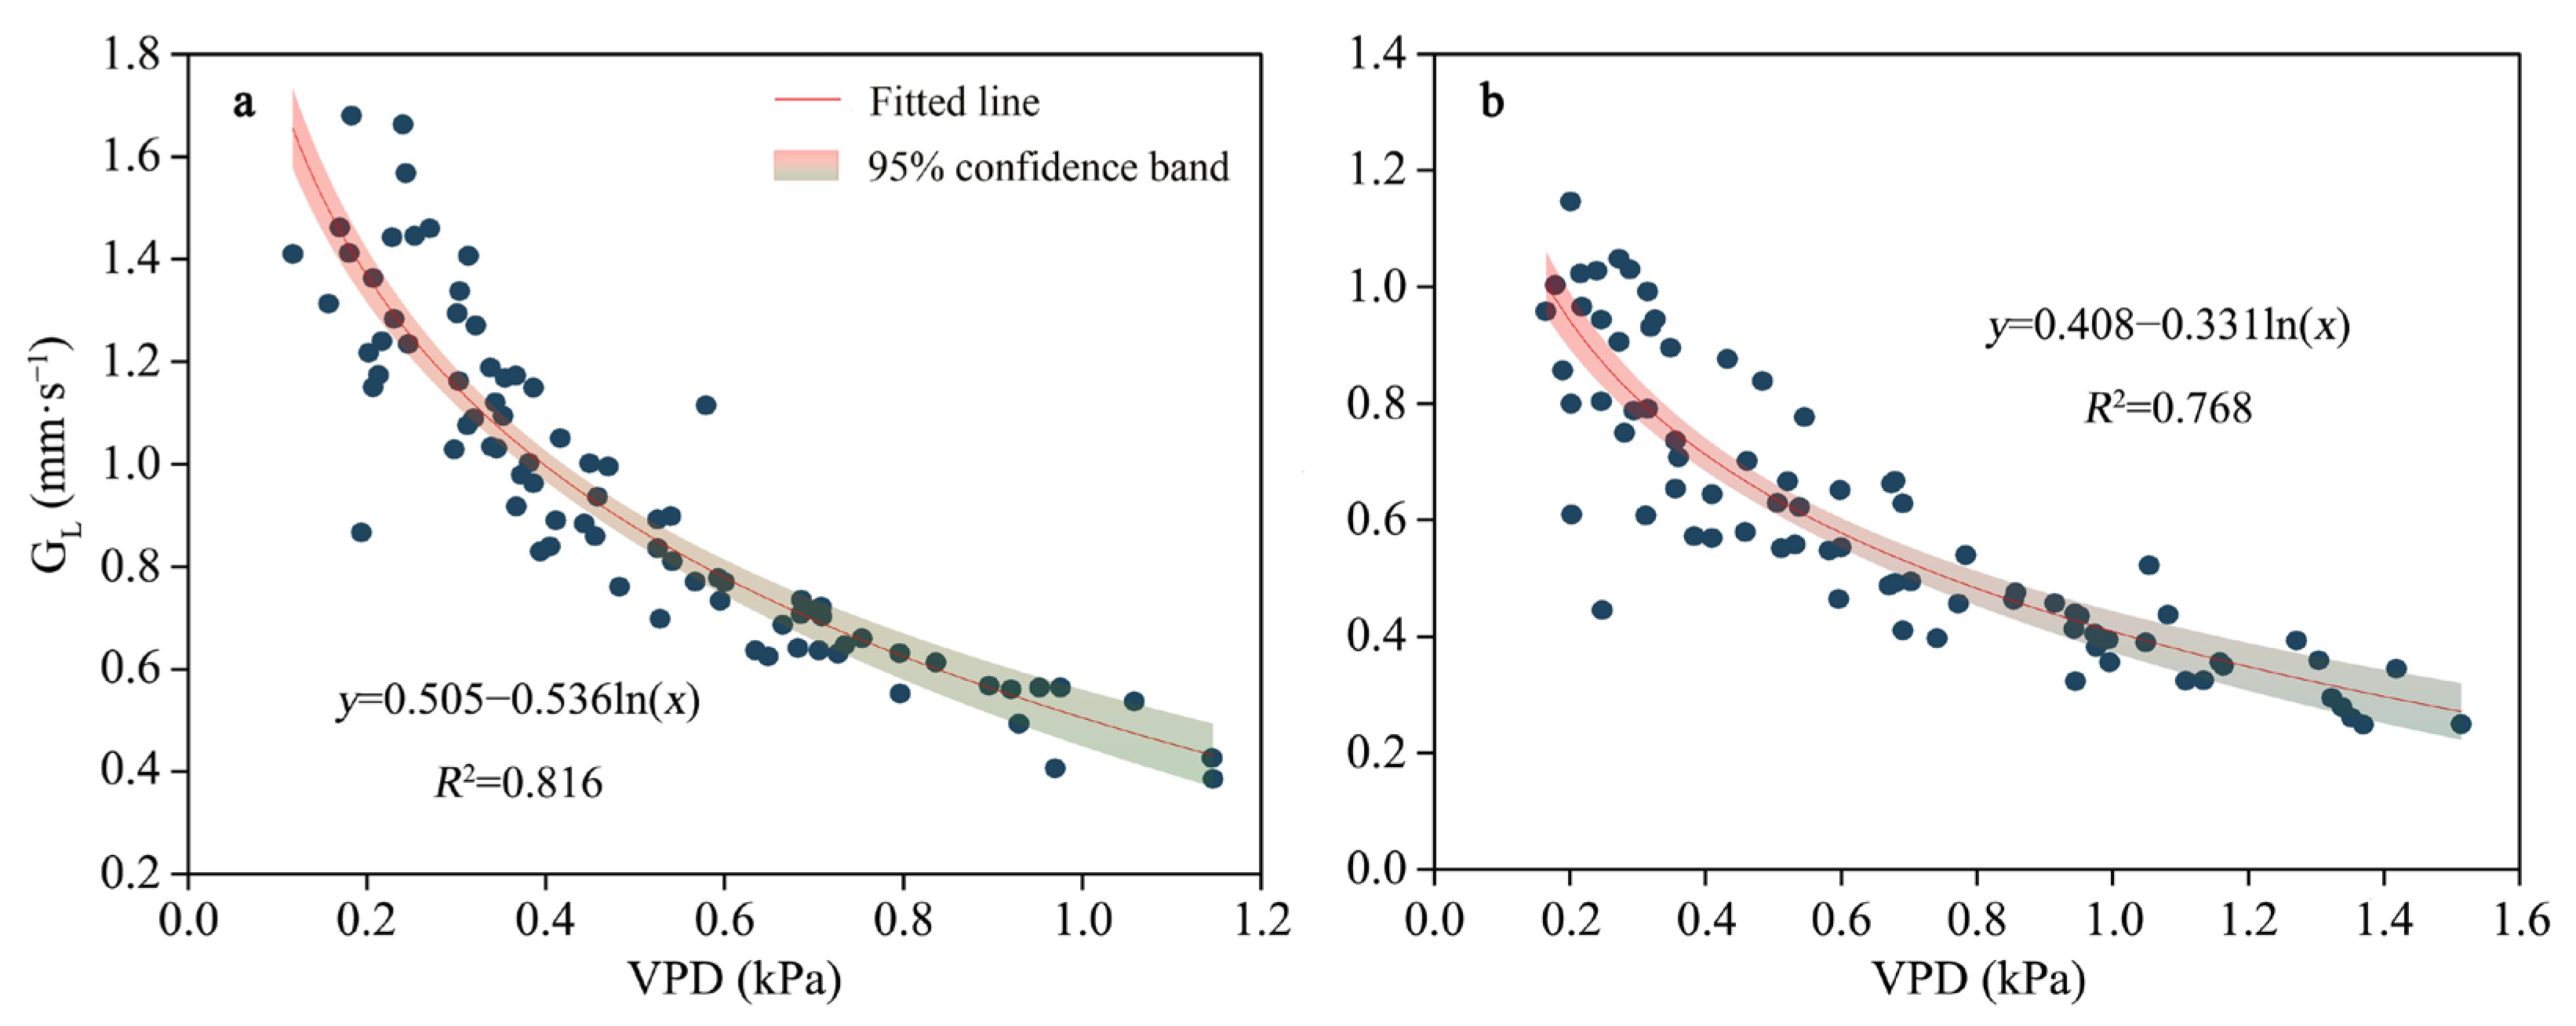
4.2. Controls of the Temporal Dynamics of Canopy Transpiration

Meteorological conditions (e.g., solar radiation, VPD, and air temperature) and soil moisture were the main controlling factors affecting canopy transpiration [45]. In our study, solar radiation, VPD, air temperature, and soil moisture jointly explained 89% of the variation in the TL across both slope positions. However, these environmental coupling effects vary substantially across species. For example, in temperate Caragana korshinskii trees, the same drivers accounted for only 74–81% of transpiration variability [46], reflecting divergent stomatal regulation strategies between species. Notably, the response relationships (functions) of transpiration to controlling factors could be altered under different hydrothermal conditions (e.g., varied soil moisture levels) [47]. In the present study, although the Ta, Rs, VPD, and SWC at the 40–60 cm soil depth significantly differed between the two slope positions, the response function of the TL to each environmental factor was generally consistent at the two slope positions; these results indicated that hillslope topography did not significantly affect the response function of canopy transpiration to the dominant factors. Similarly, Song et al. [10] reported that the responses of transpiration to environmental variables (e.g., VPD and solar radiation) were similar among slope positions in Pinus sylvestris var. mongolica forests; however, Fabiani et al. [39] reported that there was a strong differentiation in terms of transpiration response to VPD across slope positions in Fagus sylvatica L. forests. These divergent results among species suggest that different tree species exhibit distinct physiological responses to varying microenvironmental conditions along hillslopes.
As the main indicators reflecting the atmospheric evaporative demand, solar radiation, and VPD together contributed 67.8–76.7% of the TL variation; thus, solar radiation and VPD were the dominant determinants of the temporal dynamics of transpiration. These results are consistent with those reported in other forest ecosystems [13,14]. Furthermore, solar radiation contributed more to the TL than to the VPD. Solar radiation and VPD indicate the available energy and the atmospheric water deficit, respectively. These results indicated that canopy transpiration in this stand was more strongly controlled by energy than by water at the daily scale, which is consistent with studies in temperate forests [48]. However, contrasting results from water-limited forests demonstrate VPD as the primary TL driver [49]. Furthermore, Klein et al. [50] revealed shifts from Rs-dominance to VPD-dominance during soil drought. The persistent energy control observed in our study highlights the critical role of hillslope soil moisture in sustaining energy-limited transpiration regimes despite periodic atmospheric dryness. Chen et al. [17] reported that atmospheric drought attenuated the contributions of solar radiation and VPD. The reduced contributions of solar radiation and VPD at the upslope position in this study could be related to the higher VPD at the upslope position. With increasing solar radiation and VPD, the TL rapidly increased, followed by gradual stabilization; these results were consistent with those reported for other forested hillslopes [10]. Transpiration no longer increases at high VPD levels, which can prevent the loss of excess water; this regulated water use pattern represents a critical adaptive mechanism that enables trees to maintain hydraulic safety while responding to environmental changes. The VPD threshold at which the TL tends to saturate is closely related to the soil moisture availability and tends to be lower when the soil water availability is greater [51]. In our study, this value was found to be approximately 0.6 kPa at two slope positions and was within the range of reported thresholds for forests growing in semihumid regions [52]. Air temperature is also an important factor affecting transpiration; however, this factor is usually not a determinant of transpiration variation [52,53], which was further supported by the fact that Ta contributed only 8.8–19.9% to the TL variation in the present study. However, the contribution of air temperature to the TL clearly increased at the upslope position compared with the downslope position. Chen et al. [17] reported that the contribution of air temperature to transpiration increased when atmospheric drought occurred (i.e., elevated VPD). Therefore, higher air temperature contributions could be associated with higher VPD values at the upslope position.
The effect of the soil water content on transpiration depends on the soil moisture conditions, and the soil water content tends to be the main limiting factor when soil moisture is deficient [18]. In this study, temporal variations in TL were closely related to SWC, and the contribution of SWC in the 0–60 cm soil layer to TL was basically consistent at both slope positions, with a contribution of approximately 14%. However, the contribution of SWC to TL dynamics was substantially weaker than that of faster-fluctuating atmospheric drivers such as solar radiation and VPD. This pattern aligns with observations in the forests of Quercus lancifolia, Quercus corrugata, Clethra macrophylla, and Ficus concinna [45,54] and indicates that rapidly varying environmental variables (e.g., VPD and radiation) dominate the regulation of short-term transpiration variation, whereas slower-changing soil moisture operates as a secondary constraint at the daily scale. Additionally, we found that the contribution of SWC to TL was mainly from the 20–40 and 40–60 cm soil layers. In contrast, Liu et al. [22] reported that transpiration in Rhus chinensis primarily utilized surface (0–20 cm soil layer) soil moisture in humid karst terrain. Furthermore, sources of water utilized for transpiration reflect the adaptation of trees to the local water environment. Many tree species are able to adjust their water uptake strategies when soil moisture availability changes [55,56]; for example, drought-resistant tree species can shift their water uptake to deeper soil layers when the soil experiences drought [57]. Therefore, the water uptake strategy of the larch plantations in this study may be the result of long-term adaptation to the local soil moisture environment. Although the study site is located in a semihumid region, the higher elevation leads to higher evaporative demand and lower surface soil water content (Figure 2). In addition, the understorey has high herbaceous cover, and surface soil moisture may be preferentially used to satisfy herbaceous transpiration, thus ensuring benign and stable ecosystem structures. Furthermore, in this study, TL was linearly related to the soil water content; this result was different from previous findings related to larch plantations, which reported a saturating exponential increasing relationship between canopy transpiration (the effect of the variation in leaf amount was not excluded) and the soil water content [58]. On the basis of these results, the dynamic variations in the leaf amount during the growing season could influence the relationship between transpiration and the soil water content.

4.3. Implications for Ecohydrological Studies and Forest Management

Our results revealed slope differences in transpiration and indicated that hillslope-scale transpiration estimates could not be solely represented by observations at a particular slope position. Thus, multiple plots spanning upslope to downslope and including plots that reflect spatial variations in the environmental drivers (e.g., VPD and soil moisture) are recommended to accurately scale stand/plot transpiration to hillslopes. Additionally, developing simple and practical scale conversion methods (e.g., hillslope-scale models) is an effective means to accurately estimate hillslope transpiration, especially for forest hillslopes with complex topographies; however, the impacts of spatial heterogeneity on environmental drivers need to be clarified [45]. In this study, the main factors affecting the differences in the TLs along the hillslope were VPD and SWC40–60, and the main factors affecting the temporal dynamics in the TL were Rs, VPD, Ta, and SWC. Future research should focus on developing a hillslope-scale transpiration model combined with relationships among environmental drivers based on continuous observations of hillslopes from top to bottom to perform the scale conversion of transpiration from the stand/plot scale to the hillslope scale.
Despite the lower soil moisture and transpiration per unit leaf area at the upslope position, a prior study in our study area revealed that the stem radial growth of larch at the upslope position was greater than that at the downslope position [59]. This could be related to the water–carbon adjustment strategy of this tree species in response to the changing environment. By exploiting the greater amount of radiation at the upslope position, more efficient photosynthesis was performed for carbon accumulation; however, at the same time, to avoid an insufficient soil moisture supply, soil water consumption was reduced by lowering leaf stomatal opening and transpiration per unit area. Therefore, our results indicated that the hydraulic behavior of this tree species could change in response to variations in hydrothermal conditions at different sites.
Transpiration is controlled via stomatal responses to environmental conditions (e.g., VPD). We found that the sensitivity of the GL in response to the VPD varied at different slope positions. Cunningham. [60] reported that stomatal sensitivity to VPD varied with moisture conditions. His results indicated that potential differences in the response of water use to climate change (or soil drought) at different slope positions could exist and lead to changes in the water allocation pattern along hillslopes. Future studies need to establish more plots along hillslopes to carry out long-term systematic observations to further understand and explore the dominant factors for the response of canopy conductance to VPD and its quantitative relationship; this will provide a more scientific and accurate understanding of the impacts of climate change (or soil drought) on the hydrological processes in mountain forests.
From a forest and water management perspective, greater transpiration per unit of leaf area was observed at the downslope position than at the upslope position; thus, the stands at the downslope position were more water intensive than those at the upslope position under the same canopy structure conditions (i.e., canopy leaf area index). Larch is the major plantation species in Northwest China and has been planted in large areas on hillslopes over a long timeframe. However, excessive planting densities are not compatible with local limited water resources, leading to forest–water conflicts; thus, integrated forest water management (e.g., thinning) is imperative [5,28]. On the basis of our results, forest water management, which prioritizes thinning at the downslope position, may be one of the more effective ways to mitigate forest–water conflicts in the future.

4.4. Limitations of This Study and Indications for Future Studies

This study provides valuable insights into slope-dependent transpiration patterns and their environmental responses, with important implications for ecohydrological monitoring and forest water management. However, the current investigation, which is limited to a single hillslope during one growing season, may not fully capture the inherent variability in transpiration dynamics under different slope positions and climatic conditions. Future studies should be extended to multiple hillslopes with long-term monitoring (including different hydrological years, such as dry, normal, and wet years) to provide a comprehensive theoretical framework of transpiration patterns along hillslopes under changing environments.
Furthermore, trees at upper slope positions exhibit greater root plasticity, typically developing dimorphic root systems that enable access to deeper soil moisture during drought periods [61]. Therefore, potential variations in root architecture and vertical distribution may significantly influence water uptake patterns at different soil depths, thereby contributing to slope-dependent transpiration differences. To address this, root distribution and water source partitioning across soil layers should be quantified using an integrated approach that combines minirhizotron imaging and stable isotope analysis in future studies to better understand slope-dependent transpiration patterns and to strengthen the theoretical basis for hillslope ecohydrology.
Additionally, our findings are specific to the traits of Larix gmelinii var. principis-rupprechtii (such as coniferous stomatal control and root systems) and to our semihumid study region. To increase the applicability of these findings, future research should examine diverse plant types with different morphological and anatomical characteristics in different climates.

5. Conclusions

The transpiration per unit leaf area (TL) had significant spatial variability across slope positions, with the TL being significantly greater downslope than upslope. This variation was primarily controlled by VPD-regulated canopy conductance and soil moisture within the 40–60 cm soil layer. The temporal dynamics of the TL were mainly controlled by solar radiation, VPD, air temperature, and soil moisture, but there were slope differences in the contribution of each factor to the TL. Although solar radiation and VPD were the dominant drivers, their influence was less pronounced at the upslope position than at the downslope position. In contrast, the contribution of the air temperature to the TL was significantly greater at the upslope position. Soil moisture had a comparable influence at both slope positions, with the main contribution coming from the 20–60 cm soil depth. These results highlight distinct slope-induced differences in transpiration within the semihumid study region, emphasizing the need to account for the effects of slope position on transpiration in accurate hillslope-scale transpiration estimation and effective forest water management. However, given the single-season, location-specific nature of this study, further research is needed to investigate long-term patterns, interannual variability, and potential applicability to different climatic and topographic conditions.

Author Contributions

Conceptualization, Z.L.; methodology, Z.L.; validation, Z.L.; formal analysis, M.W.; investigation, M.W., S.L., and S.Y.; resources, J.M.; data curation, M.W. and S.L.; writing—original draft preparation, Z.L.; writing—review and editing, Y.W. and L.X.; visualization, Z.L.; project administration, Z.L.; funding acquisition, Y.W. and Z.L. All authors have read and agreed to the published version of the manuscript.

Funding

This research was supported by the Fundamental Research Funds of the Chinese Academy of Forestry (CAFYBB2021ZW002), the National Natural Science Foundation of China (32171559, 42477090, and U21A2005), and the National Key R & D Program of China (2022YFF0801803 and 2022YFF1300404).

Data Availability Statement

The original contributions presented in this study are included in the article. Further inquiries can be directed to the corresponding authors.

Acknowledgments

We thank the Liupan Mountains Forest Ecosystem Positioning Observation and Research Station for providing scientific and experimental support.

Conflicts of Interest

The authors declare no conflicts of interest.

Abbreviations

The following abbreviations are used in this manuscript:
TLTranspiration per unit leaf area
GLCanopy conductance per unit leaf area
VPDVapor pressure deficit
SWCSoil water content
TaAir temperature
RsSolar radiation
LAILeaf area index
DOYDay of the year

References

  1. Wang, Y.H.; Yu, P.T.; Feger, K.H.; Wei, X.H.; Sun, G.; Bonell, M.; Xiong, W.; Zhang, S.L.; Xu, L.H. Annual runoff and evapotranspiration of forestlands and nonforestlands in selected basins of the Loess Plateau of China. Ecohydrology 2011, 4, 277–287. [Google Scholar] [CrossRef]
  2. Schwärzel, K.; Zhang, L.; Montanarella, L.; Wang, Y.; Sun, G. How afforestation affects the water cycle in drylands: A process-based comparative analysis. Glob. Change Biol. 2020, 26, 944–959. [Google Scholar] [CrossRef] [PubMed]
  3. Feng, X.M.; Fu, B.J.; Piao, S.L.; Wang, S.; Ciais, P.; Zeng, Z.Z.; Lü, Y.H.; Zeng, Y.; Jiang, X.H.; Wu, B.F. Revegetation in China’s Loess Plateau is approaching sustainable water resource limits. Nat. Clim. Change 2016, 6, 1019–1022. [Google Scholar] [CrossRef]
  4. Liu, Z.B.; Yu, S.P.; Xu, L.H.; Wang, Y.H.; Yu, P.T.; Chao, Y. Differentiated responses of daytime and nighttime sap flow to soil water deficit in a larch plantation in Northwest China. Agric. Water Manag. 2023, 289, 108540. [Google Scholar] [CrossRef]
  5. Wang, L.; Liu, Z.B.; Guo, J.B.; Wang, Y.H.; Ma, J.; Yu, S.P.; Yu, P.T.; Xu, L.H. Estimate canopy transpiration in larch plantations via the interactions among reference evapotranspiration, leaf area index, and soil moisture. For. Ecol. Manag. 2021, 481, 118749. [Google Scholar] [CrossRef]
  6. Méndez-Toribio, M.; Ibarra-Manríquez, G.; Navarrete-Segueda, A.; Paz, H. Topographic position, but not slope aspect, drives the dominance of functional strategies of tropical dry forest trees. Environ. Res. Lett. 2017, 12, 085002. [Google Scholar] [CrossRef]
  7. Metzen, D.; Sheridan, G.J.; Benyon, R.G.; Bolstad, P.V.; Griebel, A.; Lane, P.N. Spatio-temporal transpiration patterns reflect vegetation structure in complex upland terrain. Sci. Total Environ. 2019, 694, 133551. [Google Scholar] [CrossRef]
  8. Tsuruta, K.; Yamamoto, H.; Kosugi, Y.; Makita, N.; Katsuyama, M.; Kosugi, K.I.; Tani, M. Slope position and water use by trees in a headwater catchment dominated by Japanese cypress: Implications for catchment-scale transpiration estimates. Ecohydrology 2020, 13, e2245. [Google Scholar] [CrossRef]
  9. Kumagai, T.O.; Tateishi, M.; Shimizu, T.; Otsuki, K. Transpiration and canopy conductance at two slope positions in a Japanese cedar forest watershed. Agric. For. Meteorol. 2008, 148, 1444–1455. [Google Scholar] [CrossRef]
  10. Song, L.N.; Zhu, J.J.; Li, X.J.Y.; Wang, K.; Wang, G.C.; Sun, H.H. Transpiration of Pinus sylvestris var. mongolica trees at different positions of sand dunes in a semiarid sandy region of Northeast China. Trees 2022, 36, 749–762. [Google Scholar] [CrossRef]
  11. Li, Z.H.; Yu, P.T.; Wang, Y.H.; Webb, A.A.; He, C.; Wang, Y.B.; Yang, L.L. A model coupling the effects of soil moisture and potential evaporation on the tree transpiration of a semi-arid larch plantation. Ecohydrology 2017, 10, e1764. [Google Scholar] [CrossRef]
  12. Hayat, M.; Zha, T.S.; Jia, X.; Iqbal, S.; Qian, D.; Bourque, C.P.A.; Khan, A.; Tian, Y.; Bai, Y.J.; Liu, P.; et al. A multiple-temporal scale analysis of biophysical control of sap flow in Salix psammophila growing in a semiarid shrubland ecosystem of northwest China. Agric. For. Meteorol. 2020, 288, 107985. [Google Scholar] [CrossRef]
  13. Oogathoo, S.; Houle, D.; Duchesne, L.; Kneeshaw, D. Vapour pressure deficit and solar radiation are the major drivers of transpiration of balsam fir and black spruce tree species in humid boreal regions, even during a short-term drought. Agric. For. Meteorol. 2020, 291, 108063. [Google Scholar] [CrossRef]
  14. Ghimire, C.P.; van Meerveld, H.I.; Zwartendijk, B.W.; Bruijnzeel, L.A.; Ravelona, M.; Lahitiana, J.; Lubczynski, M.W. Vapour pressure deficit and solar radiation are the major drivers of transpiration in montane tropical secondary forests in eastern Madagascar. Agric. For. Meteorol. 2022, 326, 109159. [Google Scholar] [CrossRef]
  15. Song, X.W.; Lyu, S.D.; Wen, X.F. Limitation of soil moisture on the response of transpiration to vapor pressure deficit in a subtropical coniferous plantation subjected to seasonal drought. J. Hydrol. 2020, 591, 125301. [Google Scholar] [CrossRef]
  16. Yan, X.Y.; Zhang, Z.D.; Zhao, X.F.; Huang, M.B.; Wu, X.F.; Guo, T.Q. Differentiated responses of plant water use regulation to drought in Robinia pseudoacacia plantations on the Chinese Loess Plateau. Agric. Water Manag. 2024, 291, 108659. [Google Scholar] [CrossRef]
  17. Chen, S.N.; Zhang, Z.Q.; Chen, Z.S.N.; Xu, H.; Li, J.L. Responses of canopy transpiration and conductance to different drought levels in Mongolian pine plantations in a semiarid urban environment of China. Agric. For. Meteorol. 2024, 347, 109897. [Google Scholar] [CrossRef]
  18. Whitley, R.; Zeppel, M.; Armstrong, N.; Macinnis-Ng, C.; Yunusa, I.; Eamus, D. A modified Jarvis-Stewart model for predicting stand-scale transpiration of an Australian native forest. Plant Soil 2008, 305, 35–47. [Google Scholar] [CrossRef]
  19. Renner, M.; Hassler, S.K.; Blume, T.; Weiler, M.; Hildebrandt, A.; Guderle, M.; Schymanski, S.J.; Kleidon, A. Dominant controls of transpiration along a hillslope transect inferred from ecohydrological measurements and thermodynamic limits. Hydrol. Earth Syst. Sci. 2016, 20, 2063–2083. [Google Scholar] [CrossRef]
  20. Gwak, Y.; Kim, S. Factors affecting soil moisture spatial variability for a humid forest hillslope. Hydrol. Process. 2017, 31, 431–445. [Google Scholar] [CrossRef]
  21. Petit, G.; von Arx, G.; Kiorapostolou, N.; Lechthaler, S.; Prendin, A.L.; Anfodillo, T.; Caldeira, M.C.; Cochard, H.; Copini, P.; Crivellaro, A.; et al. Tree differences in primary and secondary growth drive convergent scaling in leaf area to sapwood area across Europe. New Phytol. 2018, 218, 1383–1392. [Google Scholar] [CrossRef] [PubMed]
  22. Liu, W.N.; Nie, Y.P.; Luo, Z.D.; Wang, Z.Y.; Huang, L.; He, F.; Chen, H.S. Transpiration rates decline under limited moisture supply along hillslopes in a humid karst terrain. Sci. Total Environ. 2023, 894, 164977. [Google Scholar] [CrossRef] [PubMed]
  23. Mitchell, P.J.; Benyon, R.G.; Lane, P.N. Responses of evapotranspiration at different topographic positions and catchment water balance following a pronounced drought in a mixed species eucalypt forest, Australia. J. Hydrol. 2012, 440, 62–74. [Google Scholar] [CrossRef]
  24. Wang, X.M.; Zhang, C.X.; Hasi, E.; Dong, Z.B. Has the Three Norths Forest Shelterbelt Program solved the desertification and dust storm problems in arid and semiarid China? J. Arid Environ. 2010, 74, 13–22. [Google Scholar] [CrossRef]
  25. Tian, A.; Wang, Y.H.; Webb, A.A.; Liu, Z.B.; Yu, P.T.; Xiong, W.; Wang, X. Partitioning the causes of spatiotemporal variation in the sunny day sap flux density of a larch plantation on a hillslope in northwest China. J. Hydrol. 2019, 571, 503–515. [Google Scholar] [CrossRef]
  26. Li, J.M.; Yu, P.T.; Wan, Y.F.; Wang, Y.H.; Liu, B.B.; Yu, Y.P. Effects of topography and social position on the solar radiation of individual trees on a hillslope in Northwest China. Forests 2023, 14, 561. [Google Scholar] [CrossRef]
  27. Granier, A. Evaluation of transpiration in a Douglas-Fir stand by means of sap flow measurements. Tree Physiol. 1987, 3, 309–320. [Google Scholar] [CrossRef]
  28. Liu, Z.B.; Yu, S.P.; Xu, L.H.; Wang, Y.H.; Wang, M.F.; Yu, P.T. Spatiotemporal variations in sap flow in a larch plantation: Sampling size for stand scale estimates. J. For. Res. 2024, 35, 139. [Google Scholar] [CrossRef]
  29. Naithani, K.J.; Ewers, B.E.; Pendall, E. Sap flux-scaled transpiration and stomatal conductance response to soil and atmospheric drought in a semi-arid sagebrush ecosystem. J. Hydrol. 2012, 464–465, 176–185. [Google Scholar] [CrossRef]
  30. Yu, S.P.; Liu, Z.B.; Guo, J.B.; Wang, Y.H.; Yu, P.T.; Wang, L. Stand transpiration characteristics of Larix principis-rupprechtii plantation and their influencing factors in Liupan Mountain. J. Nanjing For. Univ. (Nat. Sci. Ed.) 2021, 45, 131–140. [Google Scholar] [CrossRef]
  31. Wilks, D.S. Statistical Methods in the Atmospheric Sciences, 2nd ed.; Elsevier: Burlington, MA, USA, 2006; pp. 141–143. [Google Scholar]
  32. Matsoukis, A.; Kamoutsis, A.; Chronopoulou-Sereli, A. A note on the flowering of Ajuga orientalis L. in relation to air temperature in Mount Aenos (Cephalonia, Greece). Curr. Agric. Res. J. 2018, 6, 261–267. [Google Scholar] [CrossRef]
  33. Kamoutsis, A.; Chronopoulos, K.; Matsoukis, A. Altitude and canopy cover effects on air temperature in a mountainous region of Ionian Islands, Greece. Curr. World Environ. 2018, 13, 292–298. [Google Scholar] [CrossRef]
  34. Oren, R.; Sperry, J.S.; Katul, G.G.; Pataki, D.E.; Ewers, B.E.; Phillips, N.; Schäfer, K.V.R. Survey and synthesis of intra-and interspecific variation in stomatal sensitivity to vapour pressure deficit. Plant Cell Environ. 1999, 22, 1515–1526. [Google Scholar] [CrossRef]
  35. Schmidt, U.; Thoni, H.; Kaupenjohann, M. Using a boundary line approach to analyze N2O flux data from agricultural soils. Nutr. Cycl. Agroecosyst. 2000, 57, 119–129. [Google Scholar] [CrossRef]
  36. Yu, S.P.; Guo, J.B.; Liu, Z.B.; Wang, Y.H.; Ma, J.; Li, J.M.; Liu, F. Assessing the impact of soil moisture on canopy transpiration using a modified Jarvis-Stewart model. Water 2021, 13, 2720. [Google Scholar] [CrossRef]
  37. R, Core Team. R: A Language and Environment for Statistical Computing; R Foundation for Statistical Computing: Vienna, Austria, 2021; Available online: https://www.R-project.org/ (accessed on 14 June 2024).
  38. Grömping, U. Relative importance for linear regression in R: The package relaimpo. J. Stat. Softw. 2007, 17, 1–27. [Google Scholar] [CrossRef]
  39. Fabiani, G.; Klaus, J.; Penna, D. The influence of hillslope topography on beech water use: A comparative study in two different climates. Hydrol. Earth Syst. Sci. 2024, 28, 2683–2703. [Google Scholar] [CrossRef]
  40. Kume, T.; Tsuruta, K.; Komatsu, H.; Shinohara, Y.; Katayama, A.; Ide, J.I.; Otsuki, K. Differences in sap flux-based stand transpiration between upper and lower slope positions in a Japanese cypress plantation watershed. Ecohydrology 2016, 9, 1105–1116. [Google Scholar] [CrossRef]
  41. Du, J.L.; Dai, X.Q.; Huo, Z.L.; Wang, X.W.; Wang, S.; Wang, C.Z.; Zhang, C.L.; Huang, G.H. Stand transpiration and canopy conductance dynamics of Populus popularis under varying water availability in an arid area. Sci. Total Environ. 2023, 892, 164397. [Google Scholar] [CrossRef]
  42. Novick, K.A.; Ficklin, D.L.; Stoy, P.C.; Williams, C.A.; Bohrer, G.; Oishi, A.C.; Papuga, S.A.; Blanken, P.D.; Noormets, A.; Sulman, B.N.; et al. The increasing importance of atmospheric demand for ecosystem water and carbon fluxes. Nat. Clim. Change 2016, 6, 1023–1027. [Google Scholar] [CrossRef]
  43. Wu, Z.; Behzad, H.M.; He, Q.F.; Wu, C.; Bai, Y.; Jiang, Y.J. Seasonal transpiration dynamics of evergreen Ligustrum lucidum linked with water source and water-use strategy in a limestone karst area, southwest China. J. Hydrol. 2021, 597, 126199. [Google Scholar] [CrossRef]
  44. Tromp-van Meerveld, H.J.; McDonnell, J.J. On the interrelationships between topography soil depth, soil moisture, transpiration rates and species distributions at the hillslope scale. Adv. Water Res. 2006, 29, 293–310. [Google Scholar] [CrossRef]
  45. Berry, Z.C.; Gotsch, S.G.; Holwerda, F.; Muñoz-Villers, L.E.; Asbjornsen, H. Slope position influences vegetation-atmosphere interactions in a tropical montane cloud forest. Agric. For. Meteorol. 2016, 221, 207–218. [Google Scholar] [CrossRef]
  46. She, D.L.; Xia, Y.Q.; Shao, M.G.; Peng, S.Z.; Yu, S.G. Transpiration and canopy conductance of Caragana korshinskii trees in response to soil moisture in sand land of China. Agroforest. Syst. 2013, 87, 667–678. [Google Scholar] [CrossRef]
  47. Chen, S.N.; Wei, W.; Huang, Y. Biophysical controls on canopy transpiration of Pinus tabulaeformis under different soil moisture conditions in the Loess Plateau of China. J. Hydrol. 2024, 631, 130799. [Google Scholar] [CrossRef]
  48. Song, L.N.; Zhu, J.J.; Li, M.C.; Zhang, J.X.; Zheng, X.; Wang, K. Canopy transpiration of Pinus sylvestris var. mongolica in a sparse wood grassland in the semiarid sandy region of Northeast China. Agric. For. Meteorol. 2018, 250, 192–201. [Google Scholar] [CrossRef]
  49. Flo, V.; Martínez-Vilalta, J.; Granda, V.; Mencuccini, M.; Poyatos, R. Vapour pressure deficit is the main driver of tree canopy conductance across biomes. Agric. For. Meteorol. 2022, 322, 109029. [Google Scholar] [CrossRef]
  50. Klein, T.; Ramon, U.; Cohen, S.; Yakir, D. Diurnal dynamics of water transport, storage and hydraulic conductivity in pine trees under seasonal drought. iForest 2021, 14, 71–79. [Google Scholar] [CrossRef]
  51. Wieser, G.; Leo, M.; Oberhuber, W. Transpiration and canopy conductance in an inner alpine Scots pine (Pinus sylvestris) forest. Flora 2014, 209, 491–498. [Google Scholar] [CrossRef]
  52. Wang, H.L.; Tetzlaff, D.; Dick, J.J.; Soulsby, C. Assessing the environmental controls on Scots pine transpiration and the implications for water partitioning in a boreal headwater catchment. Agric. For. Meteorol. 2017, 240, 58–66. [Google Scholar] [CrossRef]
  53. Lhomme, J.P.; Elguero, E.; Chehbouni, A.; Boulet, G. Stomatal control of transpiration: Examination of Monteith’s formulation of canopy resistance. Water Resour. Res. 1998, 34, 2301–2308. [Google Scholar] [CrossRef]
  54. Hayat, M.; Xiang, J.; Yan, C.H.; Xiong, B.W.; Wang, B.; Qin, L.J.; Saeed, S.; Hussain, A.; Zou, Z.D.; Qiu, G.Y. Environmental control on transpiration and its cooling effect of Ficus concinna in a subtropical city Shenzhen, southern China. Agric. For. Meteorol. 2022, 312, 108715. [Google Scholar] [CrossRef]
  55. Sun, S.J.; Meng, P.; Zhang, J.S.; Wan, X. Variation in soil water uptake and its effect on plant water status in Juglans regia L. during dry and wet seasons. Tree Physiol. 2011, 31, 1378–1389. [Google Scholar] [CrossRef]
  56. Gessler, A.; Bächli, L.; Rouholahnejad Freund, E.; Treydte, K.; Schaub, M.; Haeni, M.; Weiler, M.; Seeger, S.; Marshall, J.; Christian, H.; et al. Drought reduces water uptake in beech from the drying topsoil, but no compensatory uptake occurs from deeper soil layers. New Phytol. 2022, 233, 194–206. [Google Scholar] [CrossRef]
  57. Brinkmann, N.; Eugster, W.; Buchmann, N.; Kahmen, A. Species-specific differences in water uptake depth of mature temperate trees vary with water availability in the soil. Plant Biology 2019, 21, 71–81. [Google Scholar] [CrossRef]
  58. Wang, Y.N.; Cao, G.X.; Wang, Y.H.; Webb, A.A.; Yu, P.T.; Wang, X.J. Response of the daily transpiration of a larch plantation to variation in potential evaporation, leaf area index and soil moisture. Sci. Rep. 2019, 9, 4697. [Google Scholar] [CrossRef]
  59. Ma, J.; Guo, J.B.; Wang, Y.H.; Liu, Z.B.; Gao, D.; Hong, L.; Zhang, Z.Y. Variations in stem radii of Larix principis-rupprechtii to environmental factors at two slope locations in the Liupan Mountains, northwest China. J. For. Res. 2021, 32, 513–527. [Google Scholar] [CrossRef]
  60. Cunningham, S.C. Stomatal sensitivity to vapour pressure deficit of temperate and tropical evergreen rainforest trees of Australia. Trees 2004, 18, 399–407. [Google Scholar] [CrossRef]
  61. Fabiani, G.; Schoppach, R.; Penna, D.; Klaus, J. Transpiration patterns and water use strategies of beech and oak trees along a hillslope. Ecohydrology 2021, 15, e2382. [Google Scholar] [CrossRef]
Figure 1. Schematic diagram of the larch plantation hillslope and its downslope and upslope positions.
Water 17 01756 g001
Figure 2. Variations and differences in Ta (a), Rs (b), VPD (c), SWC0–20 (d), SWC20–40 (e), and SWC40–60 (f) between the two slope positions during the study period (June to September) in 2023. ns indicates that there were no significant differences in the means of the variables between the two slope positions during the study period, whereas p < 0.01 denotes statistically significant differences in the means. Color differentiation is to distinguish upslope/downslope positions and different indicators.
Water 17 01756 g002
Figure 3. Variations and differences in TL (a) and GL (b) between the two slope positions during the study period (June to September) in 2023. p < 0.01 denotes statistically significant differences in the means of the variables between the two slope positions during the study period. Color differentiation is to distinguish upslope/downslope positions and different indicators.
Water 17 01756 g003
Figure 4. Relationships between the GL and VPD at the downslope (a) and upslope (b) positions.
Water 17 01756 g004
Figure 5. Response of the TL to the Ta (a), Rs (b), VPD (c), SWC0–20 (d), SWC20–40 (e), and SWC40–60 (f) at the two slope positions.
Water 17 01756 g005
Figure 6. Relative contributions of Ta, Rs, VPD, SWC0–20, SWC20–40, and SWC40–60 to the TL at the downslope (a) and upslope (b) positions.
Water 17 01756 g006
Table 1. Stand and soil characteristics of the two plots at the downslope and upslope positions.
CharacteristicDownslopeUpslope
Stand density (stems·ha−1)933944
Mean DBH (cm)18.920.6
Mean tree height (m)16.316.9
Mean leaf area index (m2·m−2)2.963.59
Soil depth (m)1.21.0
Soil bulk density (g·cm−3)1.100.94
Soil water holding capacity (%)33.537.7
Note: the mean leaf area index refers to the growing season mean; the soil bulk density and soil water holding capacity are the mean values of the 0–60 cm soil layer.
Table 2. Characteristics of the sample trees at two slope positions.
Slope PositionTree CodeDBH (cm)H (m)Sapwood Area (cm2)
Downslope112.913.972.5
214.514.587.2
314.914.791.1
419.216.4136.0
524.118.3194.7
628.219.9249.6
Upslope113.914.272.6
216.315.398.5
319.016.4132.2
421.017.1160.2
524.218.0210.4
627.418.8267.0
Table 3. Coupling relationships between TL and multiple factors at the two slope positions.
Slope PositionsQuantitative RelationshipR2pn
DownslopeTL = (−0.100 + 0.101 × (1 − exp(−1.685 × Ta))) × (1.073 × ln(Rs) + 7.365) × (0.100 × (1 − exp(−6.093 × VPD))) × (7.327 × SWC0–20 + 1.330 × SWC20–40 + 2.817 × SWC40–60 + 5.233)0.889<0.01122
UpslopeTL = (−0.664 + 0.665 × (1 − exp(−4.105 × Ta))) × (2.644 × ln(Rs) − 6.430) × (0.276 × (1 − exp(−8.329 × VPD))) × (1.358 × SWC0–20 + 12.097 × SWC20–40 + 1.130 × SWC40–60 + 16.140)0.888<0.01122
Disclaimer/Publisher’s Note: The statements, opinions and data contained in all publications are solely those of the individual author(s) and contributor(s) and not of MDPI and/or the editor(s). MDPI and/or the editor(s) disclaim responsibility for any injury to people or property resulting from any ideas, methods, instructions or products referred to in the content.

