Article

Comparison between Hyperspectral and Multispectral Retrievals of Suspended Sediment Concentration in Rivers

1
Department of Civil and Environmental Engineering, Yonsei University, Seoul 03722, Republic of Korea
2
Maseeh Department of Civil, Architectural and Environmental Engineering, The University of Texas at Austin, Austin, TX 78758, USA
3
Institute of Construction and Environmental Engineering, Seoul National University, Seoul 08826, Republic of Korea
4
Department of Civil and Environmental Engineering, Hankyong National University, Anseong-si 17579, Republic of Korea
*
Author to whom correspondence should be addressed.
Water 2024, 16(9), 1275; https://doi.org/10.3390/w16091275
Submission received: 28 March 2024 / Revised: 26 April 2024 / Accepted: 27 April 2024 / Published: 29 April 2024
(This article belongs to the Special Issue Contaminant Transport Modeling in Aquatic Environments)

Abstract

:
Remote sensing (RS) is often employed to estimate suspended sediment concentration (SSC) in rivers, and the availability of hyperspectral imagery enhances the effectiveness of RS-based water quality monitoring due to its high spectral resolution. Yet, the necessity of hyperspectral imagery for SSC estimation in rivers has not been fully validated. This study thus compares the performance of hyperspectral RS with that of multispectral RS by conducting field-scale experiments in shallow rivers. In the field experiments, we measured radiance from a water body mixed with suspended sediments using a drone-mounted hyperspectral sensor, with the sediment and riverbed types considered as controlling factors. We retrieved the SSC from UAV imagery using an optimal band ratio analysis, which successfully estimated SSC distributions in the sand bed conditions with both multispectral and hyperspectral data. In the vegetated bed conditions, meanwhile, the prediction accuracy decreased significantly due to the temporally varying bottom reflectance associated with the random movement of vegetation caused by near-bed turbulence. This is because temporally inhomogeneous bottom reflectance distorts the relationship between the SSC and total reflectance. Nevertheless, the hyperspectral imaging exhibited better prediction accuracy than the multispectral imaging, effectively extracting optimal spectral bands sensitive to back-scattered reflectance from sediments while constraining the bottom reflectance caused by the vegetation-covered bed.

1. Introduction

In riverine systems, it is critically important to understand the dynamics of suspended sediments, which directly affect river flow, water quality, and morphological processes in rivers [1,2]. The acquisition of high-resolution spatial data of suspended sediment concentration (SSC) is required to investigate the physical interactions between suspended sediments and environmental factors [3,4]. Conventionally, in-situ measurements such as sampling water or deploying optical sensors at study sites are adopted for SSC observation in rivers [5,6]. While the in-situ observation provides high-resolution temporal SSC data, this conventional method is often laborious, not time efficient, and typically yields discrete spatial data [7]. Rivers have spatially intricate flow and water quality patterns due to inherent topographical features like meander and confluence, thereby leading to a spatially heterogeneous distribution of SSC. Therefore, spatially continuous SSC distributions are essential to enhance our mechanical understanding of suspended sediment transport in aquatic environments.
With the recent advances in remote sensing (RS), numerous studies have successfully retrieved a high-resolution map of water quality constituents such as cyanobacteria, colored dissolved organic matter, and suspended sediments from multispectral satellite images [8,9,10]. The RS-based SSC measurement relies on the optical characteristics of a target water body. Once sunlight penetrates into the water column, it experiences (1) the radiance reflected from the riverbed; (2) the back-scattered radiance from the water body; (3) the radiance reflected at the water surface; (4) the path radiance of the atmosphere [11]. Among them, SSC is most sensitive to the back-scattered radiance characterized by the back-scattering signals from sediment particles in the water column. In consequence, higher values of the back-scattered radiance are observed in turbid water with a higher SSC than those in clear water.
Previous studies of RS-based SSC observation have predominantly focused on estuarine and coastal environments owing to the feasibility of acquiring ample spatial data from satellite imagery and the negligible effect of the bottom reflectance ascribed to deep water conditions [12,13,14]. However, the RS application to SSC measurements in riverine environments has been limited, primarily because of the relatively narrow channel width of rivers [9,15]. Despite the recent availability of Sentinel-2 and 3 satellites, which have an enhanced spatial resolution of 5–10 m, the spectral resolution remains a significant limitation, with a bandwidth of 60–80 nm. This limited spectral resolution is known to be a critical drawback of satellite-based water quality monitoring in rivers [16,17].
Recent researches adopted UAV (unmanned aerial vehicle)-assisted hyperspectral RS to overcome the limitations of satellite-based RS. This approach offers higher spatial and spectral resolutions than those of satellite imagery, as depicted in Figure 1, making it suitable for measuring water depth, cyanobacteria concentration, and SSC in rivers and streams [16,17,18,19,20]. Some of these studies leveraged on enhancing the prediction accuracy of SSC by establishing empirical relationships between in-situ measured target values and the reflectance of hyperspectral bands. Although the former studies successfully validated the feasibility of hyperspectral-based RS for SSC retrieval in rivers, there have been insufficient studies comparing the performance of hyperspectral RS with that of multispectral RS in estimating the SSC. This lack of comparison undermines the necessity of a high spectral resolution attributed to hyperspectral imagery for accurate SSC measurements.
The goal of this study is to assess the performance of hyperspectral imaging over multispectral imaging incorporated with the spectral resolution of conventionally used satellite imagery for SSC retrieval in rivers. To achieve this objective, we conduct field tracer experiments in a real-scale experimental flume by varying the conditions of the injected sediment and bottom (riverbed) types, and measure SSC using a laser-diffraction analyzer for the acquisition of in-situ SSC data. Simultaneously, the spectral data of suspended sediments are acquired with UAV-mounted hyperspectral sensors. Then, we analyze the relationships between the remotely sensed reflectance and in-situ measured SSC by deriving empirical equations from an optimal band ratio algorithm. Eventually, the prediction accuracy of SSC using the hyperspectral approach is compared with that using the multispectral approach to unravel the importance of hyperspectral information on SSC estimation in rivers.

2. Materials and Methods

2.1. Field Experiment

To evaluate hyperspectral and multispectral retrievals of SSC across a comprehensive range of SSC and sediment compositions, we employ hyperspectral data along with corresponding SSC data obtained through a sediment injection experiment conducted in a real-scale experimental channel. This channel is located at the River Experimental Center of the Korea Institute of Civil Engineering and Building Technology in Andong, South Korea. For bottom-type separation, the channel is partitioned into sections with a vegetated and sand bed, as shown in Figure 2. Featuring a trapezoidal cross-section of natural river dimensions, it spans a length of 500 m, a top width of 11 m, a depth of 2 m, and three meandering reaches with the sinuosity of 1.2, 1.5, and 1.7. The discharge can be supplied from 1–8 m3/s by pumping water from the nearby Nakdong River. The experimental reach extends a length of 180 m from the injection point to the measurement section (Figure 2a). To investigate the effect of bottom reflectance on SSC retrieval, the experiments are conducted with two bottom types: the vegetated bed (Figure 2b) and sand bed (Figure 2c). The length of vegetation is approximately 0.1 m, and a natural arid sand bottom condition is achieved after removing the vegetation at the measurement section.
The water depth is set to shallow conditions with a mean depth ranging from approximately 0.55 to 0.60 m and a maximum depth of 0.9 m. This shallow condition underscores the significance of bottom reflectance in the overall radiance profiles, even in high turbidity conditions [20]. The sediment is injected into the midpoint of the water depth using a specially designed mixer on the bridge and a connected rubber hose. As indicated in Table 1, quartz sand (QS) and yellow loess (YL) are used in the experiment for exploring the impact of the spectral variability inherent to sediment compositions on the RS of SSC. Specifically, QS primarily exhibits a grayish color with minimal variation in reflectance from visible to near-infrared regions, resulting in low visibility. In contrast, YL demonstrates a high reflectance variation, particularly near the red wavelength, leading to high visibility. The spectral characteristics of these sediments in dry and wet conditions can be found in Kwon et al. (2023b) [21]. The sediment density and particle size are also substantially different. As shown in Table 2 of the particle size distribution, QS sediments are mainly composed of sand particles of which 90% have a diameter larger than 62 µm, and YL consists of about 81% of silt particles with a diameter of less than 62 µm. In this study, thereby, we consider QS and YL as sand sediments and silt sediments, respectively, to investigate the impact of particle size on the RS of SSC. YL tends to float similarly to the passive scalar owing to its low density and particle size. This characteristic implies that the vertical distribution is close to uniform. However, QS can be transported in a stratified condition near the bed due to its heavy weight. This trait suggests that detecting QS in rivers could be challenging because solar energy is exponentially attenuated within the water column [22]. Thus, 20 kg more of QS is injected compared to YL.
During the experiment, a calibrated laser-diffraction analyzer (LISST-200X, Sequoia Scientific Inc., Bellevue, WA, USA) is used for the in-situ SSC measurement. This sensor is deployed in the middle of the measurement section. Simultaneously, spatio-temporal hyperspectral images (HSIs) are collected by a drone. In this setup, a microHSI 410 SHARK hyperspectral camera (Corning, Glendale, AZ, USA) is mounted on the DJI M600 drone (DJI, Shenzhen, China) which was connected using a DJI Ronin 3-axis handheld gimbal to ensure stable orthophotos. The microHSI 410 SHARK is a push-broom type sensor covering a spectral range of 400–1000 nm. The captured image comprises 150 spectral bands and 682 spatial pixels per line. The drone hovers at 25 m above the water surface at the measurement section, capturing HSIs at a sampling rate of 120 Hz under 29.5 degrees field of view. Therefore, line-scanning HSIs over time are acquired at the measurement section with a spatial resolution of 1.89 cm. The captured images are converted from a digital number to radiance and corrected the spatial nonuniformity using non-uniformity corrections [23]. Subsequently, radiometric correction is conducted to achieve a reflectance version of images, indicating a normalized value regardless of solar energy. The detailed pre-processing method is elaborated in Kwon et al. (2022a) [17].
From the corrected images, the reflectance spectra corresponding to the SSC measurement are extracted by spatially averaging five pixels surrounding the SSC measurement points. The temporal interval of the SSC measurement is 1.5 s so that the reflectance spectra are also temporally averaged to the same interval to align both datasets. The dataset of the SSC and reflectance used in this study is summarized in Table 3, and it entails spectral variability arising from sediment and bottom characteristics. This comprehensive experimental setup allows for a more thorough and in-depth assessment of both hyperspectral and multispectral approaches by decomposing confounding factors such as sediment and bottom variability.

2.2. Optimal Band Ratio Algorithm

In the RS of suspended sediments in water environments, the light intensity from the water column recorded on a spectral sensor is a predictor of retrieving SSC from aerial images. This key variable reaching the sensor can generally be decomposed into four major sources as follows:
L u λ = L b λ + L c λ + L s λ + L p λ
where Lu(λ) is the total radiance reaching the sensor; Lb(λ) is the bottom radiance; Lc(λ) is the back-scattered radiance from the water body; Ls(λ) is the upwelling radiance from the water surface; Lp(λ) is the path radiance through the atmosphere; and λ denotes the wavelength of the light [24]. For a practical application of Equation (1), Lp(λ) can be neglected using atmospheric correction algorithms [25,26], and its influence can be minimized using the low-altitude flight of a UAV. Also, the radiance from the water surface Ls(λ) can be eliminated by minimizing the surface reflection with glint removal algorithms or orthographic imaging techniques [27,28].
Even though Lc(λ) is the principal component that controls the spatio-temporal variability of SSC, it is hardly feasible to interpret separately with Lb(λ) because isolating Lb(λ) from Lu(λ) is difficult due to the optical complexity of a riverbed composed of various bed materials such as sand, gravel, rock, and vegetation [24]. Moreover, both Lc(λ) and Lb(λ) are affected by water depth. Thus, many previous studies tried to simplify the complex relationship between Lc(λ) and Lb(λ) and suggested simplified radiative transfer equations as follows [9,22,29]:
R r s λ = L u λ E d λ
L u λ E d λ = R λ 1 e K λ H + ρ b π e K λ H
where Rrs is the remotely sensed reflectance; Ed is the irradiance, R is the reflectance of an infinitely deep water column; H is the water column depth; K(λ) is the attenuation coefficient; and ρb is the bottom albedo, which is a distinctive characteristic depending on the bottom type. These equations show that the water body radiance exponentially increases with the attenuation coefficient and water depth as described in the first term on the right-hand side of Equation (3). This term has a maximum value when the water depth is assumed as an infinitely deep condition (Rrs(λ) = R(λ)). The second term describes the bottom reflectance, which is also expressed as K(λ) and H. The difference with the first term is that the bottom reflectance exponentially decreases as water depth H increases.
As indicated in Equation (3), the two major terms Lb(λ) and Lc(λ) are affected by various physical factors. The water body radiance Lc(λ) changes with sediment properties (particle size, density, mineral components, etc.) since R and K(λ) are influenced by both the inherent optical property of sediment particles (back-scattering) and light conditions of apparent optical properties [29,30,31,32]. The bottom radiance Lb(λ) varies significantly with bottom types because the bottom albedo ρb is generally characterized by the optical characteristics of bottom materials. Sediment properties can also affect the bottom radiance attributed to the attenuation coefficient K(λ), as shown in Equation (3). Consequently, the spectral characteristics of the riverbed and sediment can be considered as key factors to retrieve the SSC from spectral images.
To retrieve the SSC with varying sediment and bed types from remotely captured HSIs and selected multispectral images (MSIs), we employ an optimal band ratio analysis (OBRA) to analyze the relationships between the SSC and reflectance. OBRA is the method widely used for interpreting the optical attributes of a target variable and determining its appropriate spectral bands from multispectral data [21,33,34]. OBRA is encoded to extract effective spectral bands from HSI data by iteratively comparing the coefficient of determination (R2) between the SSC and band ratios of all combinable spectral band pairs. Based on the calculation results of R2, the best pairs of spectral bands with the highest correlation can be determined as effective spectral bands, which are used as input variables to estimate SSC. The process of OBRA is illustrated in Figure 3.
In this study, the SSC is estimated using a log-transformed single-band ratio as an independent variable as follows:
S S C ln R λ 1 R λ 2
where R is the total reflectance at a specific wavelength λ. After selecting the optimal band pairs with the highest accuracy of SSC regression on a band ratio, an OBRA-based linear regression model is constructed to predict SSC as follows:
S S C p = a X + b       X = ln R λ 1 R λ 2
where SSCp is the predicted SSC, and a and b are the regression coefficients.
This study compares the performance of SSC prediction between hyperspectral and multispectral approaches by using all spectral bands of HSI data and only using selected MSI data. We predict SSC with 3 different input spectral datasets of (1) HSI data; (2) MSI data of Landsat-9 bands; and (3) MSI data of Sentinel-2 bands. The multispectral bands (MSI data) are selected considering the band wavelengths of Landsat-9 and Sentinel-2, which are often used for the RS of suspended sediments in coastal and inland water [7,15,35]. However, the direct use of the satellite imagery in the study reach is not available since the channel width of the study reach is much smaller than the spatial resolution of the Sentinel-2 and Landsat-9 images. For this reason, we generate the MSI data equivalent to the spectral bands of the above satellite images using the field-measured HSI data at a spatial resolution of 1.89 cm as a following procedure. The input spectral data of the multispectral approaches for OBRA are produced by averaging the HSI band data to each corresponding band of the representative Landsat-9 and Sentinel-2 bands. For example, for the Landset-9 Band 1, which has a wavelength ranging 430–450 nm, the reflectance values of the corresponding HSI bands to the wavelength of 430–450 nm are arithmetically averaged and considered as an input reflectance of the Landset-9 Band 1 for OBRA. Each dataset consists of 4 cases depending on the sediment and bed types (Table 3), and multispectral bands are selected within the HSI wavelength range of 400–1000 nm to yield MSI data representing Landsat-9 and Sentinel-2 bands by repeating the above band-averaging process with HSI data for each case. Table 4 summarizes the MSI data and the HSI data used for OBRA.

3. Results and Discussion

3.1. Multispectral Retrieval of SSC

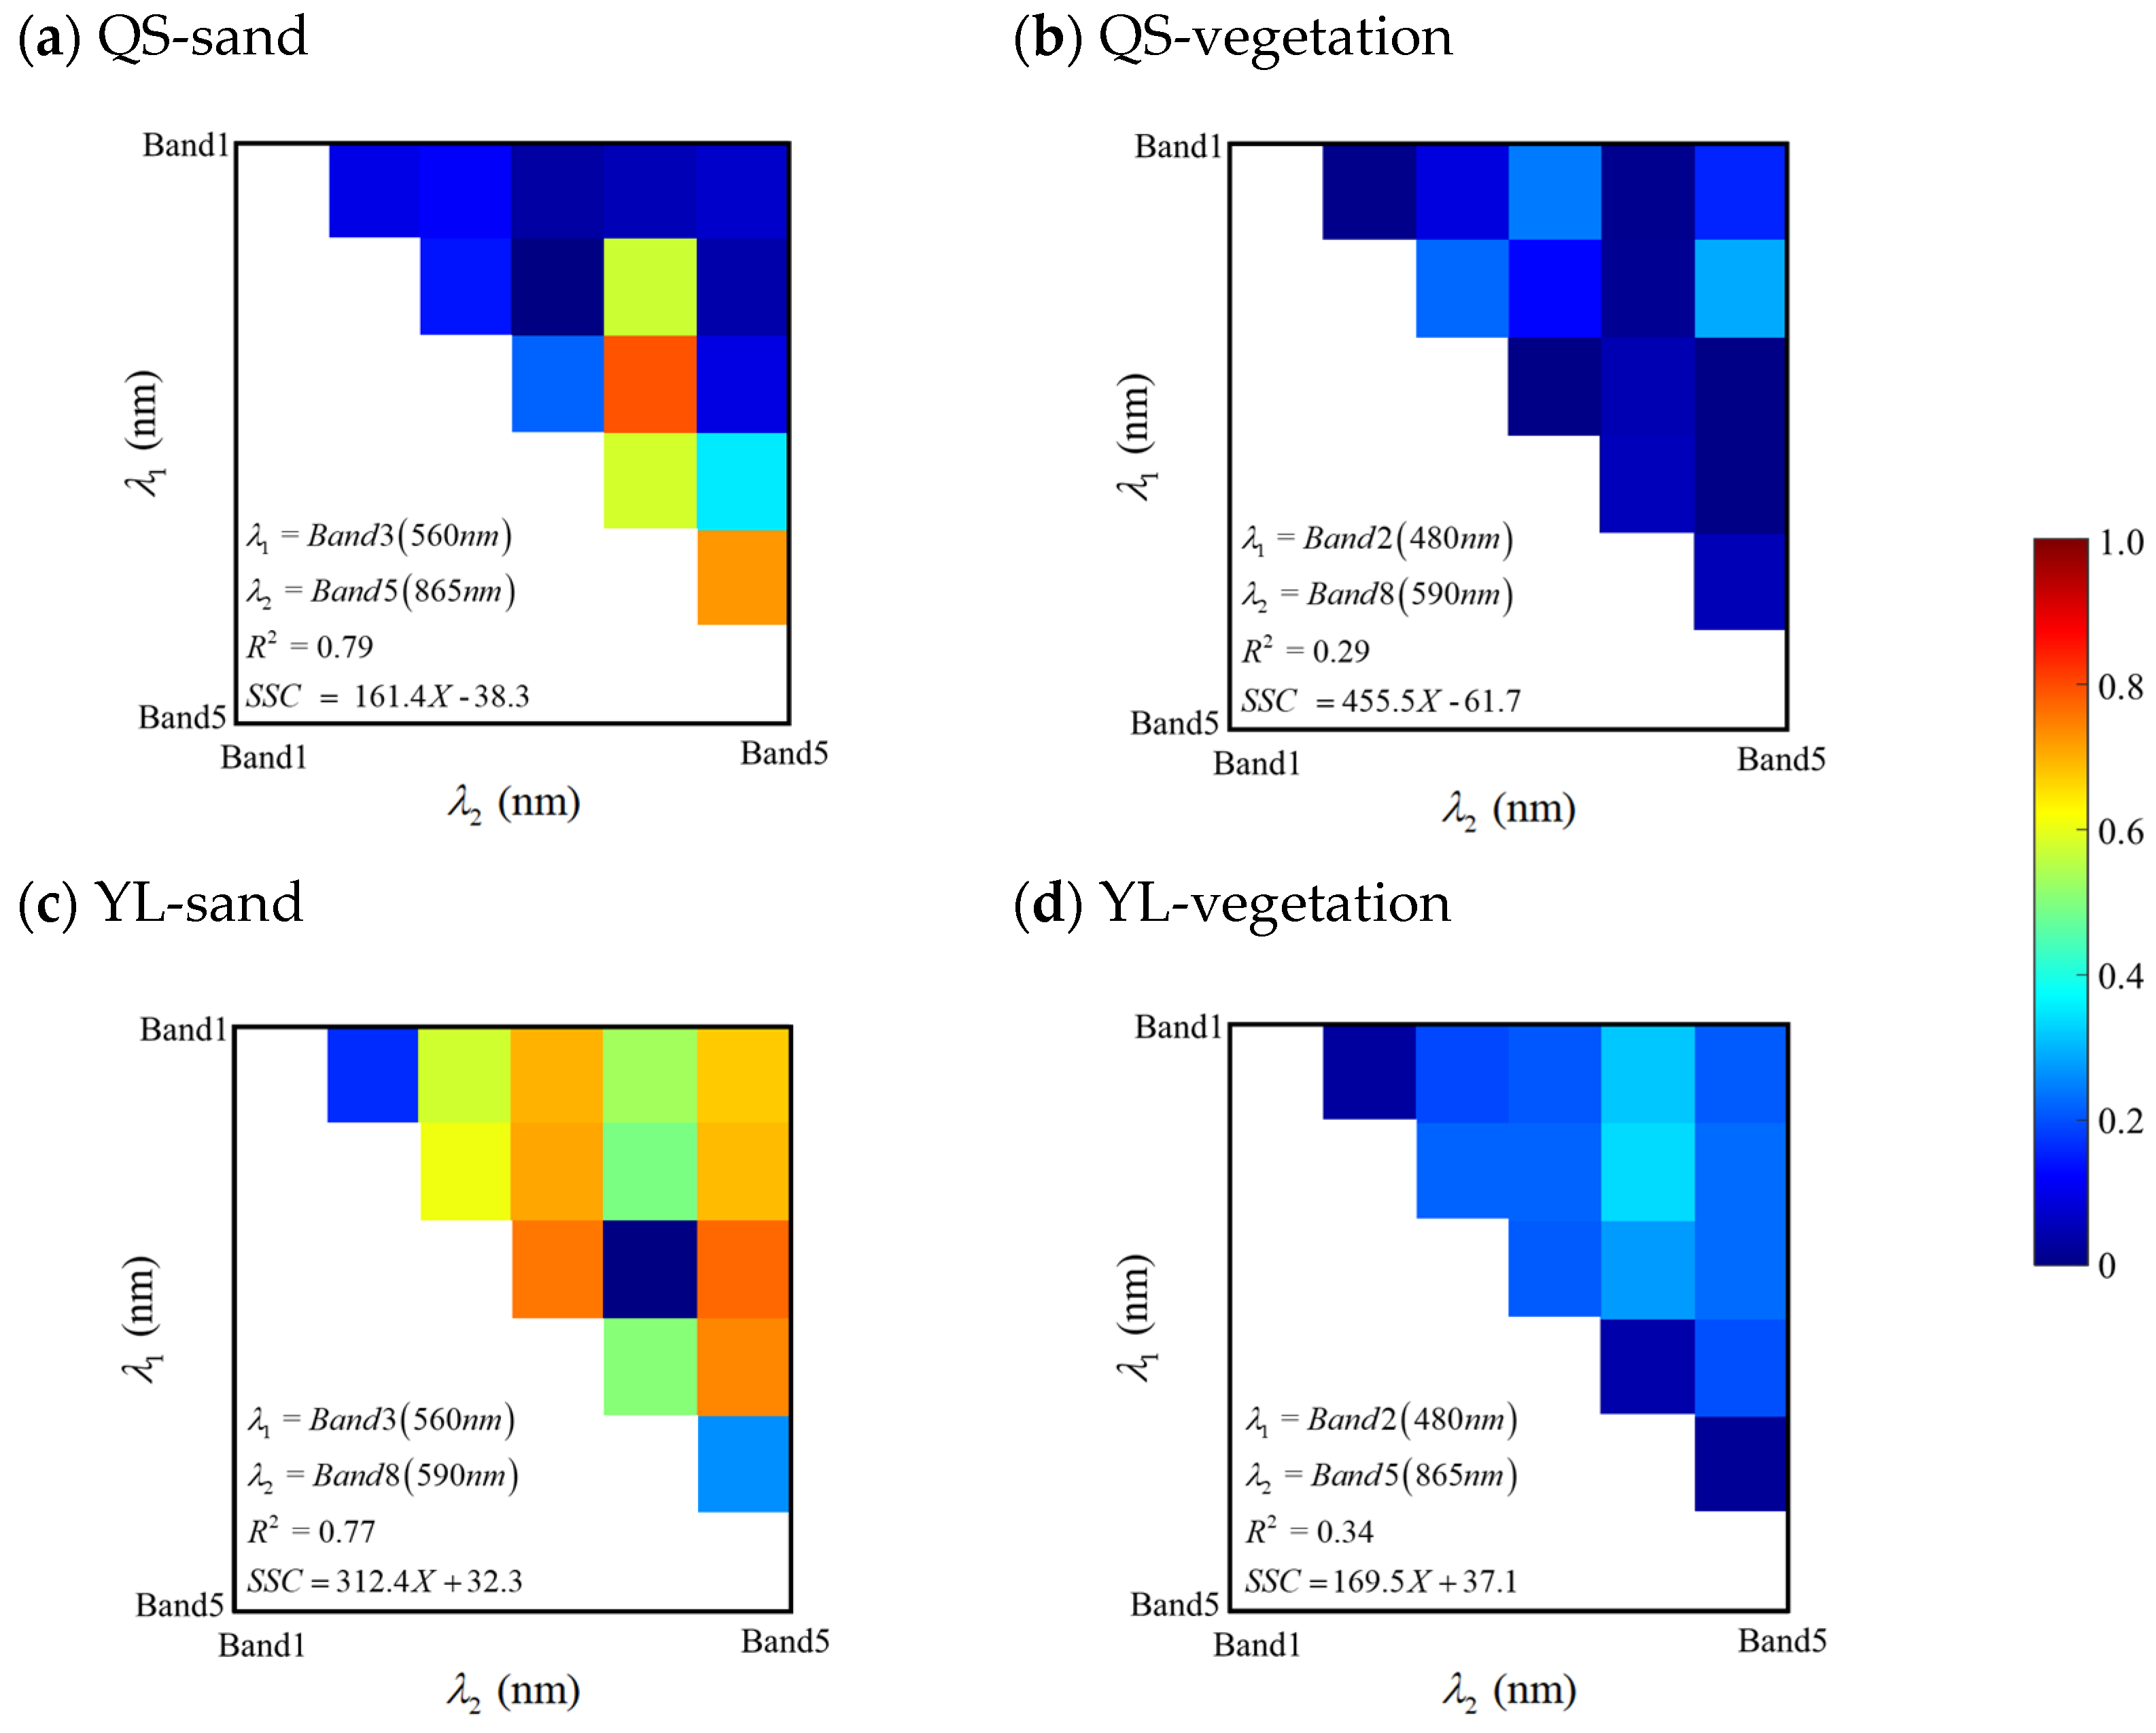
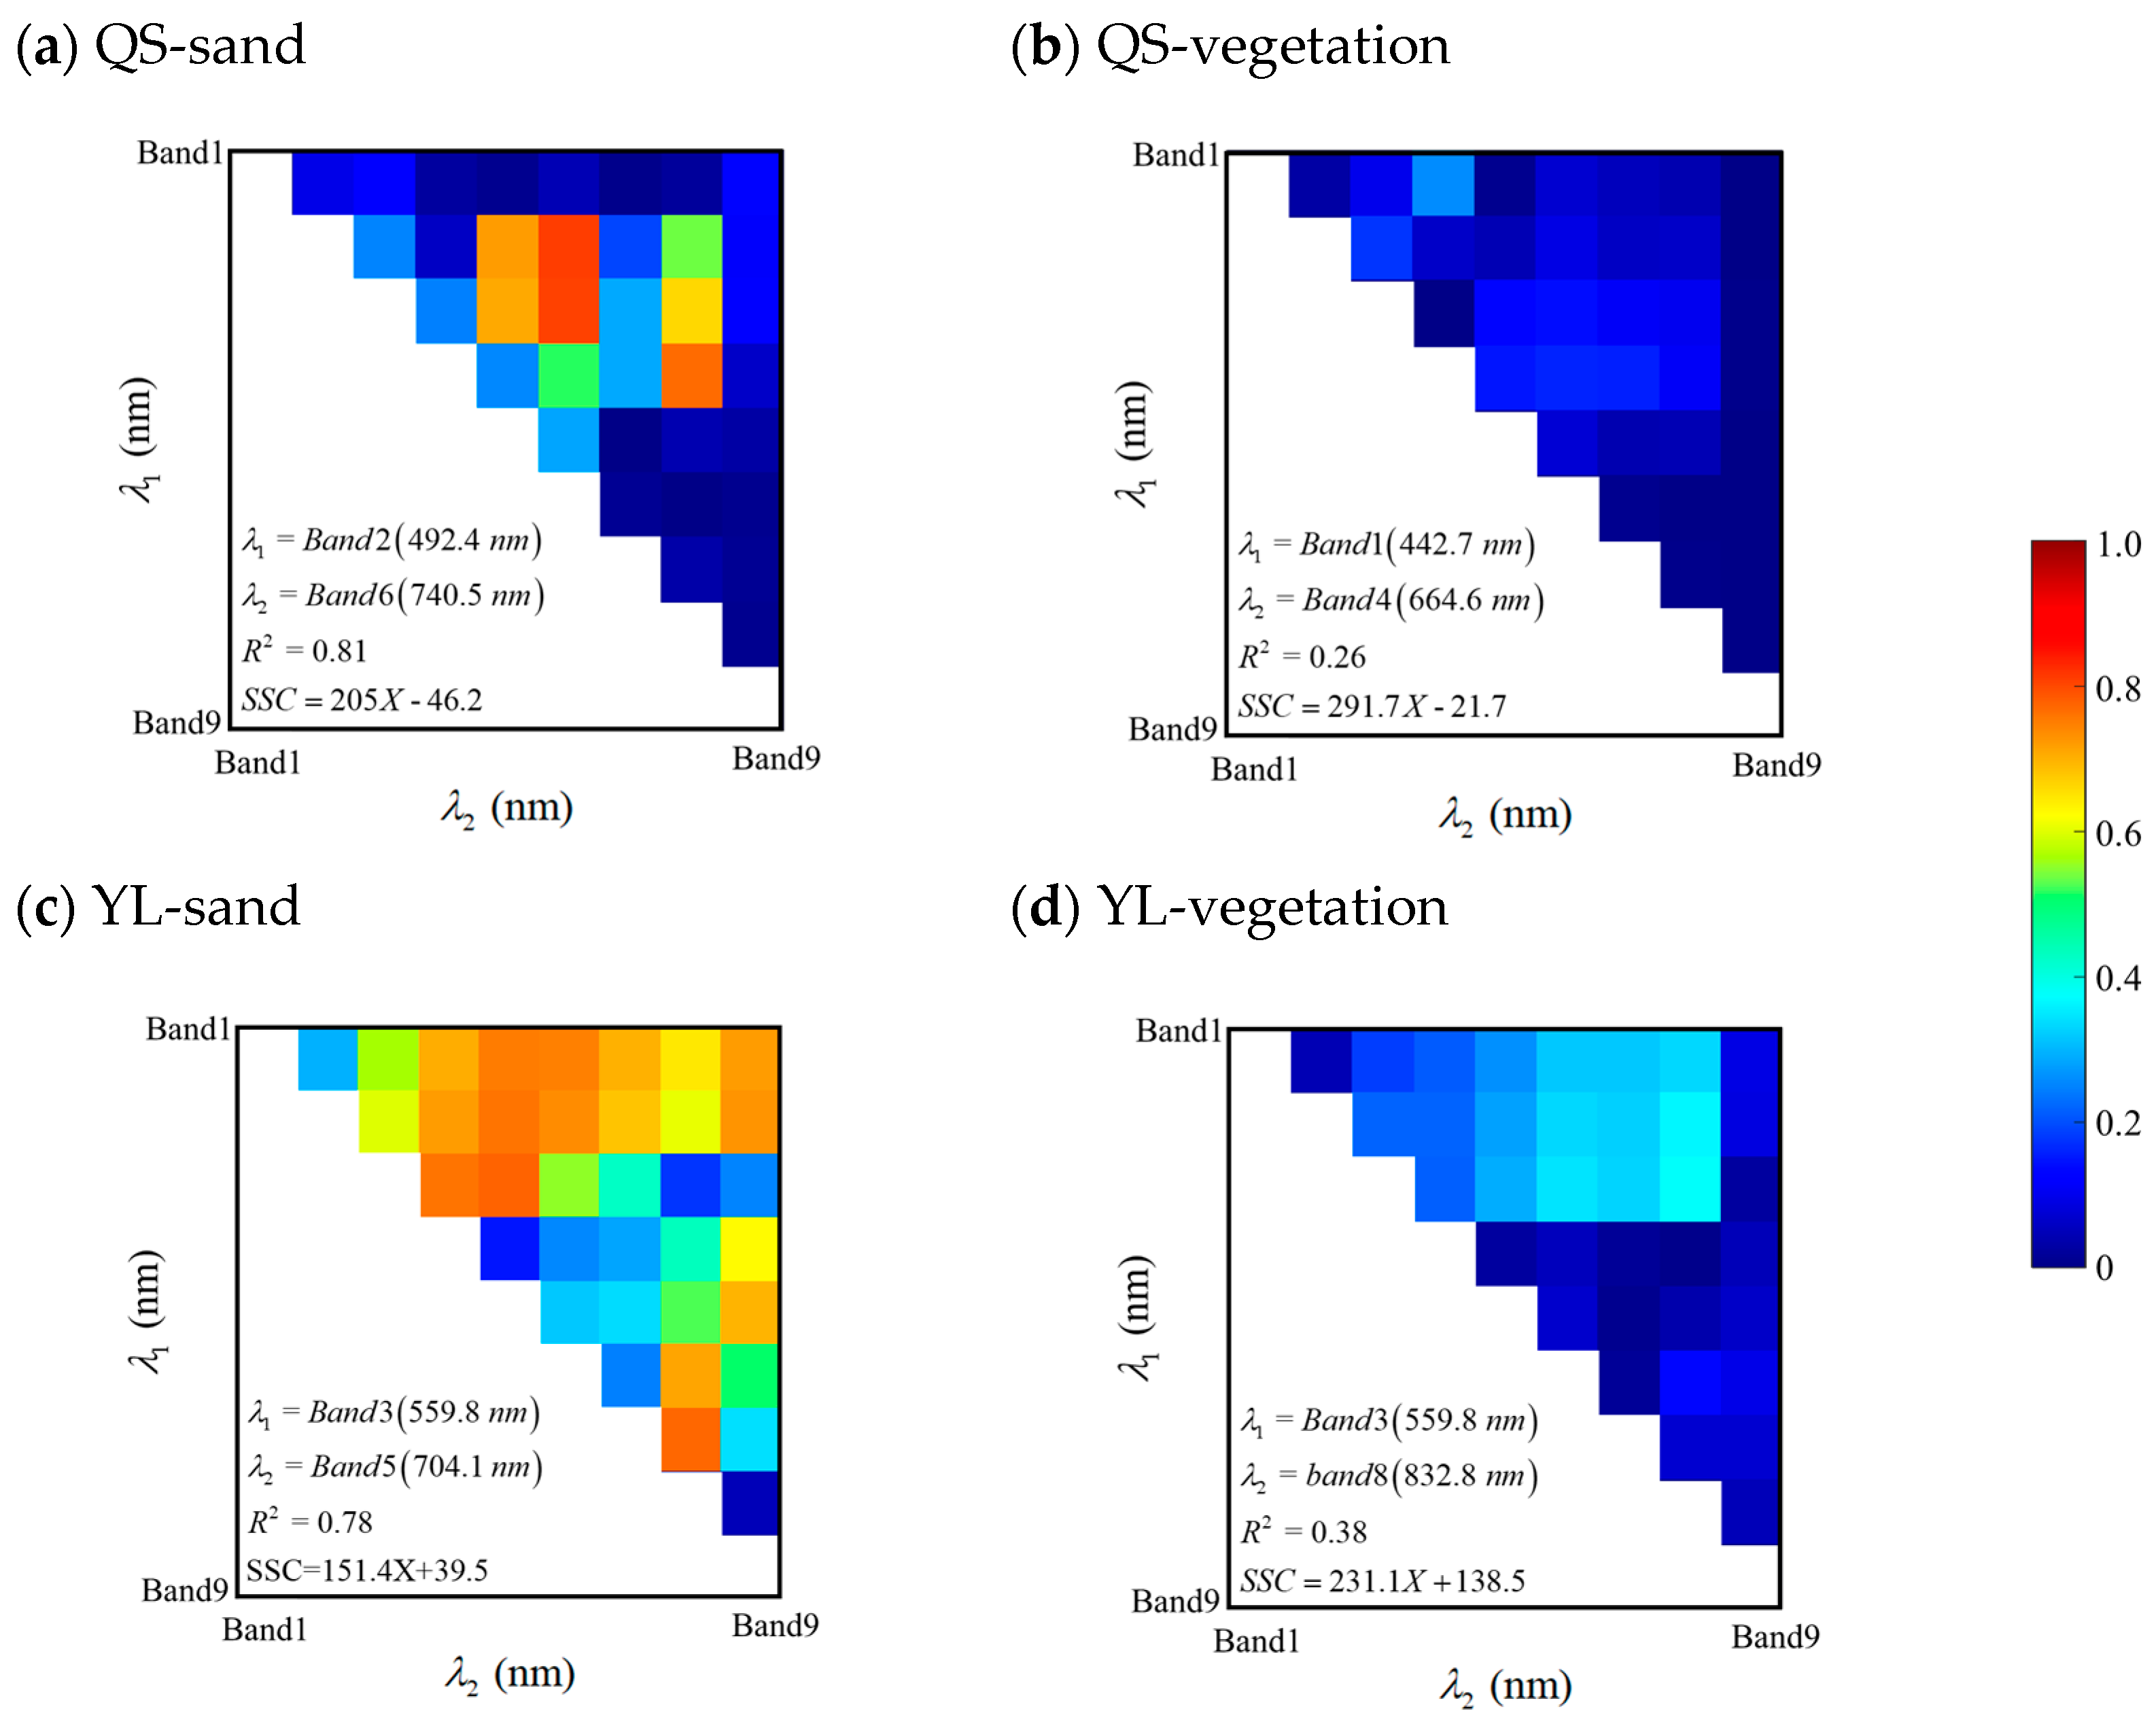
The OBRA results with MSI data to derive effective spectral bands for the study cases are shown in Figure 4 and Figure 5 that indicate R2 maps, which describe the correlation between the measured SSC and log-transformed single-band ratios with all possible pairs of the Landsat-9 and Sentinel-2 bands. According to these figures, R2 values significantly differ depending on a change in the bed type. The sand bed cases show a satisfactory level of prediction accuracy with an R2 of 0.77–0.82, while a relatively low accuracy (R2 of 0.26–0.38) is obtained from the cases of a vegetated bed. This result demonstrates that vegetation is a factor that distorts the relationship between the SSC and total reflectance, magnifying the contribution of bottom reflectance in the UAV-measured total reflectance used as a predictor of SSC [36]. In specific, turbulence near the riverbed causes vegetation to move randomly, and this phenomenon can induce high levels of noise in the total reflectance, whereas a sand bed is relatively stable against turbulent flow. Thus, the non-fixed bottom condition of a vegetated bed results in temporally non-stationary bottom reflectance, thereby leading to low R2 values in estimating the concentration of both QS and YL cases, even if the YL case shows slightly higher R2 values due to its inherently brighter characteristics [21]. Nevertheless, the sediment type is less sensitive to the correlation between the SSC and reflectance compared to the bed type. Some previous field-based RS research also reported that a bottom reflectance induced by vegetation cover substantially affects the spectral characteristics of a water body in shallow water, thereby complicating the interaction between reflectance and target matters [20,36]. Kwon et al. (2023b) [21] investigated the impact of sediment and bottom characteristics on the RS of SSC by decomposing the fraction of the sediment signal and bottom signal from total reflectance. This study demonstrated that the fraction of the bottom signal is much larger than that of the sediment signal in the vegetated bed, and this behavior decorrelated the relationship between the total reflectance and measured SSC in the shallow and vegetated rivers.
From the OBRA results, we notice a difference in selecting effective spectral bands for each case. SSC estimation with the Landsat-9 and Sentinel-2 bands results in no significant difference in the R2 values. For the effective spectral bands, both the multispectral approaches show a similar trend that one of the effective bands is in blue (band 2 for Landsat-9 and band 1, 2 for Sentinel-2) or green bands (band 3 for Landsat-9 and Sentinel-2) and another band is in red (band 4 for Landsat-9 and Sentinel-2), red-edge (band 5, 6 for Sentinel-2), and near-infrared (band 5 for Landsat-9 and band 7, 8 for Sentinel-2). However, some discrepancy is found in selecting red bands between the two multispectral methods. This is because Sentinel-2 has a fine spectral resolution near the red bands, while Landsat-9 is constrained to a coarse spectral resolution near the red bands with a wide wavelength range of band 8 (panchromatic band: 500–680 nm).

3.2. Hyperspectral Retrieval of SSC

The OBRA results based on HSI data are displayed in Figure 6. The overall aspects of both the correlation and effective spectral bands show similar trends with the MSI data-based OBRA results. The hyperspectral approach exhibits combinations of blue or green and red-related spectral bands for the effective spectral bands. Also, the R2 values decrease noticeably with the emergence of vegetation cover on the streambed. Specifically, the sand bed cases characterized as temporally homogeneous conditions of bottom reflectance present higher prediction accuracy with an R2 of 0.80–0.82 compared to those (R2 of 0.35–0.39) of the vegetated bed cases, honoring the reduced impact of bottom reflectance on RS-measured total radiance, as previously explained in the section of multispectral SSC retrieval. This result reveals that the bottom type exerts a more significant control than the sediment type on not only the multispectral SSC estimation but also the hyperspectral SSC estimation.
The hyperspectral approach uses a much larger number of spectral bands (150 bands) than the multispectral approaches, allowing us to identify a high R2 area at a high resolution, as shown in Figure 6. The difference between effective spectral bands of the MSI and HSI data is approximately less than 100 nm and shows a roughly similar tendency in the R2 values across the band pairs. For all the study cases, relatively high values of R2 mainly appear within 500–800 nm (Figure 6). The discrepancy of the selected effective bands between QS and YL can be explained by the difference in the intrinsic optical properties of each sediment type. Notice that the optimal band ratios differ substantially with a change in bed type, and this trend is also observed in the multispectral approaches (Figure 5).
According to the bed type, different interactions between back-scattering reflectance and bottom reflectance lead to the different selection of optimal wavelengths in OBRA. In the sand bed conditions, the back-scattered reflectance from the injected sediments controls the total reflectance more dominantly than bottom reflectance because the sand bed generates spectrally homogeneous bottom conditions. Both the suspended sediments and sand bed exhibit similar optical characteristics; however, the suspended sediments hinder the bottom signal and are less attenuated by the water column. This relatively strong back-scattered reflectance results in a high correlation between the SSC and total reflectance. In the same context, OBRA determines effective spectral bands at the wavelength sensitive to the back-scattered reflectance for the sand bed cases. While for the vegetated bed cases, OBRA is encoded to seek effective bands at the wavelength, where the effect of bottom reflectance on total reflectance is minimized relatively to back-scattered reflectance since the temporally changing bottom reflectance associated with the arbitrary movement of vegetation induced by near-bed turbulence weakens the correlation between the SSC and total reflectance.
The comparison results with the multispectral approaches indicate that the hyperspectral approach shows an overall better performance in estimating the SSC for all the study cases. This can be confirmed with the improved R2 values obtained from the HSI data against the MSI data. Here, the largest difference of 0.09 between the MSI data of the Sentinel-2 bands and the HSI data is observed in the cases of QS with a vegetated bed, and the mean absolute percent error (MAPE) decreases to around 7% in the QS–vegetation case, as shown in Table 5. In addition, the MAPE values for all the study cases decrease with the difference increasing up to about 9% between the hyperspectral approach and the multispectral approach based on the Landsat-9 bands. Especially in the vegetated bed cases, prediction accuracy is improved with the HSI data because the hyperspectral approach is advantageous of specifying effective spectral bands at a high spectral resolution. This advantage allows us to more precisely extract the spectral bands which most constrain the impact of vegetation-induced bottom reflectance on total reflectance for retaining a strong correlation between the SSC and total reflectance. A relatively high MAPE is found in the YL cases owing to the large fluctuation in the measured YL concentration (Table 3) resulting from the material properties of YL. The fine and cohesive YL sediments might experience adsorption/desorption processes more frequently and resuspend to a water body more actively than coarse and cohesionless QS sediments [37]. Moreover, YL sediments could be more affected by turbulence while they transport in the flowing water body due to the small particle size, and turbulent diffusion stimulates the random motion and resuspension of the suspended particles [38]. Thus, the complex physical interplay between settling, resuspension, adsorption/desorption, and turbulent diffusion possibly contributes to the aforementioned strong variability of YL concentration as well as high levels of noise in the total reflectance.
In spite of the meaningful findings from the hyperspectral application to SSC retrieval, the hyperspectral approach and the multispectral approaches incorporated with the Landsat-9 and Sentinel-2 bands both demonstrate satisfactory performance in estimating the SSC, especially for spectrally homogeneous bottom conditions. In perspective of cost efficiency, therefore, the use of hyperspectral data in SSC estimation should be carefully considered, although the hyperspectral SSC retrieval shows an overall better performance relative to the multispectral approaches. If the sufficient spectral specification of optical sensors for a target matter is achieved, the multispectral approaches are also capable of accurately reproducing SSC distributions in a water body less affected by bottom reflectance, such as the sand bed cases of this study [39]. However, effective spectral bands and the predictive equations derived from OBRA highly depend on both sediment and bottom types. This result interprets that the additional efforts to control the spectral variability arising from streambed conditions in shallow water are required to resolve the locality problem for its global application.

4. Conclusions

This study compared the performance of hyperspectral imaging with that of multispectral imaging in estimating the SSC in riverine environments. We carried out field-scale tracer experiments and measured radiance from a water body, where suspended sediments are artificially injected, using UAV-mounted hyperspectral sensors with 150 spectral bands. In the experiments, the riverbed and sediment types were considered as controlling factors for quantifying the effect of bottom reflectance and the inherent optical properties of sediments on SSC retrieval in rivers. We could successfully estimate the concentration of quartz sand and yellow loess using OBRA in the condition of shallow water overlying the sand bed. The key findings from this work can be summarized as:
Both multispectral and hyperspectral approaches accurately estimated the variability of SSC in the non-vegetated bed condition with an R2 of about 0.8, while a larger discrepancy between estimation and observation was found in YL compared to QS due to a relatively high fluctuation in SSC associated with its smaller particle size.
The hyperspectral approach exhibited superior performance in estimating the SSC in the vegetated bed conditions, honoring its higher spectral resolution, which is effective to define the effective spectral bands maximizing the back-scattering signal from suspended sediments while minimizing bottom reflectance. However, prediction accuracy decreased substantially in the vegetated bed because vegetation cover induces the inhomogeneous optical conditions of the riverbed.
Despite the aforementioned advantages of the hyperspectral approach in the vegetated bed conditions, a similar performance was found in estimating the SSC in the non-vegetated bed conditions when comparing the hyperspectral data to the multispectral data corresponding to the Landsat-9 and Sentinel-2 bands.
Consequently, the present work elucidated that the riverbed conditions significantly impact RS-based SSC monitoring in shallow rivers since vegetation cover on the riverbed distorts the relationship between the SSC and total reflectance, exacerbating the effect of bottom reflectance in estimating the SSC. Even though the hyperspectral imaging showed an overall better performance for SSC estimation under the vegetated bed conditions due to its high spectral resolution compared to the multispectral imaging, the results of SSC estimation in this study revealed that a global or stationary regression model is limited in resolving the spatio-temporally varying spectral properties of a water body, particularly caused by the bottom reflectance of the riverbed in the shallow water conditions. To address this constraint of the global regression model, some papers combined clustering approaches with regression and successfully enhanced the transferability of regression models under optically complex conditions by classifying spectrally different bottoms [19,40]. Using machine learning regression can be beneficial in extracting important features that explain the optical variability of the water body from various spectral bands to address the spectral heterogeneity of the riverbed. However, these advanced approaches still require further assessment to be developed into a comprehensive global regression model applicable to both multispectral and hyperspectral data. Therefore, an important next step of this study would be to integrate and evaluate a broader range of approaches for resolving the spatio-temporal changes in the optical features of a water body, thereby enabling more accurate estimations of SSC in rivers.

Author Contributions

Conceptualization and methodology, J.S.K., S.K. and I.W.S.; formal analysis, S.H.J. and J.S.K.; writing—original draft preparation, S.H.J., J.S.K. and S.K.; writing—review and editing, J.S.K., S.K. and I.W.S.; visualization, S.H.J. and S.K.; funding acquisition, S.H.J. and I.W.S. All authors have read and agreed to the published version of the manuscript.

Funding

This research was funded by the Basic Science Research Program through the National Research Foundation of Korea (NRF), Ministry of Education (2021R1A6A3A01088484).

Data Availability Statement

The data used in this study are available upon request from the corresponding author.

Acknowledgments

The authors acknowledge support from the Civil and Environmental Engineering Research Center at Hankyong National University, Anseong-si, Korea.

Conflicts of Interest

The authors declare no conflicts of interest.

References

  1. Bilotta, G.S.; Brazier, R.E. Understanding the influence of suspended solids on water quality and aquatic biota. Water Res. 2008, 42, 2849–2861. [Google Scholar] [CrossRef] [PubMed]
  2. Szupiany, R.N.; Amsler, M.L.; Parsons, D.R.; Best, J.L. Morphology, flow structure, and suspended bed sediment transport at two large braid-bar confluences. Water Resour. Res. 2009, 45, W05415. [Google Scholar] [CrossRef]
  3. Vercruysse, K.; Grabowski, R.C.; Rickson, R.J. Suspended sediment transport dynamics in rivers: Multi-scale drivers of temporal variation. Earth-Sci. Rev. 2017, 166, 38–52. [Google Scholar] [CrossRef]
  4. Kwon, S.; Seo, I.W.; Lyu, S. Investigating mixing patterns of suspended sediment in a river confluence using high-resolution hyperspectral imagery. J. Hydrol. 2023, 620, 129505. [Google Scholar] [CrossRef]
  5. Minella, J.P.; Merten, G.H.; Reichert, J.M.; Clarke, R.T. Estimating suspended sediment concentrations from turbidity measurements and the calibration problem. Hydrol. Process. 2008, 22, 1819–1830. [Google Scholar] [CrossRef]
  6. Haun, S.; Rüther, N.; Baranya, S.; Guerrero, M. Comparison of real time suspended sediment transport measurements in river environment by LISST instruments in stationary and moving operation mode. Flow Meas. Instrum. 2015, 41, 10–17. [Google Scholar] [CrossRef]
  7. Zhang, C.; Liu, Y.; Chen, X.; Gao, Y. Estimation of suspended sediment concentration in the yangtze main stream based on sentinel-2 MSI data. Remote Sens. 2022, 14, 4446. [Google Scholar] [CrossRef]
  8. Kutser, T.; Pierson, D.C.; Tranvik, L.; Reinart, A.; Sobek, S.; Kallio, K. Using satellite remote sensing to estimate the colored dissolved organic matter absorption coefficient in lakes. Ecosystem 2005, 8, 709–720. [Google Scholar] [CrossRef]
  9. Volpe, V.; Silvestri, S.; Marani, M. Remote sensing retrieval of suspended sediment concentration in shallow waters. Remote Sens. Environ. 2011, 115, 44–54. [Google Scholar] [CrossRef]
  10. Kim, J.S.; Seo, I.W.; Baek, D. Modeling spatial variability of harmful algal bloom in regulated rivers using a depth-averaged 2D numerical model. J. Hydro-Environ. Res. 2018, 20, 63–76. [Google Scholar] [CrossRef]
  11. Legleiter, C.J.; Roberts, D.A.; Marcus, W.A.; Fonstad, M.A. Passive optical remote sensing of river channel morphology and in-stream habitat: Physical basis and feasibility. Remote Sens. Environ. 2004, 93, 493–510. [Google Scholar] [CrossRef]
  12. Doxaran, D.; Froidefond, J.M.; Castaing, P.A. reflectance band ratio used to estimate suspended matter concentrations in sediment-dominated coastal waters. Int. J. Remote Sens. 2002, 23, 5079–5085. [Google Scholar] [CrossRef]
  13. Cao, B.; Qiu, J.; Zhang, W.; Xie, X.; Lu, X.; Yang, X.; Li, H. Retrieval of suspended sediment concentrations in the Pearl River estuary using multi-source satellite imagery. Remote Sens. 2022, 14, 3896. [Google Scholar] [CrossRef]
  14. Zhang, M.; Dong, Q.; Cui, T.; Xue, C.; Zhang, S. Suspended sediment monitoring and assessment for Yellow River estuary from Landsat TM and ETM+ imagery. Remote Sens. Environ. 2014, 146, 136–147. [Google Scholar] [CrossRef]
  15. Pham, Q.V.; Ha, N.T.T.; Pahlevan, N.; Oanh, L.T.; Nguyen, T.B.; Nguyen, N.T. Using Landsat-8 images for quantifying suspended sediment concentration in Red River (Northern Vietnam). Remote Sens. 2018, 10, 1841. [Google Scholar] [CrossRef]
  16. Kudela, R.M.; Palacios, S.L.; Austerberry, D.C.; Accorsi, E.K.; Guild, L.S.; Torres-Perez, J. Application of hyperspectral remote sensing to cyanobacterial blooms in inland waters. Remote Sens. Environ. 2015, 167, 196–205. [Google Scholar] [CrossRef]
  17. Kwon, S.; Shin, J.; Seo, I.W.; Noh, H.; Jung, S.H.; You, H. Measurement of suspended sediment concentration in open channel flows based on hyperspectral imagery from UAVs. Adv. Water Resour. 2022, 159, 104076. [Google Scholar] [CrossRef]
  18. Legleiter, C.J.; Fosness, R.L. Defining the limits of spectrally based bathymetric mapping on a large river. Remote Sens. 2019, 11, 665. [Google Scholar] [CrossRef]
  19. Kwon, S.; Seo, I.W.; Noh, H.; Kim, B. Hyperspectral retrievals of suspended sediment using cluster-based machine learning regression in shallow waters. Sci. Total Environ. 2022, 833, 155168. [Google Scholar] [CrossRef]
  20. Gwon, Y.; Kwon, S.; Kim, D.; Seo, I.W.; You, H. Estimation of shallow stream bathymetry under varying suspended sediment concentrations and compositions using hyperspectral imagery. Geomorphology 2023, 433, 108722. [Google Scholar] [CrossRef]
  21. Kwon, S.; Noh, H.; Seo, I.W.; Park, Y.S. Effects of spectral variability due to sediment and bottom characteristics on remote sensing for suspended sediment in shallow rivers. Sci. Total Environ. 2023, 878, 163125. [Google Scholar] [CrossRef]
  22. Lee, Z.; Carder, K.L.; Mobley, C.D.; Steward, R.G.; Patch, J.S. Hyperspectral remote sensing for shallow waters: 2. Deriving bottom depths and water properties by optimization. Appl. Opt. 1999, 38, 3831–3843. [Google Scholar] [CrossRef]
  23. Leathers, R.A.; Downes, T.V.; Priest, R.G. Scene-based nonuniformity corrections for optical and SWIR pushbroom sensors. Opt. Express 2005, 13, 5136–5150. [Google Scholar] [CrossRef] [PubMed]
  24. Baek, D.; Seo, I.W.; Kim, J.S.; Nelson, J.M. UAV-based measurements of spatio-temporal concentration distributions of fluorescent tracers in open channel flows. Adv. Water Resour. 2019, 127, 76–88. [Google Scholar] [CrossRef]
  25. Caballero, I.; Steinmetz, F.; Navarro, G. Evaluation of the first year of operational Sentinel-2A data for retrieval of suspended solids in medium-to high-turbidity waters. Remote Sens. 2018, 10, 982. [Google Scholar] [CrossRef]
  26. Martins, V.S.; Barbosa, C.C.F.; De Carvalho, L.A.S.; Jorge, D.S.F.; Lobo, F.D.L.; Novo, E.M.L.D.M. Assessment of atmospheric correction methods for Sentinel-2 MSI images applied to Amazon floodplain lakes. Remote Sens. 2017, 9, 322. [Google Scholar] [CrossRef]
  27. Legleiter, C.J.; Mobley, C.D.; Overstreet, B.T. A framework for modeling connections between hydraulics, water surface roughness, and surface reflectance in open channel flows. J. Geophys. Res. Earth Surf. 2017, 122, 1715–1741. [Google Scholar] [CrossRef]
  28. Overstreet, B.T.; Legleiter, C.J. Removing sun glint from optical remote sensing images of shallow rivers. Earth Surf. Process. Landf. 2017, 42, 318–333. [Google Scholar] [CrossRef]
  29. Pinet, S.; Martinez, J.M.; Ouillon, S.; Lartiges, B.; Villar, R.E. Variability of apparent and inherent optical properties of sediment-laden waters in large river basins–lessons from in situ measurements and bio-optical modeling. Opt. Express 2017, 25, A283–A310. [Google Scholar] [CrossRef]
  30. Olmanson, L.G.; Brezonik, P.L.; Bauer, M.E. Airborne hyperspectral remote sensing to assess spatial distribution of water quality characteristics in large rivers: The Mississippi River and its tributaries in Minnesota. Remote Sens. Environ. 2013, 130, 254–265. [Google Scholar] [CrossRef]
  31. Fan, Y.; Li, W.; Calzado, V.S.; Trees, C.; Stamnes, S.; Fournier, G.; McKee, D.; Stamnes, K. Inferring inherent optical properties and water constituent profiles from apparent optical properties. Opt. Express 2015, 23, A987–A1009. [Google Scholar] [CrossRef] [PubMed]
  32. Wong, J.; Liew, S.C.; Wong, E.; Lee, Z. Modeling the remote-sensing reflectance of highly turbid waters. Appl. Opt. 2019, 58, 2671–2677. [Google Scholar] [CrossRef] [PubMed]
  33. Legleiter, C.J.; Roberts, D.A. A forward image model for passive optical remote sensing of river bathymetry. Remote Sens. Environ. 2009, 113, 1025–1045. [Google Scholar] [CrossRef]
  34. Niroumand-Jadidi, M.; Bovolo, F.; Bruzzone, L. SMART-SDB: Sample-specific multiple band ratio technique for satellite-derived bathymetry. Remote Sens. Environ. 2020, 251, 112091. [Google Scholar] [CrossRef]
  35. Marinho, R.R.; Harmel, T.; Martinez, J.M.; Filizola Junior, N.P. Spatiotemporal dynamics of suspended sediments in the Negro River, Amazon Basin, from in situ and Sentinel-2 remote sensing data. ISPRS Int. J. Geo-Inf. 2021, 10, 86. [Google Scholar] [CrossRef]
  36. Kim, J.S.; Baek, D.; Seo, I.W.; Shin, J. Retrieving shallow stream bathymetry from UAV-assisted RGB imagery using a geospatial regression method. Geomorphology 2019, 341, 102–114. [Google Scholar] [CrossRef]
  37. Fan, J.Y.; He, X.Y.; Wang, D.Z. Experimental study on the effects of sediment size and porosity on contaminant adsorption/desorption and interfacial diffusion characteristics. J. Hydrodyn. 2013, 25, 20–26. [Google Scholar] [CrossRef]
  38. Wondzell, S.M.; Gooseff, M.N. Geomorphic controls on hyporheic exchange across scales: Watersheds to particles. In Treatise on Geomorphology; Elsevier: Amsterdam, The Netherlands, 2013; pp. 203–218. [Google Scholar]
  39. Zhou, X.; Marani, M.; Albertson, J.D.; Silvestri, S. Hyperspectral and multispectral retrieval of suspended sediment in shallow coastal waters using semi-analytical and empirical methods. Remote Sens. 2017, 9, 393. [Google Scholar] [CrossRef]
  40. Kwon, S.; Gwon, Y.; Kim, D.; Seo, I.W.; You, H. Unsupervised Classification of Riverbed Types for Bathymetry Mapping in Shallow Rivers Using UAV-Based Hyperspectral Imagery. Remote Sens. 2023, 15, 2803. [Google Scholar] [CrossRef]
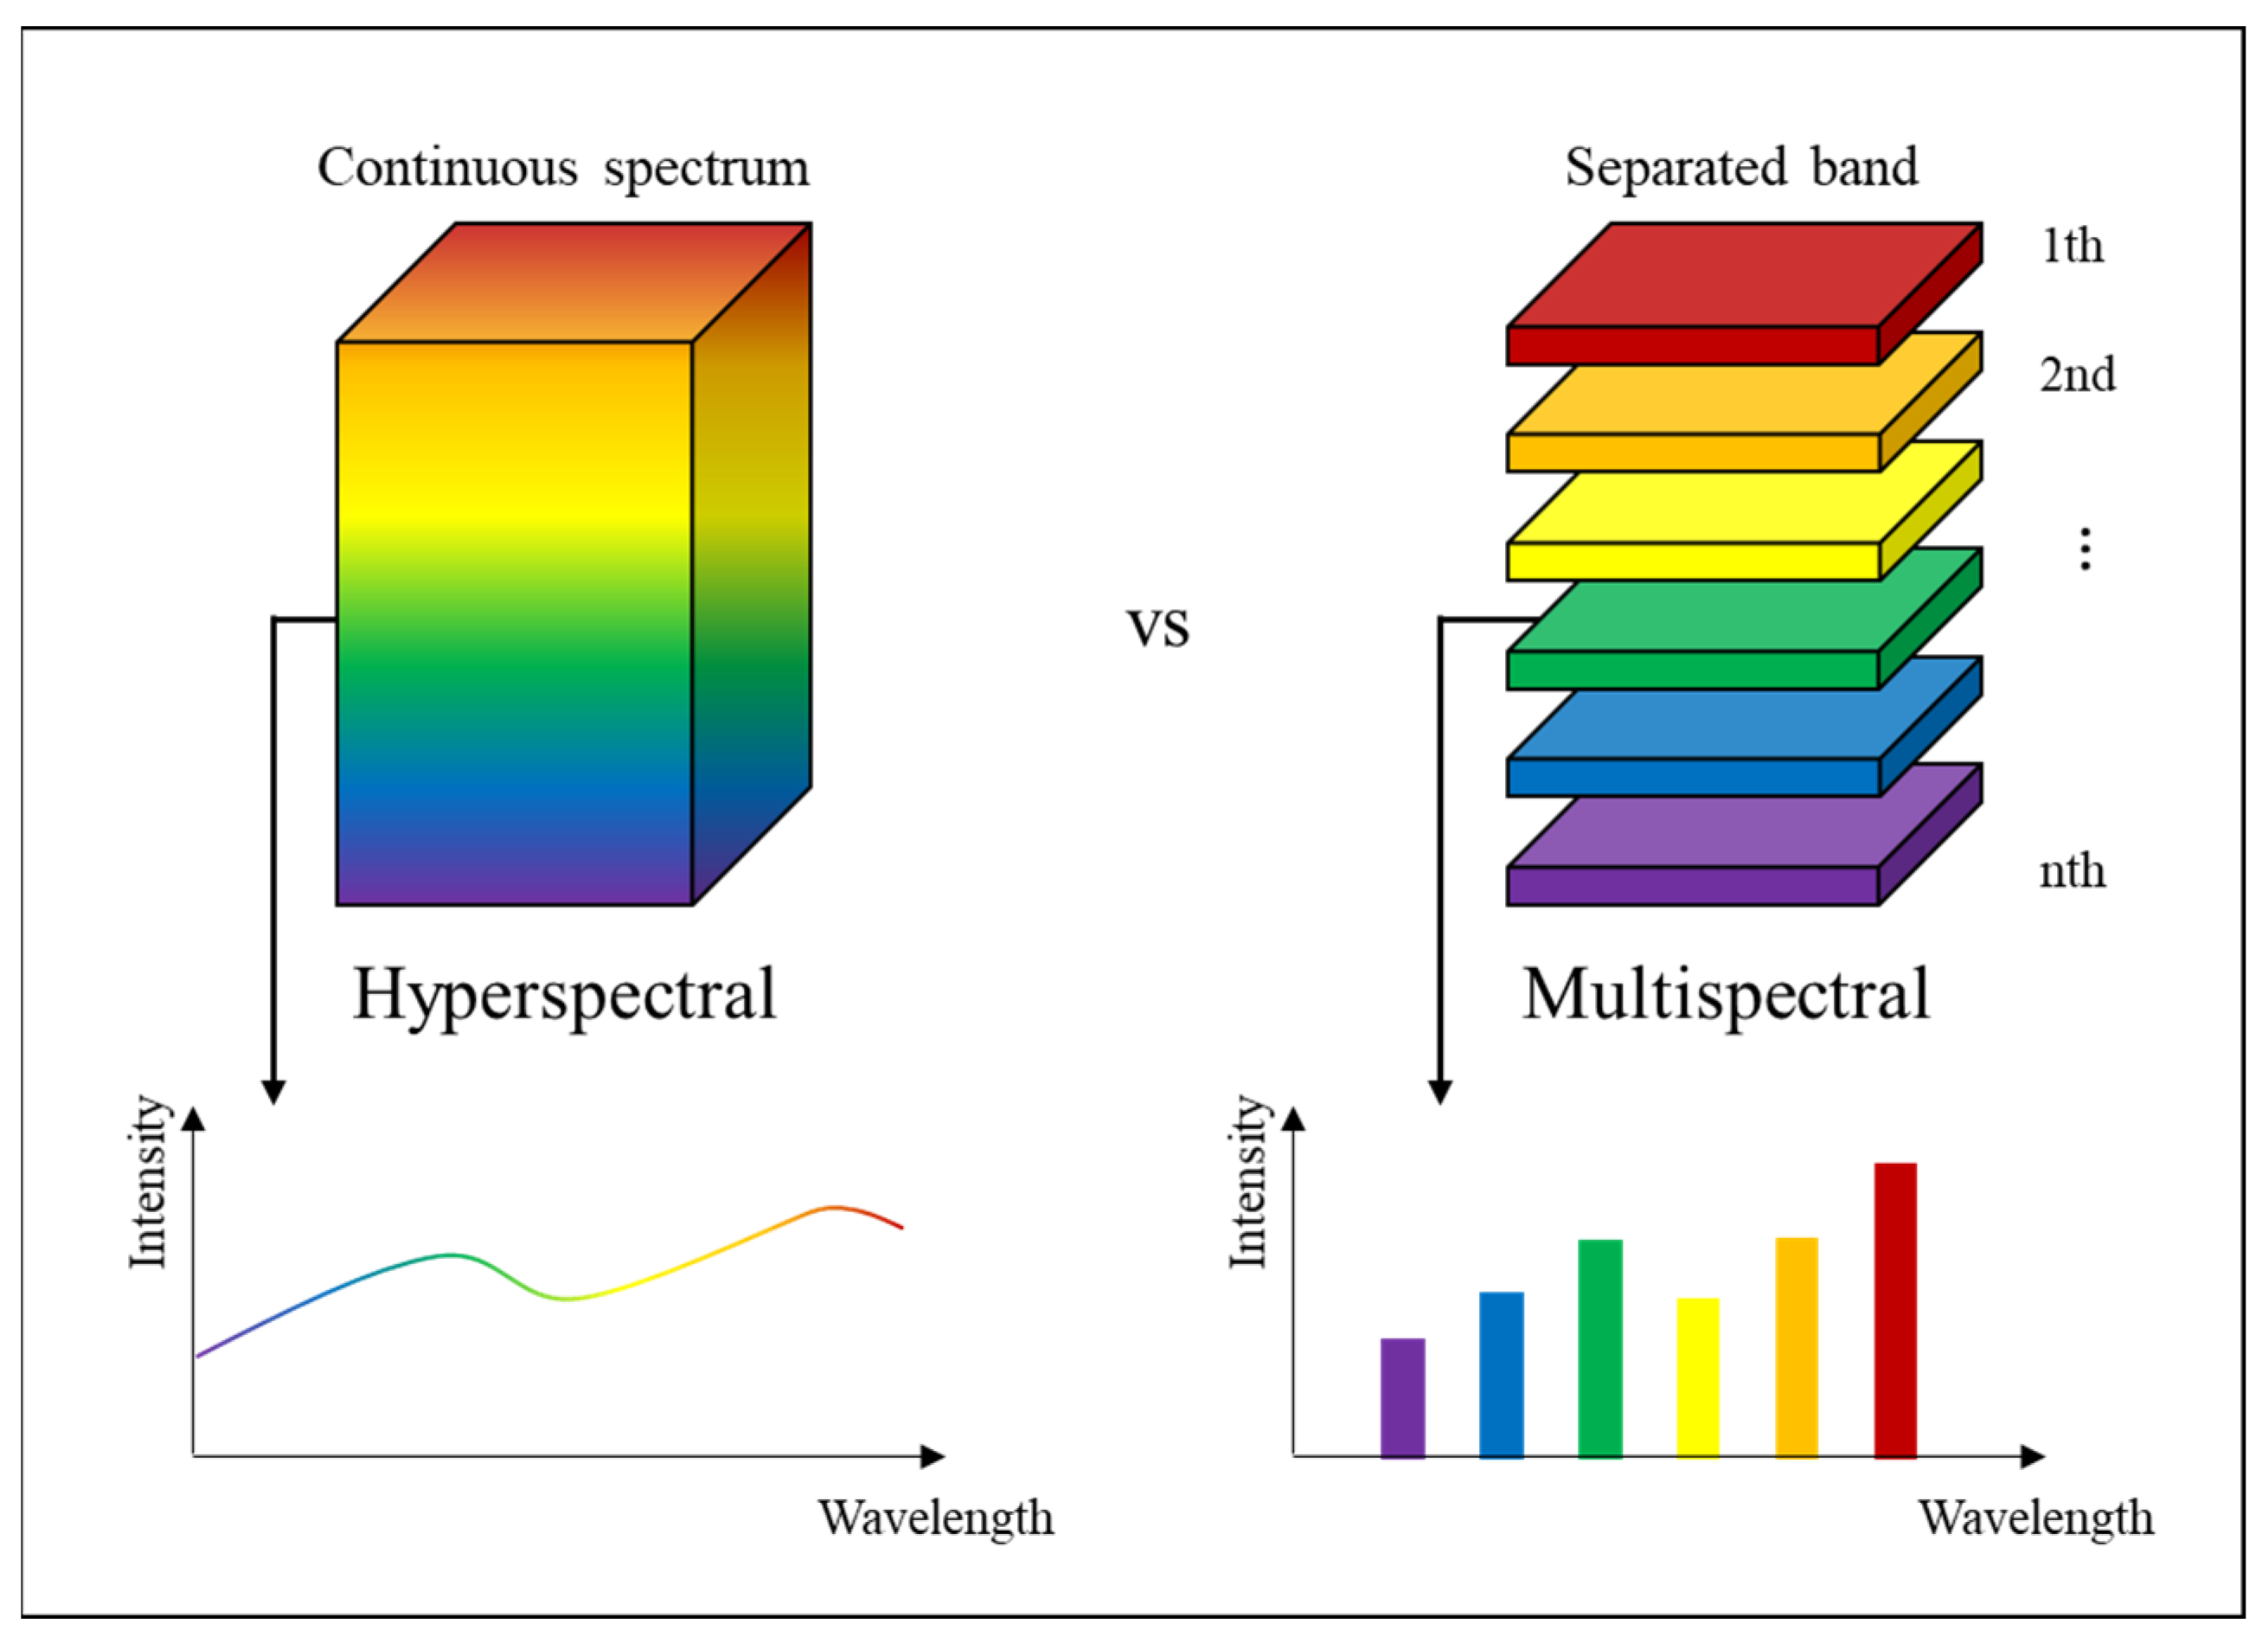
Figure 1. Comparison of spectral resolution between hyperspectral and multispectral imagery.
Water 16 01275 g001
Figure 2. Overview of field experiments: (a) experimental channel and sediment cloud after injection; (b) dried sand bed in Cases 1 and 3; (c) dried vegetated bed in Cases 2 and 4.
Water 16 01275 g002
Figure 3. Schematic diagram of OBRA.
Water 16 01275 g003
Figure 4. R2 map of OBRA with Landsat-9 bands: (a) QS with sand bed; (b) QS with vegetated bed; (c) YL with sand bed; and (d) YL with vegetated bed.
Water 16 01275 g004
Figure 5. R2 map of OBRA with Sentinel-2 bands: (a) QS with sand bed; (b) QS with vegetated bed; (c) YL with sand bed; and (d) YL with vegetated bed.
Water 16 01275 g005
Figure 6. R2 map of OBRA with hyperspectral bands: (a) QS with sand bed; (b) QS with vegetated bed; (c) YL with sand bed; and (d) YL with vegetated bed.
Water 16 01275 g006
Table 1. Experimental condition of each case.
CaseSediment TypeBottom
Type
Mean Depth (m)Sediment Density (mg/m3)d50 (µm)Injected Mass (kg)Injected Volume (L)Data Acquisition Date
Case 1QSSand0.592.361656012728 April 2021
Case 2Vegetation0.552.361656012827 April 2021
Case 3YLSand0.591.2316.34012728 April 2021
Case 4 Vegetation0.551.2316.34012727 April 2021
Table 2. Particle distribution density (%) of injected suspended sediments.
Sediment TypeClay (d < 4 µm) Silt (4 < d < 62 µm) Sand (62 µm < d)
QS0.353.4396.2
YL18.980.60.44
Table 3. Summary of the matched dataset of SSC and reflectance.
CaseCase 1Case 2Case 3Case 4
Count356228314437
SSC (ppm)26.67 ± 20.7619.97 ± 8.1265.34 ± 67.9045.19 ± 38.22
Reflectance range0.01–0.240.01–0.320.01–0.330.04–0.15
Table 4. Summary of multispectral and hyperspectral data used for OBRA.
Type of DatasetSpectral RangeNumber of Bands Used
Multispectral bands
(MSI data)
Landsat-9Band 1–Band 8
(430–880 nm)
6
Sentinel-2Band 1–Band 9
(432–955 nm)
9
Hyperspectral bands
(HSI data)
-400–1000 nm150
Table 5. Summary of OBRA results for all study cases.
DatasetSediment
Particle Type
Bed TypeR2Optimal BandsMAPE (%)
Hyperspectral
(HSI data)
QSSand0.82527 nm/743 nm17.0
YL0.80607 nm/619 nm37.9
QSVegetated0.35467 nm/607 nm45.9
YL0.39567 nm/803 nm84.5
Landsat-9
(MSI data)
QSSand0.79Band 3 (560 nm)/Band 5 (865 nm)18.7
YL0.77Band 3 (560 nm)/Band 8 (590 nm)38.8
QSVegetated0.29Band 2 (480 nm)/Band 8 (590 nm)51.2
YL0.34Band 2 (480 nm)/Band 5 (865 nm)93.6
Sentinel-2
(MSI data)
QSSand0.81Band 2 (492.4 nm)/Band 6 (740.5 nm)16.0
YL0.78Band 3 (559.8 nm)/Band 5 (704.1 nm)40.3
QSVegetated0.26Band 1(442.7 nm)/Band 4 (664.6 nm)52.7
YL0.38Band 3 (559.8 nm)/Band 8 (832.8 nm)84.1
Disclaimer/Publisher’s Note: The statements, opinions and data contained in all publications are solely those of the individual author(s) and contributor(s) and not of MDPI and/or the editor(s). MDPI and/or the editor(s) disclaim responsibility for any injury to people or property resulting from any ideas, methods, instructions or products referred to in the content.