Article

Preparation of CeO2 Supported on Graphite Catalyst and Its Catalytic Performance for Diethyl Phthalate Degradation during Ozonation

School of Environmental Science and Engineering, Huazhong University of Science and Technology, Wuhan 430074, China
*
Author to whom correspondence should be addressed.
Water 2024, 16(9), 1274; https://doi.org/10.3390/w16091274
Submission received: 16 March 2024 / Revised: 16 April 2024 / Accepted: 25 April 2024 / Published: 29 April 2024

Abstract

:
Catalysts for the efficient catalytic decomposition of ozone to generate reactive free radicals to oxidize pollutants are needed. The graphite-supported CeO2 catalyst was optimally prepared, and its activity in ozonation was evaluated using the degradation of diethyl phthalate (DEP) as an index. The stability of CeO2/graphite catalyst and the influence of operating conditions on its catalytic activity were investigated, and the mechanism of CeO2/graphite catalytic ozonation was analyzed. CeO2/graphite had the highest catalytic activity at a Ce load of 3.5% and a pyrolysis temperature of 400 °C with the DEP degradation efficiency of 75.0% and the total organic carbon (TOC) removal efficiency of 48.3%. No dissolution of active components was found during the repeated use of CeO2/graphite catalyst. The ozone dosage, catalyst dosage, initial pH, and reaction temperature have positive effects on the DEP degradation by CeO2/graphite catalytic ozonation. The presence of tert-butanol significantly inhibits the degradation of DEP at an initial pH of 3.0, 5.8, or 9.0, and the experimental results of the OH probe compound pCBA indicate that the CeO2/graphite catalyst can efficiently convert ozone into OH in solution. The DEP degradation in the CeO2/graphite catalytic ozonation mainly depends on the OH in the bulk solution formed by ozone decomposition.

1. Introduction

Heterogeneous catalytic processes are receiving increasing attention in water treatment due to their advantages of low secondary pollution and recyclability [1]. Various catalysts with different carriers and different active components have been prepared, studied, and applied in organic pollutants removal in various catalytic processes, including Fenton-like processes [2], persulfate processes [3], catalytic ozonation [4], photocatalysis [5,6], electrocatalysis [7,8], and various combined processes, etc. Appropriate carriers and active components loaded on them are particularly important for catalyst performance and its stability [1]. Carbon materials have received extensive attention as catalysts or catalyst carriers for ozonation in the past two decades [9,10]. As one of the carbon materials, the specific surface area of graphite is relatively small, and its SBET usually does not exceed 20 m2/g [11,12,13]. Correspondingly, the total amount of active sites that graphite can provide is relatively small [13,14], and the catalytic activity of graphite is usually not high if it is used as a catalyst directly during ozonation [11,12,13]. Therefore, some researchers have pretreated graphite (e.g., ball milling) to increase its specific surface area [13,15], or have directly used high surface area graphite [14], expanded graphite [16,17,18], graphite felt [19], graphene, and its oxides [19] with a larger specific surface area as catalysts or catalyst carriers to improve its catalytic activity.
Our group has always preferred to directly use graphite as the catalyst carrier, and Pt was used as the active component in the earliest studies, although the catalytic activity and stability are excellent [20]. Considering the high cost of Pt, we subsequently used ZnO as the active component loaded on graphite, and the catalyst shows high catalytic activity for DEP degradation, while its stability is not good [12]. The catalyst prepared by loading CeO2 on activated carbon exhibits good catalytic activity and stability in ozonation [21,22]. Therefore, this study attempted to load CeO2 on graphite to investigate its catalytic activity and stability in ozonation.
In the present study, a CeO2 supported on graphite (CeO2/graphite) catalyst was optimally prepared, and its catalytic activity and stability were investigated. Diethyl phthalate (DEP) is used as an indicator to characterize the activity of CeO2/graphite catalyst because it is difficult to be oxidized by ozone (k = 0.14 M−1 s−1) [23] and is easily oxidized by OH (k = 3.98 × 10⁹ M−1 s−1) [24]. The influence of reaction parameters on the catalytic activity of CeO2/graphite was investigated, and the reaction mechanism of DEP degradation by CeO2/graphite catalytic ozonation was discussed according to the results of OH quenching experiments and the evaluation experiments on its ability to decompose ozone to produce OH.

2. Experimental

2.1. Materials and Reagents

Commercial powdered graphite (1 μm ≥ 60%) was obtained from the Hendeli Graphite Factory (Qingdao, China). All chemicals used for experiments were analytical grade reagents, and ultrapure water was used for all experiments.

2.2. Preparation of Catalysts

Ce(NO3)2 was used as the metal precursor, and the CeO2/graphite catalyst was produced by the equal volume impregnation method. The catalyst was dried in an oven at 105 °C for overnight after impregnation. Subsequently, it was pyrolyzed at a certain temperature for 3 h in an N2 atmosphere. Without special statement, the loading amount of Ce and the pyrolysis temperature were 3.5 wt.% and 400 °C, respectively.

2.3. Characterization of Catalysts

The XRD patterns of CeO2/graphite catalysts were recorded on a D/max-rB XRD instrument (Rigaku, Akishima, Japan), using Cu Kα radiation (λ = 0.15406 nm) and equipped with graphite monochromator, with an operating voltage of 45 kV and current of 50 mA. The surface morphology of the CeO2/graphite catalyst was characterized using a field-emission SEM (Quanta 200F, Hillsboro, OR, USA) and a TEM (Hitachi H-800, Maharashtra, India). A mass titration method was adopted to measure the point of zero charge (PZC) of graphite and CeO2/graphite catalysts [25,26].

2.4. Ozonation Alone and Catalytic Ozonation Procedure

The experiments of ozonation alone and catalytic ozonation were carried out in a semi-batch mode. Ozone was produced from pure oxygen in a DHX-I ozone generator (Harbin Jiujiu Electric Chemical Engineering Ltd., Harbin, China), then ozone was continuously bubbled through a porous porcelain pellet into 1.0 L of aqueous solution containing DEP. In the experiments of catalytic ozonation, ozone was introduced into the reactor immediately after the catalyst being dosed into the solution, which corresponds to the start of the reaction. The reaction temperature was controlled at 20 ± 1 °C. Without special statement, the initial DEP concentration was 3 μM, the ozone flow rate was 0.38 mg min−1 when oxygen flow rate was controlled at 50 mL min−1, and the initial pH of the DEP solution was 5.8 without any adjustment. The concentrated HClO4 and NaOH solutions were adopted to adjust the initial pH of the reaction solution to investigate the influence of the initial pH on the performance of the CeO2/graphite catalyst.
Urs von Gunten defined the ratio of OH exposure to ozone exposure as Rct, which is used to express the conversion of ozone into OH in a given system [27,28]. To determine the Rct values of ozone alone and catalytic ozonation in the present study, the initial pH of the reaction solution was adjusted to 7.1 using the concentrated HClO4 and NaOH solutions, and a small stock solution of scavenger (tert-butanol, TBA) and OH probe compound (p-chlorobenzoic acid, pCBA) was added to the aqueous solution (1 L) to reach concentrations of 1 μM and 80 μM, respectively. The ozonation experiment was started by dosing a 50 mg/L catalyst and a small amount of ozone stock solution to the reactor to achieve an initial ozone concentration of 2 mg/L. At a given reaction time, the sample was withdrawn from the reactor and added directly to the indigo solution to quench the residual ozone [29].

2.5. Analytical Methods

The concentrations of DEP and pCBA were analyzed by an HPLC-UV with a waters symmetry C18 column (5 μm × 4.6 mm × 150 mm), and the methanol/water was used as the mobile phase with a flow rate of 1 mL min−1. The TOC was measured with a TOC Analyzer (Analytik jena Multi N/C 3100, Jena, Germany). The concentrations of ozone in gas phase and in aqueous solution were measured by the iodometric method [30] and the indigo method [29], respectively. The concentration of H2O2 that formed during the reaction was determined using a photometric method [31].
After each cycle of the reaction, the CeO2/graphite catalyst was recovered by filtration, then washed with ultrapure water and dried at 105 °C for 24 h. The Ce concentration in the filtrate was determined by ICP (Perkin-Elmer optima 5300DV, Markham, ON, Canada).

3. Results and Discussion

3.1. Catalytic Activity Comparison of CeO2/Graphite Catalyst with Other Catalyst

The DEP degradation efficiency was 12.4%, 50.2%, and 56.7% for graphite adsorption, ozonation alone and graphite catalytic ozonation, respectively (Figure 1a), and the TOC removal efficiency increased from 4.1% for ozonation alone to 14.5% for ozonation with graphite (Figure 1b). Zhang et al. have observed that graphite has the ability to promote ozone decomposition to generate hydroxyl radical (OH) at the solid–liquid interface [32], which may be beneficial to the TOC removal.
As for the graphite supported metal oxide catalysts, the loading of ZnO or CeO2 significantly improved the catalytic activity of graphite (Figure 1). The ZnO/graphite catalyst showed better performance than the CeO2/graphite catalyst on DEP degradation as the degradation efficiency was 93.8% and 75.0% for ZnO/graphite and CeO2/Graphite, respectively (Figure 1a). However, the TOC removal was quite different as the CeO2/graphite catalyst showed better performance (48.3%) than the ZnO/graphite catalyst (35.5%) (Figure 1b). The results indicate that the CeO2/graphite catalyst exhibited a better performance than the ZnO/graphite catalyst on the oxidation of transformation products formed during the DEP degradation process.
The concentration of metal ions in the solution after ozonation with graphite supported metal oxide catalysts were detected. After 10 min reaction, the concentration of zinc ions in the solution reached 0.54 mg/L, which means that the stability of the ZnO/graphite catalyst is not very good. However, no dissolution of the active components of the CeO2/graphite catalyst was detected (Figure 1b). These results indicate that although the CeO2/graphite catalyst is inferior to the ZnO/graphite catalyst in terms of DEP degradation, it is significantly better than the ZnO/graphite catalyst in terms of TOC removal and catalyst stability (Figure 1).
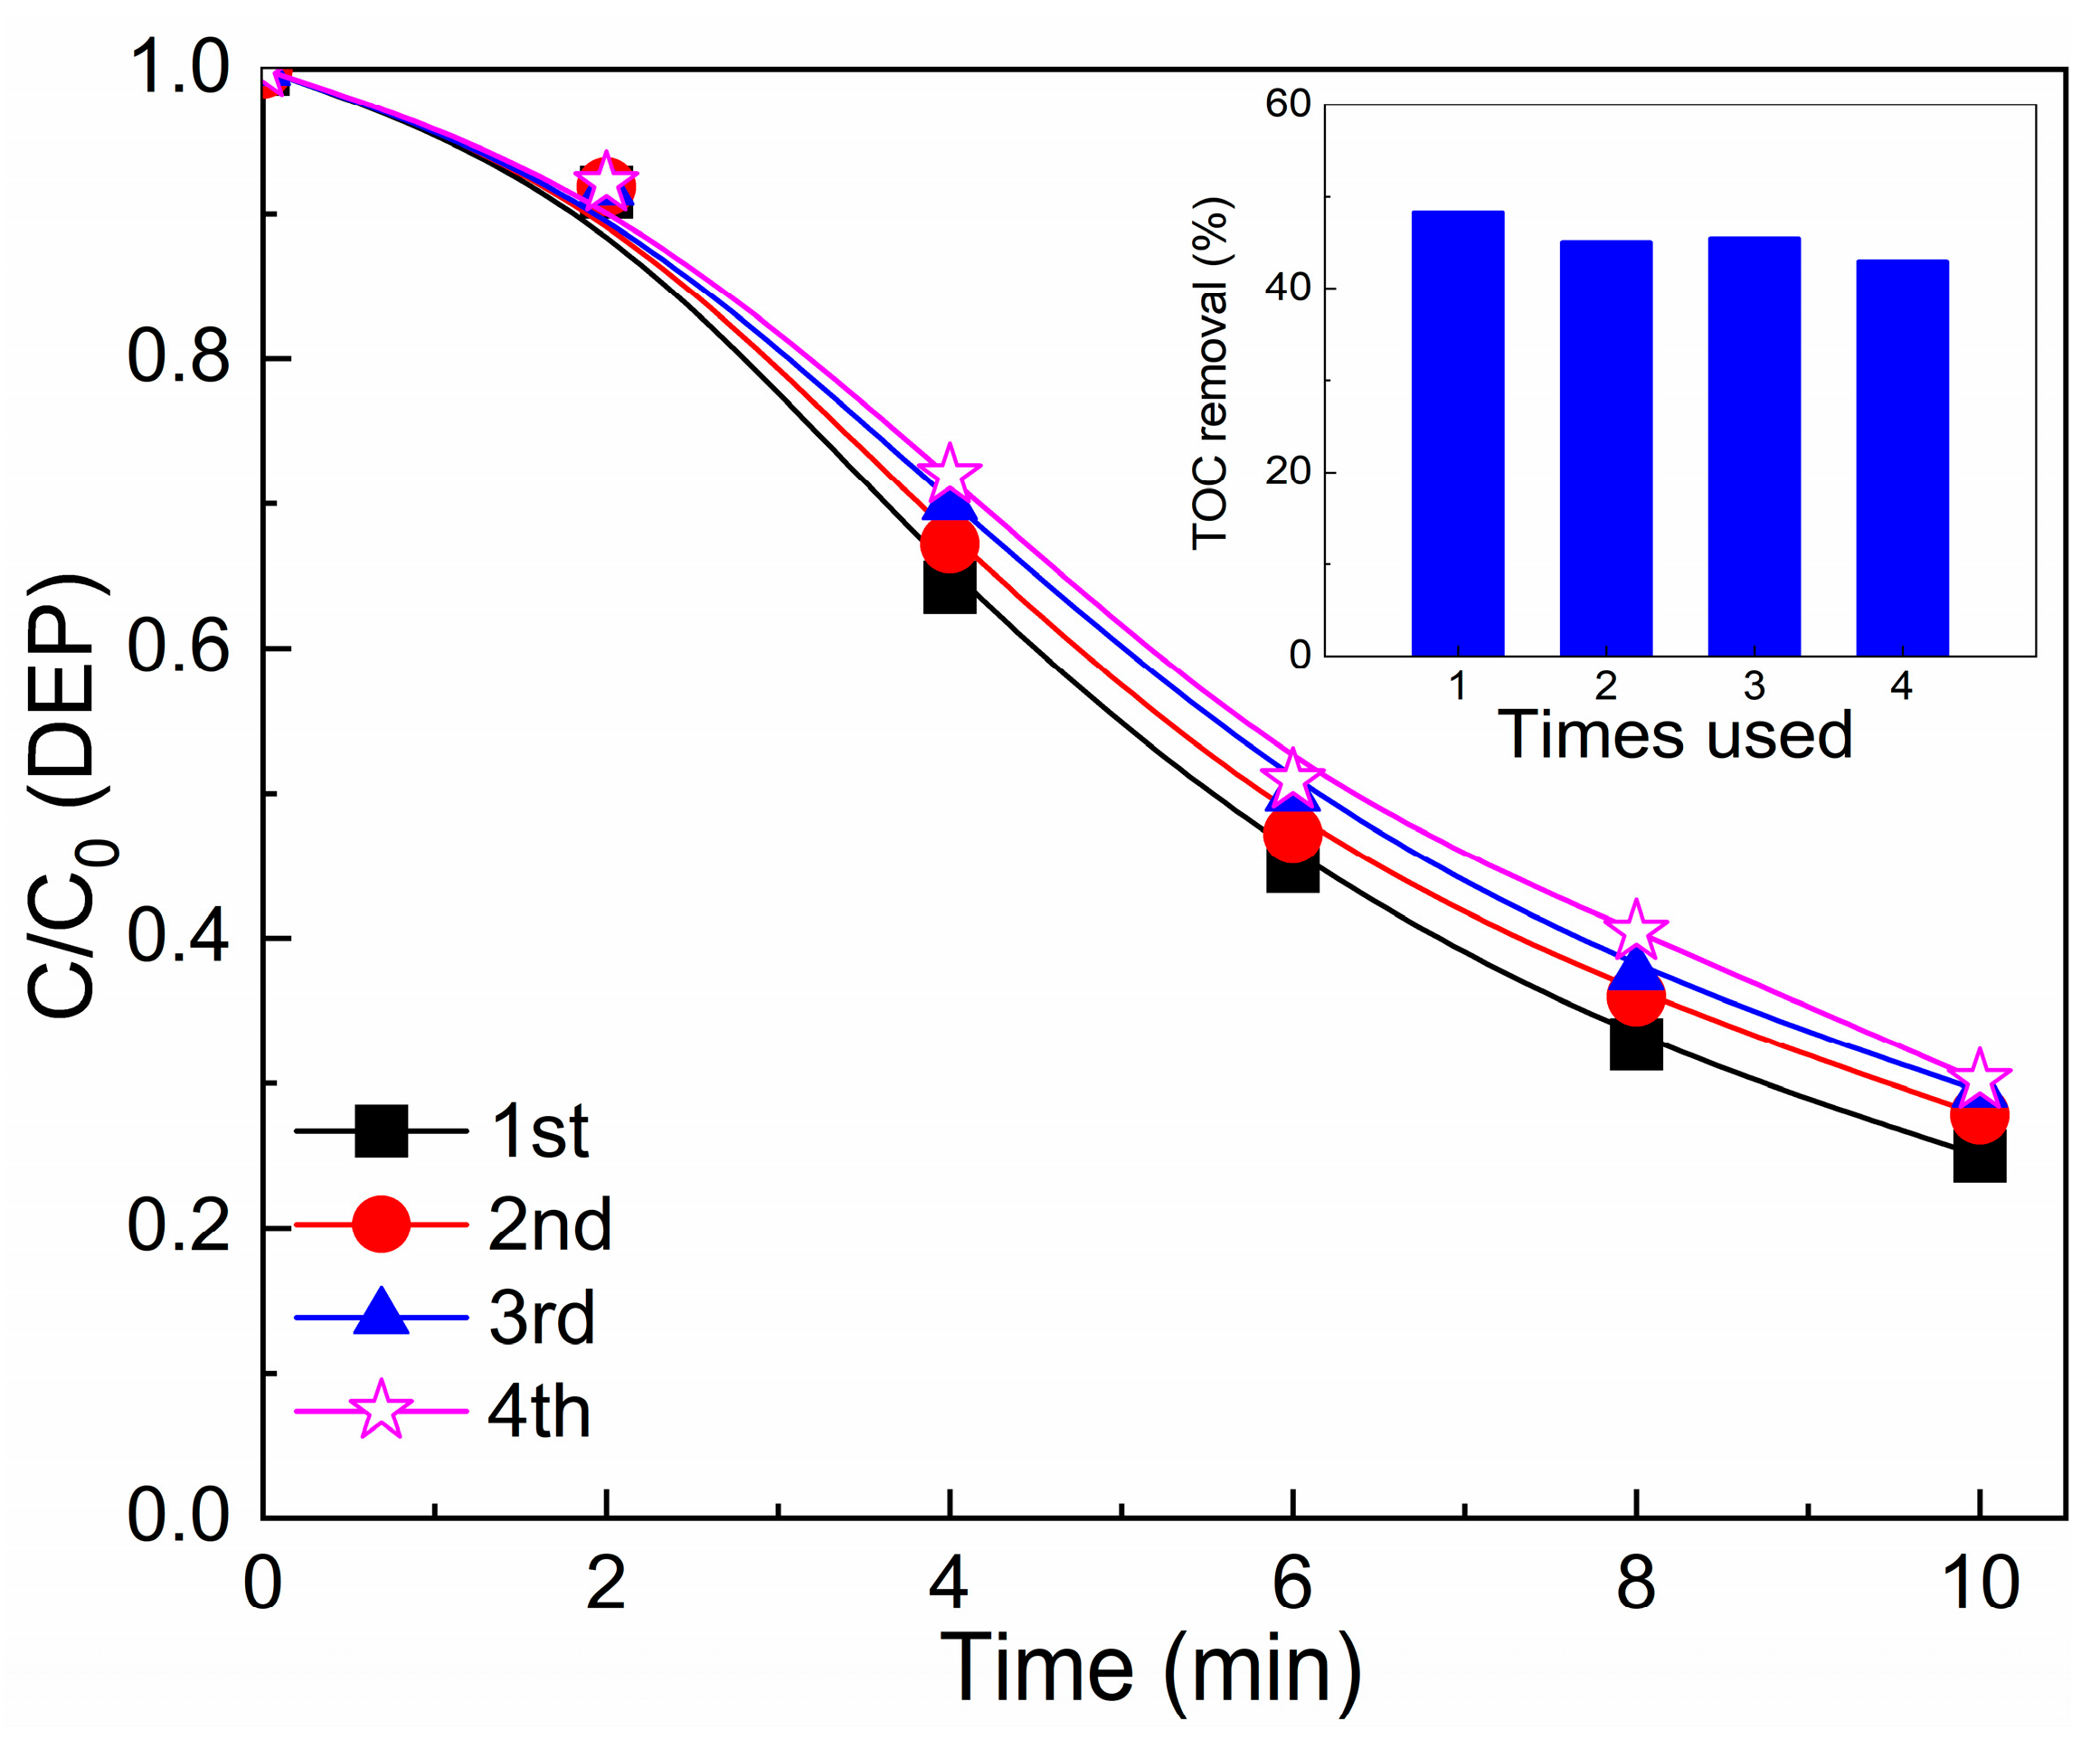
In order to investigate the stability of the CeO2/graphite catalyst, repeated use of the catalyst on DEP ozonation was conducted, and the results are shown in Figure 2. During the four reuses, there was only a slight decrease on the performance of the CeO2/graphite catalyst for DEP degradation and TOC removal. The concentration of metal ions in the solution was detected after CeO2/graphite catalytic ozonation, and no dissolution of cerium ion was found (Figure 1b). This result indicates that the CeO2/graphite catalyst has good stability, which may be the reason why its performance only changes slightly in the degradation of DEP and TOC removal during repeated use.

3.2. Optimization of CeO2/Graphite Catalyst

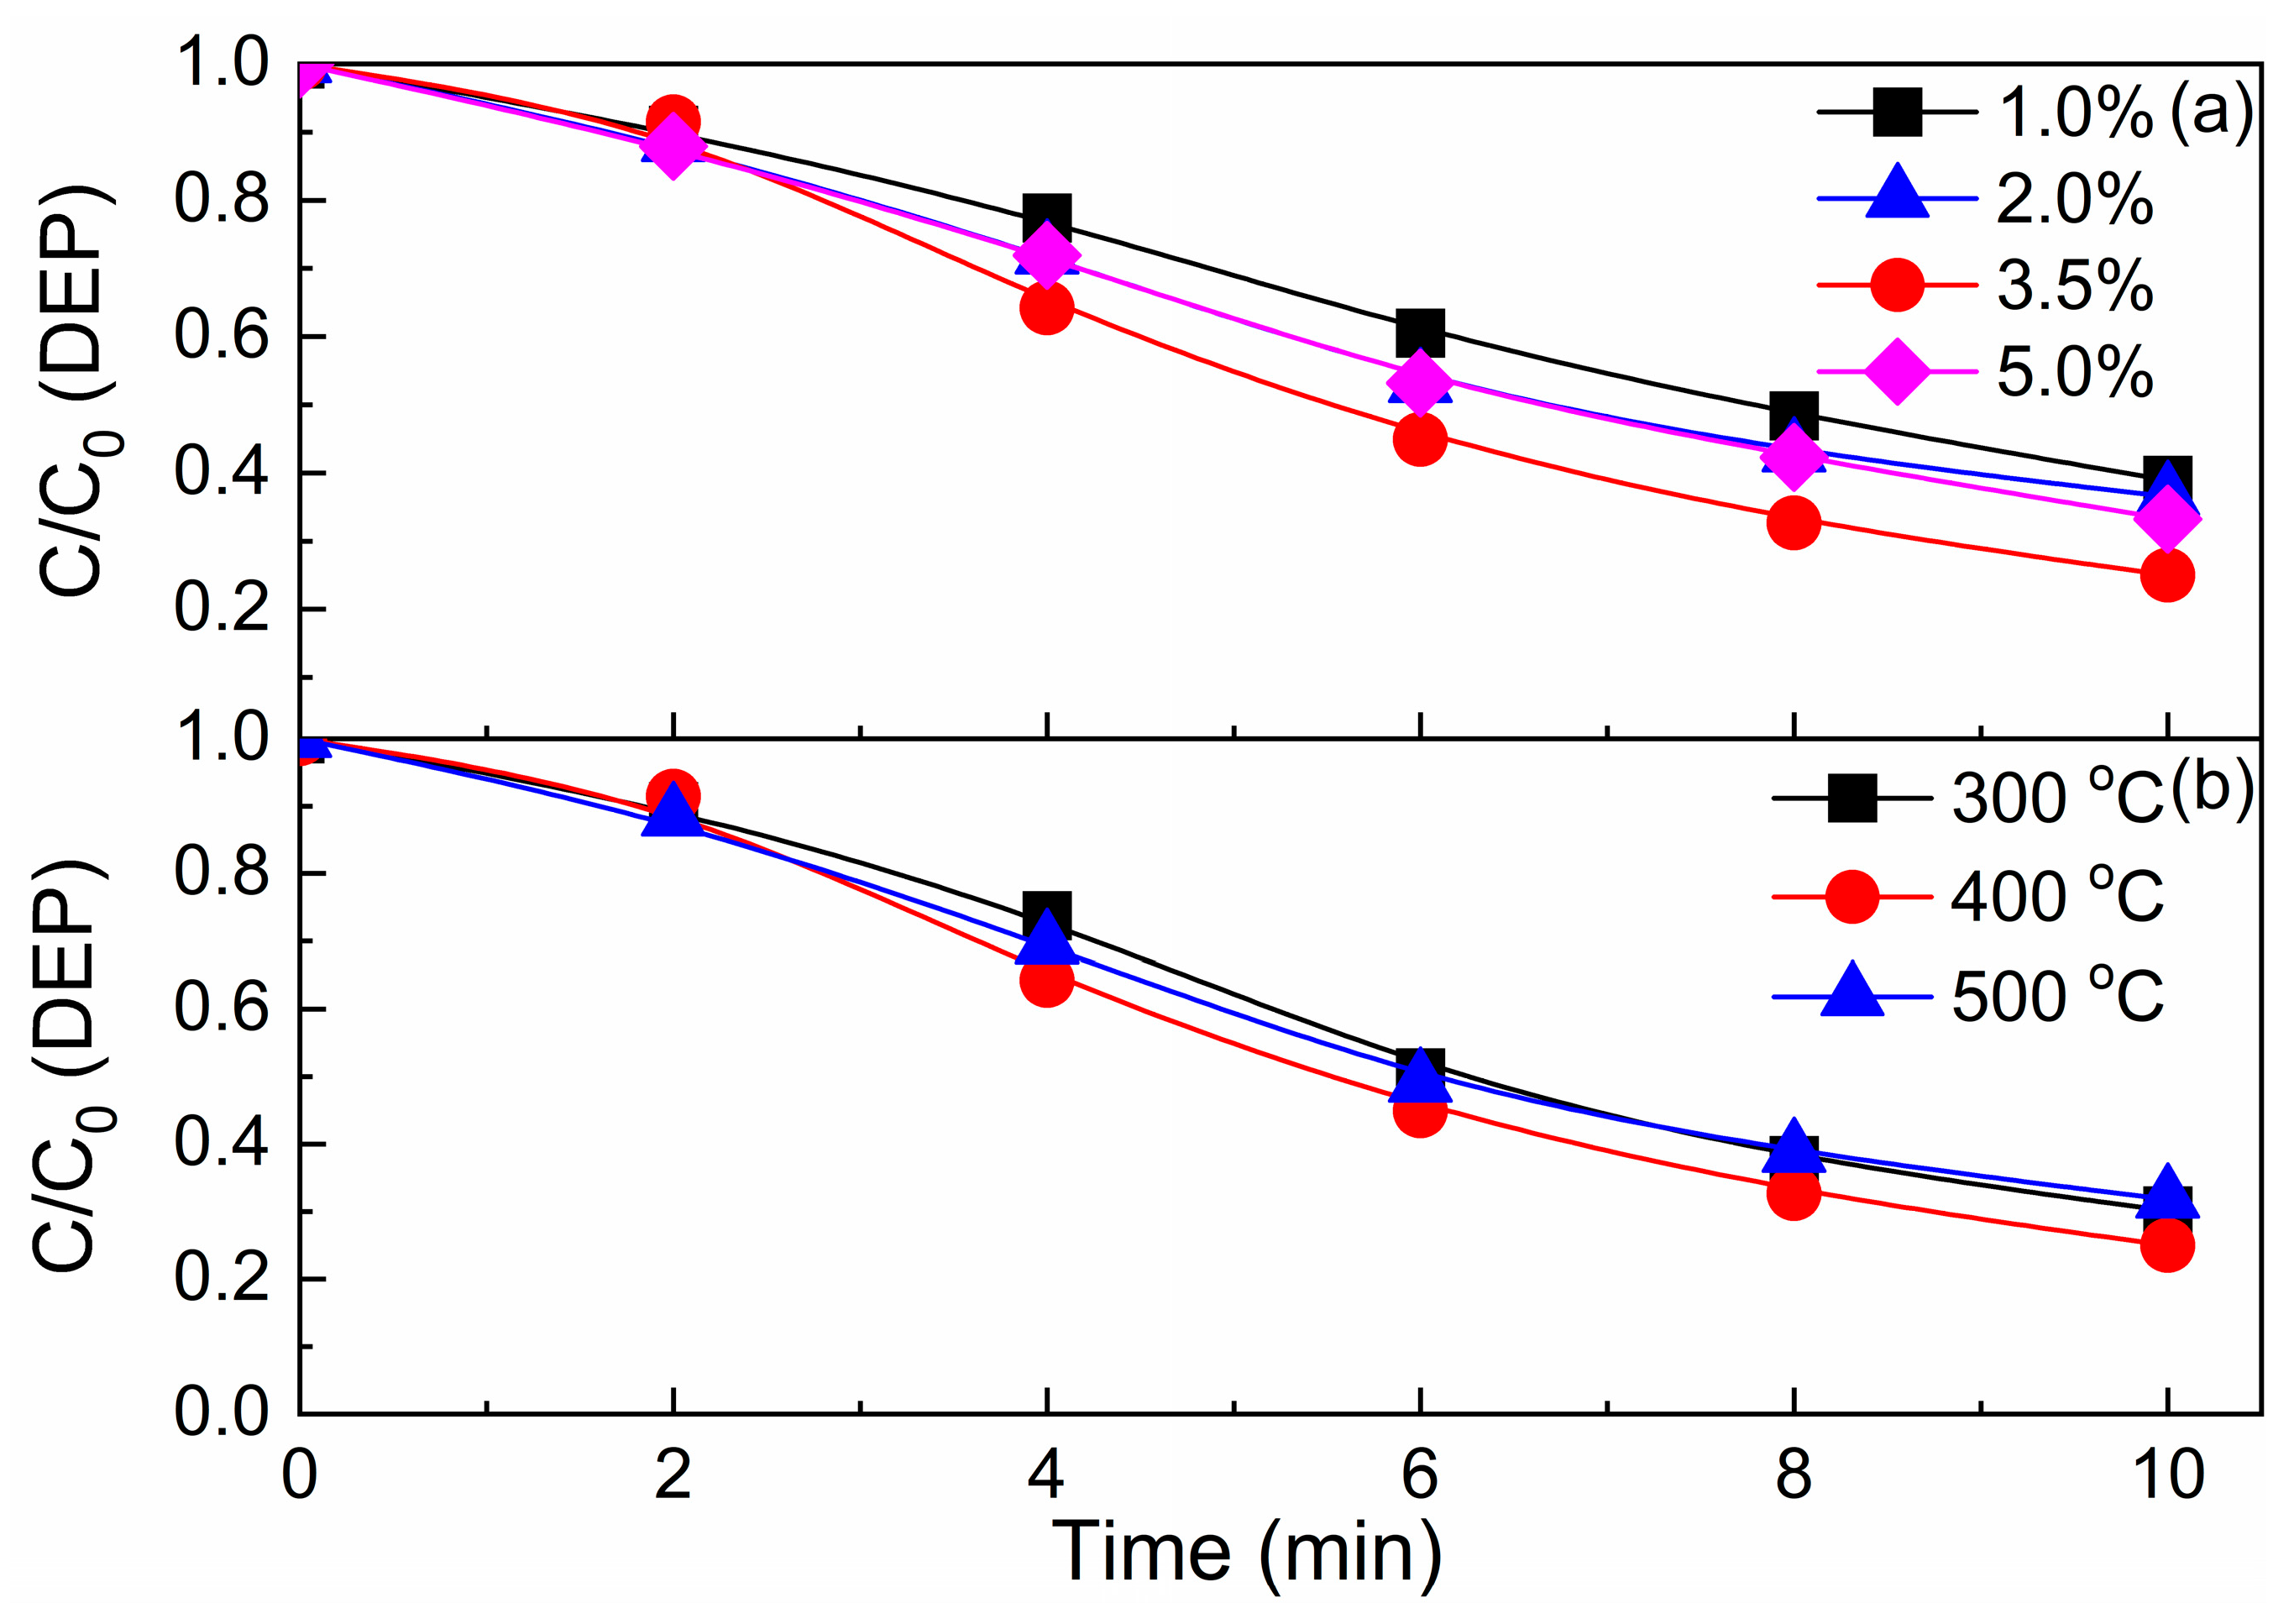
The CeO2/graphite catalyst with different amounts of cerium loading (1.0%, 2.0%, 3.5%, and 5.0%) was prepared to investigate its effect on the performance for DEP degradation during ozonation. As shown in Figure 3a, the DEP degradation efficiency increases with the cerium loading amount from 1.0% to 3.5% and decreases with the cerium loading amount from 3.5% to 5.0%. It is generally believed that the loading of metal oxides on the surface of carbon materials mainly depends on the oxygenated surface groups at the edges of plane and π electron structures at the inert basal plane of carbon materials [33,34,35]. The surface groups, such as carboxyl, hydroxyl, and carbonyl groups, are beneficial for nucleation of metal ions, which are reduced to nanoscale particles. As for the inert basal plane, the surface π electron structures act as Lewis basic sites and would lead to electron donor–acceptor complexes, which are strong interactions between metal particles and the carbon materials. Due to the fewer defects in graphite, the loading sites of metal oxides on the graphite surface may be mainly dependent on its π electron structures [36,37]. As for the present CeO2/graphite catalysts, the binding sites on the graphite surface are progressively occupied with the increase in cerium loading amount from 1.0% to 3.5%. Hence, the available binding sites would be not enough with a further increase in cerium loading amount to 5.0%, and the agglomeration of CeO2 nanoparticles may occur due to the limited binding sites on the graphite surface, leading to the decrease in catalytic activity just like other carbon supported metal oxides [12,33,38].
The pyrolysis temperature usually has a significant impact on the activity of the prepared catalyst. A series of CeO2/graphite catalysts were prepared to investigate the effect of pyrolysis temperature (300 °C, 400 °C, and 500 °C) on DEP degradation during catalytic ozonation. As shown in Figure 3b, the DEP degradation efficiency increases with the pyrolysis temperature from 300 °C to 400 °C and decreases slightly with the pyrolysis temperature from 400 °C to 500 °C.

3.3. Characterization of CeO2/Graphite Catalyst

The prepared CeO2/graphite catalysts were characterized by SEM, TEM, and XRD. The cerium loading and pyrolysis did not have significant impacts on the surface morphology of the graphite (Figure 4a), except that a lot of small particles with good dispersion are attached to the surface of graphite (Figure 4b) which should be cerium oxide formed by pyrolysis of the active component Ce impregnated on graphite. XRD patterns of CeO2/graphite catalysts prepared under different conditions are shown in Figure 4c,d. For comparison, the XRD result of graphite (0% cerium loading amount) is also presented. The CeO2/graphite catalysts prepared under various conditions exhibited CeO2 characteristic diffraction peaks at 2θ of 28.44°, 33.16°, 47.34°, and 56.46° [39,40], which demonstrates that the active component of the prepared CeO2/graphite catalyst is in the form of CeO2.
As shown in Figure 4c, the intensity of diffraction peaks for CeO2 gradually increases with the increase in cerium loading amount, indicating that the CeO2 grains generated on the graphite surface gradually increase. Since the active component of the CeO2/graphite catalyst is in the form of CeO2, the increase in CeO2 grains on the graphite surface is helpful for the increase in active sites. At this point, an appropriate increase in cerium loading amount (from 0% to 3.5%) can increase the active sites on the catalyst surface, thereby enhancing its catalytic activity for ozonation of DEP (Figure 3a). However, the sites on the graphite surface that can bind the active component is limited. When the cerium loading amount further increases (from 3.5% to 5.0%), CeO2 can only deposit on the original sites due to the lack of binding sites on the graphite surface. The agglomeration of CeO2 grains may lead to a decrease in the active component dispersion on the graphite surface, which in turn leads to a decrease in the activity of the Ce/graphite catalyst (Figure 3a).
Figure 4d shows the effect of pyrolysis temperature on XRD patterns of the CeO2/graphite catalyst. The intensity of diffraction peaks for CeO2 gradually increases with the increase in pyrolysis temperature. On the one hand, increasing the pyrolysis temperature is beneficial for the crystallization of the active component, forming structurally intact CeO2 grains, which is conducive to the catalytic activity improvement of the CeO2/graphite catalyst (Figure 3b). On the other hand, increasing the pyrolysis temperature makes CeO2 grains more prone to agglomeration, leading a decrease in the active sites, which in turn leads to a decrease in the activity of the CeO2/graphite catalyst (Figure 3b).

3.4. Effect of Operation Conditions on the Performance of CeO2/Graphite Catalyst

3.4.1. Effect of Ozone Dosage and Catalyst Dosage

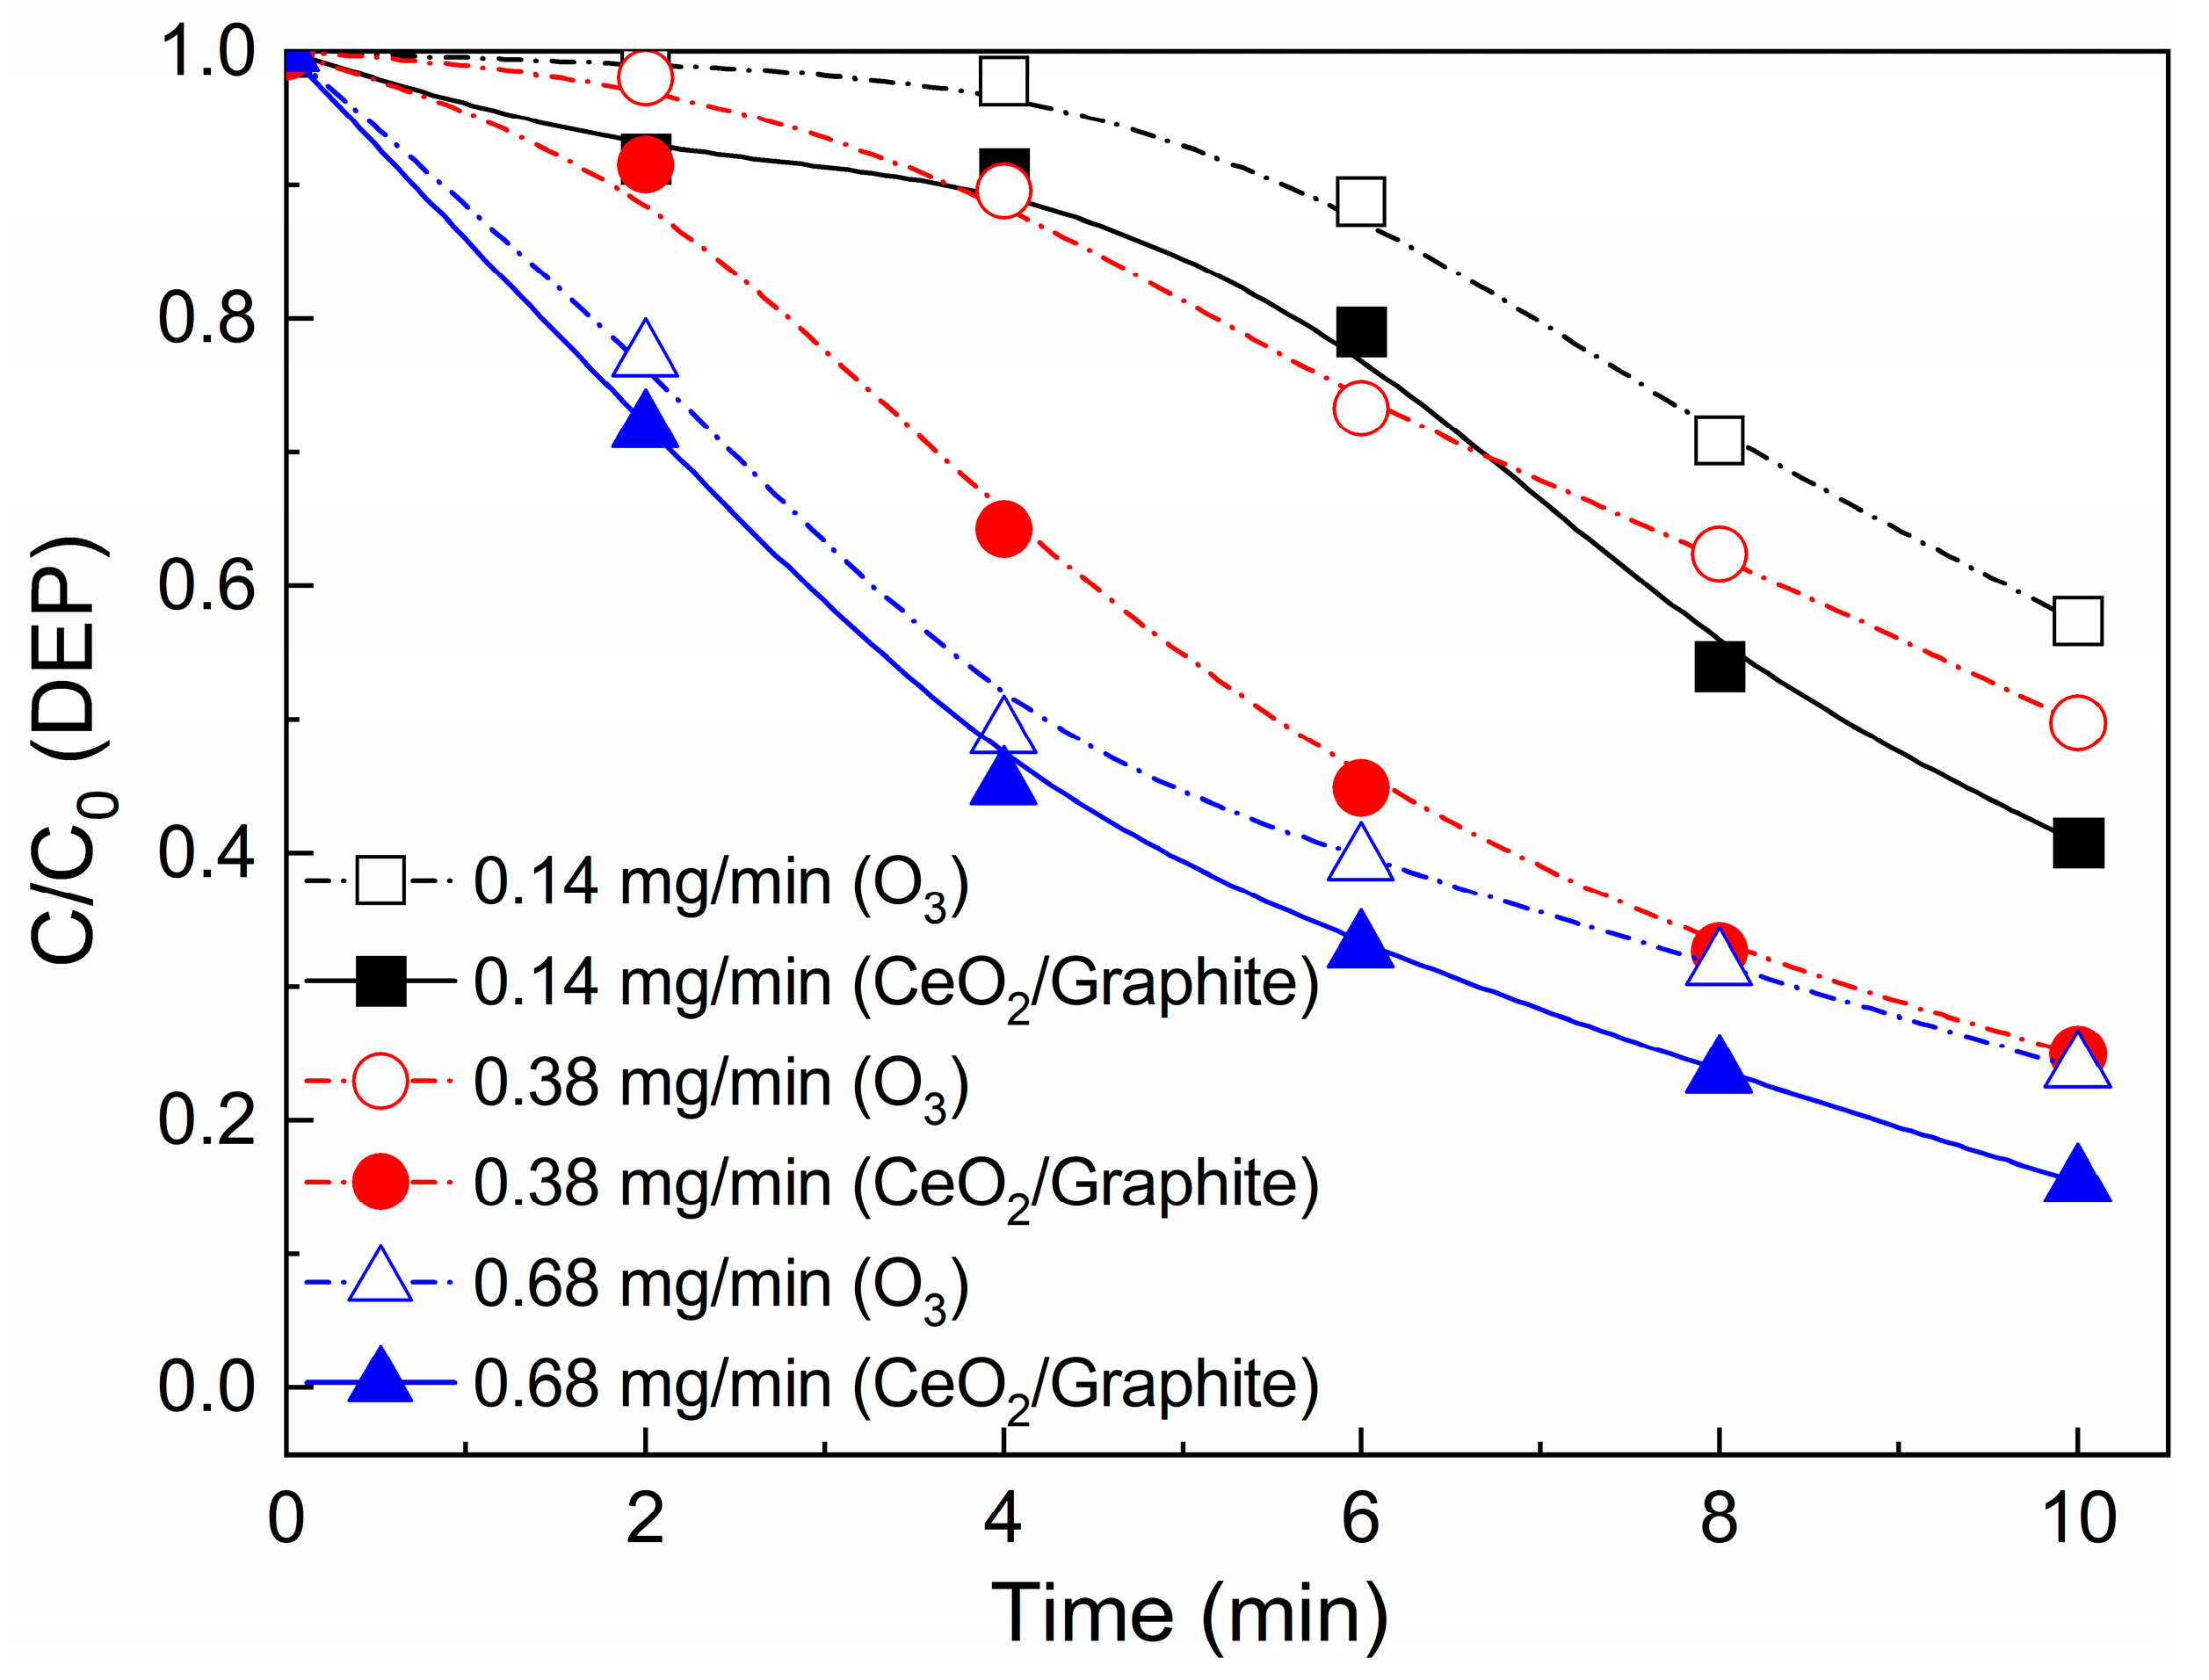
The influence of ozone dosage on the DEP degradation was investigated during ozonation with CeO2/graphite, and the results of ozonation alone are also presented for comparison (Figure 5). Ozone dosage had a remarkable influence on the DEP degradation during both ozonation alone and CeO2/graphite catalytic ozonation, as the DEP degradation efficiency increased from 42.6% to 76.9% during ozonation alone and from 59.2% to 84.6% during CeO2/graphite catalytic ozonation with ozone dosage increasing from 0.14 mg/min to 0.68 mg/min, respectively. It should be pointed that although increasing ozone dosage can improve the primary DEP transformation efficiency, ozonation alone may not be able to convert other organic substances, such as organic intermediates during the DEP degradation, which is clearly different from CeO2/graphite catalytic ozonation as the latter shows good performance on TOC removal (Figure 1b).
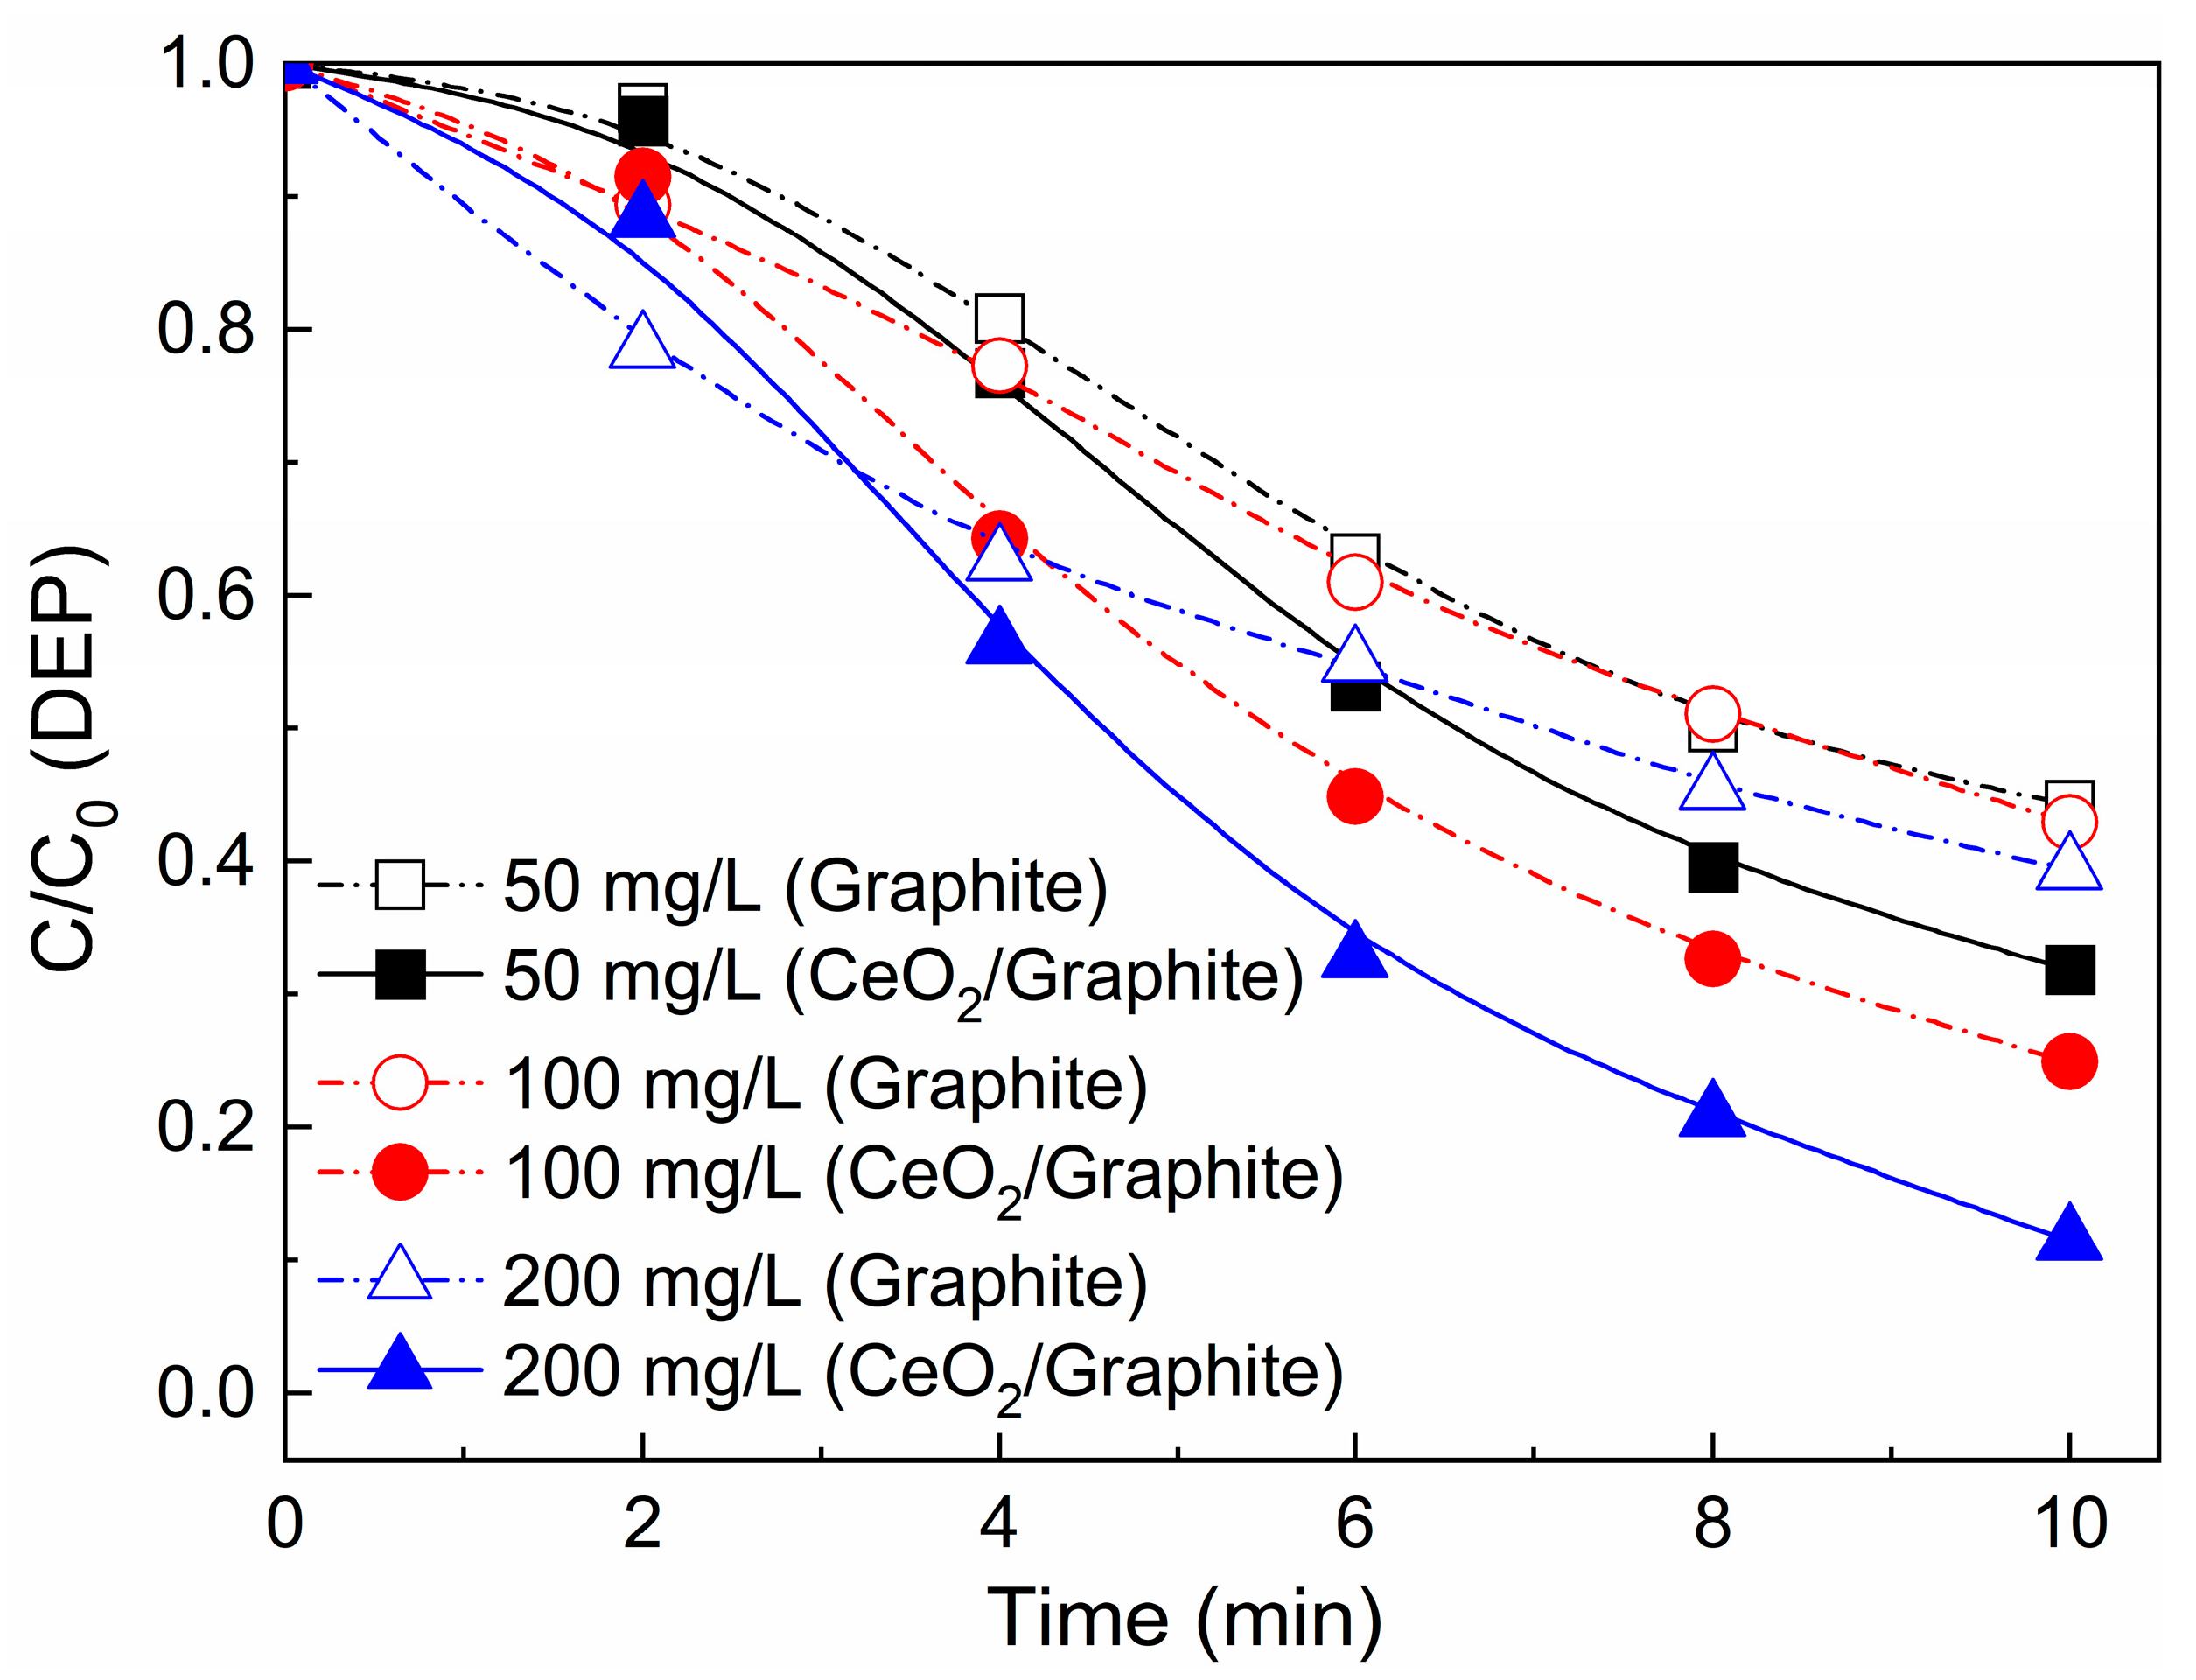
The influence of catalyst dosage on the DEP degradation were investigated during ozonation with CeO2/graphite, and the results of ozonation with graphite are also shown for comparison (Figure 6). Catalyst dosage only had a slight influence on the DEP degradation during graphite catalytic ozonation, but had an apparent influence on the DEP degradation during CeO2/graphite catalytic ozonation, as the DEP degradation efficiency increased from 55.7% to 60.6% during graphite catalytic ozonation and from 68.1% to 88.5% during CeO2/graphite catalytic ozonation with catalyst dosage increasing from 50 mg/L to 200 mg/L, respectively. Compared to graphite catalytic ozonation, the improvement on DEP degradation efficiency was 12.4%, 17.9%, and 27.9% with CeO2/graphite catalyst dosage of 50 mg/L, 100 mg/L, and 200 mg/L, respectively (Figure 6). Since the ozone dosage is enough for the reaction, the more CeO2/graphite catalyst is dosed, the more active sites that can play catalytic roles. In this case, the reaction of ozone conversion into strong oxidizing free radicals is enhanced, thus improving the oxidation efficiency of the target organic compound.

3.4.2. Effect of Initial DEP Concentration and Initial pH

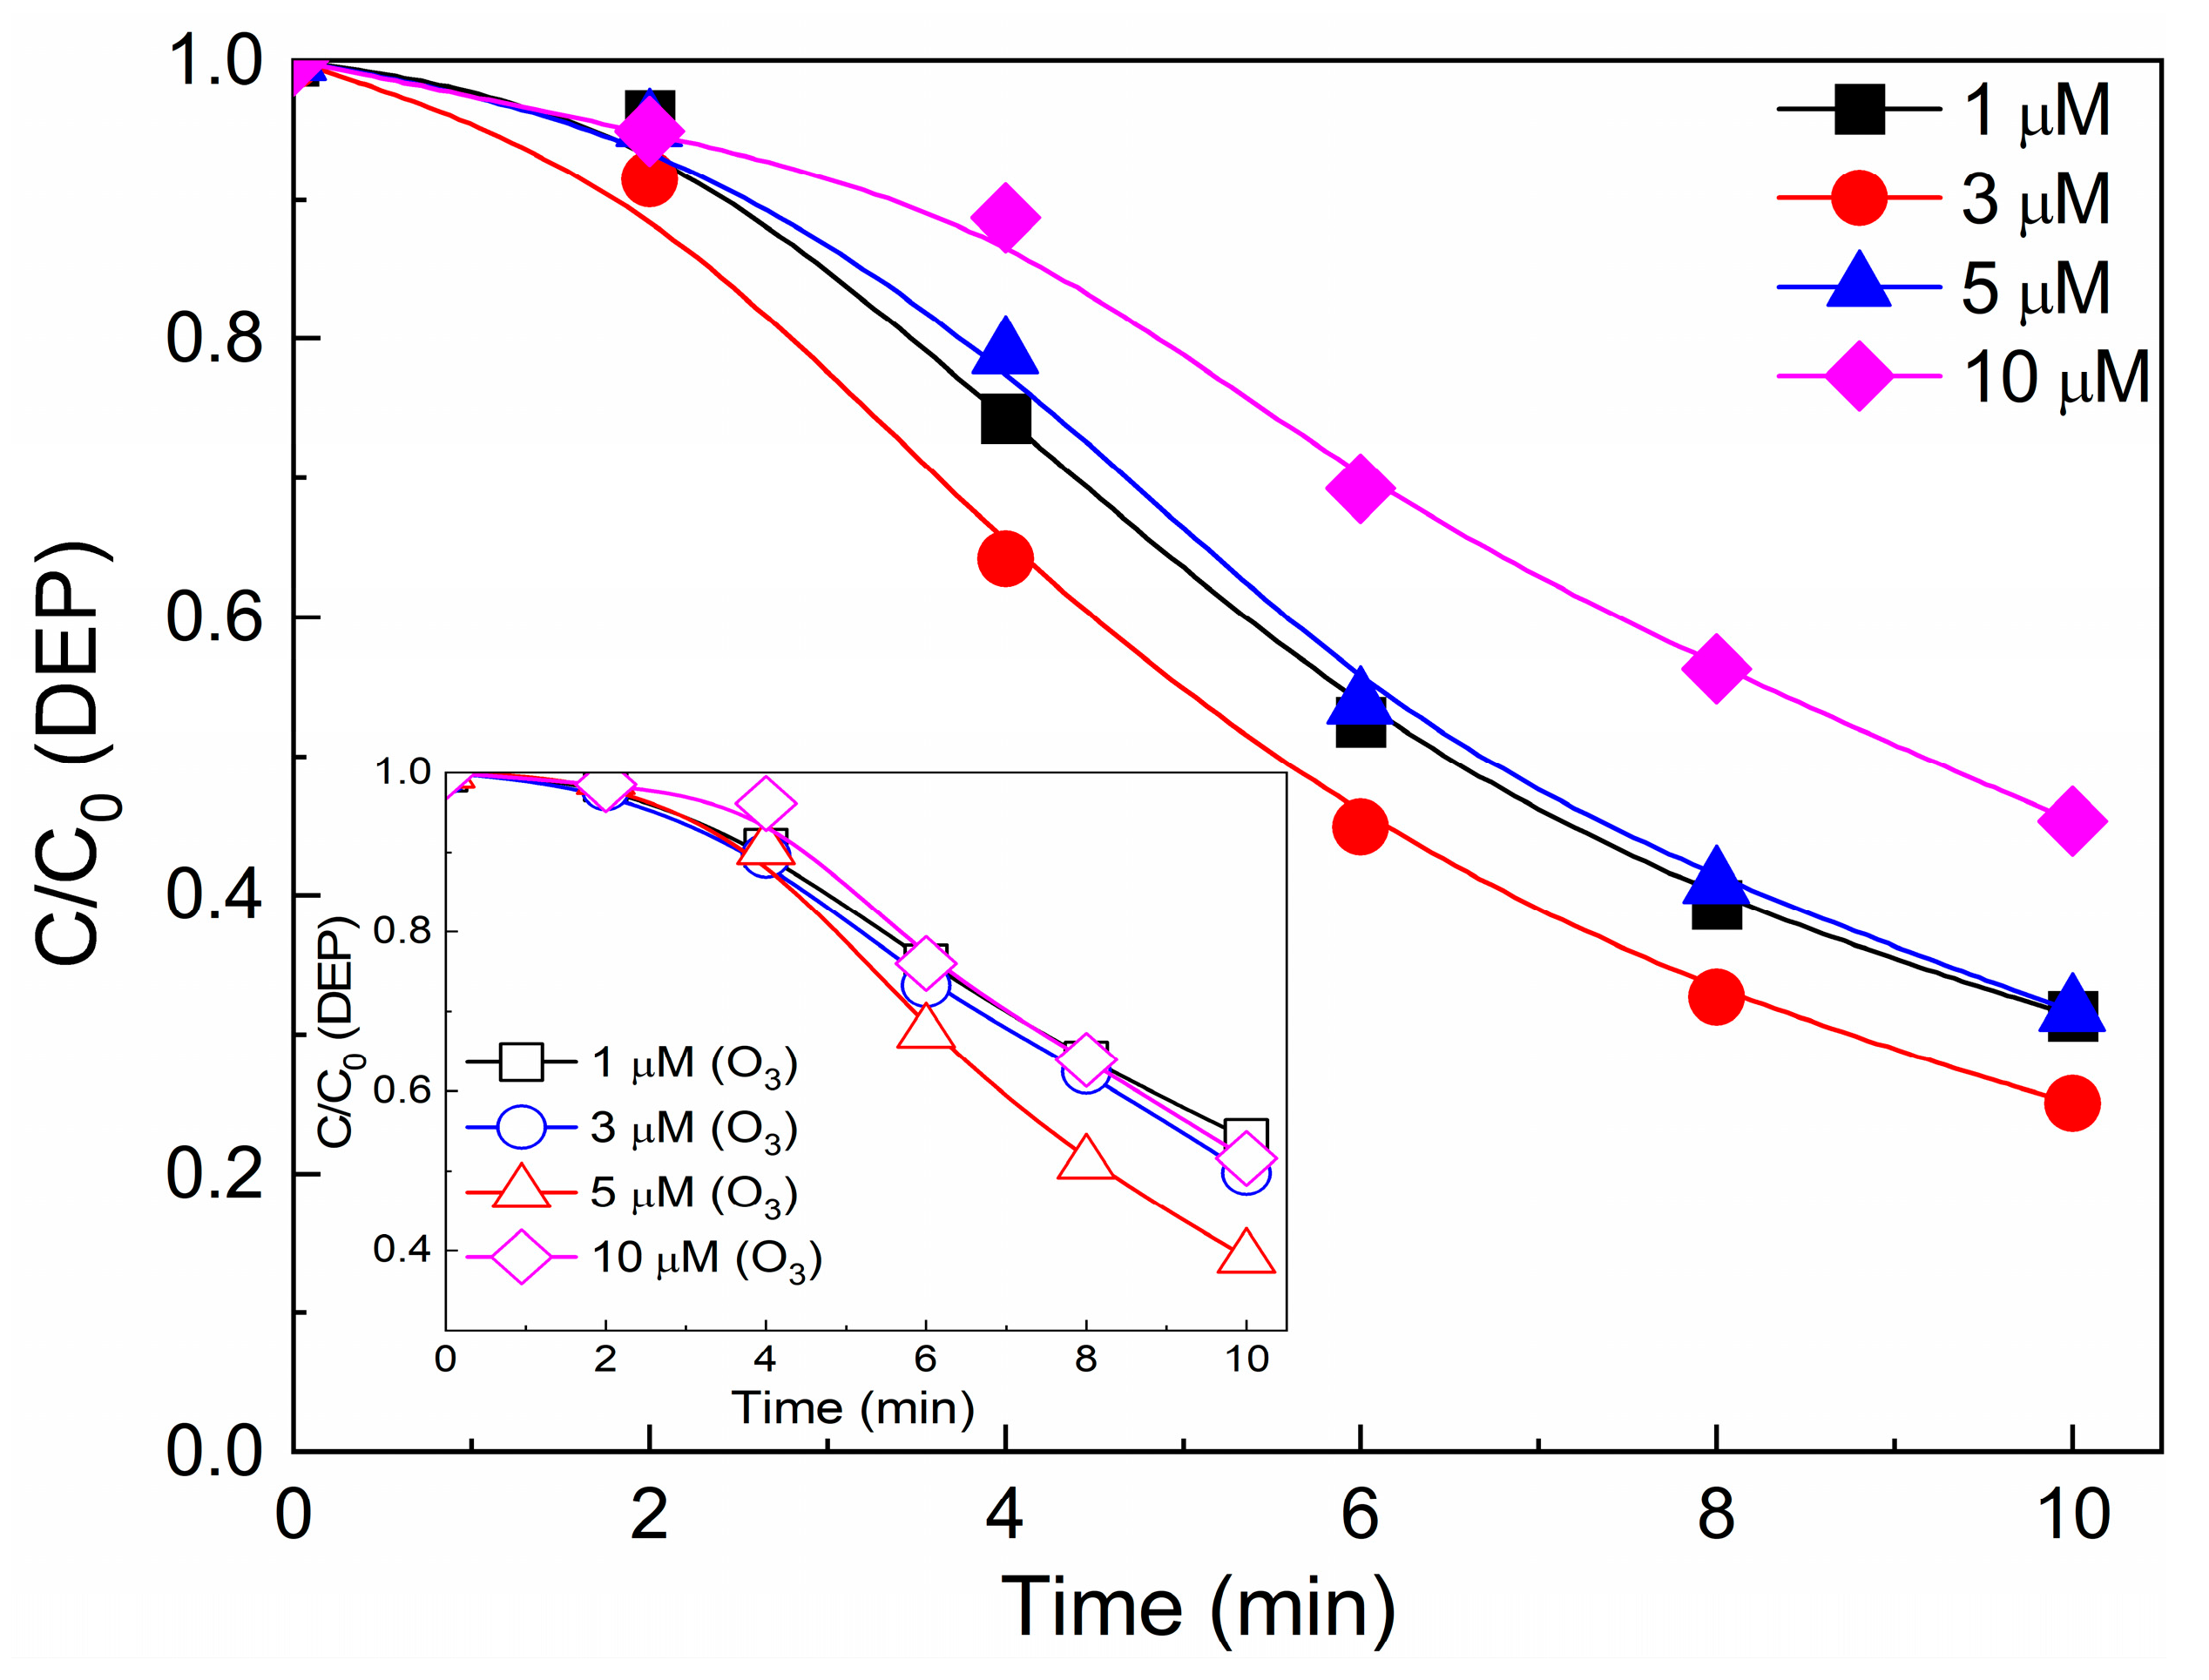
The influence of initial DEP concentration on the DEP degradation were investigated during CeO2/graphite catalytic ozonation, and the results are shown in Figure 7. The DEP degradation efficiency increased from 68.6% to 75.0% with an initial DEP concentration increasing from 1 μM to 3 μM. However, further increasing the initial DEP concentration from 3 μM to 10 μM can lead to a decrease in the DEP degradation efficiency. For ozonation alone, the DEP degradation efficiency increased with initial DEP concentration increasing from 1 μM to 5 μM and decreased with initial DEP concentration increasing from 5 μM to 10 μM (inserted figure of Figure 7).
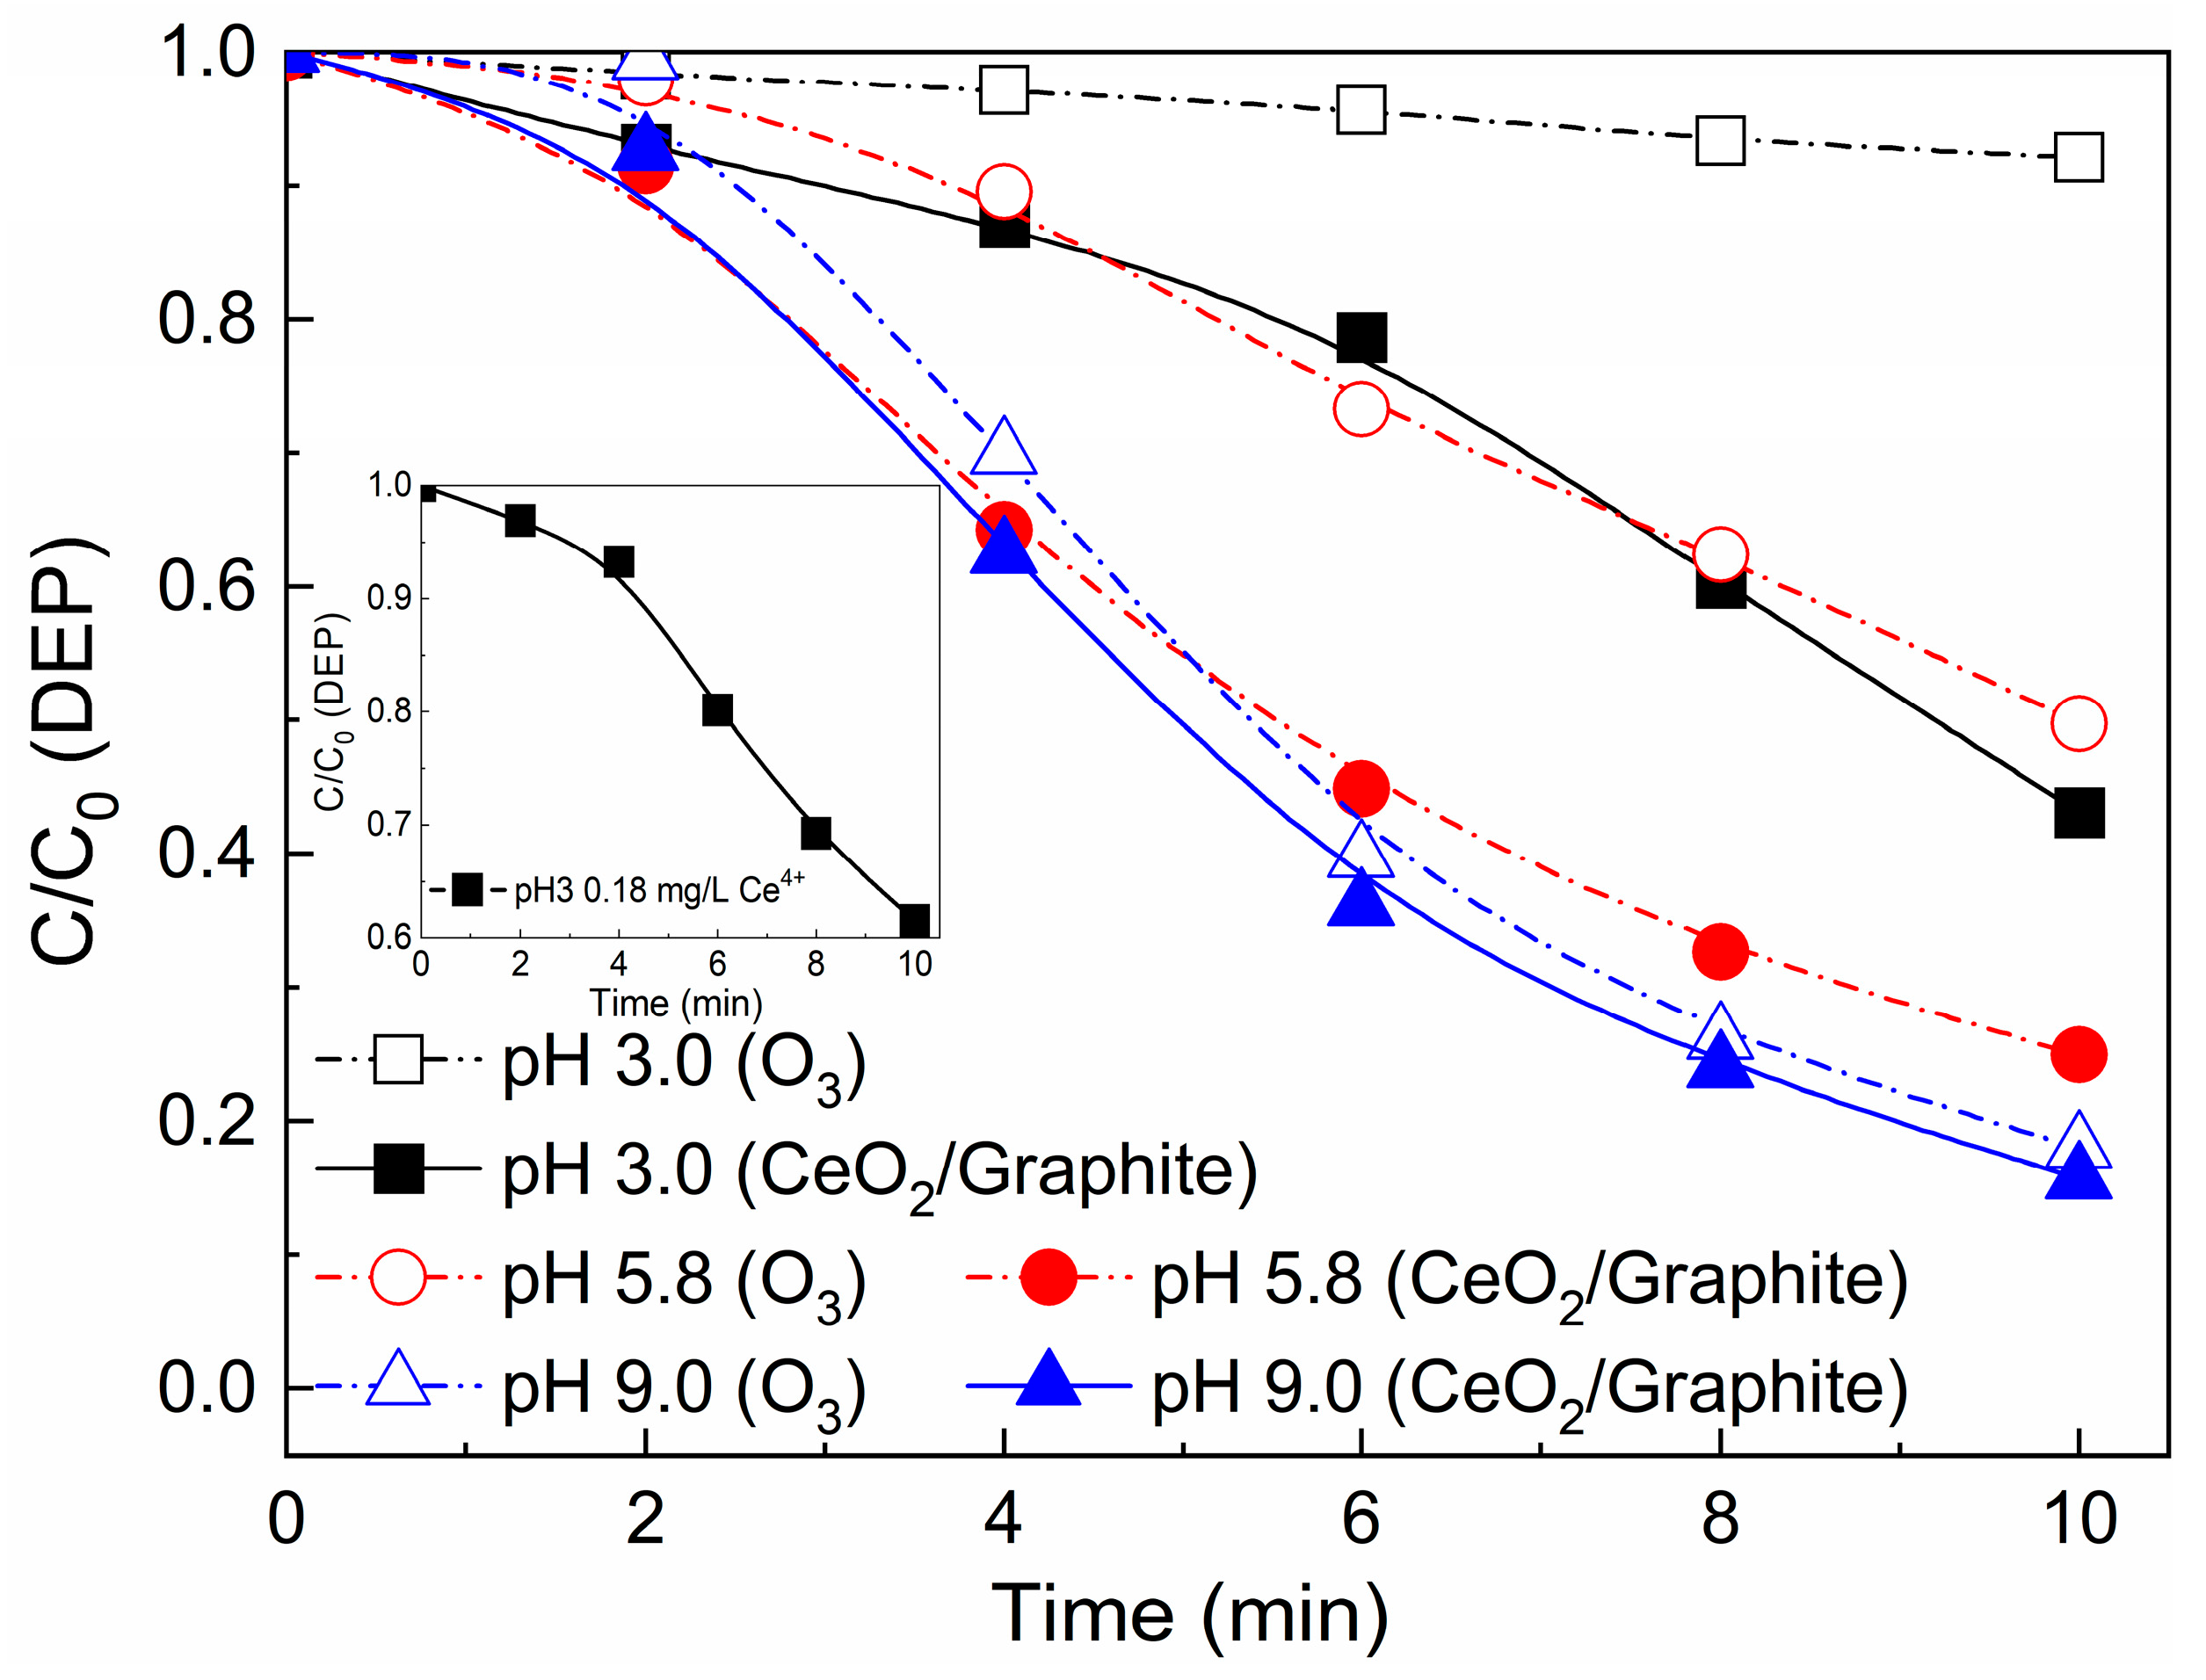
The influence of initial pH on the DEP degradation was investigated during CeO2/graphite catalytic ozonation, and the results of ozonation alone are also presented for comparison (Figure 8). DEP degradation efficiency by ozonation alone significantly increased with the increase in the initial pH. It has been reported that ozone can hardly self-decomposed to generate OH in aqueous solution at an initial pH of 3.0 [41]. Thus, the DEP degradation efficiency is low since it mainly relies on the slowly direct oxidation by ozone (k = 0.14 M−1 s−1) [23]. Increasing the pH value of aqueous solution can increase the ozone decomposition rate to generate more OH and can maintain a stable concentration of OH in the aqueous solution [27], which may lead to a remarkable increase in the DEP degradation efficiency due to the fast reaction between DEP and OH (k = 3.98 × 10⁹ M−1 s−1) [24].
With the presence of the CeO2/graphite catalyst, ozone decomposition was accelerated and generated OH in aqueous solution even at an initial pH of 3.0, thus DEP degradation efficiency increased from 7.9% of ozonation alone to 56.9% of CeO2/graphite catalytic ozonation (Figure 8). The metal ion in the solution after ozonation with CeO2/graphite catalyst at the initial pH 3.0 was determined to be 0.18 mg/L. To investigate the possible influence of the leaching metal ion on DEP degradation during ozonation, the experiment was carried out and the results are presented in the inserted figure of Figure 8. The DEP degradation efficiency was 38.5% during ozonation with 0.18 mg/L Ce4+, which is much higher than that of ozonation alone (7.9%) but lower than that of CeO2/graphite catalytic ozonation (56.9%). This result indicates that the metal ion (Ce4+) leaching from CeO2/graphite catalyst does have a certain catalytic effect in ozonation, but the CeO2 supported on the graphite surface also plays a catalytic role in the DEP degradation.
At an initial pH of 5.8, the DEP degradation efficiency during CeO2/graphite catalytic ozonation was 75.0%, which is significantly higher than that of ozonation alone (50.2%) (Figure 8). However, at an initial pH of 9.0, the improvement effect on DEP degradation efficiency by CeO2/graphite catalyst addition is not as remarkable as in the acidic or neutral solution. A reasonable explanation is that ozone self-decomposes more quickly at an initial pH of 9.0 [27], and the effect of CeO2/graphite catalyst in promoting ozone decomposition at this pH is not as significant as that at lower pH. Though ozonation alone in alkaline solution can achieve similar effects as CeO2/graphite catalytic ozonation, for the convenience of subsequent treatment and to save reagents, most water treatment is recommended to be carried out under neutral or near neutral conditions, and CeO2/graphite catalytic ozonation have advantages over ozonation alone from this point of view.

3.4.3. Effect of Reaction Temperature

The influence of reaction temperature, ranging from 10 °C to 40 °C on the DEP degradation, was investigated during CeO2/graphite catalytic ozonation, and the results during ozonation alone are also presented for comparison (Figure 9). Within the temperature range of this study, raising the reaction temperature is beneficial for DEP degradation both in ozonation alone and in CeO2/graphite catalytic ozonation, especially in the range of 10 °C to 30 °C. Though DEP degradation efficiency during CeO2/graphite catalytic ozonation is always better than that during ozonation alone, the gap between these two processes significantly reduces at high reaction temperature (above 20 °C). A reasonable explanation is that the increase in water temperature can not only promote the decomposition of ozone to produce more OH [27], but also accelerate the reaction between the generated OH and DEP [24], which makes the catalytic effect in promoting ozone decomposition and DEP degradation not as remarkable as that at low temperature. However, most water treatment is carried out at room temperature (around 20 °C) since raising the water temperature requires a significant energy consumption. Thus, CeO2/graphite catalytic ozonation has advantages over ozonation alone from this point of view.

3.5. Reaction Mechanism of CeO2/Graphite Catalytic Ozonation

3.5.1. Evolution of Ozone Concentration and Hydrogen Peroxide Concentration

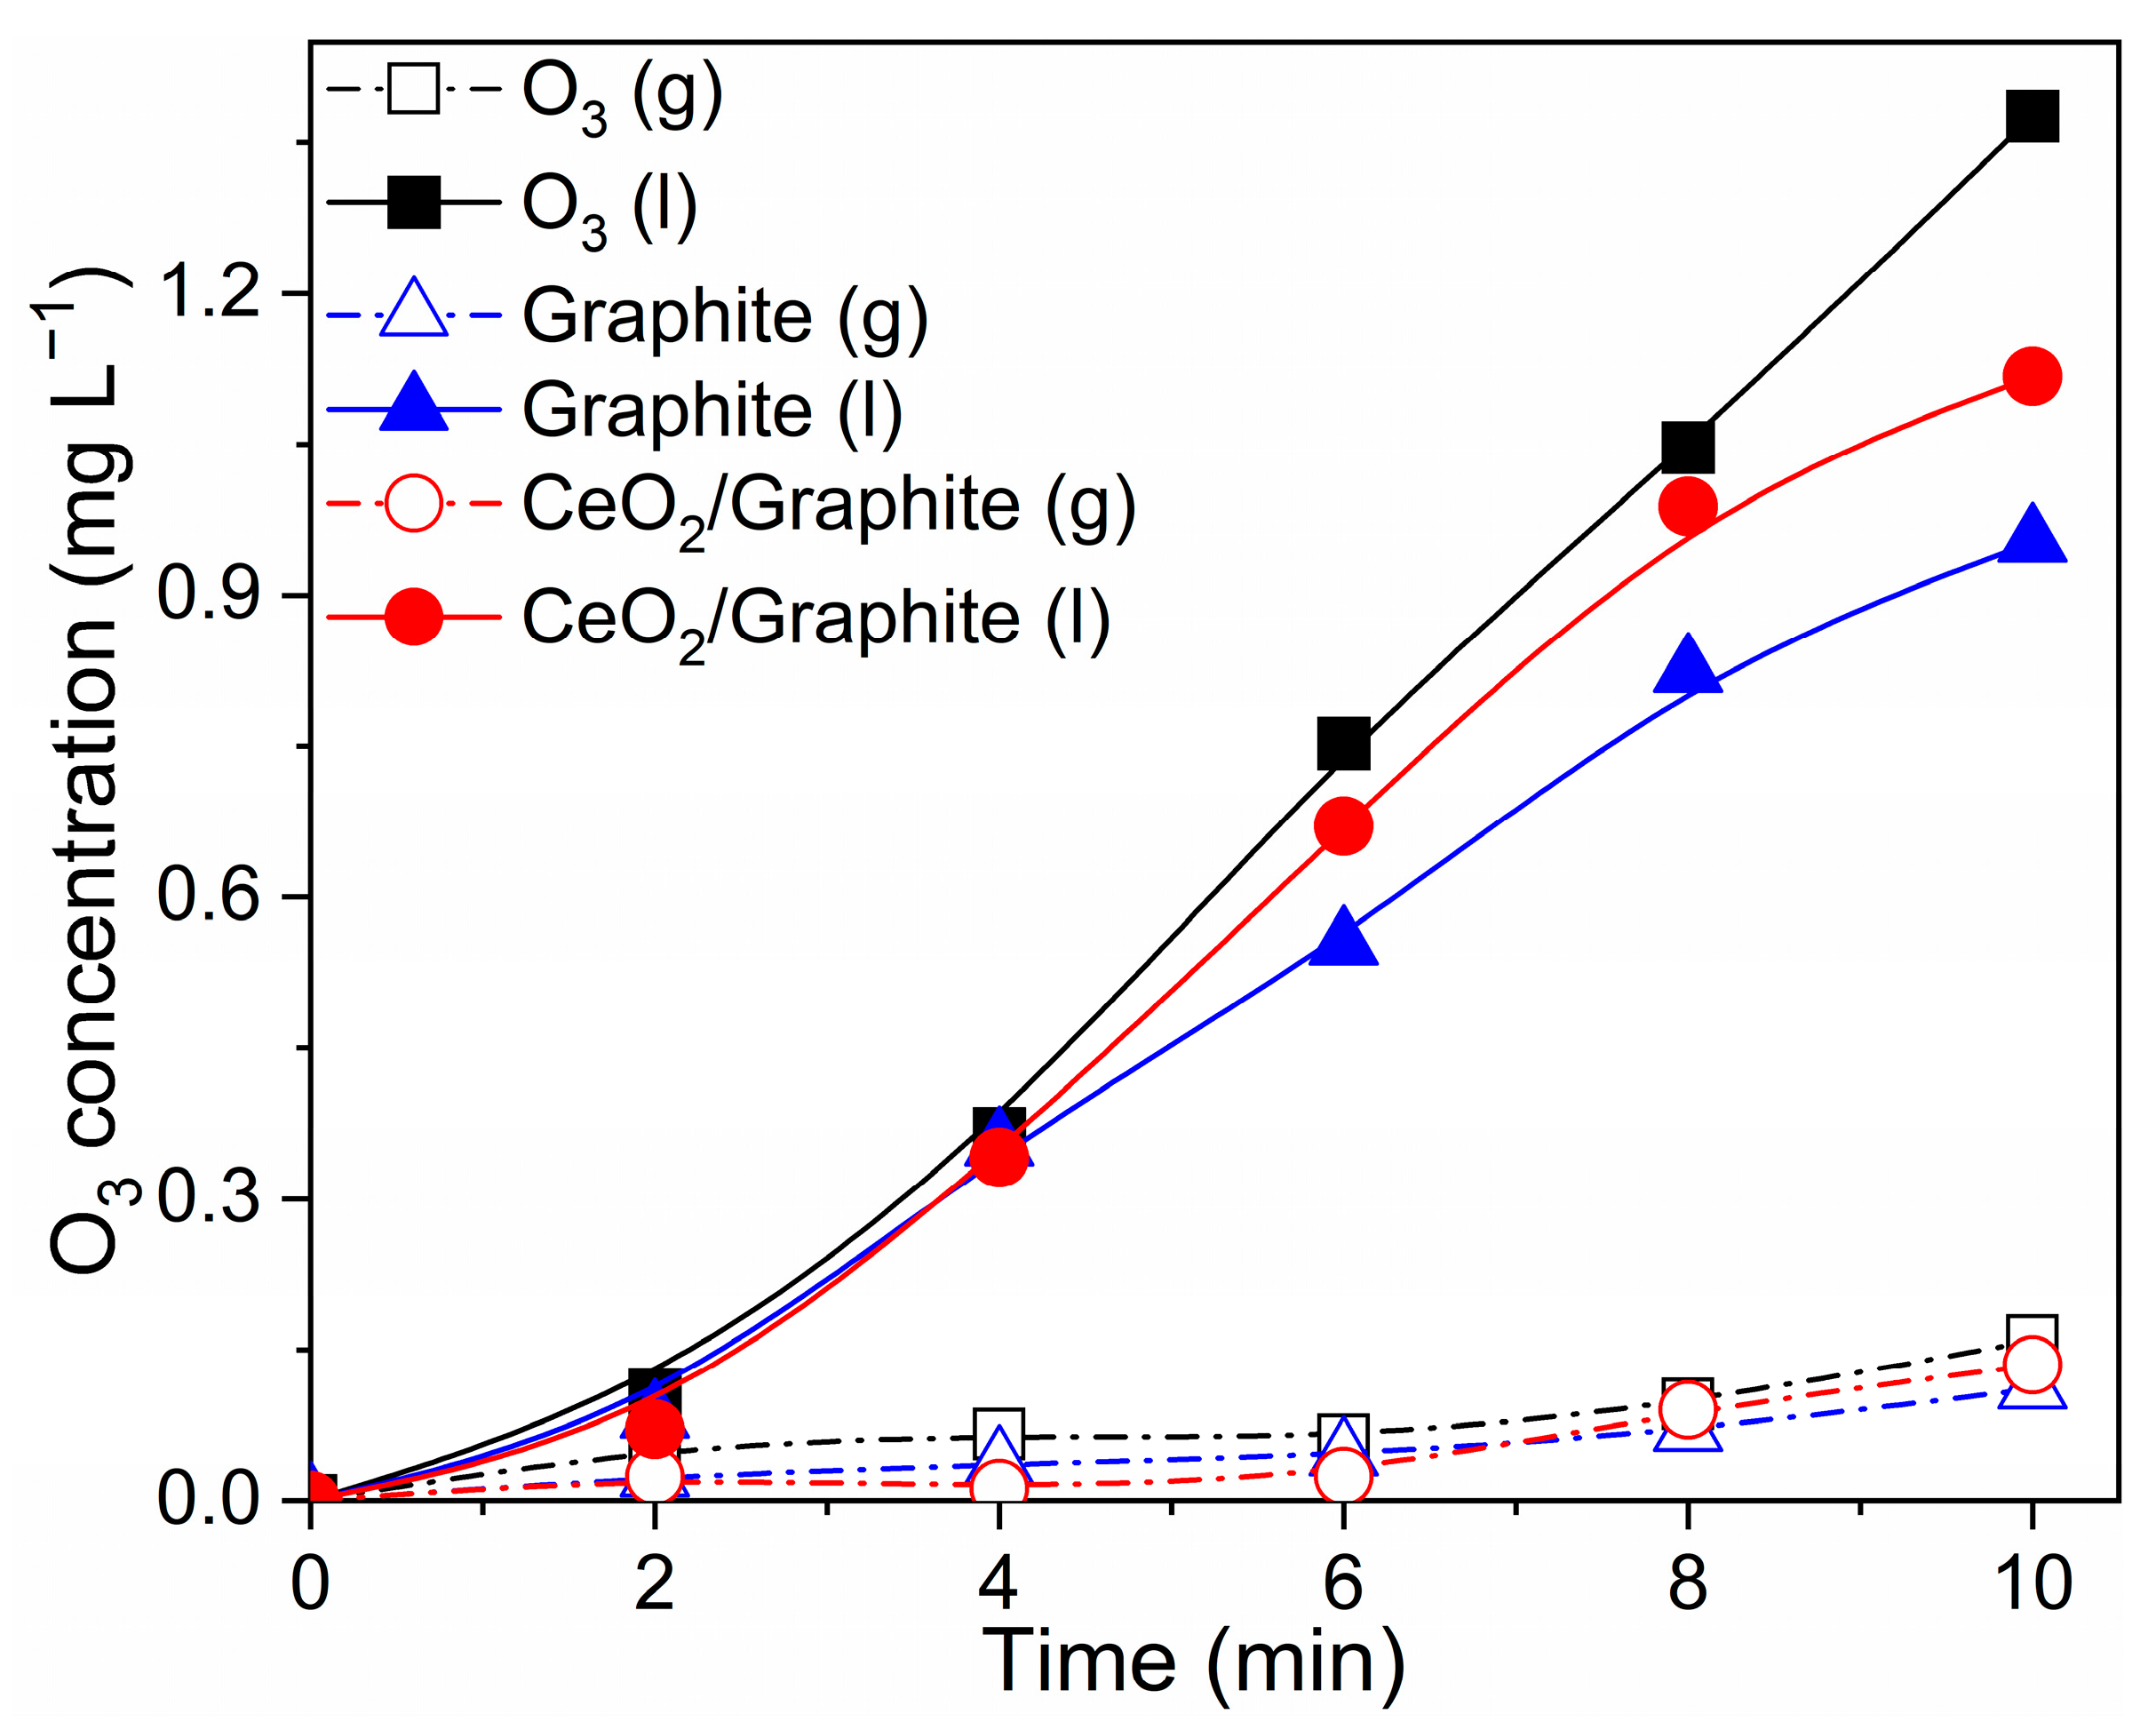
The variations of both aqueous ozone concentration and gaseous ozone concentration were investigated for ozonation alone, graphite catalytic ozonation, and CeO2/graphite catalytic ozonation (Figure 10). It was found that the difference in gaseous ozone concentration was almost negligible among the three processes during the whole reaction. However, the aqueous ozone concentration in the three processes showed significant differences as the reaction prolonged and the order of dissolved ozone concentration was ozonation alone > CeO2/graphite catalytic ozonation > graphite catalytic ozonation (Figure 10). The consumption of ozone during the ozonation process comes from the self-decomposition of ozone, the catalytic ozone decomposition, and the DEP oxidation. For the ozonation alone process, only the self-decomposition of ozone and the DEP oxidation would consume ozone, resulting in the highest residual ozone concentration in the aqueous solution (Figure 10). For graphite and CeO2/graphite catalytic ozonation processes, in addition to the self-decomposition of ozone and the DEP oxidation, the presence of catalysts also catalyzes the decomposition of ozone to generate free radicals (such as OH) to promote the DEP degradation, thus their residual ozone concentrations in the aqueous solution are lower than that of the ozonation alone process (Figure 10). It is interesting that the residual aqueous ozone concentration in the CeO2/graphite catalytic ozonation process is higher than that of graphite though the DEP degradation efficiency by CeO2/graphite catalytic ozonation is higher than that of graphite catalytic ozonation. It is well-known that different catalysts have different catalytic efficiencies on decomposition of ozone into OH [42], hence, a possible reason for the above results is that the CeO2/graphite catalyst can more effectively transfer ozone into OH than the graphite catalyst, resulting in better DEP degradation efficiency with less ozone consumption (Figure 1 and Figure 10).
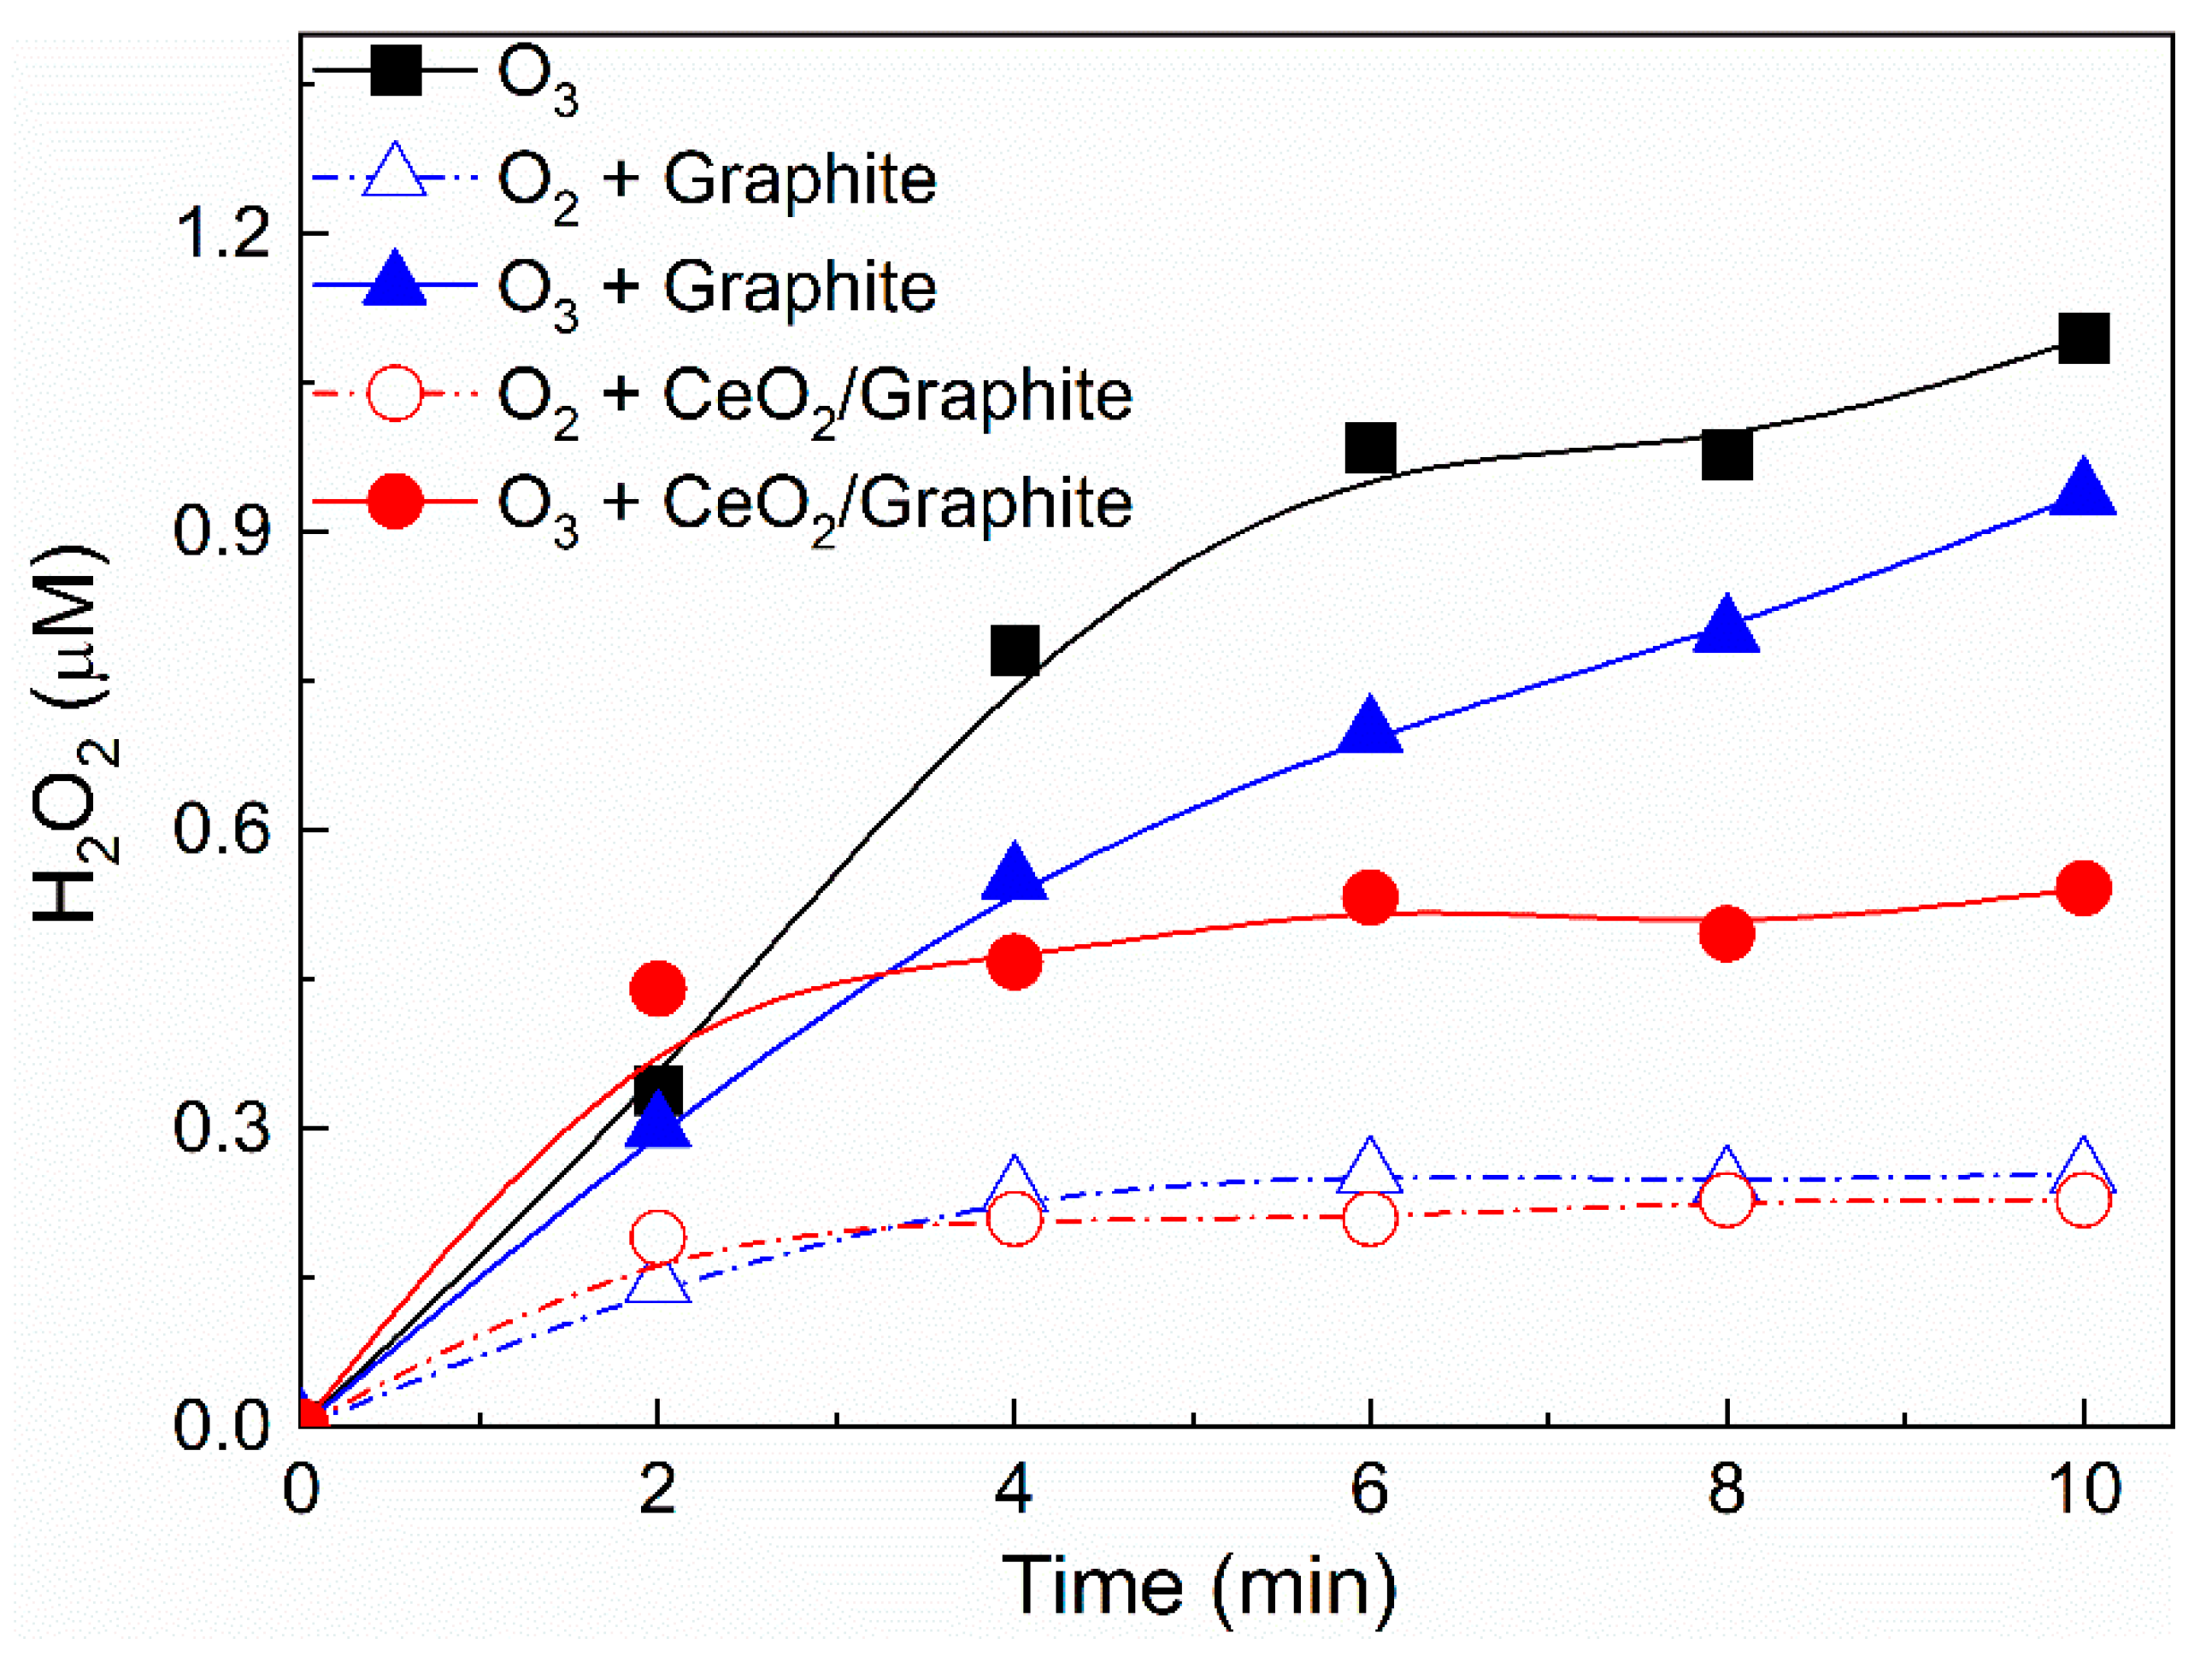
The variation of H2O2 concentrations during ozonation alone, graphite catalytic ozonation, and CeO2/graphite catalytic ozonation was investigated (Figure 11). It has been reported that the reducing sites on the surface of carbon materials (such as π electron structures and basic oxygenated groups) can reduce dissolved oxygen to produce a certain amount of H2O2 in aqueous solution [38,43,44]. In this study, the generation of H2O2 during the CeO2/graphite adsorption process was also investigated by replacing O3 with O2 (Figure 11). The loading of CeO2 had little effect on the evolution of H2O2 concentration on graphite during adsorption process but had a significant effect on the evolution of H2O2 concentration in catalytic ozonation, and the order of H2O2 concentration is ozonation alone > graphite catalytic ozonation > CeO2/graphite catalytic ozonation (Figure 11). It has been reported that the intermediate product H2O2 reacts with the ozone adsorbed on the surface of AC to generate OH [45], resulting in a lower H2O2 concentration in AC catalytic ozonation compared to ozonation alone [45,46,47]. This is consistent with the lower concentration of H2O2 during catalytic ozonation with graphite or CeO2/graphite compared to ozonation alone in this study. Additionally, CeO2 also has a strong ability to decompose H2O2 [48], which may be the reason for the lowest H2O2 concentration in the CeO2/graphite catalytic ozonation among the three oxidation processes.

3.5.2. Effect of the Presence of TBA

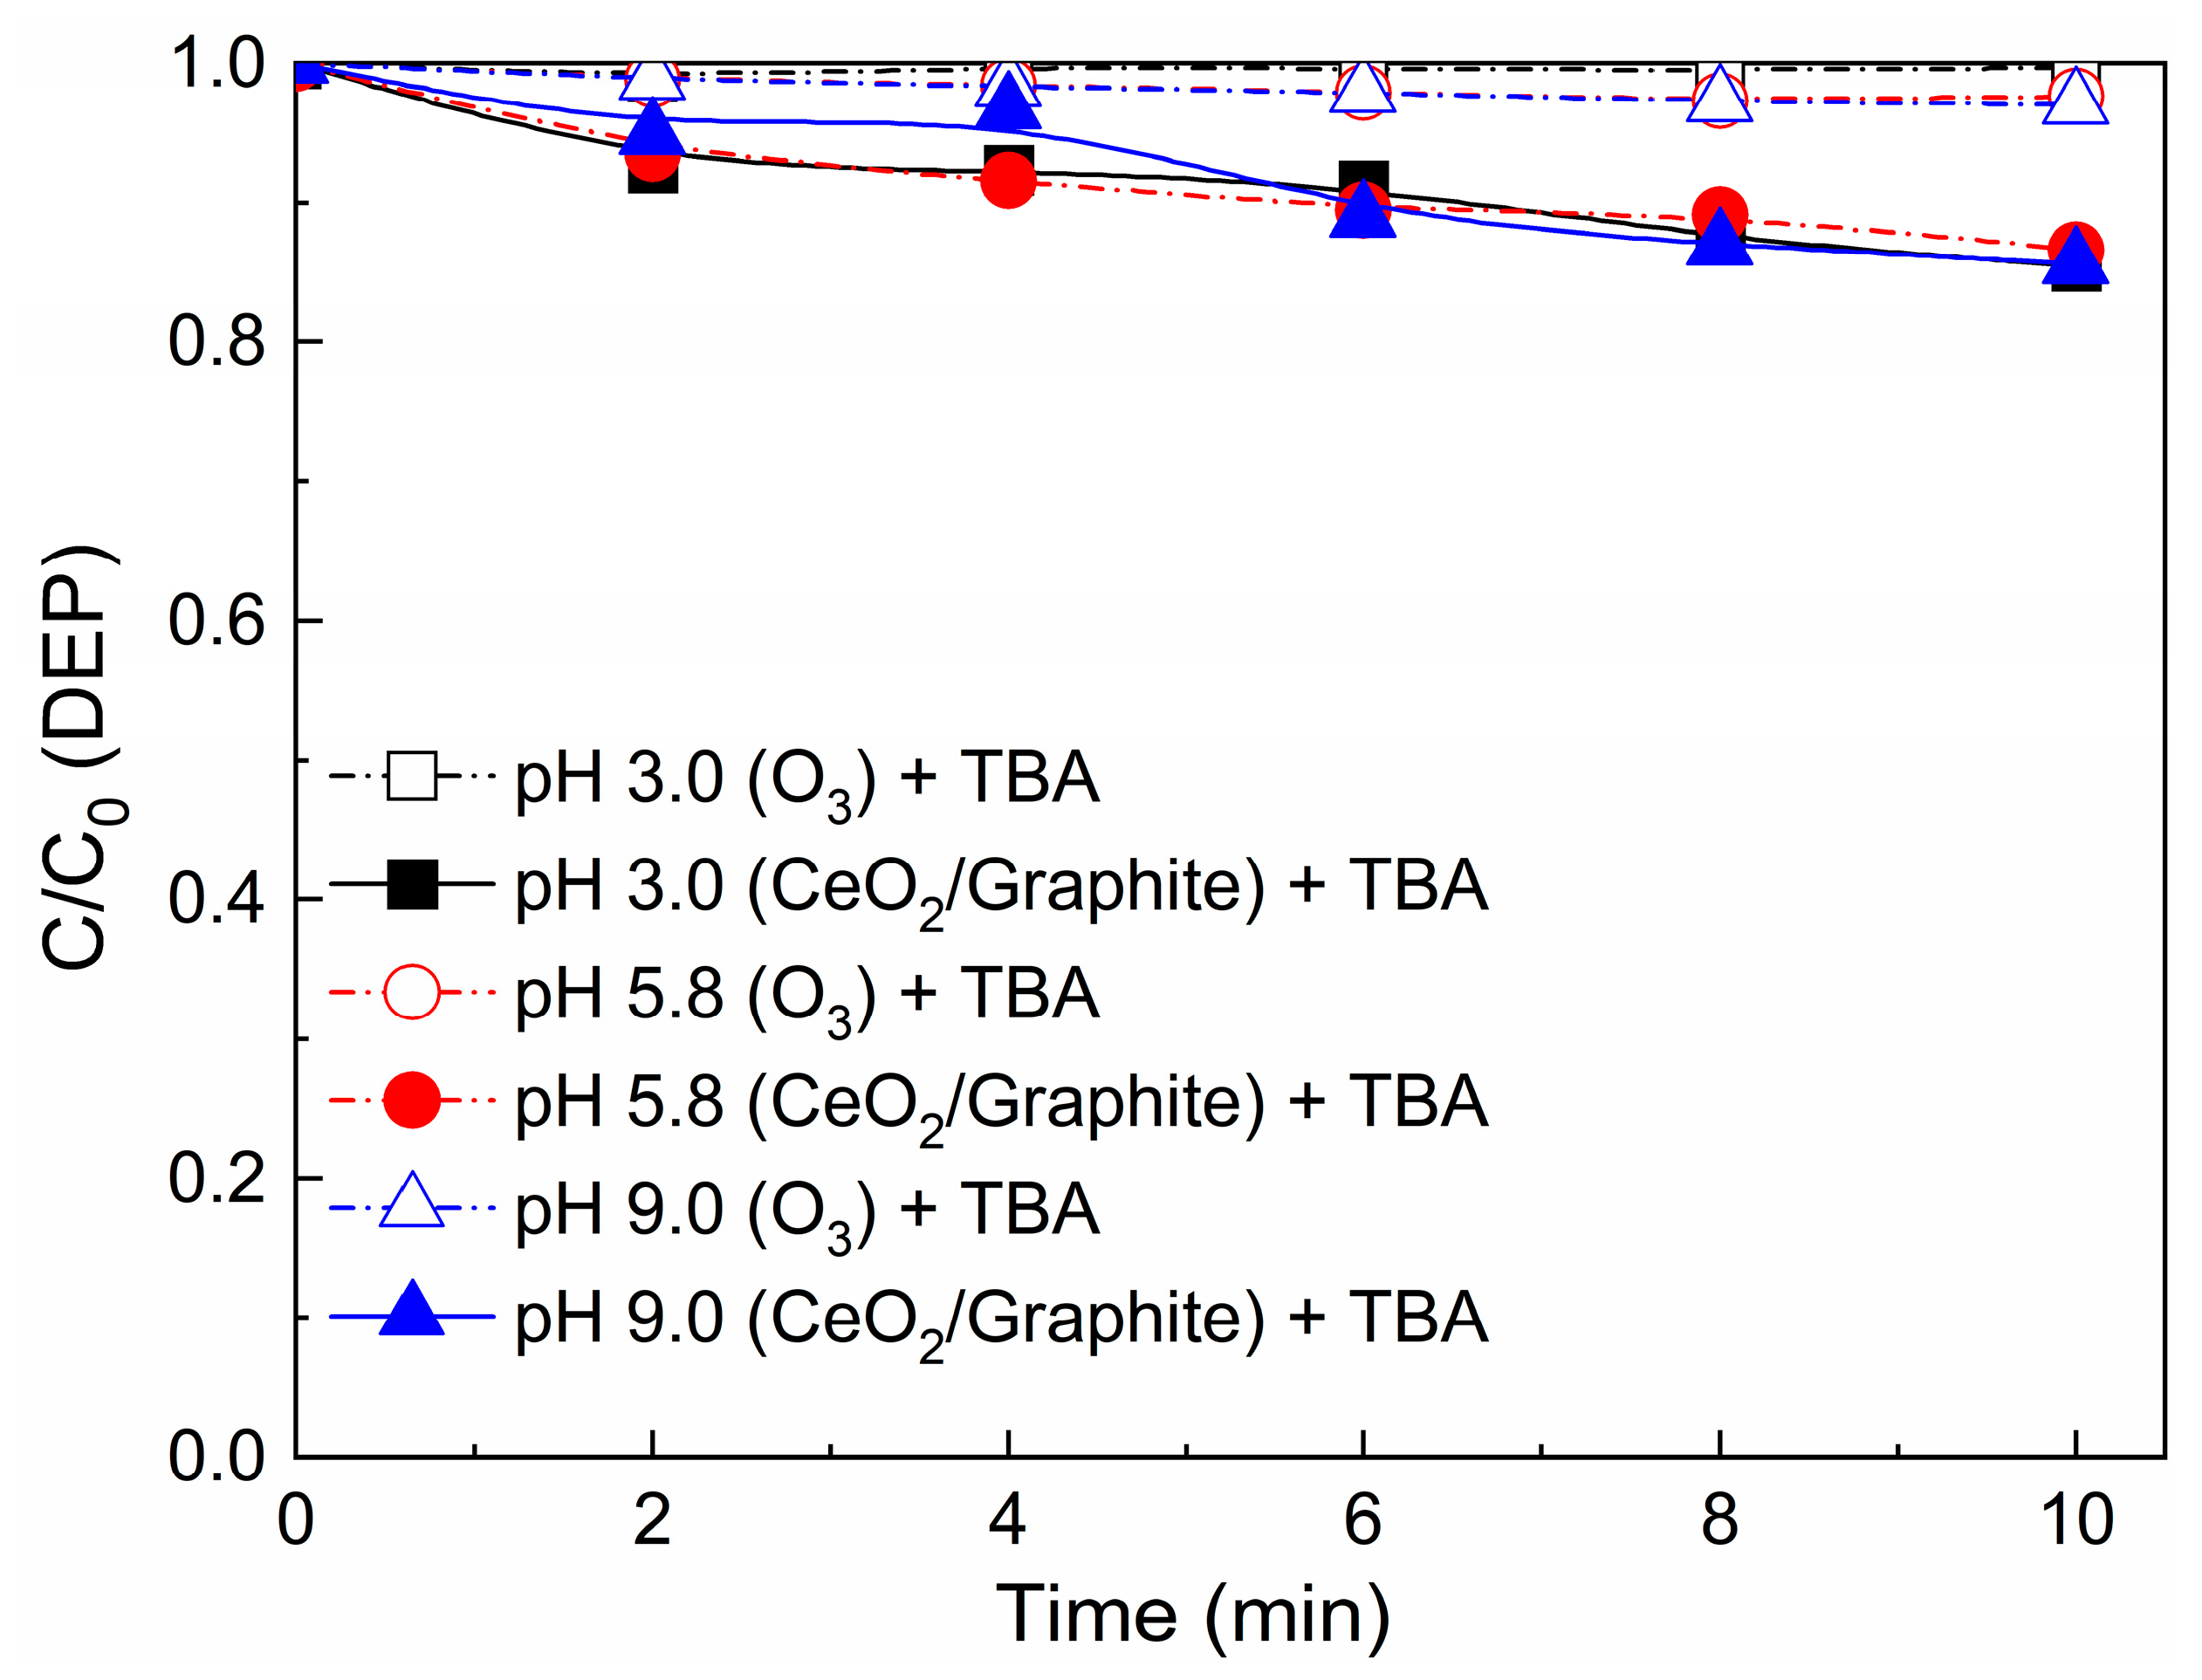
It is generally believed that the DEP degradation in ozone-based advanced oxidation processes follows the OH reaction mechanism [49,50,51,52,53]. Thus, the role of OH in the present study was investigated using TBA as a radical scavenger, as TBA reacts very quickly with OH (k = 6 × 10⁸ M−1 s−1) [27] and very slowly with ozone (k = 0.001 M−1 s−1) [23,52]. The effect of TBA addition on ozonation of DEP with or without the CeO2/graphite catalyst is shown in Figure 12.
The DEP degradation was almost completely inhibited with TBA addition during ozonation alone at pH 3.0, 5.8, and 9.0 (Figure 12) which should be because the OH derived from ozone decomposition has been completely quenched by TBA and the reaction rate between DEP and ozone is very slow as aforementioned. The DEP degradation significantly decreased with TBA addition during CeO2/graphite catalytic ozonation at pH 3.0, 5.8, and 9.0, as the DEP degradation efficiency did not exceed 15% at all the three initial pH values (Figure 12) while it was 56.9%, 75.0%, and 84.3% at pH 3.0, 5.8, and 9.0 without TBA addition, respectively (Figure 8). These results demonstrate that OH plays an important role in DEP degradation during CeO2/graphite catalytic ozonation.

3.5.3. Discussion of the Reaction Mechanism

As mentioned above, the quenching experiments of TBA show that OH plays a key role in the DEP degradation during CeO2/graphite catalytic ozonation. Urs von Gunten proposed the concept of Rct (Equation (1)) [28] and thought that it could be used to characterize the ability of catalysts on ozone decomposition to generate OH [53,54], as shown in Equation (1).
R ct = OH dt O 3 dt = ln p CBA t / p CBA 0 k OH , p CBA × 1 O 3 dt
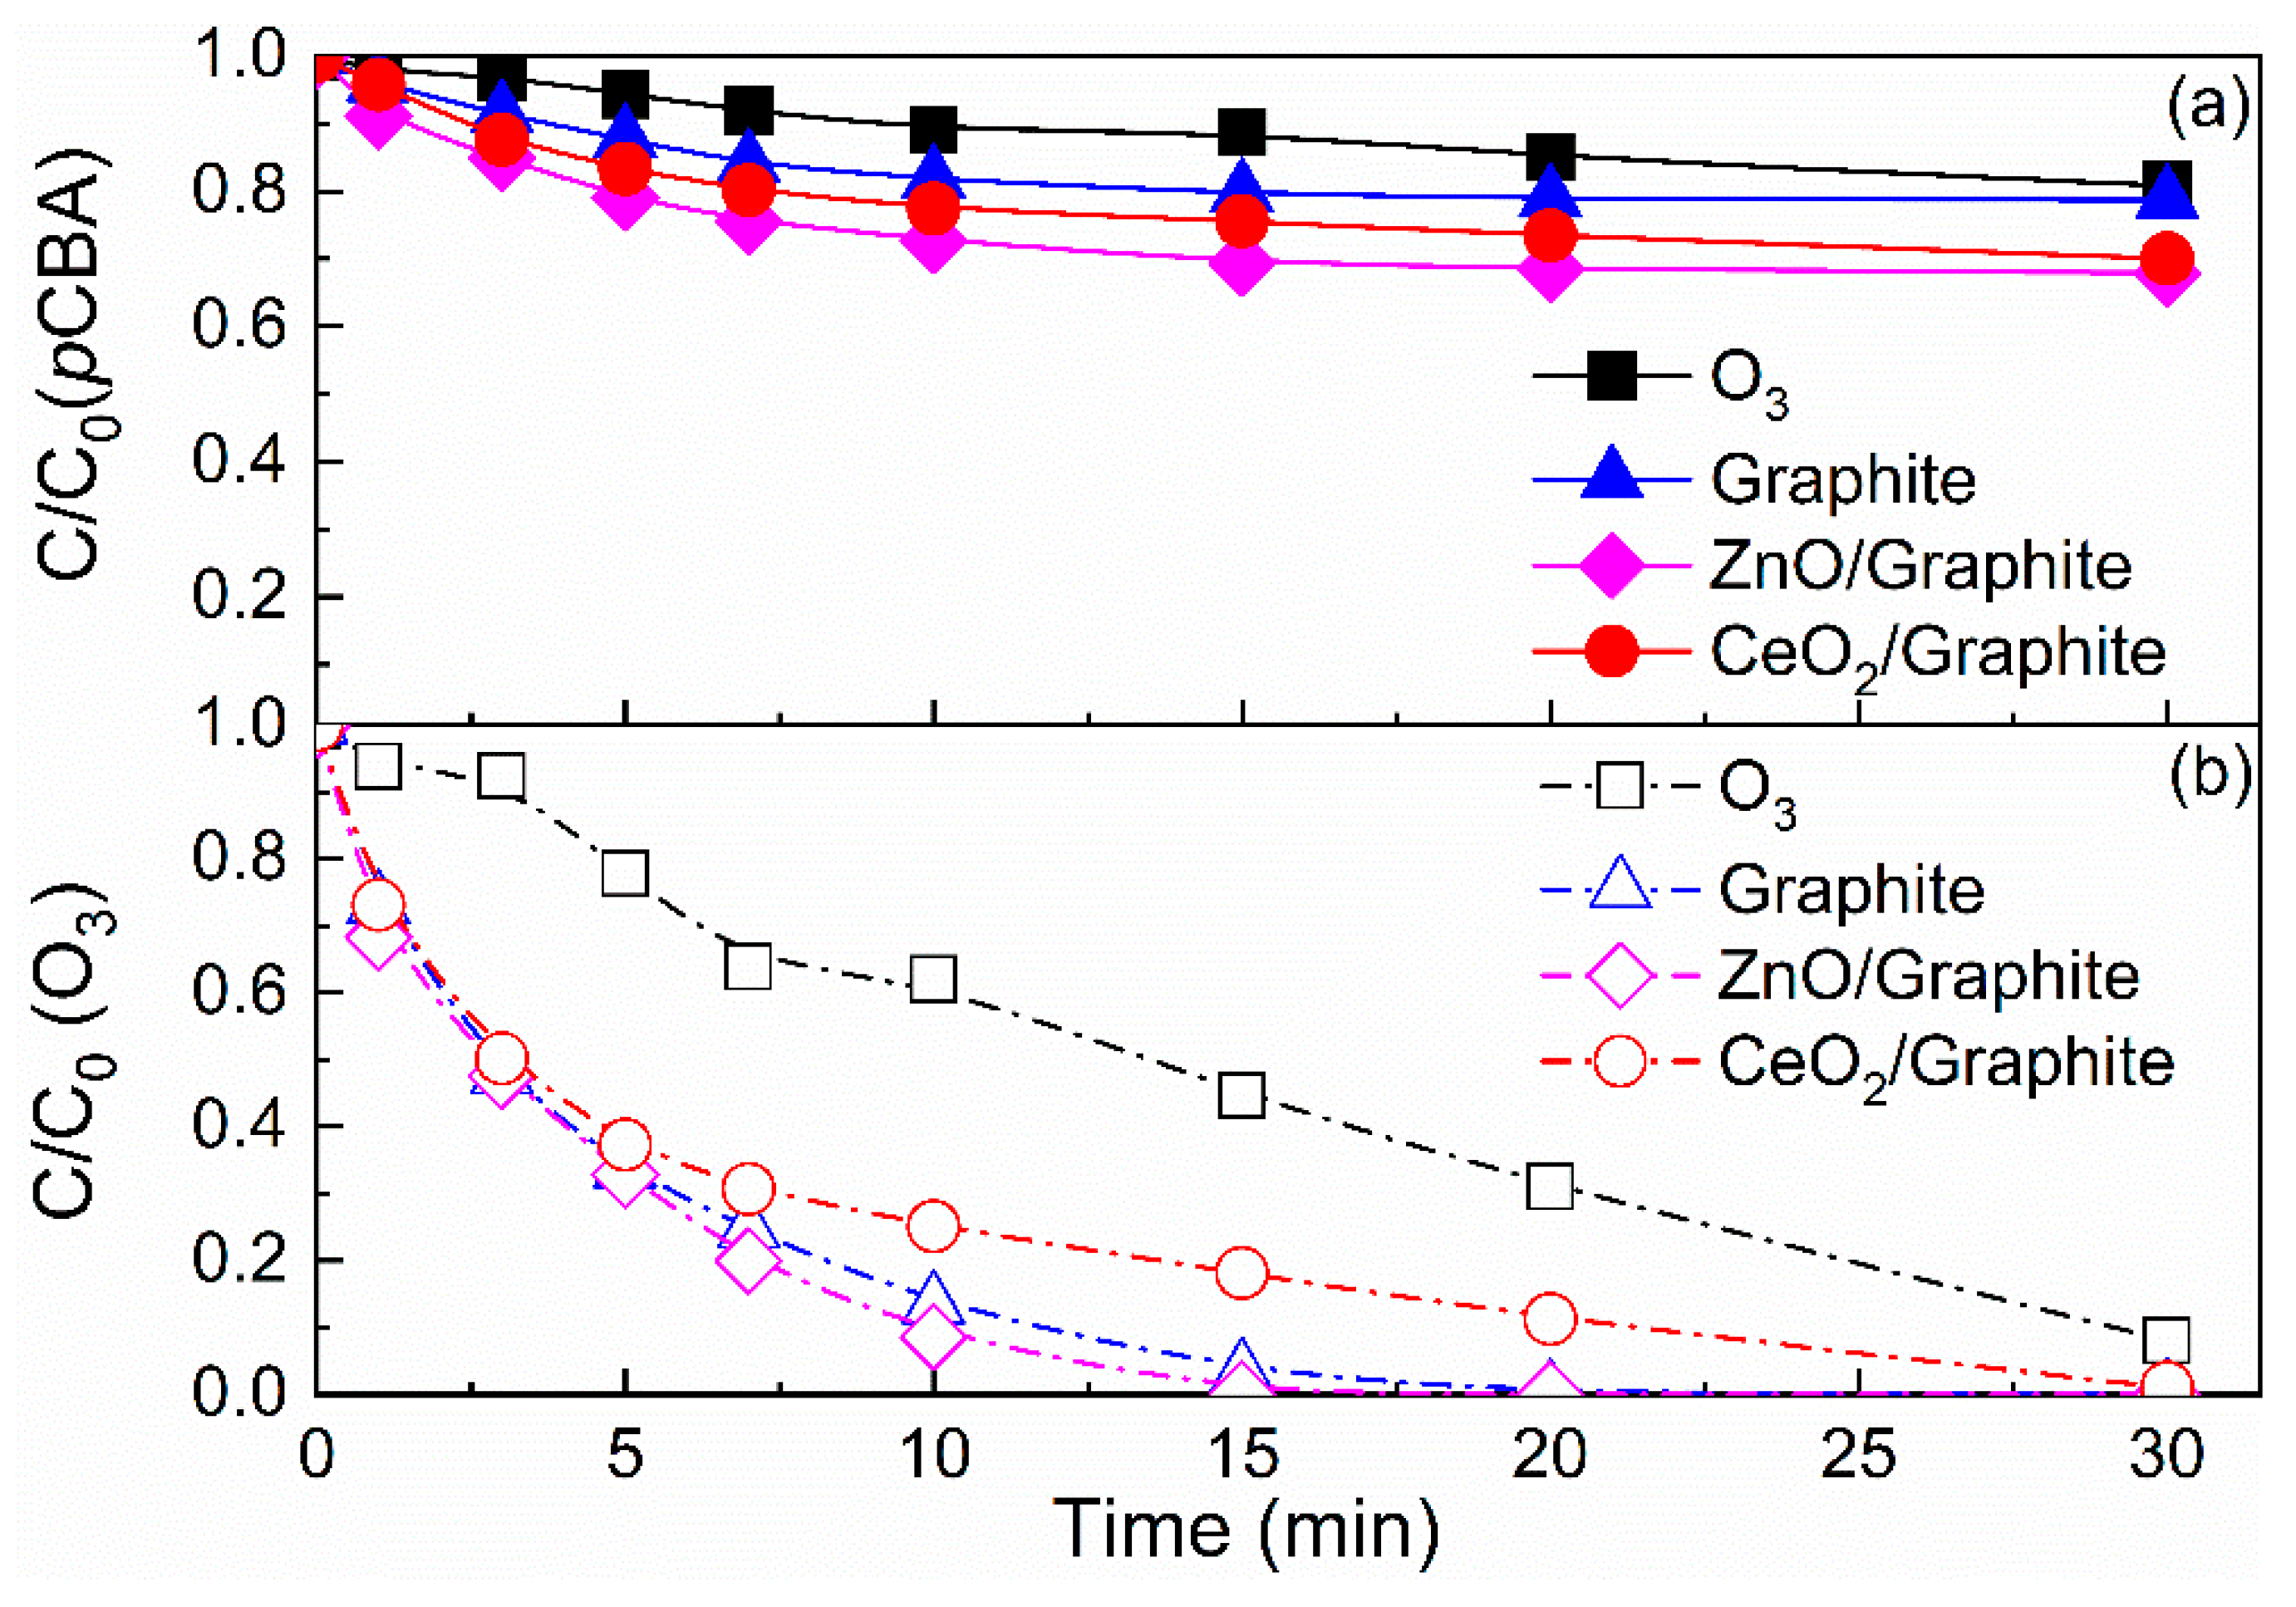
The terms of O 3 dt and OH dt represent the time-integrated concentration of ozone and OH, which is equal to ozone exposure and OH exposure, respectively. The Rct values for ozone alone and ozonation with different catalysts can be obtained using Equation (1) to process the data in Figure 13. As shown in Table 1, the Rct value for ozone alone was 1.13 × 10⁻⁹, which is similar to the Rct value of 1.0 × 10⁻⁹ previously reported in the literature [55]. The Rct value for ozonation with graphite and graphite supported metal oxides catalysts in this study is similar to that of graphene oxide [56] and some granular activated carbon [53,55], but smaller than that of carbon nanotubes [55] and graphene oxide supported metal oxides [56]. Interestingly, although the graphite catalyst is not as effective as the CeO2/graphite catalyst in the degradation of DEP and pCBA (Figure 1 and Figure 13a), it had a larger Rct value (Table 1). Although the OH exposure of the graphite catalytic ozonation is smaller than that of CeO2/graphite (Figure 13a), it decomposes more ozone than CeO2/graphite (Figure 13b) and makes its ozone exposure smaller (Table 1). Thus, the graphite catalyst has a larger Rct value in ozonation since Rct is the ratio of OH exposure to ozone exposure. Overall, the graphite catalyst has greater Rct value than the CeO2/graphite catalyst, mainly because it improves ozone utilization efficiency rather than OH yield [57].
In order to better characterize the ability of catalysts to decompose ozone to generate OH, we introduced the concept of R OH , O 3 proposed by Kwon et al., which is the ratio of OH exposure to the amount of ozone consumption (Equation (2)) [58].
R OH , O 3 = R ct k O 3 = OH dt O 3 dt × k O 3 = OH dt O 3 0 × 1 e k O 3 t = OH dt O 3 0 O 3 t = OH dt Δ O 3 t
The term of Δ O 3 t represents the total ozone consumption at time t of the reaction. Similarly, the R OH , O 3 values for ozonation alone and ozonation with different catalysts can be obtained by processing the data in Figure 13 with Equation (2). As can be seen from Table 1, the R OH , O 3 value increased in the order of O3+CeO2/graphite > O3+ZnO/graphite > O3+graphite > O3. An interesting thing is that although the CeO2/graphite catalyst is not as effective at degrading DEP and pCBA as the ZnO/graphite catalyst (Figure 1 and Figure 13a), it has greater R OH , O 3 value (Table 1). This means that the CeO2/graphite catalyst is more efficient at converting dissolved ozone into OH than the ZnO/graphite catalyst.
Different researchers have different views on the reaction mechanism of ozonation with carbon materials [10]. Some believe that the degradation reaction of organic compounds follows the surface reaction mechanism, some believe that it follows the bulk solution reaction mechanism, and some researchers believe that it follows the combined effect of the surface reaction and the bulk solution reaction [32,59,60,61]. In the present study, if surface reactions play a role in the DEP degradation, when the initial pH of the solution changes from 3.0 to 9.0, it will cause a change on the surface charged state of CeO2/graphite catalyst from positive to negative as the pHPZC of this catalyst is 7.2 [62], which will inevitably affect the adsorption and decomposition of ozone on its surface due to the electrophilic property of ozone [27]. Subsequently, the contribution of surface reactions will change, and the degradation efficiency of DEP will also be affected.
Previous studies have shown that TBA has little adsorption on the surface of carbon materials [60], so it can completely inhibit the DEP degradation through the bulk solution reaction, but it is difficult to inhibit the DEP degradation through surface reactions [32]. However, the degradation efficiency of DEP is almost the same at different initial pH (3.0, 5.8, or 9.0) in the presence of TBA during ozonation with CeO2/graphite (Figure 8). Therefore, it can be inferred that the contribution of surface reaction to DEP degradation is almost negligible, and the DEP degradation mainly depends on the OH generated by the bulk solution reaction during CeO2/graphite catalytic ozonation. Actually, the above discussion of Rct and R OH , O 3 has proven that the CeO2/graphite catalyst has a good ability to convert ozone into OH in bulk solution (Table 1). In general, CeO2/graphite is a good catalyst, both in terms of its effectiveness in DEP degradation and TOC removal, and from the perspective of catalyst stability.

4. Conclusions

The CeO2/graphite catalyst can not only decompose DEP effectively during ozonation, but also remove TOC effectively, and the active component CeO2 loaded on graphite shows good stability during repeated use. The optimal preparation conditions for CeO2/graphite catalyst were a Ce loading of 3.5% and a pyrolysis temperature of 400 °C.
The degradation efficiency of DEP increases as the ozone dosage increases within the range of 0.14 mg/min to 0.68 mg/min for both ozonation alone and CeO2/graphite catalytic ozonation. Catalyst dosage (50–200 mg/L) has a remarkable influence on the DEP degradation during CeO2/graphite catalytic ozonation. The degradation efficiency of DEP first increases and then decreases with the increase in its initial concentration (1–10 μM) for CeO2/graphite catalytic ozonation. The increase in both initial pH (3.0–9.0) and reaction temperature (10–40 °C) can promote the degradation of DEP for CeO2/graphite catalytic ozonation.
The DEP degradation is significantly inhibited with the addition of TBA during CeO2/graphite catalytic ozonation for initial pH 3.0, 5.8, or 9.0, and the results of Rct and R OH , O 3 indicate that the CeO2/graphite catalyst has a good ability to convert ozone into OH in bulk solution. The DEP degradation should mainly depend on the OH generation in the bulk solution during CeO2/graphite catalytic ozonation.

Author Contributions

X.-Y.T.: Investigation, writing—original draft preparation; Y.-H.C.: Conceptualization, methodology, supervision, writing—review and editing; Z.-Q.L.: Funding acquisition, investigation, data curation. All authors have read and agreed to the published version of the manuscript.

Funding

This research was funded by the National Key R&D Program of China, grant number 2022YFE0105600.

Data Availability Statement

Data will be made available on request.

Conflicts of Interest

The authors declare no conflicts of interest.

References

  1. Parvulescu, V.I.; Epron, F.; Garcia, H.; Granger, P. Recent Progress and Prospects in Catalytic Water Treatment. Chem. Rev. 2022, 122, 2981–3121. [Google Scholar] [CrossRef] [PubMed]
  2. Li, L.; Liu, S.; Cheng, M.; Lai, C.; Zeng, G.; Qin, L.; Liu, X.; Li, B.; Zhang, W.; Yi, Y.; et al. Improving the Fenton-like catalytic performance of MnOx-Fe3O4/biochar using reducing agents: A comparative study. J. Hazard. Mater. 2021, 406, 124333. [Google Scholar] [CrossRef] [PubMed]
  3. Yan, Y.; Wei, Z.; Duan, X.; Long, M.; Spinney, R.; Dionysiou, D.D.; Xiao, R.; Alvarez, P.J.J. Merits and limitations of radical vs. nonradical pathways in persulfate-based advanced oxidation processes. Environ. Sci. Technol. 2023, 57, 12153–12179. [Google Scholar] [CrossRef]
  4. Liu, Z.-Q.; Han, B.-J.; Wen, G.; Ma, J.; Wang, S.-J.; Zha, R.-G.; Shen, L.-P.; Wang, C. Full-scale application of catalytic ozonation for drinking water treatment: Case study in China. J. Environ. Eng. 2014, 140, A5013002. [Google Scholar] [CrossRef]
  5. Ghiyasiyan-Arani, M.; Masjedi-Arani, M.; Salavati-Niasari, M. Size controllable synthesis of cobalt vanadate nanostructures with enhanced photocatalytic activity for the degradation of organic dyes. J. Mol. Catal. A Chem. 2016, 425, 31–42. [Google Scholar] [CrossRef]
  6. Mazloom, F.; Masjedi-Arani, M.; Ghiyasiyan-Arani, M.; Salavati-Niasari, M. Novel sodium dodecyl sulfate-assisted synthesis of Zn3V2O8 nanostructures via a simple route. J. Mol. Liq. 2016, 214, 46–53. [Google Scholar] [CrossRef]
  7. Cui, Y.H.; Li, X.Y.; Chen, G. Electrochemical degradation of bisphenol A on different anodes. Water Res. 2009, 43, 1968–1976. [Google Scholar] [CrossRef] [PubMed]
  8. Hu, R.; Yang, S.Q.; Li, J.Y.; Sun, F.; Liu, Z.Q.; Yang, J.; Cui, Y.H.; Zhang, B. Insight into micropollutant abatement during ultraviolet light-emitting diode combined electrochemical process: Reaction mechanism, contributions of reactive species and degradation routes. Sci. Total Environ. 2023, 876, 162798. [Google Scholar] [CrossRef] [PubMed]
  9. Yang, J.; Fu, L.; Wu, F.; Chen, X.; Wu, C.; Wang, Q. Recent developments in activated carbon catalysts based on pore size regulation in the application of catalytic ozonation. Catalysts 2022, 12, 1085. [Google Scholar] [CrossRef]
  10. Liu, Z.Q.; Li, J.Y.; Li, S.T. Catalytic Ozonation over Activated Carbon-based Materials. In Advanced Ozonation Processes for Water and Wastewater Treatment: Active Catalysts and Combined Technologies; Cao, H., Xie, Y., Wang, Y., Xiao, J., Eds.; Royal Society of Chemistry: Croydon, UK, 2022; pp. 85–122. [Google Scholar]
  11. Oh, S.-Y.; Nguyen, T.-H.A. Ozonation of phenol in the presence of biochar and carbonaceous materials: The effect of surface functional groups and graphitic structure on the formation of reactive oxygen species. J. Environ. Chem. Eng. 2022, 10, 107386. [Google Scholar] [CrossRef]
  12. Liu, Z.-Q.; Tu, J.; Wang, Q.; Cui, Y.-H.; Zhang, L.; Wu, X.; Zhang, B.; Ma, J. Catalytic ozonation of diethyl phthalate in aqueous solution using graphite supported zinc oxide. Sep. Purif. Technol. 2018, 200, 51–58. [Google Scholar] [CrossRef]
  13. Jiménez-López, M.A.; Rey, A.; Rivas, F.J.; Beltrán, F.J. Water ozone decomposition in graphitic and graphene based catalytic materials: Kinetics of catalyst deactivation. Catal. Today 2024, 430, 114541. [Google Scholar] [CrossRef]
  14. Bernat-Quesada, F.; Espinosa, J.C.; Barbera, V.; Álvaro, M.; Galimberti, M.; Navalón, S.; García, H. Catalytic ozonation using edge-hydroxylated graphite-based materials. ACS Sustain. Chem. Eng. 2019, 7, 17443–17452. [Google Scholar] [CrossRef]
  15. Jiménez-López, M.A.; Rey, A.; Montes, V.; Beltrán, F.J. Testing carbon structures for metal-free catalytic/photocatalytic ozonation to remove disinfection by-product formation potential. Sep. Purif. Technol. 2024, 329, 125156. [Google Scholar] [CrossRef]
  16. He, J.; Song, W.; Gao, Z.; Huang, X. Calcium carbonate/expanded graphite as an efficient catalyst for catalytic ozonation of ethylenediaminetetraacetic acid. Environ. Eng. Sci. 2020, 37, 450–456. [Google Scholar] [CrossRef]
  17. Song, Y.; Feng, S.; Qin, W.; Ma, J. Mechanism of catalytic ozonation in expanded graphite aqueous suspension for the degradation of organic acids. Environ. Technol. 2023, 44, 739–750. [Google Scholar] [CrossRef]
  18. He, J.; Song, W.; Huang, X.; Gao, Z. Preparation, characterization, and catalytic activity of a novel MgO/expanded graphite for ozonation of Cu-EDTA. Environ. Sci. Pollut. Res. 2021, 28, 39513–39523. [Google Scholar] [CrossRef]
  19. Zhang, X.; Shen, T.; Ding, Y.; Tong, S. Graphite felt supported MgO catalytic ozonation of bisphenol A. Ozone Sci. Eng. 2019, 41, 541–550. [Google Scholar] [CrossRef]
  20. Liu, Z.Q.; Ma, J.; Zhao, L. Preparation, Characterization and catalytic activity of Pt/graphite catalyst. Chin. J. Inorg. Chem. 2006, 22, 2263–2268. (In Chinese) [Google Scholar]
  21. Liu, Z.Q.; Cui, Y.H.; Wang, M.Y.; Zheng, Y.J.; Zhong, Z.X.; Wu, X.H.; Wang, Z.; Zhang, B.P. Ozonation of oxytetracycline in the presence of activated carbon supported cerium oxide. Environ. Eng. Manag. J. 2016, 15, 2231–2237. [Google Scholar] [CrossRef]
  22. Orge, C.A.; Órfão, J.J.M.; Pereira, M.F.R. Catalytic ozonation of organic pollutants in the presence of cerium oxide–carbon composites. Appl. Catal. B Environ. 2011, 102, 539–546. [Google Scholar] [CrossRef]
  23. Yao, C.C.D.; Haag, W.R. Rate constants for direct reactions of ozone with several drinking water contaminants. Water Res. 1991, 25, 761–773. [Google Scholar] [CrossRef]
  24. Wen, G.; Ma, J.; Liu, Z.-Q.; Zhao, L. Ozonation kinetics for the degradation of phthalate esters in water and the reduction of toxicity in the process of O3/H2O2. J. Hazard. Mater. 2011, 195, 371–377. [Google Scholar] [CrossRef]
  25. Noh, J.S.; Schwarz, J.A. Effect of HNO3 treatment on the surface acidity of activated carbons. Carbon 1990, 28, 675–682. [Google Scholar] [CrossRef]
  26. Liu, Z.-Q.; Ma, J.; Cui, Y.-H. Carbon nanotube supported platinum catalysts for the ozonation of oxalic acid in aqueous solutions. Carbon 2008, 46, 890–897. [Google Scholar] [CrossRef]
  27. von Sonntag, C.; von Gunten, U. Chemistry of Ozone in Water and Wastewater Treatment: From Basic Principles to Applications; IWA Publishing: London, UK, 2012. [Google Scholar]
  28. Elovitz, M.S.; von Gunten, U. Hydroxyl radical/ozone ratios during ozonation processes. I. The rct concept. Ozone Sci. Eng. 1999, 21, 239–260. [Google Scholar] [CrossRef]
  29. Bader, H.; Hoigné, J. Determination of ozone in water by the indigo method. Water Res. 1981, 15, 449–456. [Google Scholar] [CrossRef]
  30. Rakness, K.; Gordon, G.; Langlais, B.; Masschelein, W.; Matsumoto, N.; Richard, Y.; Robson, C.M.; Somiya, I. Guideline for measurement of ozone concentration in the process gas from an ozone generator. Ozone Sci. Eng. 1996, 18, 209–229. [Google Scholar] [CrossRef]
  31. Bader, H.; Sturzenegger, V.; Hoigné, J. Photometric method for the determination of low concentrations of hydrogen peroxide by the peroxidase catalyzed oxidation of N,N-diethyl-p-phenylenediamine (DPD). Water Res. 1988, 22, 1109–1115. [Google Scholar] [CrossRef]
  32. Zhang, S.; Quan, X.; Zheng, J.-F.; Wang, D. Probing the interphase “HO• zone” originated by carbon nanotube during catalytic ozonation. Water Res. 2017, 122, 86–95. [Google Scholar] [CrossRef] [PubMed]
  33. Van Dam, H.E.; Van Bekkum, H. Preparation of platinum on activated carbon. J. Catal. 1991, 131, 335–349. [Google Scholar] [CrossRef]
  34. Lu, J.; Do, I.; Drzal, L.T.; Worden, R.M.; Lee, I. Nanometal-decorated exfoliated graphite nanoplatelet based glucose biosensors with high sensitivity and fast response. ACS Nano 2008, 2, 1825–1832. [Google Scholar] [CrossRef]
  35. Beltran, F.J.; Alvarez, P.M.; Gimeno, O. Graphene-Based catalysts for ozone processes to decontaminate water. Molecules 2019, 24, 3438. [Google Scholar] [CrossRef]
  36. Ishii, T.; Kaburagi, Y.; Yoshida, A.; Hishiyama, Y.; Oka, H.; Setoyama, N.; Ozaki, J.-I.; Kyotani, T. Analyses of trace amounts of edge sites in natural graphite, synthetic graphite and high-temperature treated coke for the understanding of their carbon molecular structures. Carbon 2017, 125, 146–155. [Google Scholar] [CrossRef]
  37. Coloma, F.; Sepulveda-Escribano, A.; Fierro, J.L.G. Rodriguez-Reinoso, Preparation of platinum supported on pregraphitized carbon blacks. Langmuir 1994, 10, 750–755. [Google Scholar] [CrossRef]
  38. Leon, C.A.L.Y.; Solar, J.M.; Calemma, V.; Radovic, L.R. Evidence for the protonation of basal plane sites on carbon. Carbon 1992, 30, 797–811. [Google Scholar] [CrossRef]
  39. Fijolek, L.; Wolski, L. Bifunctional CePO4/CeO2 nanocomposite as a promising heterogeneous catalyst for the enhancement of the ozonation recovery effect in the presence of chloride ions. Sci. Rep. 2022, 12, 9043. [Google Scholar] [CrossRef]
  40. Zhang, J.; Dong, B.; Liu, J.; Yang, W.; Ge, S.; He, S. The role of Mn doping on Ce-based γ-Al2O3 catalysts for phenol degradation. Environ. Eng. Sci. 2021, 39, 56–63. [Google Scholar] [CrossRef]
  41. Kasprzyk-Hordern, B.; Ziółek, M.; Nawrocki, J. Catalytic ozonation and methods of enhancing molecular ozone reactions in water treatment. Appl. Catal. B Environ. 2003, 46, 639–669. [Google Scholar] [CrossRef]
  42. Zhang, S.; Quan, X.; Wang, D. Catalytic ozonation in arrayed zinc oxide nanotubes as highly efficient mini-column catalyst reactors (MCRs): Augmentation of hydroxyl radical exposure. Environ. Sci. Technol. 2018, 52, 8701–8711. [Google Scholar] [CrossRef] [PubMed]
  43. Hossain, M.S.; Tryk, D.; Yeager, E. The electrochemistry of graphite and modified graphite surfaces: The reduction of O2. Electrochim. Acta 1989, 34, 1733–1737. [Google Scholar] [CrossRef]
  44. Ahumada, E.; Lizama, H.; Orellana, F.; Suárez, C.; Huidobro, A.; Sepúlveda-Escribano, A.; Rodrı, F. Catalytic oxidation of Fe(II) by activated carbon in the presence of oxygen: Effect of the surface oxidation degree on the catalytic activity. Carbon 2002, 40, 2827–2834. [Google Scholar] [CrossRef]
  45. Beltran, F.J.; Pocostales, P.; Alvarez, P.; Oropesa, A.L. Diclofenac removal from water with ozone and activated carbon. J. Hazard. Mater. 2009, 163, 768–776. [Google Scholar] [CrossRef] [PubMed]
  46. Beltrán, F.J.; García-Araya, J.F.; Giráldez, I. Gallic acid water ozonation using activated carbon. Appl. Catal. B Environ. 2006, 63, 249–259. [Google Scholar] [CrossRef]
  47. Beltrán, F.J.; Giráldez, I.; García-Araya, J.F. Kinetics of activated carbon promoted ozonation of polyphenol mixtures in water. Ind. Eng. Chem. Res. 2008, 47, 1058–1065. [Google Scholar] [CrossRef]
  48. Zhang, T.; Chen, W.; Ma, J.; Qiang, Z. Minimizing bromate formation with cerium dioxide during ozonation of bromide-containing water. Water Res. 2008, 42, 3651–3658. [Google Scholar] [CrossRef] [PubMed]
  49. Mohan, S.; Mamane, H.; Avisar, D.; Gozlan, I.; Kaplan, A.; Dayalan, G. Treatment of diethyl phthalate leached from plastic products in municipal solid waste using an ozone-based advanced oxidation process. Materials 2019, 12, 4119. [Google Scholar] [CrossRef] [PubMed]
  50. Mansouri, L.; Tizaoui, C.; Geissen, S.U.; Bousselmi, L. A comparative study on ozone, hydrogen peroxide and UV based advanced oxidation processes for efficient removal of diethyl phthalate in water. J. Hazard. Mater. 2019, 363, 401–411. [Google Scholar] [CrossRef] [PubMed]
  51. Jabesa, A.; Ghosh, P. Removal of diethyl phthalate from water by ozone microbubbles in a pilot plant. J. Environ. Manag. 2016, 180, 476–484. [Google Scholar] [CrossRef]
  52. Hoigné, J.; Bader, H. Rate constants of reactions of ozone with organic and inorganic compounds in water—I. Water Res. 1983, 17, 173–183. [Google Scholar] [CrossRef]
  53. Sánchez-Polo, M.; von Gunten, U.; Rivera-Utrilla, J. Efficiency of activated carbon to transform ozone into OH radicals: Influence of operational parameters. Water Res. 2005, 39, 3189–3198. [Google Scholar] [CrossRef] [PubMed]
  54. Sanchez-Polo, M.; Salhi, E.; Rivera-Utrilla, J.; von Gunten, U. Combination of ozone with activated carbon as an alternative to conventional advanced oxidation processes. Ozone Sci. Eng. 2006, 28, 237–245. [Google Scholar] [CrossRef]
  55. Oulton, R.; Haase, J.P.; Kaalberg, S.; Redmond, C.T.; Nalbandian, M.J.; Cwiertny, D.M. Hydroxyl radical formation during ozonation of multiwalled carbon nanotubes: Performance optimization and demonstration of a reactive CNT filter. Environ. Sci. Technol. 2015, 49, 3687–3697. [Google Scholar] [CrossRef] [PubMed]
  56. Jothinathan, L.; Hu, J. Kinetic evaluation of graphene oxide based heterogenous catalytic ozonation for the removal of ibuprofen. Water Res. 2018, 134, 63–73. [Google Scholar] [CrossRef] [PubMed]
  57. Long, J.; Guo, Y.; Yu, G.; Komarneni, S.; Wang, Y. Evaluation of the effect of catalysts on ozone mass transfer and pollutant abatement during laboratory catalytic ozonation experiments: Implications for practical water and wastewater treatment. ACS EST Eng. 2022, 3, 387–397. [Google Scholar] [CrossRef]
  58. Kwon, M.; Kye, H.; Jung, Y.; Yoon, Y.; Kang, J.-W. Performance characterization and kinetic modeling of ozonation using a new method: ROH,O3 concept. Water Res. 2017, 122, 172–182. [Google Scholar] [CrossRef] [PubMed]
  59. Liu, Y.; Chen, C.; Duan, X.; Wang, S.; Wang, Y. Carbocatalytic ozonation toward advanced water purification. J. Mater. Chem. A 2021, 9, 18994–19024. [Google Scholar] [CrossRef]
  60. Beltran, F.J.; Rivas, F.J.; Fernandez, L.A.; Alvarez, P.M.; Montero-de-Espinosa, R. Kinetics of catalytic ozonation of oxalic acid in water with activated carbon. Ind. Eng. Chem. Res. 2002, 41, 6510–6517. [Google Scholar] [CrossRef]
  61. Faria, P.C.C.; Órfão, J.J.M.; Pereira, M.F.R. Activated carbon catalytic ozonation of oxamic and oxalic acids. Appl. Catal. B Environ. 2008, 79, 237–243. [Google Scholar] [CrossRef]
  62. Werner, S.; Morgan, J.J. Aquatic chemistry: Chemical Equilibria and Rates in Natural Waters, 3rd ed.; Wiley: New York, NY, USA, 1996. [Google Scholar]
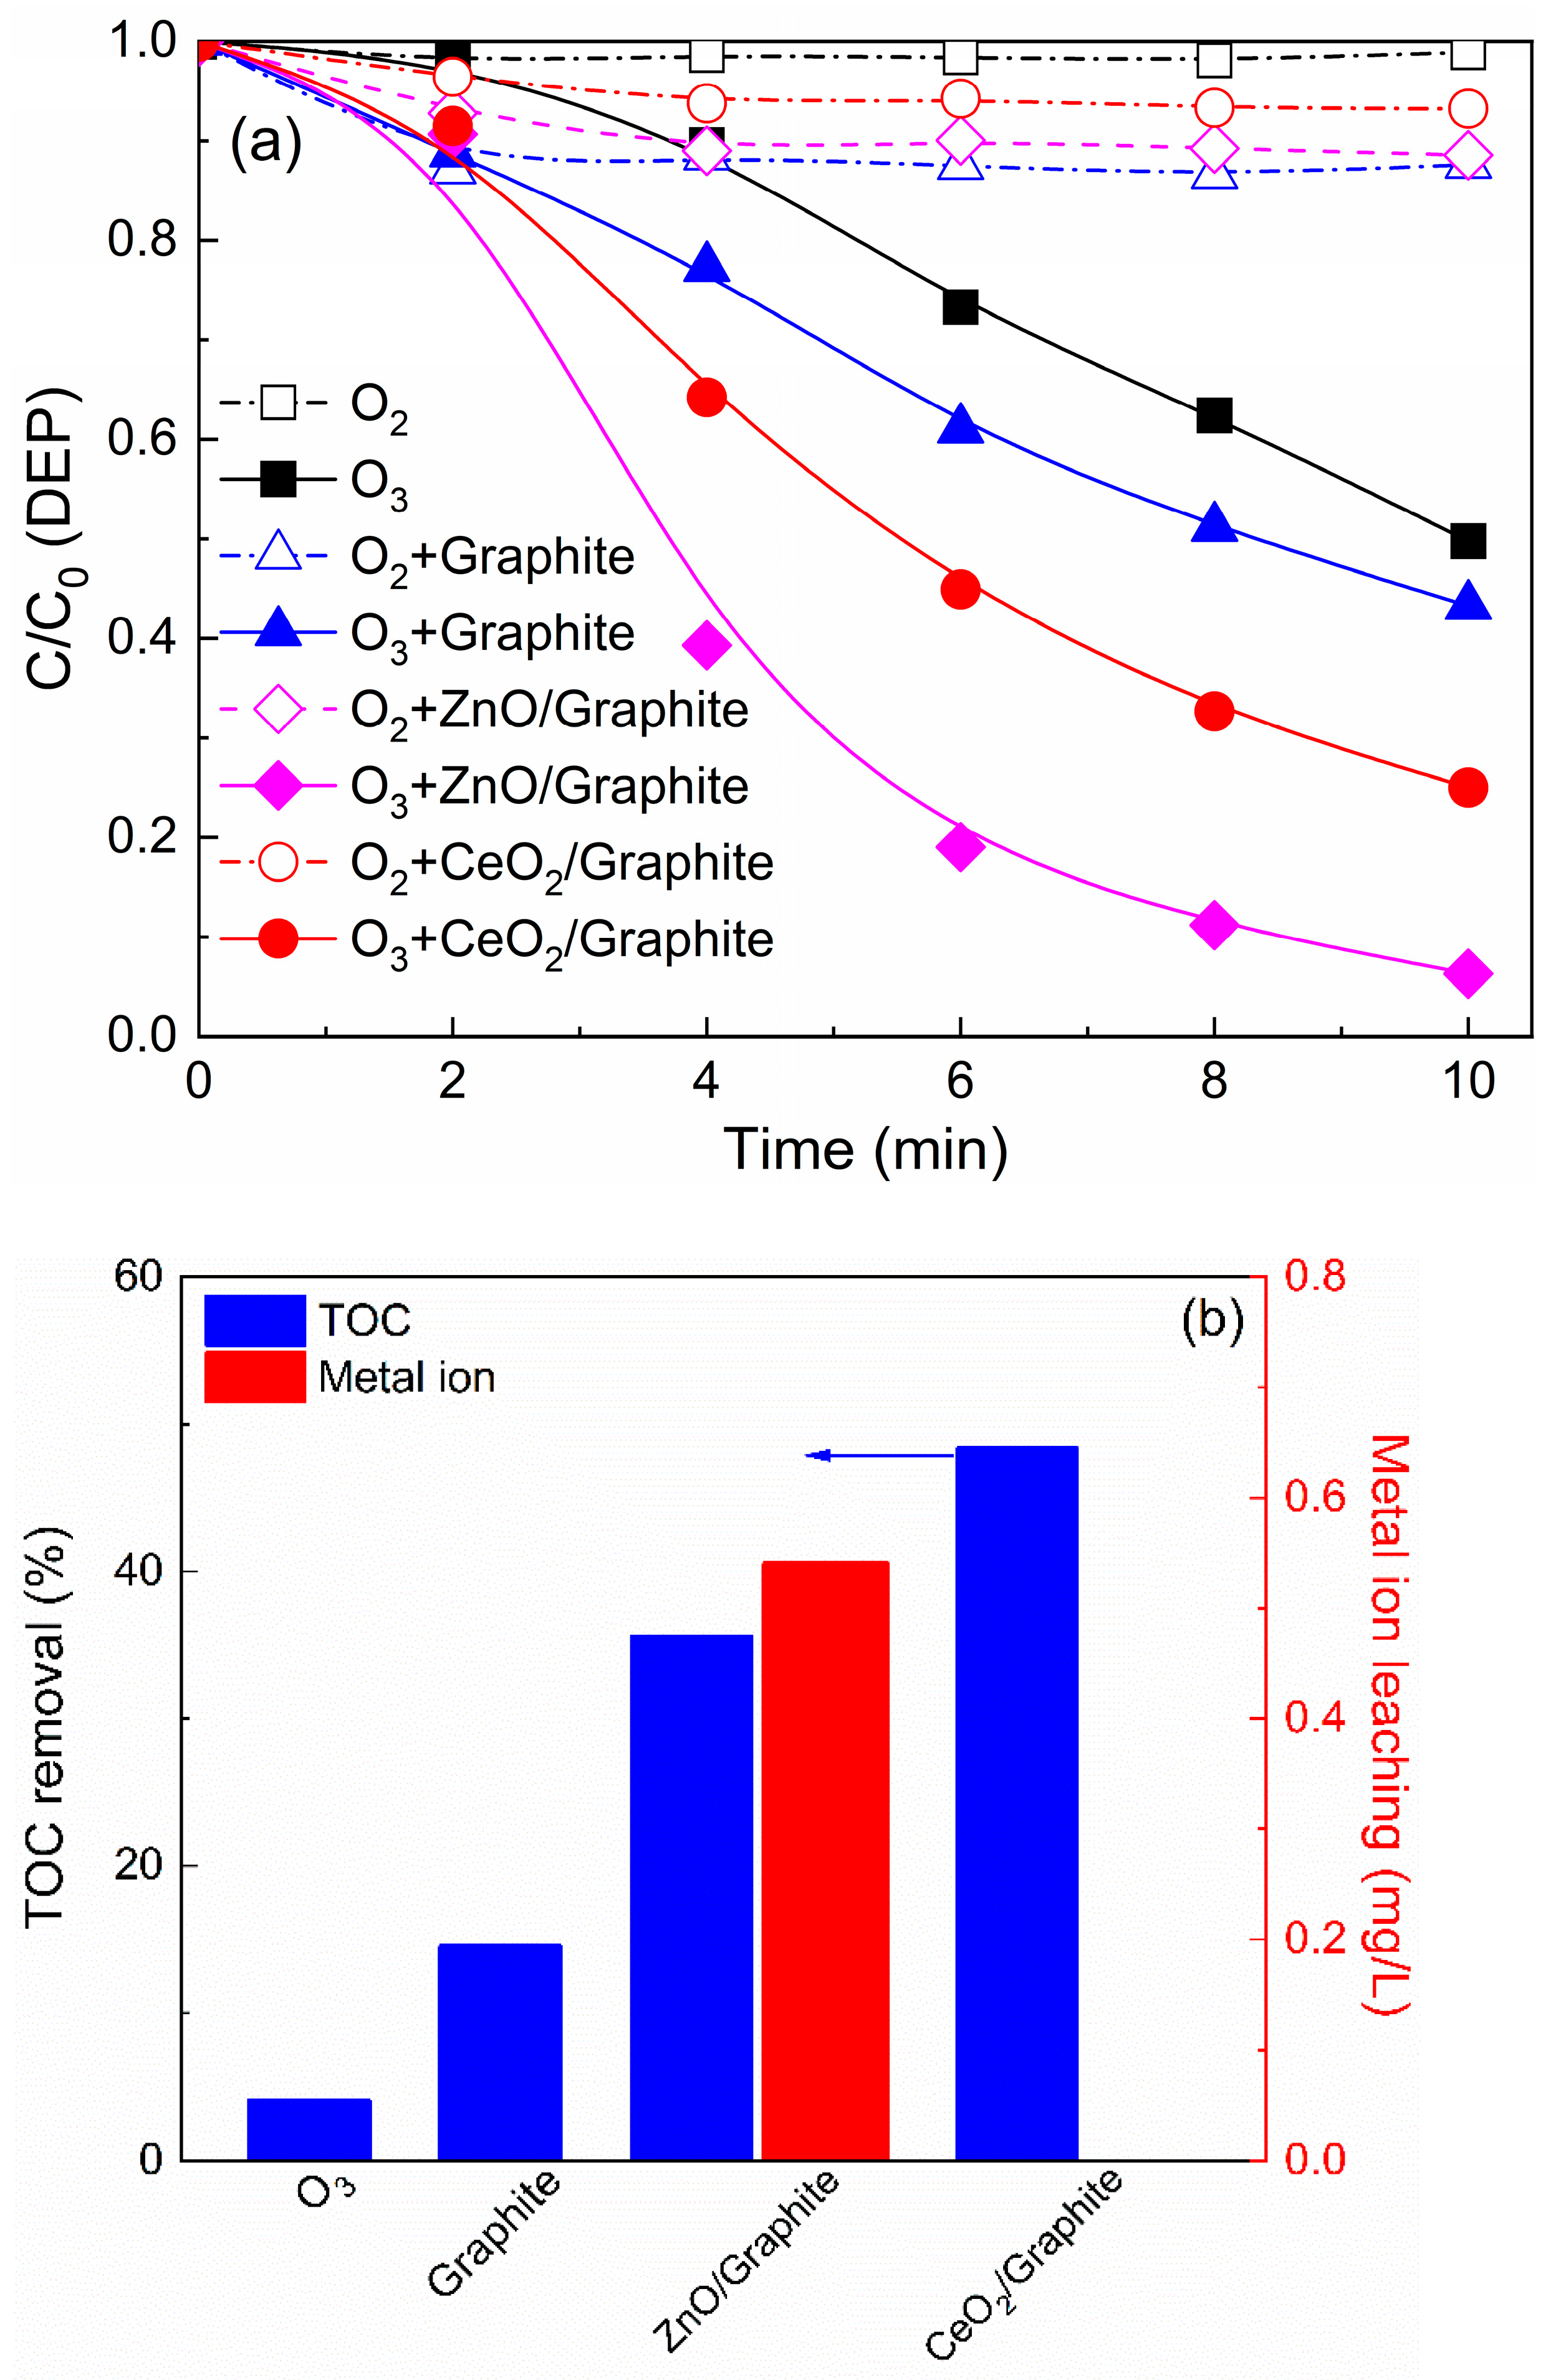
Figure 1. Comparison of DEP degradation during ozonation with graphite, ZnO/graphite, and CeO2/graphite catalysts. (a) DEP concentration variation, (b) TOC removal, and metal ion leaching after 10 min reaction. Reaction conditions: T = 20 °C, initial pH = 5.8, initial DEP concentration = 3 μM, ozone gas concentration = 0.38 mg min−1, catalyst dosage = 100 mg L−1.
Water 16 01274 g001
Figure 2. Reuse of the CeO2/graphite catalyst during ozonation for the DEP degradation and TOC removal. Reaction conditions: T = 20 °C, initial pH = 5.8, initial DEP concentration = 3 μM, ozone gas concentration = 0.38 mg min−1, catalyst dosage = 100 mg L−1.
Water 16 01274 g002
Figure 3. Effect of (a) cerium loading amount and (b) pyrolysis temperature on ozonation of DEP with CeO2/graphite catalysts. Reaction conditions for ozonation: T = 20 °C, initial pH = 5.8, initial DEP concentration = 3 μM, ozone gas concentration = 0.38 mg min−1, catalyst dosage = 100 mg L−1. Reaction conditions for catalyst preparation: T = 400 °C for (a), cerium loading amount = 3.5% for (b).
Water 16 01274 g003
Figure 4. Characterization of CeO2/graphite catalysts. (a) SEM (×80,000), (b) TEM (×100,000), XRD patterns with different (c) cerium loading amount and (d) pyrolysis temperature. Reaction conditions for catalyst preparation: T = 400 °C for (ac), cerium loading amount = 3.5% for (a,b,d).
Water 16 01274 g004
Figure 5. Effect of ozone dosage on DEP degradation during CeO2/graphite catalytic ozonation. Reaction conditions: T = 20 °C, initial pH = 5.8, initial DEP concentration = 3 μM, catalyst dosage = 100 mg L−1.
Water 16 01274 g005
Figure 6. Effect of catalyst dosage on DEP degradation during CeO2/graphite catalytic ozonation. Reaction conditions: T = 20 °C, initial pH = 5.8, initial DEP concentration = 3 μM, ozone gas concentration = 0.38 mg min−1.
Water 16 01274 g006
Figure 7. Effect of initial DEP concentration on DEP degradation during CeO2/graphite catalytic ozonation. Reaction conditions: T = 20 °C, initial pH = 5.8, ozone gas concentration = 0.38 mg min−1, catalyst dosage = 100 mg L−1.
Water 16 01274 g007
Figure 8. Effect of initial pH on DEP degradation during CeO2/graphite catalytic ozonation. Reaction conditions: T = 20 °C, initial DEP concentration = 3 μM, ozone gas concentration = 0.38 mg min−1, catalyst dosage = 100 mg L−1.
Water 16 01274 g008
Figure 9. Effect of reaction temperature on DEP degradation during CeO2/graphite catalytic ozonation. Reaction conditions: initial pH = 5.8, initial DEP concentration = 3 μM, ozone gas concentration = 0.38 mg min−1, catalyst dosage = 100 mg L−1.
Water 16 01274 g009
Figure 10. Evolution of ozone concentration during CeO2/graphite catalytic ozonation. Reaction conditions: T = 20 °C, initial pH = 5.8, initial DEP concentration = 3 μM, ozone gas concentration = 0.38 mg min−1, catalyst dosage = 100 mg L−1.
Water 16 01274 g010
Figure 11. Evolution of H2O2 concentration during CeO2/graphite catalytic ozonation. Reaction conditions: T = 20 °C, initial pH = 5.8, initial DEP concentration = 3 μM, ozone gas concentration = 0.38 mg min−1, catalyst dosage = 100 mg L−1.
Water 16 01274 g011
Figure 12. Effect of TBA on ozonation of DEP with or without CeO2/graphite catalyst under different initial pH. Reaction conditions: T = 20 °C, initial DEP concentration = 3 μM, ozone gas concentration = 0.38 mg min−1, catalyst dosage = 100 mg L−1.
Water 16 01274 g012
Figure 13. pCBA degradation and ozone decomposition in ozonation alone and ozonation with different catalysts. Reaction conditions: T = 20 °C, initial pH = 7.1, initial pCBA concentration = 1 μM, initial TBA concentration = 80 μM, initial ozone concentration = 2 mg L−1, catalyst dosage = 50 mg L−1.
Water 16 01274 g013
Table 1. Rct and ROH,O3 values of ozonation alone and ozonation with different catalysts.
ProcessO3 Exposure (M•s)OH Exposure (M•s)RctROH,O3 (s)
O33.78 × 10−24.26 × 10−111.13 × 10−99.84 × 10−7
O3 + Graphite9.38 × 10−34.75 × 10−115.21 × 10−91.63 × 10−6
O3 + ZnO/Graphite9.21 × 10−37.30 × 10−117.26 × 10−91.94 × 10−6
O3 + CeO2/Graphite1.60 × 10−27.13 × 10−114.10 × 10−92.29 × 10−6
Disclaimer/Publisher’s Note: The statements, opinions and data contained in all publications are solely those of the individual author(s) and contributor(s) and not of MDPI and/or the editor(s). MDPI and/or the editor(s) disclaim responsibility for any injury to people or property resulting from any ideas, methods, instructions or products referred to in the content.