Article

HYPOSO Map Viewer: A Web-Based Atlas of Small-Scale Hydropower for Selected African and Latin American Countries

by
Petras Punys
1,*,
Linas Jurevičius
1 and
Andrius Balčiūnas
2
1
Department of Water Engineering, Vytautas Magnus University, 10 Universiteto Str., Akademija, 53361 Kaunas, Lithuania
2
Institute of Geosciences, Vilnius University, 21, M. K. Čiurlionio Str., 03101 Vilnius, Lithuania
*
Author to whom correspondence should be addressed.
Water 2024, 16(9), 1276; https://doi.org/10.3390/w16091276
Submission received: 8 March 2024 / Revised: 19 April 2024 / Accepted: 24 April 2024 / Published: 29 April 2024
(This article belongs to the Section Water-Energy Nexus)

Abstract

:
In many countries, the advancement of hydropower resources has been hindered by economic factors and insufficient data on topography, streamflow, environmental sensitivity, power grid, and, most importantly, the location of potential hydropower sites. This challenge is particularly pronounced in certain African and Latin American river systems. Developing web-based maps of hydropower resources based on geographic information systems and advanced mapping technologies can facilitate the initial assessment of hydropower sites. This is especially relevant for developing sites in remote areas and data-scarce regions. The available geospatial datasets, remote sensing technologies, and advanced GIS modelling techniques can be used to identify potential hydropower sites and assess their preliminary characteristics. This paper reviews web-based hydropower atlases in African and Latin American countries. Their main features are represented and compared with the recently launched HYPOSO map viewer covering two African countries (Cameroon and Uganda) and three Latin American countries (Bolivia, Colombia, and Ecuador). This hydropower atlas consists of 20 spatial layers. Its particular focus is to present a geospatial dataset of new hydropower sites with concise information for potential investors. These so-called virtual hydropower atlases can be only one type of discovery at the early project stage, automatically identifying sites worthy of further investigation. A formal validation of the web-based atlases, including the HYPOSO hydropower atlas, is briefly considered. Creating open-access hydropower map viewers is anticipated to significantly enhance the hydropower development database in these nations, offering valuable insights for small and medium-scale projects.

1. Introduction

In many countries, the advancement of hydropower resources has been hindered by economic factors and insufficient data on topography, streamflow, environmental sensitivity, power grid, and, most importantly, the location of potential hydropower sites. It is especially relevant in some of the African and Latin American (LATAM) river systems in data-scarce regions [1,2,3,4,5,6].
Small hydropower (SHP) plants, depending on their maximum installed capacity (power P in megawatts) and renewable energy regulations in force in the selected countries, are as follows: 5 MW in Cameroon and Bolivia, 10 MW in Ecuador (EC), and 20 MW in Colombia (CO) and Uganda (UG) [7,8]. However, the limits for some of the above-indicated countries are not firm; they can be surpassed up to 30 MW or more. Small hydropower (SHP) sites are frequently situated in remote regions, making them challenging for engineering teams to access and lacking in comprehensive datasets. Consequently, evaluating these sites in terms of technical feasibility demands considerable experience and expertise.
Many studies using GIS (geographic information system) technologies and based on digital elevation models (DEMs) have been conducted worldwide and in particular regions or river basins to assess hydropower resources. However, this article does not analyse them, only in a general context. Several countries have leveraged advanced GIS technologies and accessible geospatial data sources to develop web-based maps showcasing hydropower resources. Examples include hydro atlases in the USA and Europe [9,10,11]. Hydropower atlases, often presented through GIS-based map viewers, are predominantly accessible via commercial ESRI ArcGIS software, Google platforms, or open-source GIS platforms. These web-based tools provide comprehensive maps showcasing specific hydro site locations and essential datasets covering energy, hydrology, environmental, and economic factors.
Users can readily access and obtain essential information, enabling efficient decision-making processes. The main advantage of these atlases is that their raw and georeferenced data can be easily explored for any purpose. These so-called virtual hydropower atlases can be only one type of discovery at the early project stage, initially identifying sites worthy of further investigation (pre-feasibility or feasibility study). These tools empower users to access approximate information swiftly, aiding in decision-making regarding the feasibility of site development. It is a tool to address the information barriers at early project stages. This may be a critical aspect of the development of SHP plants. Nonetheless, achieving complete spatial accuracy in these assessments is challenging due to the inherent limitations of the geospatial data [12].
GIS-based hydropower resource mappings are available in select regions across the African continent and within individual countries. Examples include West Africa, Tanzania, and Madagascar [13,14,15], where these mapping initiatives provide valuable insights into hydropower potential and distribution. However, there were no such web-based hydropower atlases in the countries under study (Cameroon, Uganda, Bolivia, and Ecuador) except for Colombia. Colombia’s hydropower atlas operates on the ESRI ArcGIS online platform [16].
A comprehensive GIS-based hydropower assessment was conducted covering the entirety of Bolivia’s area [17]. Small hydropower technical assessments were also performed for Sub-Saharan African countries [18]. However, the GIS projects and their geospatial databases are not publicly available for these studies. An African Hydropower Atlas has been recently introduced, primarily focusing on several hundred larger hydro schemes, providing detailed generation profiles for Africa [19]. However, this open-access atlas currently lacks a user-friendly map viewer interface.
An EU-funded initiative known as “Hydropower Solutions for Developing Countries” (acronym HYPOSO) has recently unveiled an online atlas of hydropower resources covering three Latin American nations (Bolivia, Colombia, and Ecuador) and two African countries (Cameroon and Uganda) [20]. The developed hydropower map is expected to significantly improve the hydropower development database in the target countries and provide valuable information for investing in small-to-medium-sized hydro projects.
Objective: The objective of this paper was to assess the available web-based maps of hydropower resources (or online hydropower atlas) in Africa and Latin America, with a focus on the recently developed hydropower atlas in selected countries of these continents (Bolivia, Colombia, Ecuador, Cameroon, and Uganda).
The specific objectives were as follows:
  • To review the open-access web-based maps of hydropower resources in the African and Latin American continents and compare their main features;
  • To present the HYPOSO map viewer, a web-based atlas of hydropower in the selected countries in Africa and Latin America;
  • To validate the HYPOSO Map viewer.

2. Materials and Methods

Open sources were used to review the available web-based hydropower atlases in Africa and Latin America, mainly referring to the websites, data repositories, and publications (reports and papers). Their main features are concisely represented and compared with the recently launched HYPOSO map viewer. Other virtual hydropower atlases available outside these continents were not considered, only in a general context. One particular focus was on the recently launched HYPOSO map viewer, containing hydropower atlases for the five selected countries on these continents. A formal validation is briefly considered.
The HYPOSO hydropower atlas is accessible at [20]. OpenStreetMap and OpenTopoMap are the base maps (Figure 1a). Its front page shows the countries under study. Upon opening the map, users can explore and visualise available geospatial datasets through interactive features such as zooming, panning, and clicking on map layers or icons to reveal the legend. The map is organised into 20 layers categorised into five groups, as Figure 1b depicts. These layers can be activated and visualised once the map is opened.
Furthermore, its interface facilitates the identification of specific feature attributes by utilising a pop-up window. Users can also download KML or Shapefiles containing a comprehensive list of attributes for further analysis and processing. The SHP potential was assessed in Uganda using the datasets provided in the online HYPOSO hydropower atlas [21]. The development of this web-based hydropower atlas incorporates the best practices from similar hydropower atlases currently used in the USA, Europe, and Africa [9,10,11,13,14,15].
The mapping platform of the HYPOSO atlas is built on open-source software [22], allowing users to input, process, and publish geospatial data. It supports data interchange using open standards from various spatial data sources. The map coordinate system is WGS84—World Geodetic System 1984 (represented in decimal degrees, which signifies geographic coordinates). Spatial data are present in geospatial points, polygons, and polylines. Detailed metadata of the layers are provided for the users [20].
To collect information on the operational hydropower plants (HPP), existing databases or projects on potential SHP sites (e.g., master plans, feasibility/pre-feasibility, and other prior studies), and additional relevant information for this web atlas, questionnaires were created for local experts in the target countries. Satellite images were used to manually georeferenced the location of the operational hydropower plants or their sites. Data for the transmission and distribution grid were obtained from various open sources, including the transmission and distribution companies of the target countries.
Freely available information about climate classification [23], protected areas [24], annual precipitation, and the impact of climate change on precipitation [25] was incorporated in the HYPOSO Map.
General circulation models (GCMs) with different scenarios simulate global climate response to increasing greenhouse gas [26,27]. Data from the latest GCMs available—the Coupled Model Intercomparison Project Phase 6 (CMIP6)—were used. In a recent study, an ensemble of 18 GCMs under three RCPs and 17 GCMs under SSPs in CMIP6 were used to project streamflow in the historical period (1971–2000) and in two future periods (2026–2055 and 2066–2095) to check credibility on hydropower production robustness under climate change. According to the multi-criteria rank scores associated with historical streamflow simulations showcased that CMIP6 maintained more satisficing measures and better robust performance than CMIP5 [28].
There is abundant literature regarding hydropower scenarios in the face of climate change, including uncertainties and risk analysis [29,30,31]. They were outside the scope of this study. All these geospatial polygon layers can be used as contextual information for evaluating hydropower sites.
The river basin layer consists of geospatial polygons representing hydrologic or hydrographic units, water management districts, or large- and medium-sized river basins. These data were sourced from national hydrological institutions. In cases where these data were unavailable, such as in Cameroon and Uganda, boundaries were generated using GIS tools, and river basin areas were calculated accordingly.
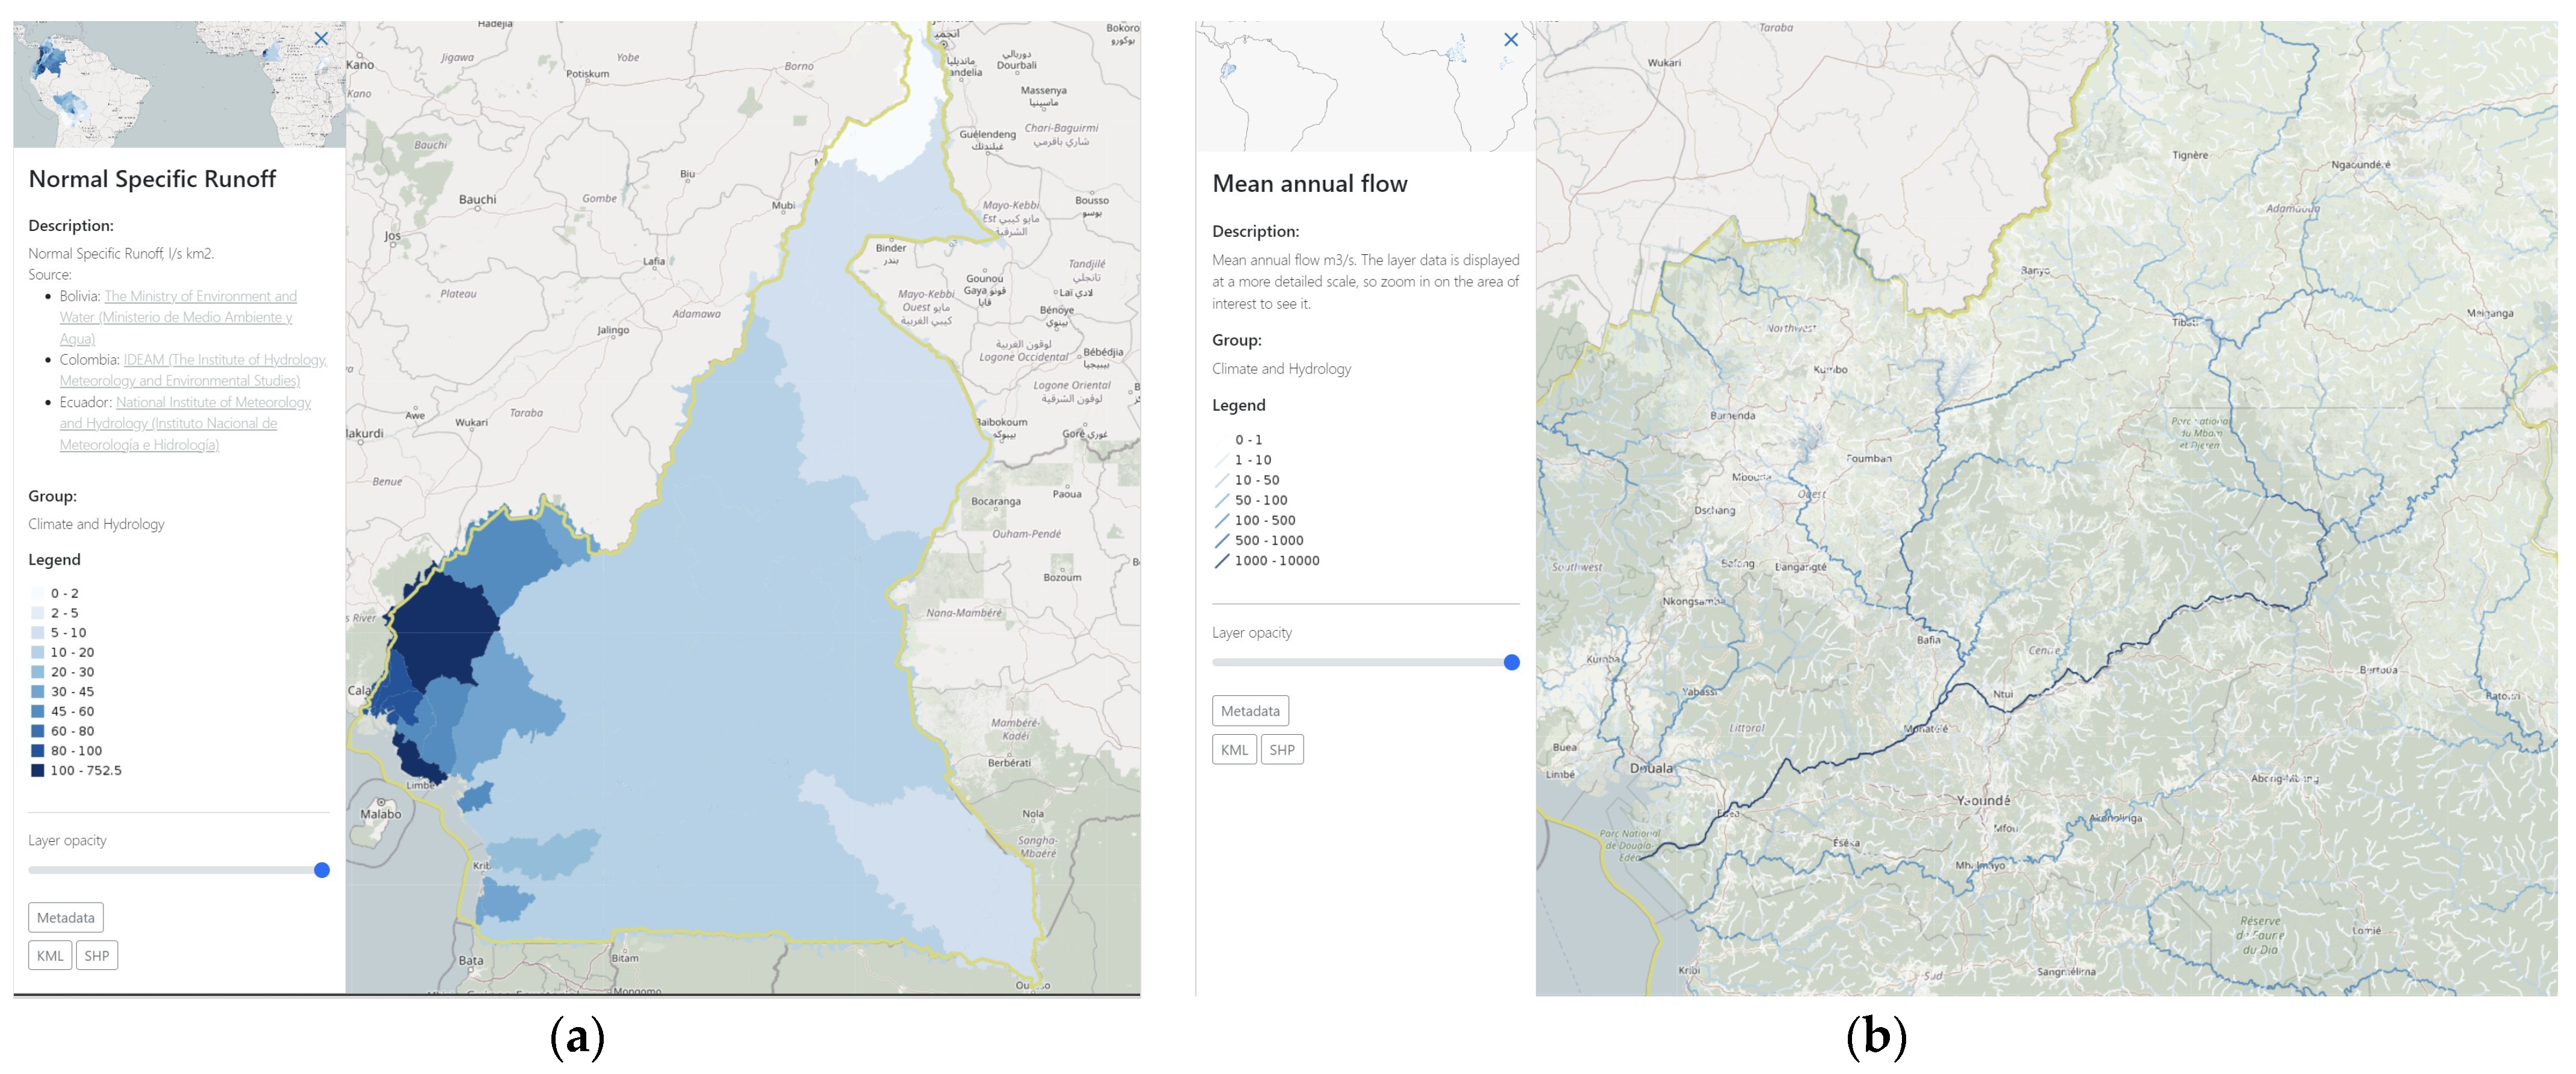
The hydrological assessment relied on historical data, specifically mean annual river flow records obtained from gauging stations (GS). The data were compiled from various sources, primarily national hydrologic yearbooks and national hydrologic services. The long-term mean annual flow data allow for calculating stream-reach hydropower capacity. Normal specific runoff (q), representing river discharge per square kilometre (l/s·km2), was derived from the gauged mean annual flow series. Colour-coded maps were generated to depict rivers’ long-term mean annual flow, excluding Colombia. A geospatial interpolation method [32] was employed to create specific runoff maps based on historical flow records from river gauging stations. These normal-specific runoff maps were utilised to estimate river flow for ungauged catchments, following validation against gauged flow records.
The MERIT (multi-error-removed improved-terrain) Hydro DEM was utilised to delineate the stream hydrography and respective small subbasins. This DEM accurately represents surface elevations at a 3 arc-second resolution approximately 90 m at the equator [33,34]. It was created from existing spaceborne DEMs, including SRTM3 v2.1, JAXA AW3D-30m v1, and Viewfinder Panorama DEM (SRTM: Shuttle Radar Topography Mission) [35]. Subsequently, this DEM underwent hydrological conditioning, and a well-known gravitation-based model was employed to delineate the stream networks and subbasins [36].
In small hydropower development, identifying key hydrological variables requires identifying stream catchment (subbasin) boundaries and their respective flow-contribution areas. Utilising DEM data, small subbasin areas were determined for all countries involved. A threshold of 25 km2 was employed to delineate streams, subbasins, and their associated flow-contributing areas.
Hydropower resources include existing operational plants and prospective potential locations. The gross hydraulic head (in this instance, change in height) and flow rate for the fragmented rivers (close to 70,000 stream reaches) were determined in the countries under study. The power capacity of a stream reach can be calculated as:
Hydropower resources encompass both existing operational plants and potential locations for development. The theoretical hydraulic head, defined as a change in the height of water drop and flow rate for segmented rivers (approximately 70,000 stream reaches), was determined within the countries under study. The power capacity of a stream reach can be calculated using the formula:
P = c ∙ H ∙ (Qu + Qd)/2
where P is the hydropower capacity (MW) and c is a constant accounting for the unit conversion and overall plant efficiency, including hydraulic losses [37,38]. For this study, c = 8.5/1000, H is the elevation difference from the start to the end of a river reach (m), and Q represents the long-term mean annual discharge upstream (Qu) and downstream (Qd) of a river reach (m3/s).
The power capacity was calculated by analysing the longitudinal river profile between two successive tributaries and then aggregating the results for all rivers. Data processing was conducted using ESRI ArcGIS Pro with the ArcHydro toolset. Detailed river basin hydrological modelling, i.e., river flow simulation, was not performed due to the extensive hydrographic areas being considered. Undertaking such an endeavour for the five countries would have been monumental.
According to this methodology, the determined potential can be considered technically feasible. The International Journal on Hydropower & Dams [39], as per the annual questionnaires of the World Atlas of Hydropower & Dams, defines hydropower technically feasible potential as “the portion of the gross theoretical potential that could be exploited within the limits of current technology, including output from the currently installed capacity”.
Hydropower development considerations for new stream-reach development are largely site-specific and vary based on stream-reach characteristics, the surrounding landscape, and other factors. At the HYPOSO Map’s core was identifying potential hydropower sites, encompassing over 2960 georeferenced locations. According to GIS modelling and spatial analysis, the hydropower site locations in Uganda and Cameroon with the highest potential were chosen. The river reaches with the highest potential were determined as potential locations; however, the distance to the transmission grid, settlements, and environmental constraints were also considered. Local experts provided the remaining sites. Nevertheless, many georeferenced locations representing potential sites do not distinguish between small hydropower (SHP) intake and powerhouse locations. While the modelled estimates may not precisely reflect the numbers suitable for engineering design, they serve as a foundational framework for conducting subsequent studies.

3. Results and Discussion

3.1. Review of Web-Based Hydropower Atlases in Africa and Latin America

Hydropower atlases for these continents were assessed only if publicly and freely available. The detailed structure of the HYPOSO hydropower atlas is described further.
Table A1 summarises the main features of the hydropower atlases in the considered continents. Five hydropower atlases have been identified so far. Hydropower atlases are rated according to the features they provide. The ECOWREX Map viewer [13] seems to be the most comprehensive atlas considered here. It covers 14 ECOWAS (Economic Community of West African States) countries and gives detailed technical–methodical information and a tutorial; the atlas is user-friendly. The SHP potential was achieved by an indirect approach: modelling water balance, including monthly precipitation and evapotranspiration. However, everything was obtained by simulation without direct use of the records of the river gauging stations. The quality and availability of hydrological data are large issues in African countries [40,41]. Presented in detail are climate change projections that showcase the change in the future mean annual discharge and runoff, resulting in the transformation of the future hydropower potential.
The Colombian hydropower atlas—(only in Spanish) considers sites from small to large hydropower by river basins and operates on ArcGIS online [16]. However, external access to this website is limited, such as in Europe. Datasets in the ESRI Shapefiles are available for download. The 30 m resolution SRTM DEM was used to model the water stream potential. The hydropower potential was calculated using a conservative approach to low flow (flow probability Q95). The hydropower potential was calculated for horizontal distances (between intake and the likely point of turbine siting) of 0.2, 1, and 5 km. A comprehensive hard copy of the hydropower atlas is also available [42].
The Tanzania and Madagascar SHP GIS atlases operate on the open-access GIS software QGIS (OSGeo4W-2.6.1-1) and Google Earth for Windows [14,15]. For Tanzania, there is a consolidated database containing 455 potential hydropower sites distributed across the country, about 20% of which were validated through field-based surveys. The methodological approach of both atlases is identical. The stream network was taken from freely accessible datasets (DEM was not used).
Validation of the web-based hydropower atlases is one of the essential tasks (Hyposo validation is discussed below). Neither the identified hydropower potential nor the SHP sites were validated in the field (in some kind except Tanzania). Other available validation methodologies were not applied in the reviewed atlases. In this regard, some discussions about climate data validation are provided in ECOWREX [43]. Economic aspects are not considered in the reviewed hydro atlases. The African hydropower atlas (AHA) is not a web-based map viewer since it does not offer a user-friendly interface.

3.2. The HYPOSO Map Viewer—Hydropower Atlas

3.2.1. Background and Infrastructure

Two types of base maps can be switched on/off: OpenStreetMap and OpenTopoMap (Figure 1a). For individual countries, the transmission and distribution of power lines (in some countries, even substations) are visualised on the map (Figure 2a) along with the protected areas, as outlined in [24] (Figure 2b).
The transmission and distribution of the power lines layer dataset carries information about the network operator or owner, system voltage, line type, length, status, and other relevant information. The protected areas dataset provides information about the name of a protected area and its area in square kilometres. Moreover, the Background and Infrastructure layer set allows users to visualise the national boundaries of the target countries.

3.2.2. Operational Hydropower Plants

As secondary information, the HYPOSO atlas includes data for hydropower plants, categorised according to various installed capacities (large, medium, intermediate, small, micro, and mini-hydro) of the operational plants or those under construction (Figure 3).
It details the locations and key characteristics of currently operational HPPs in the target countries, a geospatially comprehensive point-level dataset. In total, 334 geospatial points were identified in all the countries. The collected data were sometimes inconsistent (e.g., installed capacity, discharge, head, and other variables). Therefore, the most plausible values were included in the attribute table. The georeferenced points of operational HPP sites did not always differentiate between dam, powerhouse, and intake.

3.2.3. Climate and Hydrology

Climate zones, precipitation, and climate change projections of precipitation
The updated World Map of the Köppen–Geiger climate classification [23] and the projected precipitation percent change anomaly for 2020–2099 (annual) taken from the Climate Change Knowledge Portal (CCKP) [25] is exhibited in the HYPOSO Map (Figure 4). The Köppen–Geiger climate classification system was used for all target countries instead of the locally used classification systems. It allowed us to unify these data into a single layer for each target country instead of separating them. All these geospatial polygon layers can be used as contextual information for evaluating hydropower sites.
General circulation models (GCMs) provide the most straightforward and scientifically accepted way to project future climate conditions under different emission scenarios. By changing parameters such as greenhouse gas concentrations or land use patterns, scientists can assess the potential impacts of different policy decisions on future climate change. However, climate-change simulations performed with GCMs are only possible at coarse resolutions (25 × 25 km grid cells for CMIP6) that are not detailed enough to assess regional and national impacts. Agricultural livelihoods, soils and local climatic conditions vary vastly on much smaller spatial scales. Spatial downscaling techniques can and should bring these coarse scale maps to a finer resolution [44]. Once collected and analysed, climate data must be communicated to help decision-makers understand climate impacts. Good tools are available, such as the CCKP [25], which provides global data on historical and future climate, vulnerabilities, and impacts.
Hydropower plants usually have very long lifetimes, reaching 50 or more years. Climate change, which changes precipitation patterns, will likely alter the stream flow. As a result of geographic variability, hydropower generation has the potential to increase in the basins, which are becoming wetter. In contrast, the opposite is true of drier basins. It is evident that the correlation between precipitation and the generation of run-of-river (RoR) schemes is significant [45,46]. Any shifts in precipitation levels directly impact the generation of these schemes. Possible impacts of climate change on future precipitation were incorporated into the Hyposo atlas. The user can identify projected reduction or increase in precipitation (in percentage from the baseline) for a particular period and administrative region (SSP2–4.5 scenario, geospatial polygon layer) (Figure 4b). Short-term (2020–2039), medium-term (2040–2059), and long-term (2060–2079, 2080–2099) projections are available as attributes. The long-term projection (2080–2099) was utilised for data visualisation. The datum presented is a “middle of the road” scenario and is one of five scenarios that are most likely to happen [27]. Precipitation change projections presented in the HYPOSO map show, for the general context, what is likely to happen, but many uncertainties cannot be fully evaluated.
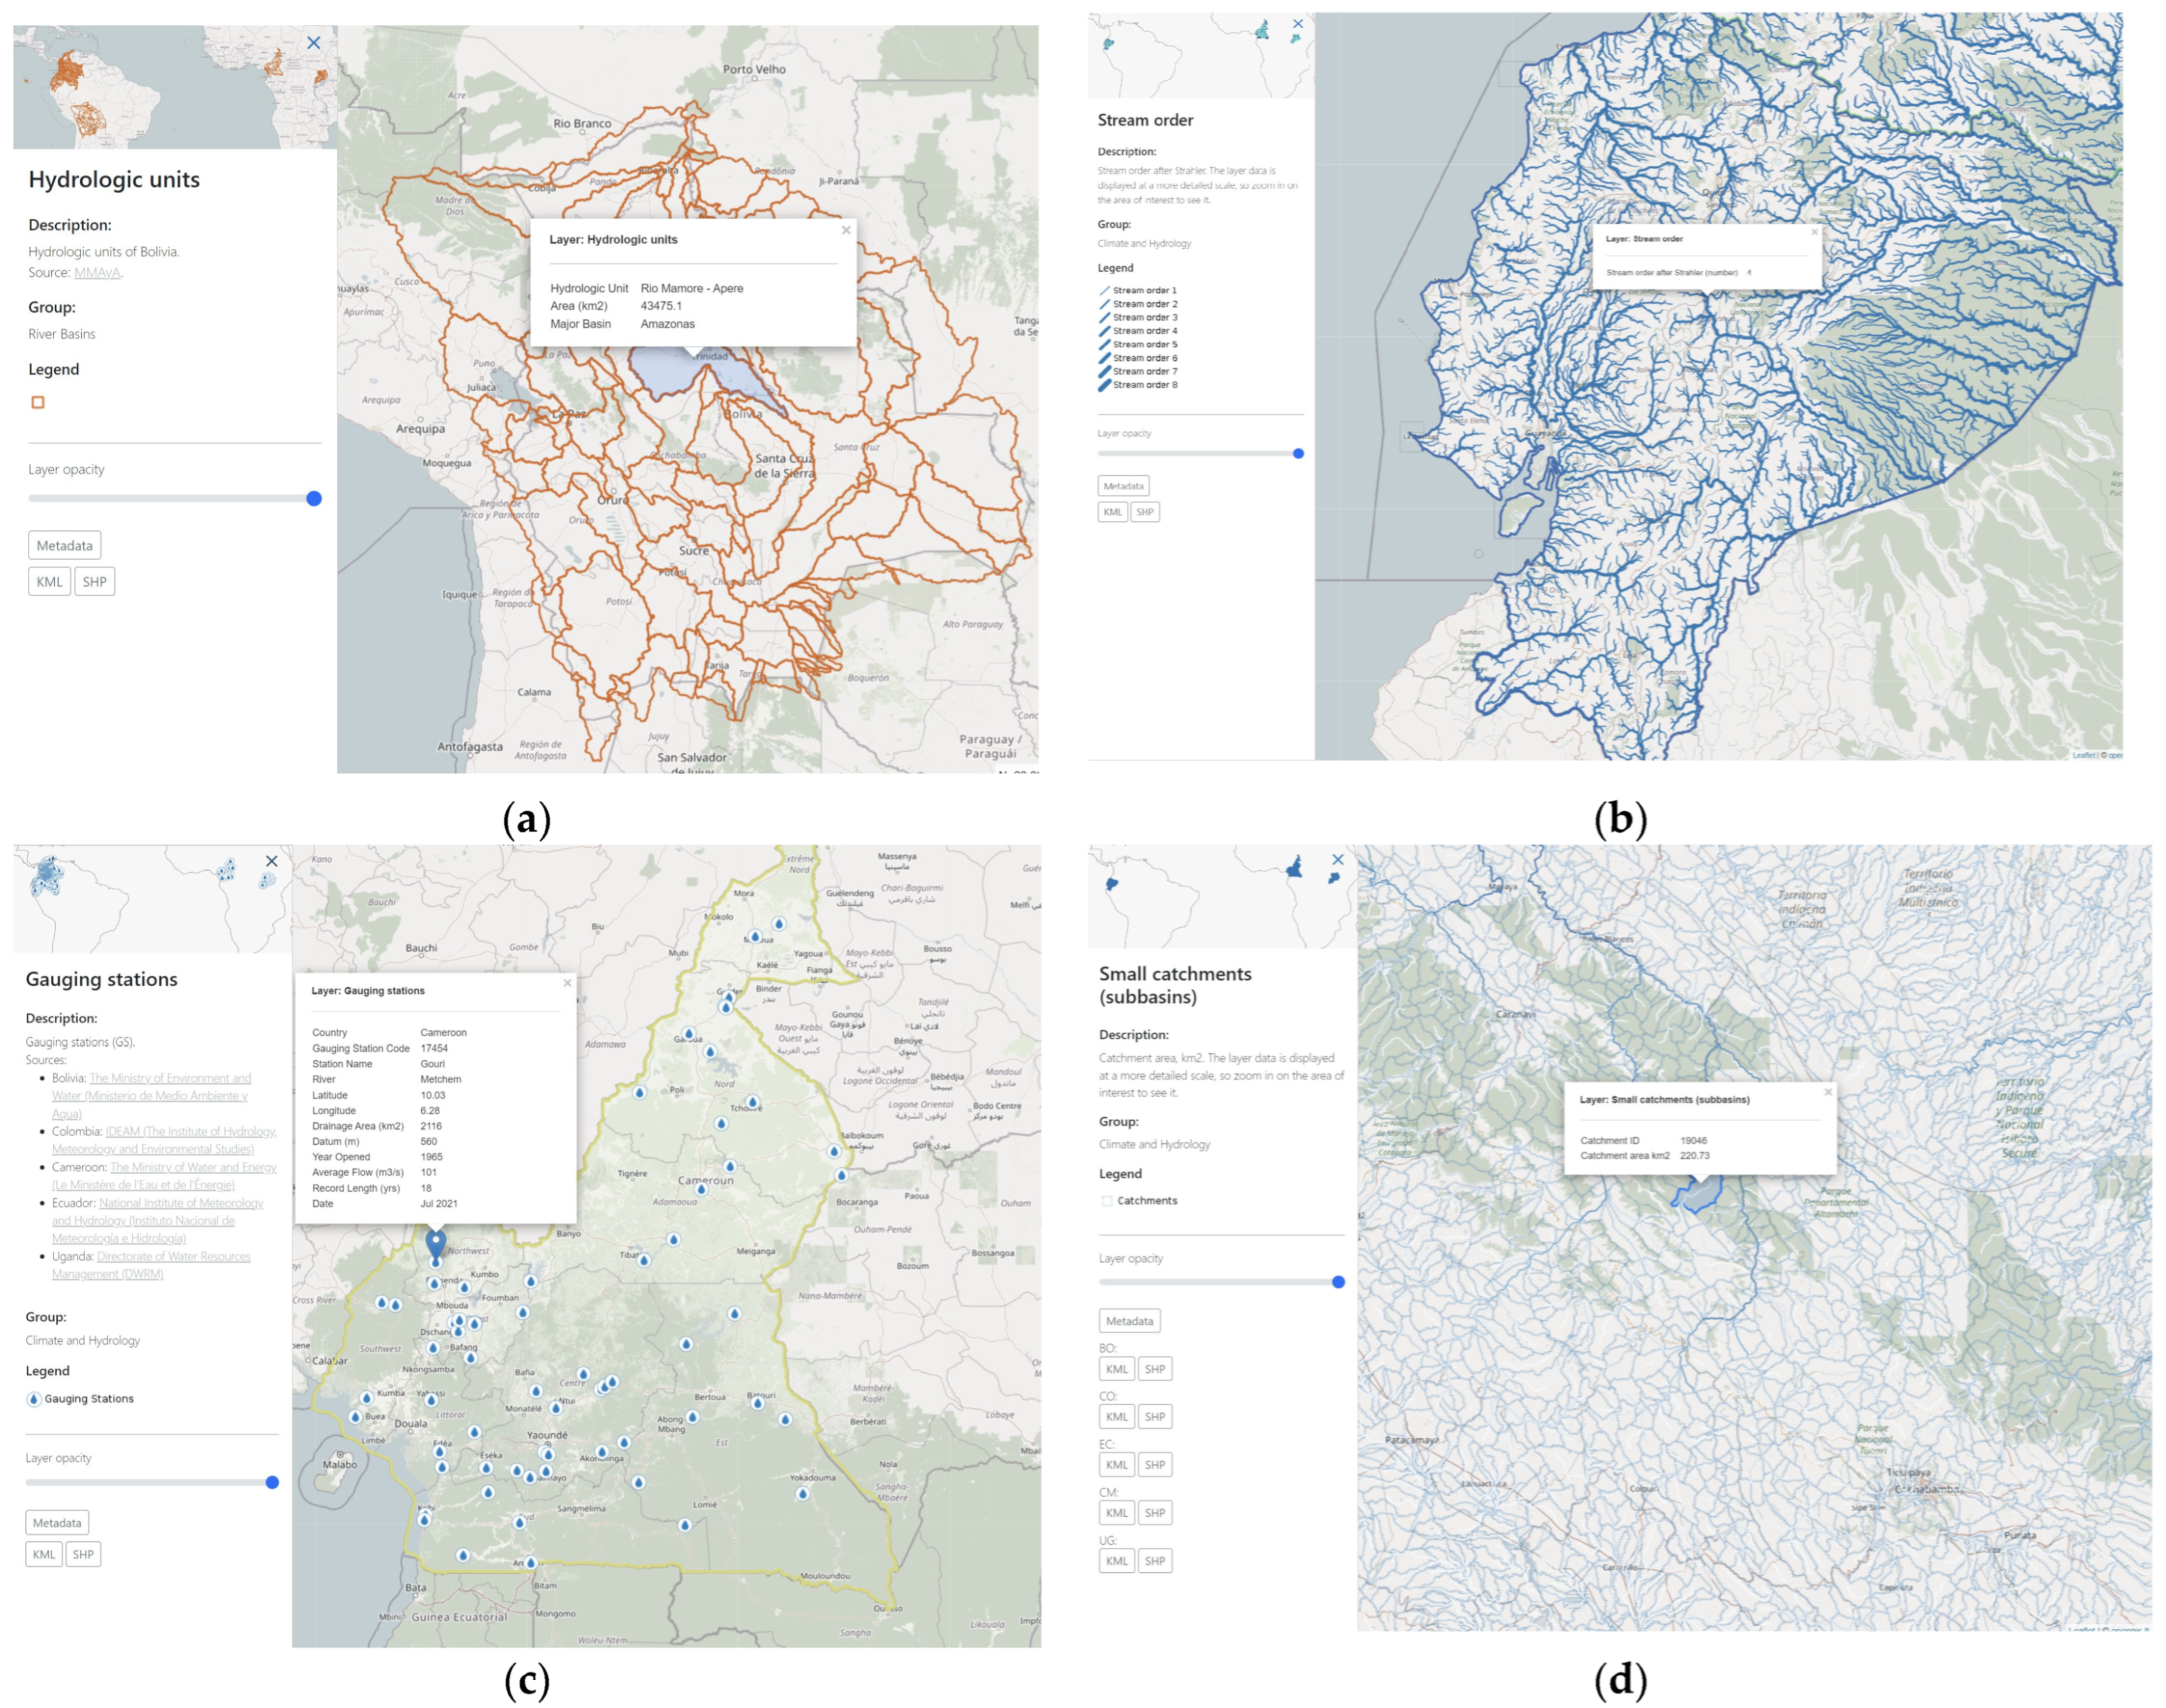
River basins, stream order, gauging stations (GS), and small subbasins
The river basin layer, depicted as geospatial polygons, represents hydrologic/hydrographic units such as regions, water management districts, or large- and medium-sized river basins (Figure 5a). It is an area where a state, environmental, or other relevant water agency manages surface water resources. Each country has its framework for the classification of river basins for the management of water resources. For instance, in Bolivia, they distinguish between 3 major basins and 95 hydrologic units. Ecuador has 9 demarcations (major river basins) and 78 river basins. This information is a valuable insight for SHP developers to plan, develop, or operate hydropower schemes. There might be slight inaccuracies between the boundaries of the river basins and small subbasins. They do not always overlap exactly due to the collected spatial data of river basins of external sources, and small subbasin boundaries are delineated from DEM.
The Strahler stream order [47] was utilised to delineate the hierarchy of streams from the uppermost to the lowermost parts of a catchment (Figure 5b). For example, in the highest order, a seventh order is attributed to the Victoria and Albert Nile (Uganda) and the Sanaga River (Cameroon). According to this system, the smallest headwater tributaries are classified as first-order streams. When two first-order tributaries meet, they form a second-order stream, and so forth. Considering this sequence, a preliminary assessment of a stream’s power capacity can be made based on its flow size.
It is worth noting that prior studies did not account for the contribution of small streams classified as creeks (first- and second-order according to the Strahler stream ordering system) to the overall hydropower potential. It was assumed that a stream order of at least a third was necessary to guarantee an adequate flow in streams for efficient hydropower production [18,48,49,50,51].
Nevertheless, a geospatial analysis of hydropower potential in Uganda reveals that the combined hydropower potential of such small-sized streams (first- and second-order) amounts to approximately 18%. Nevertheless, the average power capacity per water course remains relatively modest, varying between 0.26 and 1.23 MW. It is worth noting that there may be exceptions for specific creeks with steep topography, which possess significant water drops in altitude or riverbed slopes despite having a low flow rate, potentially resulting in a relatively high power capacity [21]. This statement is substantiated by the contribution of the head term expressed in a general form of the hydropower Equation (1).
Around 2400 gauging stations with their key characteristics were georeferenced (point layer) and visualised in the map (Figure 5c). In Bolivia, Colombia, Ecuador, Cameroon, and Uganda, there were 91, 1435, 734, 64, and 71, respectively. The mean annual flow and record period were indicated for the latter two. The original information on GS was presented for Latin American countries, as it is available at respective national hydrological services.
For small hydropower development, the utmost task is to identify stream catchment (subbasin) boundaries and their respective areas to derive key hydrologic variables (e.g., mean annual flow). Small subbasins were delineated from the DEM (Figure 5d), and their flow-contributing areas were determined. More than 70,000 small subbasins were delineated in the target countries. For a better understanding of their properties, just to name the key statistics for Ecuador: the geographic area of Ecuador is 283,561 km2, in which 5318 subbasins were identified. The average subbasin area was 46.7 km2, with the largest subbasin covering 356.2 km2. The standard deviation of the dataset was 37.1 km2. It provides detailed information for users and potential developers as the catchment area can be easily identified for any river reach from the attributes provided on the map. Still, additionally, it can be visualised by simply combining all small catchments upstream using simple GIS tools.
Mean annual flow and normal annual specific runoff
Based on the normal annual specific runoff (Figure 6a), stream-reach mean annual flow (m3/s) was mapped, including the relevant metrics (Figure 6b). The user can quickly determine a stream’s mean annual flow of a reach under interest.
Once the flow-contributing area of a catchment is identified, deriving hydrological metrics becomes more straightforward. For instance, one can calculate the mean annual flow using available specific runoff maps (expressed in litters per second per square kilometre) to assess the potential of a hydro scheme.

3.2.4. Hydropower Potential

Stream-reach potential capacity and potential sites of hydropower plants
The river network was generated, and stream-reach capacities were calculated. More than 69,600 river segments were generated in the countries. For Ecuador, they are shown in Figure 7a, highlighting stream reaches (between confluences) according to their power capacity (MW). The ultimate output of such hydropower evaluation is a GIS stream vector layer, which includes attributes such as:
  • Stream reach length (km).
  • Gradient (m/km).
  • Reach gross hydraulic head (m).
  • Drainage areas (upstream and downstream) (km2).
  • Flow rate (m3/s).
  • Power capacity in MW.
  • Potential capacity per kilometre (MW/km).
  • Strahler stream order.
  • Environmental sensitivity.
  • Exploitation status (whether it is already exploited or not).
The approximate percentage of the number of stream reaches whose bed slope is less than 20 cm/km or low energy density reaches makes up 9%, 10%, 21%, 22%, and 26% in Ecuador, UG, CO, CM, and Bolivia, respectively, of the total number of reaches in those countries. These low-gradient stream reaches are not suitable for small hydropower development involving dam impoundment due to the potential creation of extensive backwater stretches, which would diminish hydro scheme effectiveness.
A particular focus was on the series of new hydropower sites with a piece of concise information for potential investors. More than 2950 sites were gathered and visualised, with a total power capacity exceeding 39,700 MW. Their key features are displayed (Figure 7b).
The HYPOSO map viewer showcases the following essential features:
  • Site type (e.g., run-of-the-river, storage/reservoir, power grid proximity, if any);
  • Address, water stream, river basin name (hydrologic/hydrographic unit), and WGS84 coordinates of a site;
  • Approximate site capacity (MW), flow rate (m3/s), and gross hydraulic head (m);
  • Protected areas, if any;
  • Development opportunities (if any).
For Bolivia, Ecuador, and Colombia, the point layers encompass a variety of large hydro sites. These were assembled by local experts utilising available datasets within each country, including previous studies, and supplemented by GIS modelling tools. These tools aimed to pinpoint stream reaches with high energy density and integrate the energy potential of these reaches with technical factors (such as grid network and energy demand concentration points) and non-technical information (like networks of protected areas). Below, we elaborate on each country’s data:
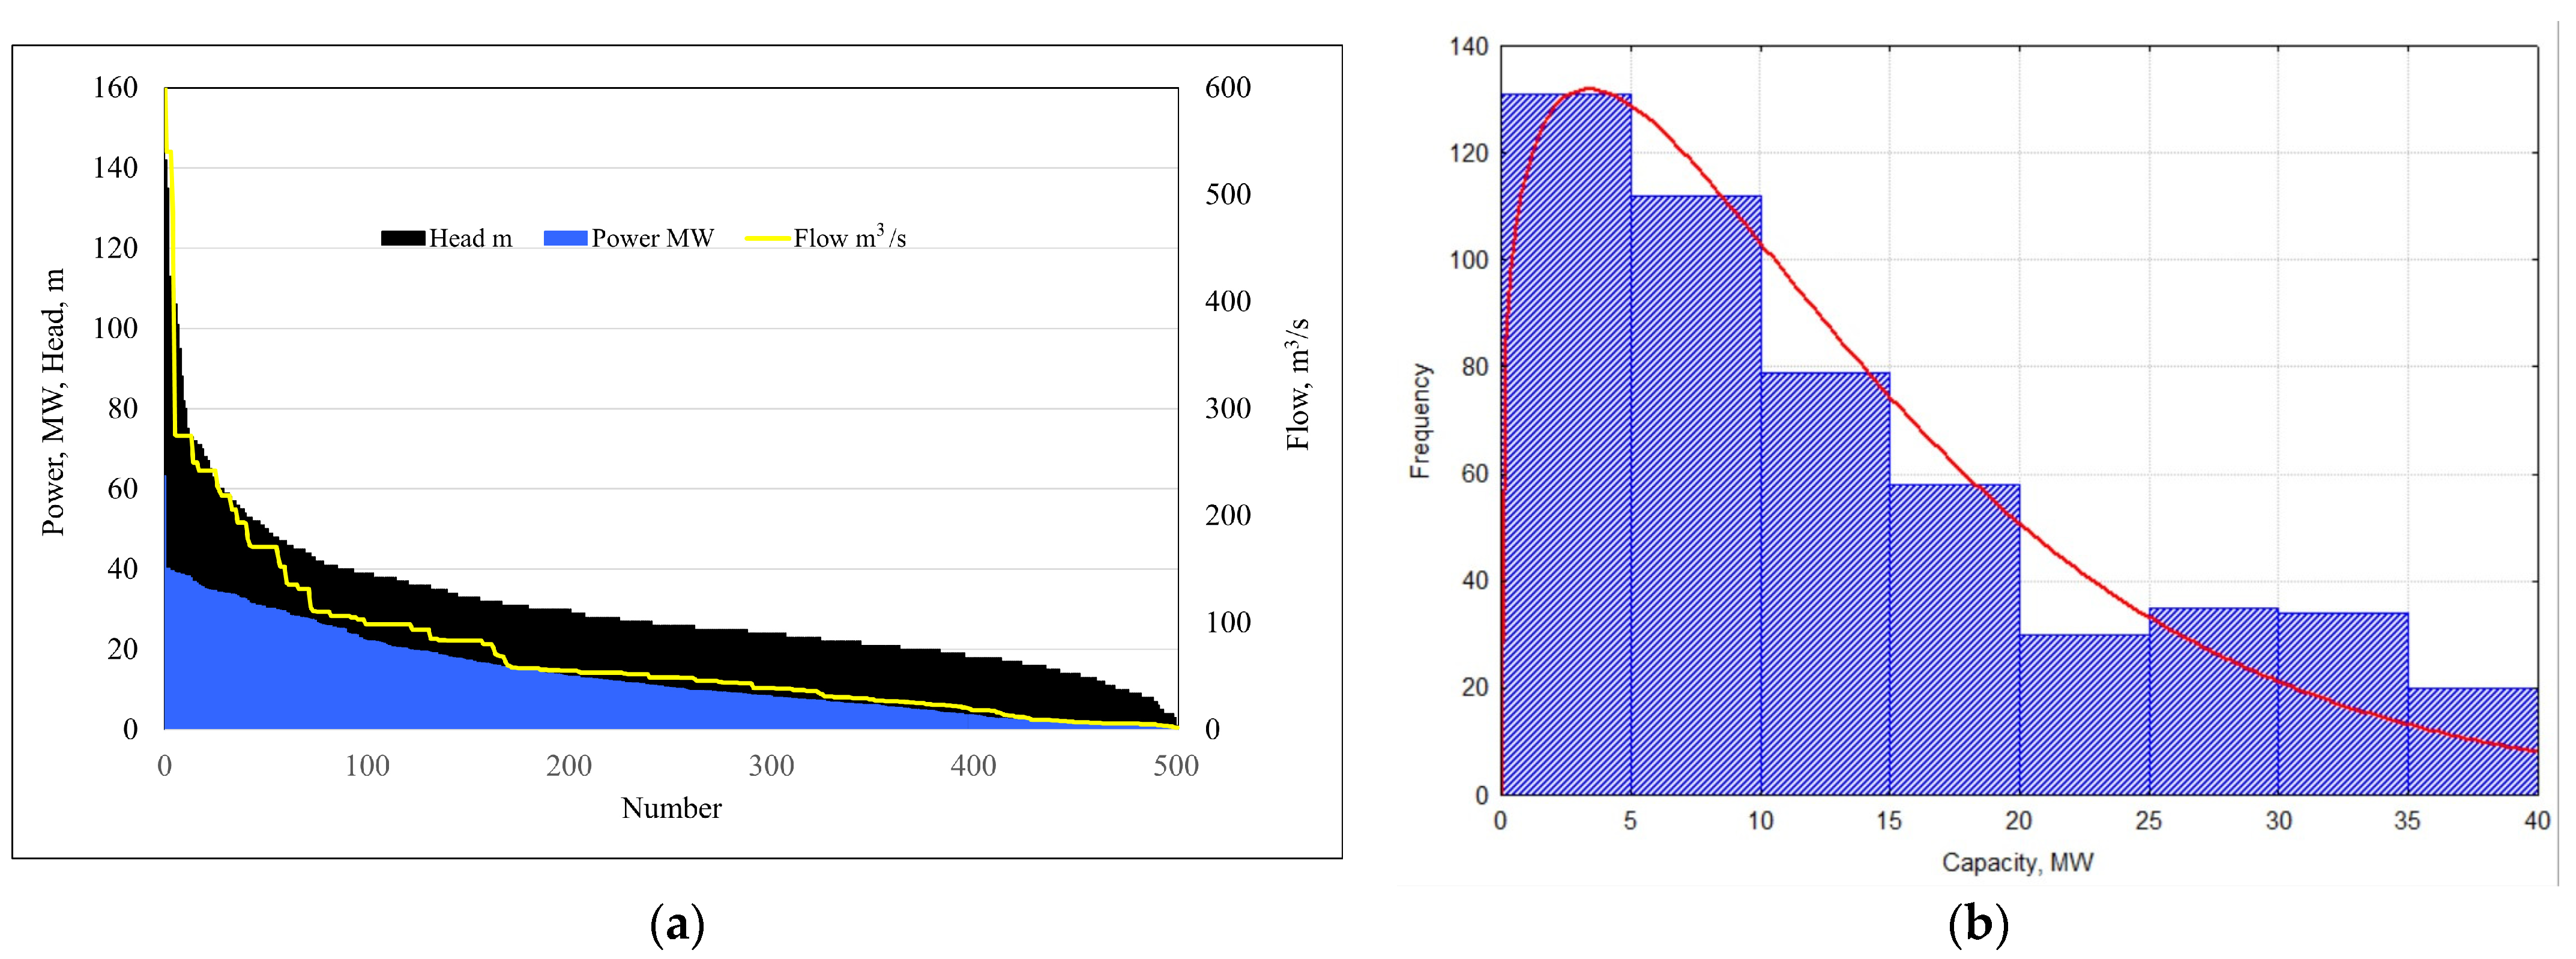
In Ecuador, 479 potential sites with a total power capacity exceeding 17,200 MW were identified. The mean expected capacity of the identified potential sites in Ecuador was 35.9 MW, with a minimum and maximum of 0.1 and 3600 MW, respectively, and the standard deviation of the dataset was 236.4 MW. A total of 478 potential sites with a total power capacity exceeding 9400 MW were identified in Colombia. The mean expected capacity of the identified potential sites in Colombia was 19.7 MW, with a minimum and maximum of 15 and 25 MW, respectively, and the standard deviation of the dataset was 5 MW. In Cameroon, 997 potential sites with a total power capacity close to 5800 MW were identified. The mean expected capacity of the identified potential sites in Cameroon was 5.8 MW, with a minimum and maximum of 0.2 and 19.7 MW, respectively, and the standard deviation of the dataset was 4.6 MW. In Uganda, 505 potential sites have been identified, boasting a cumulative power capacity surpassing 1050 MW. The mean expected capacity of the identified potential sites in Uganda was 2.1 MW, with a minimum and maximum of 0.03 and 19.6 MW, respectively, and the standard deviation of the dataset was 2.8 MW. In Bolivia, 500 potential sites were identified with a total power capacity exceeding 6700 MW (Figure 8). These charts were produced from the available database of the Hyposo map (geospatial data format). The mean expected capacity of the identified potential sites in Bolivia was 13.4 MW, with a minimum and maximum of 0.4 and 63.2 MW, respectively, and the standard deviation of the dataset was 10. 8 MW. Approximately 140 sites have been identified within protected areas in Uganda, collectively possessing a total capacity of 2257 MW.
The aggregate hydropower capacity of river basins and specific potential
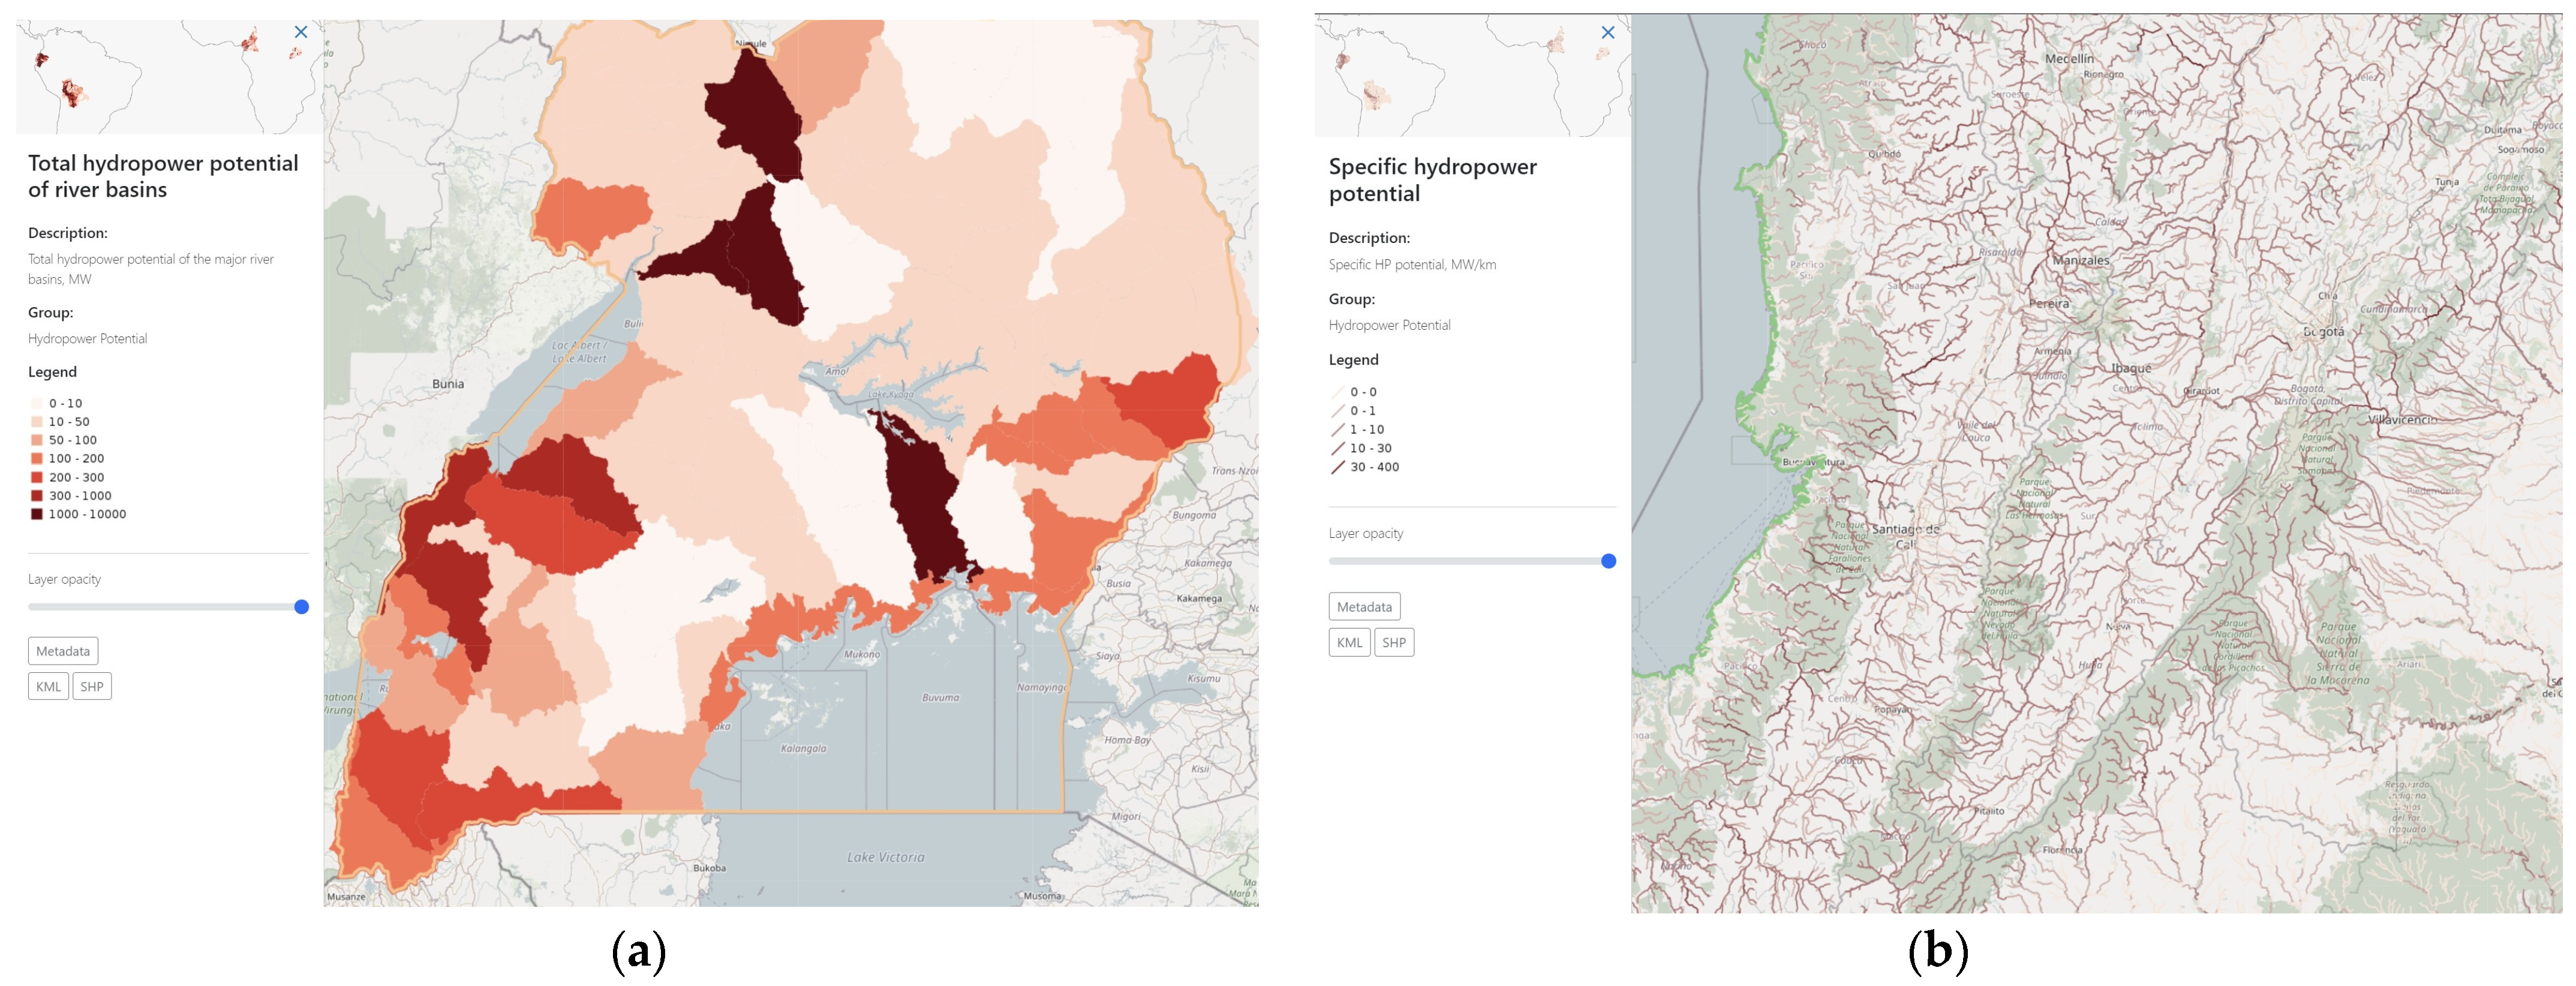
The cumulative (total) hydropower potential of the larger river basins, measured in megawatts (MW), is depicted (Figure 9a). The stream-reach specific hydropower potential (MW/km), including relevant metrics, was mapped (Figure 9b).

3.2.5. Validation of the HYPOSO Map

There are no agreed or standardised validation (verification or uncertainty quantification without going into details of terminology) protocols for web-based hydropower atlases. The term validation is well known in hydrology and environmental modelling and is commonly used to indicate a procedure to analyse the performance of simulation and/or forecasting models. In the scientific context, validation has a broader meaning, including any process that aims to verify a procedure’s ability to accomplish a given scope [52]. In this context, this is true for hydropower potential modelling and concisely visualising outcomes.
The first focus of validating the map viewer should be the hydropower potential or proposed hydro sites. Their secondary data and contextual information can be left aside for a while. Verification through field-based surveys requires much effort and is hardly physically possible in the case of the enormous scope of this project. Water availability for hydropower production is a crucial issue. The precision of hydro site selection relies solely on assessing stream flow measurements and analysing their temporal distribution.
Estimating hydropower potential, specifically the slope of the river channel or the change in elevation along the river channel, also known as the gross hydraulic head (refer to Equation (1)), is contingent upon the accuracy of digital elevation models (DEMs). The SRTM was designed with specific mapping accuracy thresholds [35]. Yet, there is a lack of consensus in the literature regarding evaluating the precision of Shuttle Radar Topography Mission (SRTM) DEM and other freely accessible global DEMs. Their accuracy significantly relies on factors such as geographic region, variations in topography, and the conditions of land covers, and the order of ranking based on RMSE of the DEMs is given [53,54,55]. In the case of South America, the SRTM dataset exhibits an average horizontal error of 9.0 m and an average absolute vertical (height) error of 6.2 m [56]. In Bolivia, for hydraulic head computation, the height error was accepted up to 5.5 m [17]. In Brasilia, it was demonstrated that the DEMs had applications compatible with 1:100,000 scales or smaller [57].
In Africa, the SRTM dataset demonstrates an average horizontal error of 11.9 m and an average absolute vertical (elevation) error of 5.6 m. However, in mountainous regions, the reported vertical accuracy is slightly diminished. The multi-error-removed improved-terrain (MERIT) digital elevation model (DEM) estimates a vertical accuracy of 12 m [33,34]. It is worth noting that the accuracy may not meet standard expectations in flat landscapes.
Several strategies can be employed to validate the modelled data initially. In certain countries such as Uganda and Cameroon, the digital elevation model (DEM) was validated by comparing the longitudinal profiles of selected rivers generated by Hyposo DEM with those extracted from terrain maps or profiles provided in hydrological literature. The statistical assessments yielded satisfactory results, particularly in the steep topography regions of these countries [21].
The accuracy of determining the key parameters of potential hydropower sites (or stream-reach capacity) is dependent on the following significant factors:
  • The quality of the hydrological data (stream flow);
  • The spatial location of the sites along the river depends on the accuracy of DEM.
For the hydrological data quality requirements, the measured discharges at gauging stations are outlined in the WMO technical regulations [58]. Experience shows that the quality of these data is often poor in emergent nations [43]. The study showed that sufficiently good quality hydrological data were available in Latin American countries (BO, CO and EC). In the case of African countries such as Cameroon (CM) and Uganda (UG), the reliability and quality of the input data series for this study were deemed adequate only at a minimal level.
The modelled flow data were compared with the collected hydrological data records from the river gauging stations. The estimated hydropower capacity was compared to the prior studies. The long-term mean annual river flow was used to calculate the stream reach and potential site power capacities. It is commonly accepted that the seasonal flow distribution (at daily or monthly intervals) can significantly affect the results of the assessment of hydropower potential at a site. Based on the construction of the daily flow duration curve, this method is applied for more detailed studies, for instance, in pre- or feasibility analyses of SHP schemes. When calculating site power capacity, an error can be between ± 20% and more than 30% when the mean annual river flow is used instead of daily flow values [59].
The mean annual runoff volume generated in the country’s area is a significant parameter for assessing hydropower potential. According to Uganda’s specific runoff digital map, the natural mean annual runoff volume at the country level was 46.54 bln. m3. An assessment that used GIS tools was evaluated as 40.8 bln. m3 [18]. For Cameroon, this runoff volume was evaluated at 292.2 and 284.9 bln. m3, respectively. The difference can be attributed to the different initial data, spatial resolutions, and other factors. Some river systems have major losses due to floodplain and water bodies’ evaporation, including flow obstructions or diversions for irrigation and other human uses. These factors were not considered here.
Most of the data published in GIS layers were derived from modelling outcomes, yet these estimates may not accurately reflect the figures applicable for technical design purposes. This is also true for the identified georeferenced potential sites of hydropower plants. The selection criteria consider factors such as protected areas, grid proximity, and settlements. However, the pre-selected points of potential sites do not always specify the layout of the scheme, such as the intake and powerhouse for small hydropower plants, but rather pinpoint the most suitable river sections for power plant development. Precise locations should be determined during field studies if a site is deemed for further development.

4. Conclusions

  • Web-based hydropower atlases have been developed for a long time in industrialised countries. In African and Latin American (LATAM) countries, they have started to be produced recently, five to eight years ago. However, map viewers are not and cannot be the final project design solution; they provide preliminary information.
  • There are a number of GIS hydro assessments but not many open-access GIS Map viewers. Five web-based hydro atlases available on two continents were reviewed.
  • As practice shows, web hydro atlases are created in countries with sufficient geospatial data. However, they are most welcome in data-scarce countries for hydropower development.
  • Map viewers use external resources; they cannot be overloaded with detailed information. Making them requires much effort. First of all, it is the production of DEM (digital elevation model). There are rarely accurate DEMs for emerging countries, or they are available only for limited areas. Open-source DEM products usually are not precise, especially in flat areas.
  • Validation is necessary for hydro map viewers; this is a major challenge for large areas. The HYPOSO map showed satisfactory results.
  • Developed open-access hydropower map viewers, including the HYPOSO map viewer, are expected to significantly improve the hydropower development database in these countries and provide valuable information for small and medium projects.

Author Contributions

Conceptualisation, methodology, investigation, writing—reviewing and editing, supervision, validation, P.P.; data curation, investigation, visualisation, original draft preparation, validation, L.J.; software, A.B. All authors have read and agreed to the published version of the manuscript.

Funding

This research was funded by the European Commission (EC) and the European Climate, Infrastructure and Environment Executive Agency (CINEA), grant number 857851.

Data Availability Statement

Publicly available datasets were analyzed in this study. This data can be found here: https://www.hyposo.eu/en/hyposo-map (accessed on 7 March 2024).

Acknowledgments

The authors thank the European Commission and CINEA for supporting the HYPOSO (hydropower solutions for developing and emerging countries) project. This paper is based on the findings of the work package WP3 “Framework Analysis and Research Needs”, task 3.3, “Mapping potential hydropower hotspots in the target countries”. The project coordinator was Ingo Ball (Wirtschaft und Infrastruktur Gmbh & CO Planungs KG, Germany). Antanas Dumbrauskas and Gitana Vyčienė (Vytautas Magnus University, Lithuania) performed part of the GIS modelling and hydrological assessments. The authors are grateful to the experts from the target countries: Carlos Velasquez (Centro Latinoamericano para la Pequena Hidroelectrica, Colombia), Dan Marlone Nabutsabi (Hydropower Association of Uganda Limited), Joseph Kenfack (la Société Solarhydrowatt, Cameroon), Veronica Graciela Minaya Maldonado, María José Guerra Aman, Patricia Haro (Escuela Politecnica Nacional, Ecuador), Mauricio Villazón, and Andres Gonzales (Universidad Mayor de San Simon, Bolivia).

Conflicts of Interest

The authors declare no conflict of interest. The funders had no role in the design of the study; in the collection, analyses, or interpretation of data; in the writing of the manuscript; or in the decision to publish the results.

Appendix A

Table A1. Web-based hydropower atlases for African and Latin American countries.
NoWeb-Based Assessment ToolFeatures, Layers
Product NameDeveloper and YearApplicable CountriesOperating System/PlatformBase MapsAdministrative Boundaries, PopulationInfrastructureTransmission LinesHydrographyHydrologyGauging StationsTopography, Land Cover, Geology, Protected AreasOperational HPPsHydropower (SHP) PotentialPotential SHP SitesClimate change ProjectionsHelp (Tutorial)Comment
1GIS Hydro Resource Mapping in West Africa (ECOWAS region). ECOWREX Map Viewer [13]Pöyry Energy GmbH, 2017West Africa, 14 ECOWAS countries WebOSM(x)xxxx-(x)xx(x)xxComprehensive hydro atlas and tutorial together with other renewables and energy parameters.
2Colombian Hydropower Potential Atlas [16]UPME (Colombia Energy Mining Planning Unit), 2015 ColombiaArcGIS online. ArcGIS REST Services Directory ESRI--xxx---xx--In Spanish, pico, small, and LHP. Only data repository.
Not easily accessible from other continents. A hard copy of the atlas is available.
3African hydropower
atlas (AHA) [19]
Sterl et al., 2021 AfricaOnline repository of datasets (xlsx, txt, GIS shapefile)--------x--x(x)Mostly large hydro. Existing and future plants. No operating system is offered.
4Tanzania Small Hydro GIS Atlas [14]SHER and Mhylab (World Bank), 2018 TanzaniaQGIS, Google Earthxxxxx(x)-xxxx--QGIS project with nine groups of layers.
5Madagascar—Small Hydro GIS Atlas [15]SHER and Mhylab (World Bank), 2017MadagascarQGIS, Google Earthxxxxx(x)-xxxx--Similar to Tanzania.
6HYPOSO Map [20]HYPOSO project, 2023 Bolivia, Colombia, Ecuador, Cameroon and UgandaWebOSM(x)(x)(x)xxx(x)xxxx(x)Registration is required.
Notes: For some products, registration is required. x—included to a sufficient extent/complete. (x)—only preliminary estimate.

References

  1. Jjunju, E.; Killingtveit, A.; Gimbo, F. A GIS tool for investigating potential hydropower sites in sparsely studied areas. In Proceedings of the Hydro 2015, Bordeaux, France, 26–28 October 2015; p. 15. [Google Scholar]
  2. Müller, M.F.; Thompson, S.E.; Kelly, M.N. Bridging the information gap: A webGIS tool for rural electrification in data-scarce regions. Appl. Energy 2016, 171, 277–286. [Google Scholar] [CrossRef]
  3. Minaya, V.G.; Haro, P.L.; Guerra, M.J. Small hydro in Ecuador: Potential and prospects. Int. J. Hydropower Dams. 2020, 2020, 52–57. [Google Scholar]
  4. Amaya, A.G.; Gomez, M.V.; Guzman, S.Z. The increasing importance of hydropower in Bolivia’s electricity sector. Int. J. Hydropower Dams. 2020, 2020, 58–61. [Google Scholar]
  5. Katutsi, V.; Kaddu, M.; Migisha, A.G.; Rubanda, M.E.; Adaramola, M.S. Overview of hydropower resources and development in Uganda. AIMS Energy 2021, 9, 1299–1320. [Google Scholar] [CrossRef]
  6. Kenfack, J.; Nzotcha, U.; Voufo, J.; Ngohe-Ekam, P.S.; Nsangou, J.C.; Bignom, B. Cameroon’s hydropower potential and development under the vision of Central Africa power pool (CAPP): A review. Renew. Sustain. Energy Rev. 2021, 151, 111596. [Google Scholar] [CrossRef]
  7. UNIDO; ICSHP World Small Hydropower Development Report 2022. Available online: www.unido.org/WSHPDR2022 (accessed on 10 January 2024).
  8. Hydropower Solutions HYPOSO. Hydropower Solutions for Developing and Emerging Countries. 2023. Available online: https://www.hyposo.eu/en/home (accessed on 10 January 2024).
  9. ORNL (Oak Ridge National Laboratory). HydroSource Data Explorer 2023. Available online: https://hydrosource-data.ornl.gov/#externalaccess (accessed on 10 January 2024).
  10. GECOsistema, S.W.I.T.C.H.-O.N. Pan-European Small Hydropower Atlas (SHPA) 2017. Available online: http://hydropower-atlas.climate-tools.com/ (accessed on 10 January 2024).
  11. European Small Hydropower Association (ESHA). RESTOR Hydro Map 2015. Available online: https://restor.eref-europe.org/ (accessed on 10 January 2024).
  12. Lunetta, R.S.; Lyon, J.G. Remote Sensing and GIS Accuracy Assessment, 1st ed.; CRC Press: Boca Raton, FL, USA, 2004. [Google Scholar]
  13. ECREEE (ECOWAS centre for Renewable Energy and Energy Efficiency). Results of ECOWAS Small Scale Hydropower Program. GIS Hydro Resource Mapping in West Africa 2017. Available online: http://www.ecowrex.org/smallhydro (accessed on 10 January 2024).
  14. World Bank Group, ESMAP (Energy Sector Management Assistance Program). Small Hydro Resource Mapping in Tanzania: Hydropower Atlas: Final Report (English) 2018. Available online: http://documents.worldbank.org/curated/en/873041518179010553/Small-hydro-resource-mapping-in-Tanzania-hydropower-atlas-final-report (accessed on 10 January 2024).
  15. World Bank Group. Madagascar—Small Hydro GIS Atlas 2017. Available online: https://energydata.info/dataset/madagscar-small-hydro-gis-atlas-2017 (accessed on 10 January 2024).
  16. UPME (Colombia Energy Mining Planning Unit). Primer Atlas hidroenergético revela gran potencial en Colombia 2015. Available online: https://www1.upme.gov.co/Paginas/Primer-Atlas-hidroenergetico-revela-gran-potencial-en-Colombia.aspx (accessed on 10 January 2024).
  17. Velpuri, N.M.; Pervez, S.; Cushing, W.M. Hydropower Assessment of Bolivia 2016; 2016-1156. Available online: https://purl.fdlp.gov/GPO/gpo121841 (accessed on 10 January 2024).
  18. Korkovelos, A.; Mentis, D.; Siyal, S.; Arderne, C.; Rogner, H.; Bazilian, M.; De Roo, A. A Geospatial Assessment of Small-Scale Hydropower Potential in Sub-Saharan Africa. Energies 2018, 11, 3100. [Google Scholar] [CrossRef]
  19. Sterl, S.; Devillers, A.; Chawanda, C.J.; van Griensven, A.; Thiery, W.; Russo, D. A spatiotemporal atlas of hydropower in Africa for energy modelling purposes. Open Res. Eur. 2021, 1, 1–29. [Google Scholar]
  20. HYPOSO (Hydropower Solutions). HYPOSO Map 2023. Available online: https://www.hyposo.eu/en/hyposo-map/ (accessed on 10 January 2024).
  21. Punys, P.; Vyčienė, G.; Jurevičius, L.; Kvaraciejus, A. Small Hydropower Assessment of Uganda Based on Multisource Geospatial Data. Water 2023, 15, 2051. [Google Scholar] [CrossRef]
  22. GeoServer. 2023. Available online: http://geoserver.org/ (accessed on 10 January 2024).
  23. World Maps of Köppen-Geiger Climate Classification 2023. Available online: http://koeppen-geiger.vu-wien.ac.at/present.htm (accessed on 10 January 2024).
  24. Protected Planet. Protected Areas (WDPA) 2023. Available online: https://www.protectedplanet.net/en (accessed on 10 January 2024).
  25. World Bank: Climate Change Knowledge Portal 2020 (CCKP). Available online: https://climateknowledgeportal.worldbank.org/ (accessed on 10 January 2024).
  26. IPCC Data Distribution Center. What Is a GCM? Available online: https://www.ipcc-data.org/guidelines/pages/gcm_guide.html (accessed on 2 April 2024).
  27. Lee, H.; Romero, J. IPCC, 2023: Climate Change 2023: Synthesis Report. Contribution of Working Groups I, II and III to the Sixth Assessment Report of the Intergovernmental Panel on Climate Change; IPCC: Geneva, Switzerland, 2023; pp. 35–115. [Google Scholar]
  28. Guo, Y.; Xu, Y.; Yu, X.; Xie, J.; Chen, H.; Si, Y. Impacts of GCM credibility on hydropower production robustness under climate change: CMIP5 vs CMIP6. J. Hydrol. 2023, 618, 129233. [Google Scholar] [CrossRef]
  29. Wasti, A.; Ray, P.; Wi, S.; Folch, C.; Ubierna, M.; Karki, P. Climate change and the hydropower sector: A global review. WIREs Clim. Chang. 2022, 13, e757. [Google Scholar] [CrossRef]
  30. International Energy Agency (IEA). Climate Impacts on African Hydropower 2020; p. 58. Available online: https://www.iea.org/reports/climate-impacts-on-african-hydropower (accessed on 10 January 2024).
  31. International Energy Agency IEA). Climate Impacts on Latin American Hydropower. IEA 2021; p. 57. Available online: https://www.iea.org/reports/climate-impacts-on-latin-american-hydropower (accessed on 10 January 2024).
  32. GISGeography. Inverse Distance Weighting (IDW) Interpolation 2023. Available online: https://gisgeography.com/inverse-distance-weighting-idw-interpolation/ (accessed on 10 January 2024).
  33. Yamazaki, D.; Ikeshima, D.; Sosa, J.; Bates, P.D.; Allen, G.H.; Pavelsky, T.M. MERIT Hydro: A High-Resolution Global Hydrography Map Based on Latest Topography Dataset. Water Resour. Res. 2019, 55, 5053–5073. [Google Scholar] [CrossRef]
  34. MERIT DEM. 2019. Available online: https://www.usna.edu/Users/oceano/pguth/md_help/html/merit_dem.htm (accessed on 10 January 2024).
  35. NASA. Earthdata. Shuttle Radar Topography Mission (SRTM) 2000. Available online: https://www.earthdata.nasa.gov/sensors/srtm (accessed on 10 January 2024).
  36. Tarboton, D.G.; Bras, R.L.; Rodriguez-Iturbe, I. On the extraction of channel networks from digital elevation data. Hydrol. Process. 1991, 5, 81–100. [Google Scholar] [CrossRef]
  37. USACE (US Army Corps of Engineers). National Hydroelectric Power Resources Study; USACE (US Army Corps of Engineers): Washington, DC, USA, 1983; IWR-82-H-1. [Google Scholar]
  38. Kao, S.; McManamay, R.A.; Stewart, K.M.; Samu, N.M.; Hadjerioua, B.; DeNeale, S.T.; Yeasmin, D. New Stream-Reach Development: A Comprehensive Assessment of Hydropower Energy Potential in the United States; U.S. Department of Energy: Washington, DC, USA, 2014; pp. 1–197. [Google Scholar]
  39. The International Journal on Hydropower & Dams. Available online: https://www.hydropower-dams.com/ (accessed on 10 January 2024).
  40. Kling, H.; Stanzel, P.; Fuchs, M. Regional Assessment of the Hydropower Potential of Rivers in West Africa. Energy Procedia 2016, 97, 286–293. [Google Scholar] [CrossRef]
  41. Karamage, F.; Liu, Y.; Liu, Y. Data Construction and Spatiotemporal Trend Attribution of Runoff over the African Continent (1981–2016). J. Hydrometeorol. 2021, 22, 1949–1971. [Google Scholar] [CrossRef]
  42. UPME; PUJ; COLCIENCIAS; IDEAM; IGAC. Atlas Potencial Hidroenergético De Colombia 2015. Available online: https://www.ariae.org/servicio-documental/atlas-potencial-hidroenergetico-de-colombia-2015 (accessed on 7 March 2024).
  43. ECOWASCentre for Renewable Energy Energy Efficiency Pöyry Energy, GmbH. Hydropower Resource Mapping and Climate Change Scenarios for the ECOWAS region—Technical Report on Methodology and Lessons Learnt for ECOWAS Countries. 2017. Available online: http://www.ecowrex.org/document/technical-report-methodology-and-lessons-learnt-ecowas-countries-gis-hydropower-resource (accessed on 10 January 2024).
  44. Girvetz, E.; Ramirez-Villegas, J.; Claessens, L.; Lamanna, C.; Navarro-Racines, C.; Nowak, A.; Rosenstock, T.S. Future Climate Projections in Africa: Where are we headed? In The Climate-Smart Agriculture Papers; Rosenstock, T., Nowak, A., Girvetz, E., Eds.; Springer: Cham, Switzerland, 2019; pp. 15–27. [Google Scholar]
  45. Schaefli, B. Projecting hydropower production under future climates: A guide for decision-makers and modelers to interpret and design climate change impact assessments. WIREs Water 2015, 2, 271–289. [Google Scholar] [CrossRef]
  46. Jjunju, E.; Killingtveit, Å.; Hamududu, B. Hydropower and Climate Change. In Comprehensive Renewable Energy; Letcher, T.M., Ed.; Elsevier: Oxford, UK, 2022; pp. 259–283. [Google Scholar]
  47. Strahler, A.N. Quantitative analysis of watershed geomorphology. Eos Trans. Am. Geophys. Union. 1957, 38, 913–920. [Google Scholar]
  48. Szabó, S.; Bódis, K.; Huld, T.; Moner-Girona, M. Sustainable energy planning: Leapfrogging the energy poverty gap in Africa. Renew. Sustain. Energy Rev. 2013, 28, 500–509. [Google Scholar] [CrossRef]
  49. Pandey, A.; Lalrempuia, D.; Jain, S.K. Assessment of hydropower potential using spatial technology and SWAT modelling in the Mat River, southern Mizoram, India. Hydrol. Sci. J. 2015, 60, 1651–1665. [Google Scholar] [CrossRef]
  50. Sammartano, V.; Liuzzo, L.; Freni, G. Identification of Potential Locations for Run-of-River Hydropower Plants Using a GIS-Based Procedure. Energies 2019, 12, 3446. [Google Scholar] [CrossRef]
  51. Kouadio, C.A.; Kouassi, K.L.; Diedhiou, A.; Obahoundje, S.; Amoussou, E.; Kamagate, B.; Paturel, J.E.; Coulibaly, T.J.; Coulibaly, H.S.; Didi, R.S.; et al. Assessing the Hydropower Potential Using Hydrological Models and Geospatial Tools in the White Bandama Watershed (Côte d’Ivoire, West Africa). Front. Water 2022, 4, 844934. [Google Scholar] [CrossRef]
  52. Biondi, D.; Freni, G.; Iacobellis, V.; Mascaro, G.; Montanari, A. Validation of hydrological models: Conceptual basis, methodological approaches and a proposal for a code of practice. Phys. Chem. Earth Parts A/B/C 2012, 42–44, 70–76. [Google Scholar] [CrossRef]
  53. Mukul, M.; Srivastava, V.; Jade, S.; Mukul, M. Uncertainties in the Shuttle Radar Topography Mission (SRTM) Heights: Insights from the Indian Himalaya and Peninsula. Sci. Rep. 2017, 7, 41672. [Google Scholar] [CrossRef] [PubMed]
  54. Uuemaa, E.; Ahi, S.; Montibeller, B.; Muru, M.; Kmoch, A. Vertical Accuracy of Freely Available Global Digital Elevation Models (ASTER, AW3D30, MERIT, TanDEM-X, SRTM, and NASADEM). Remote Sens. 2020, 12, 3482. [Google Scholar] [CrossRef]
  55. Nandam, V.; Patel, P.L. Assessment of Vertical Accuracy of Freely Available Global Digital Elevation Models for Heterogeneous Terrains in India; HYDRO 2021. Lecture Notes in Civil Engineering; Springer: Singapore, 2023; Volume 339, pp. 169–182. [Google Scholar] [CrossRef]
  56. Rodríguez, E.; Morris, C.S.; Belz, J.E. A Global Assessment of the SRTM Performance. Photogramm. Eng. Remote Sens. 2006, 72, 249–260. [Google Scholar] [CrossRef]
  57. Ferreira, Z.A.; Cabral, P. Vertical Accuracy Assessment of ALOS PALSAR, GMTED2010, SRTM and Topodata Digital Elevation Models. In Proceedings of the 7th International Conference on Geographical Information Systems Theory, Applications and Management GISTAM, Prague, Czechia, 23–25 April 2021; Volume 1, pp. 116–124. [Google Scholar]
  58. WMO (World Meteorological Organization). Guide to Hydrological Practices. In Hydrology—From Measurement to Hydrological Information WMO; WMO-No 168: Geneva, Switzerland, 2020; Volume I. [Google Scholar]
  59. Punys, P.; Kvaraciejus, A.; Dumbrauskas, A.; Šilinis, L.; Popa, B. An assessment of micro-hydropower potential at historic watermill, weir, and non-powered dam sites in selected EU countries. Renew. Energy 2019, 133, 1108–1123. [Google Scholar] [CrossRef]
Figure 1. Desktop interface of the HYPOSO hydropower atlas (a) and key layers (b).
Water 16 01276 g001
Figure 2. Transmission and distribution lines of the western part of Uganda (a) and protected areas in Bolivia (b).
Water 16 01276 g002
Figure 3. Hydropower plants under operation in Ecuador and Colombia.
Water 16 01276 g003
Figure 4. Climate zones in Bolivia (a) and climate change projections of precipitation (mean projections—CMIP6 and scenario SSP2–4.5) in Uganda (b).
Water 16 01276 g004
Figure 5. Hydrologic units (geospatial polygons) of Bolivia (a) and rivers and streams (geospatial polyline layer) with the Strahler stream order highlighted in Ecuador (b). River and stream gauging stations (GS) network in Cameroon (c). An extract of the small catchment area generated from the DEM in Bolivia (geospatial polygon layer). (d). A pop-up with a catchment area of 220.73 km2 is highlighted.
Water 16 01276 g005
Figure 6. Normal annual specific runoff (geospatial polygon layer) (a) and the mean annual flow of the rivers (geospatial polygon layer) in Cameroon (b).
Water 16 01276 g006
Figure 7. Hydropower potential from new stream-reach development (NSD), MW (geospatial polyline layer) (a), and potential sites of hydropower plants in Ecuador (geospatial point layer), with a pop-up window showing key features of a site (b).
Water 16 01276 g007
Figure 8. Key characteristics of the potential hydropower sites in Bolivia at large (a) and their frequency distribution of capacities (P < 40 MW) with a fitted theoretical Weibull distribution density function (b); Capacity = 499*5*Weibull (x;14.18;1.21;0). Where sample size of the distribution n = 499, 5—graph conversion parameter, 14.18—scale parameter, 1.21—shape parameter, and 0—location parameter.
Water 16 01276 g008
Figure 9. (a) The cumulative (total) hydropower potential (MW) of the larger river basins in Uganda (geospatial polygon layer). (b) Specific hydropower potential (MW/km) in Colombia (geospatial polyline layer).
Water 16 01276 g009
Disclaimer/Publisher’s Note: The statements, opinions and data contained in all publications are solely those of the individual author(s) and contributor(s) and not of MDPI and/or the editor(s). MDPI and/or the editor(s) disclaim responsibility for any injury to people or property resulting from any ideas, methods, instructions or products referred to in the content.