Article

Water Whiplash in Mediterranean Regions of the World

1
Schmid College of Science and Technology, Chapman University, One University Drive, Orange, CA 92866, USA
2
Fowler School of Engineering, Chapman University, One University Drive, Orange, CA 92866, USA
3
Earth Systems Science and Data Solutions Lab, Chapman University, Orange, CA 92866, USA
4
Civil, Construction and Environmental Engineering, University of Alabama, Tuscaloosa, AL 35487, USA
5
Department of Environmental Sciences, Faculty of Science, Alexandria University, Moharem Bek, Alexandria 21522, Egypt
*
Author to whom correspondence should be addressed.
Water 2024, 16(3), 450; https://doi.org/10.3390/w16030450
Submission received: 22 December 2023 / Revised: 22 January 2024 / Accepted: 26 January 2024 / Published: 30 January 2024
(This article belongs to the Special Issue Impacts of Climate Change on Hydrology and Water Resources)

Abstract

:
The presence of weather and water whiplash in Mediterranean regions of the world is analyzed using historical streamflow records from 1926 to 2023, depending on the region. Streamflow from the United States (California), Italy, Australia, Chile, and South Africa is analyzed using publicly available databases. Water whiplash—or the rapid shift of wet and dry periods—are compared. Wet and dry periods are defined based on annual deviations from the historical record average, and whiplash occurs when there is an abrupt change that overcomes an accommodated deficit or surplus. Of all the stations, there are more dry years (56%) than wet years (44%) in these regions, along with similarities in the variances and shifts in extremes (i.e., whiplash). On average, 35% of the years were defined as water whiplash years in all countries, with the highest levels in the US (California), where 42–53% of the years were whiplash years. The influence of the El Niño–Southern Oscillation (ENSO) influences Chile and South Africa strongest during the first quarter of the year. This study found that smaller extreme wet periods and larger and less extreme dry periods are prevalent in Mediterranean regions. This has implications for water management as adaptation to climate change is considered.

1. Introduction

Extreme, unpredictable climate events can have adverse impacts on water security, society, and natural ecological systems. Extreme events are predicted to change in certain climate change hotspots of the world, including California in the United States [1,2]. Of interest in the present study is how Mediterranean regions will change, as they are characterized by having mild winters with variable precipitation periods, and hot, dry summers [3,4]. This climate region exists at equal distances from the equator, ranging between 30° North or South and 45° North or South. Furthermore, Mediterranean climate zones fall on the continent’s western side. The five Mediterranean regions around the world are in California, the Mediterranean Basin in Europe, Western Australia, Chile, and the Cape of South Africa [3]. Furthermore, these regions are identified in the Koppen–Geiger Climate Classification world map [4], have cool, damp winters and hot dry summers, and are highly desirable due to their ideal weather conditions. These regions host agricultural hotspots, dense populations, and diverse species, making it important to understand their climate patterns.
A study of California precipitation found that dry to wet events are 25% to 100% more frequent in California under future climate projections [2]. A global study of Mediterranean precipitation found a decrease in the frequency of daily precipitation events, combined with increased amounts in rare extreme events, resulting in more year-to-year variability [5]. The Mediterranean basin (identified as the region around the Mediterranean Sea) has been noted as a climate change hotspot, and recent research has shown a strong coupling between temperature and precipitation, with tendencies for warm-dry anomalies in the summer and cold-wet anomalies in the winter [6]. This drying over Mediterranean regions has also been shown in climate change projections (e.g., [7,8,9]). The impact of hydrological intensification (or whiplash) was investigated for different regions of the world, and it was found that large areas of intensification occurred in areas with large reservoir systems in place, thus allowing for adaption [10].
Previous studies have been limited to extreme precipitation shifts for the regions noted above [1,2,5]. The work presented here augments past studies by focusing on water supply, as represented by streamflow, with an aim to understand weather (water) whiplash phenomena in Mediterranean regions. Weather whiplash is defined as sudden changes in weather conditions from one extreme to another, such as drought to heavy precipitation or flooding [1,5,11]. The study presented here is motivated by California’s switch from having the worst drought on record in 2022 to seeing one of the wettest years in 2023, relieving the state of drought. Furthermore, the Emilia Romagna region of Northern Italy has experienced a steady increase in the intensity of rainfall events [12]. The frequency and intensity of destructive, heavy rainfall events are expected to increase in this region [13]. The study here compares all global Mediterranean regions based on the historical streamflow record and whether the whiplash phenomenon is present in other Mediterranean climate zones.
A further aim in this study is to evaluate the impact of the El Niño–Southern Oscillation (ENSO) on streamflow in Mediterranean regions. ENSO has been shown to have global impacts (e.g., [14,15,16,17,18,19]). These global studies have shown that three of the five Mediterranean regions investigated in this study are drier during El Niño years. The investigation of streamflow in this study will provide a broader perspective on integrated water impacts in these regions. It is important to note that other modes of large-scale climate variability may have a more significant impact on certain Mediterranean regions. For instance, European precipitation has been connected to North Atlantic Oscillation (NAO), the Artic Oscillation (AO), the North Sea Caspian Pattern (NCP), and two indices of Mediterranean Oscillation (MOI2, WeMOI) [20]. A study of North Africa did not find a significant ENSO effect for North Africa (a Mediterranean region) [21].

2. Materials and Methods

2.1. Data

Figure 1 and Table 1 present all the streamflow stations used in this study. This includes four stations in each of the countries of Italy, South Africa, United States (California), Australia, and Chile.

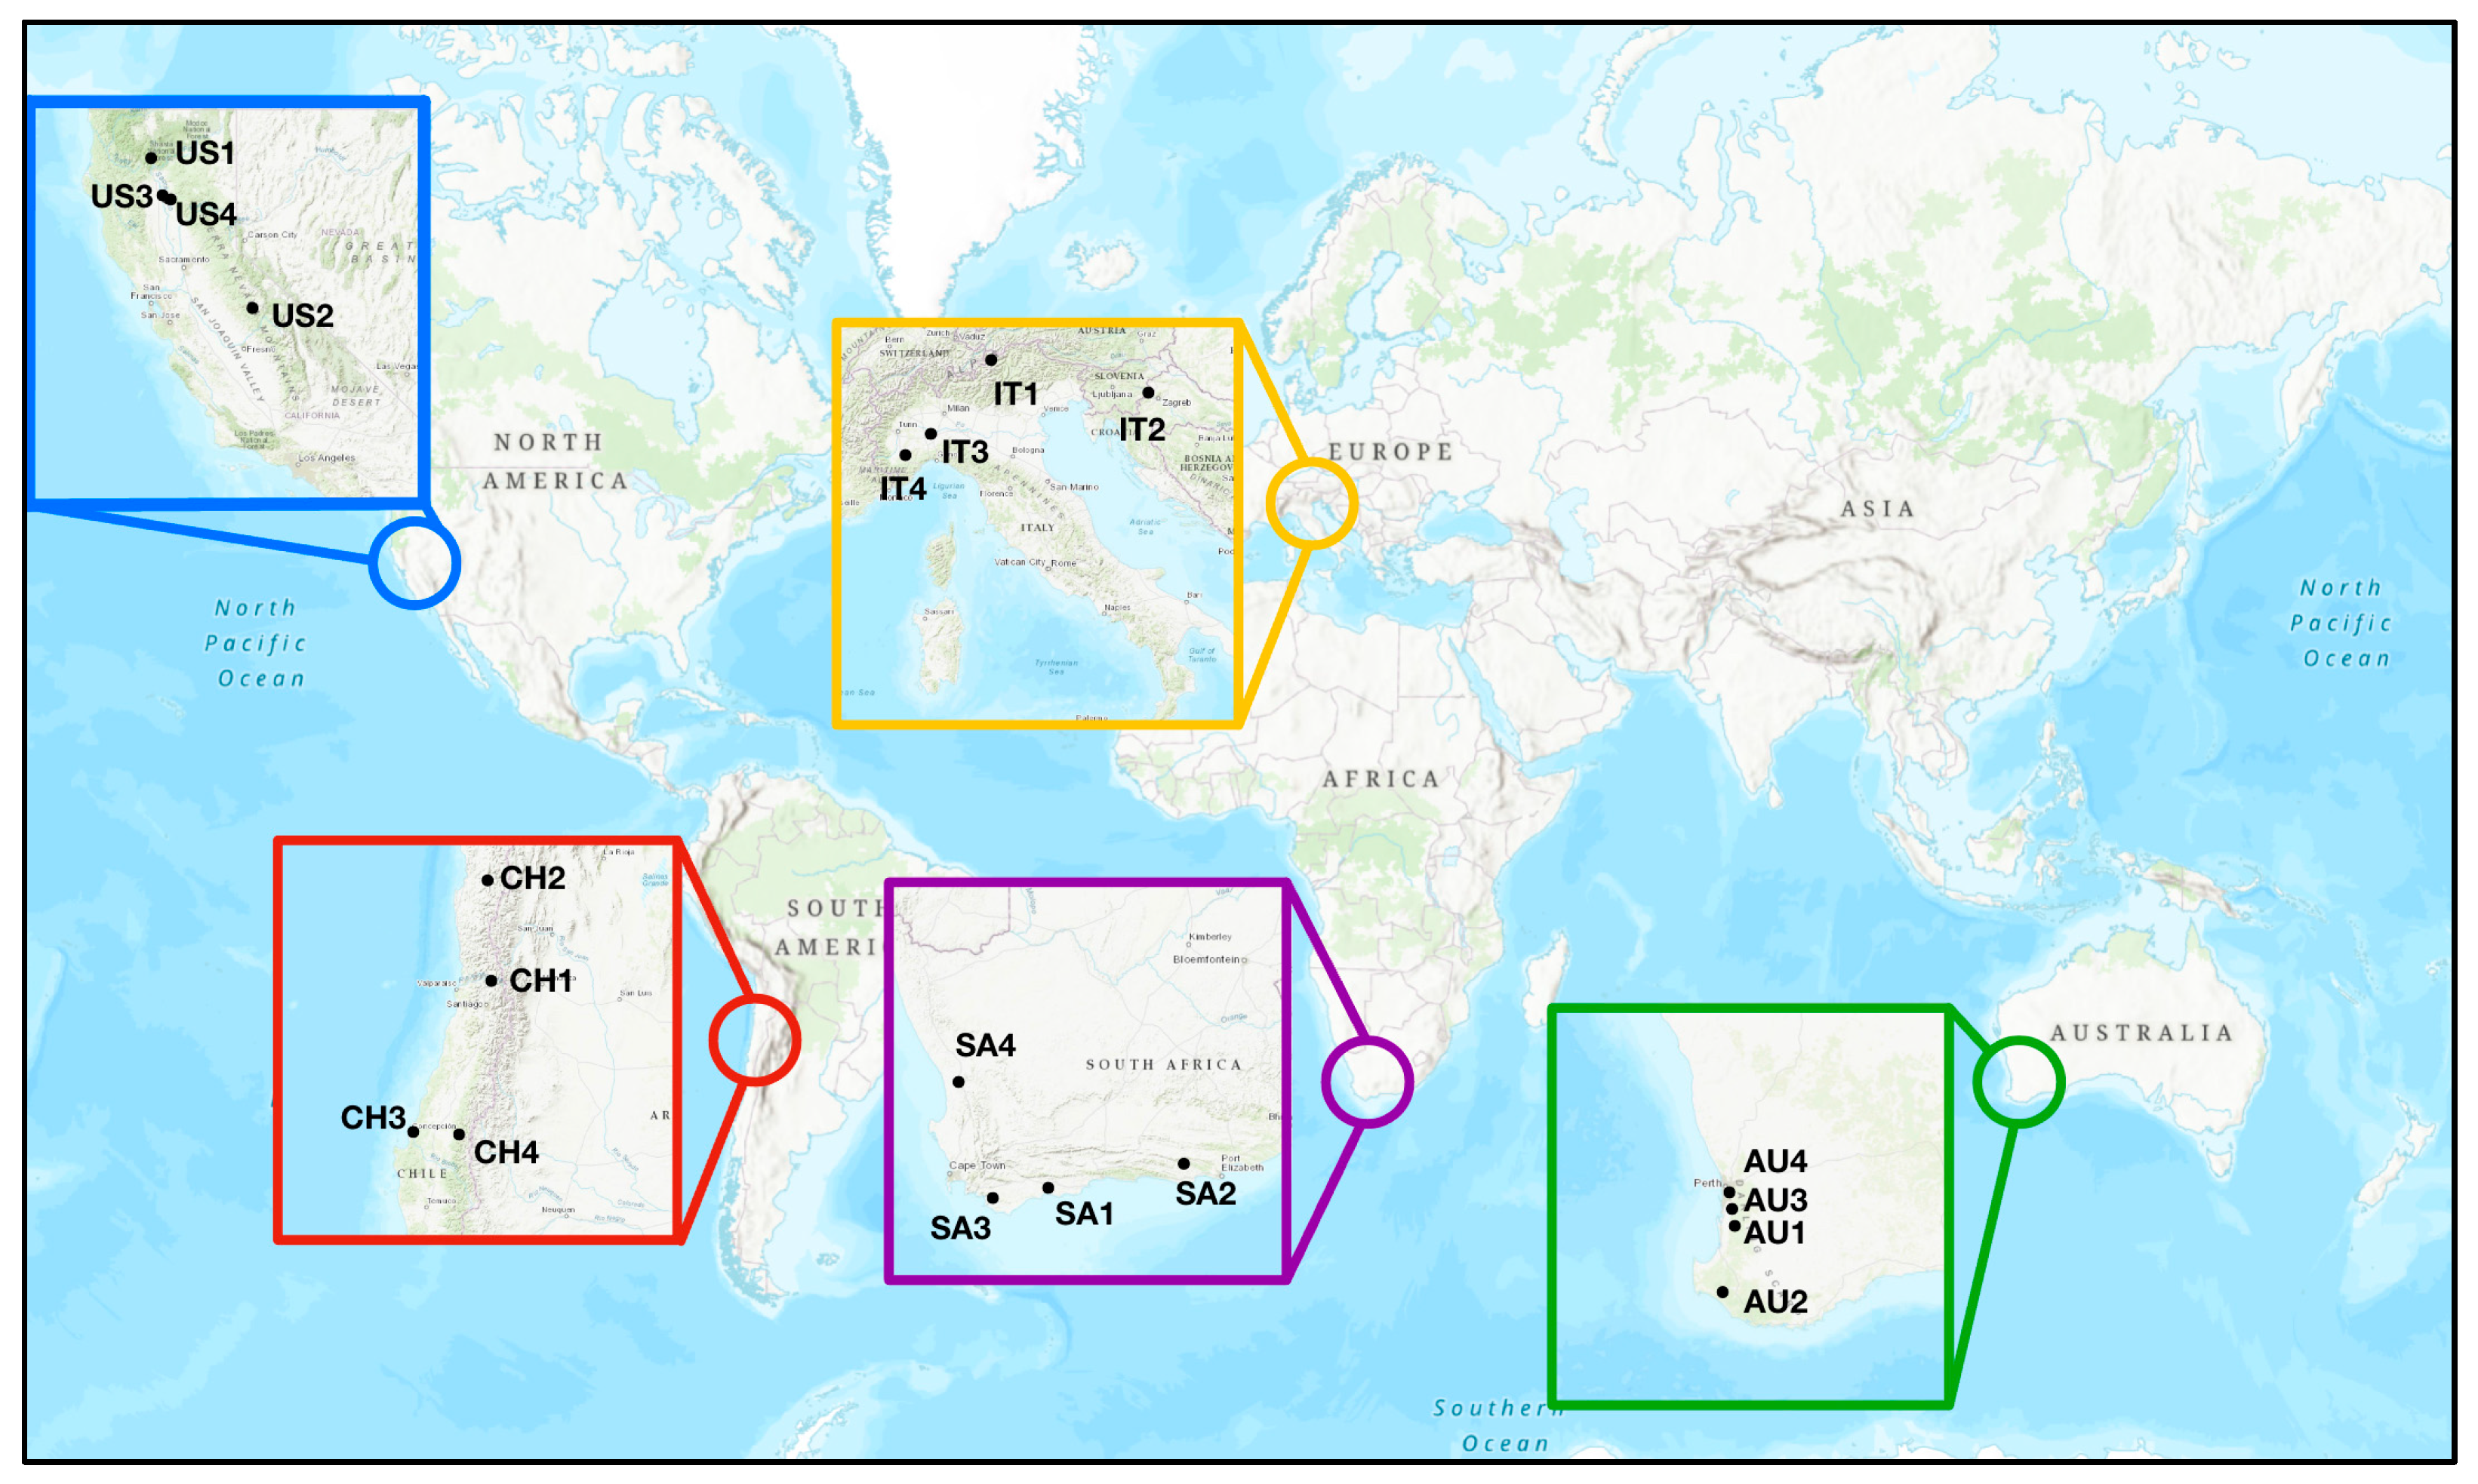
2.1.1. Chile, South Africa and Italy (Global Runoff Data Center)

The streamflow data for Chile (CH1-4), South Africa (SA1-4) and Italy (IT3 and IT4) were obtained from the Global Runoff Data Centre’s (GRDC) data portal [22]. This data portal provides historical mean daily and monthly river discharge data for over 10,000 stations globally. From the data portal, four stations from along the Southern and the Western regions of South Africa, four stations throughout Chile, and two stations in Northeastern Italy were selected to conduct this study. The retrieved data were monthly mean discharges (m3/s), which were used to calculate the annual mean data (m3/s) for each of the ten stations.

2.1.2. United States (California) (USGS)

For stations US 1 through 4 (Table 1), mean annual streamflow data were collected from the U.S. Geological Survey (USGS) NWISWeb Data retrieval [23] for the water years of 1951–2022, which are measured from October to the following September (defined as a water year). The four stations are located in the north central part of California in the United States. The data retrieved from the USGS are in cubic feet per second (ft3/s), and were converted into kilo-acre feet (KAF) to conduct the study. The 2023 data were based on a forecast of the water year volume (made on 1 April 2023) provided by the National Oceanic and Atmospheric Administration’s (NOAA) California Nevada River Forecast Center [24].

2.1.3. Italy

For station IT1 (Table 1), annual modeled streamflow data were acquired from previous research [25,26,27]. For station IT2 (Table 1), streamflow data were obtained from the Catez gauge, located on the Sava River in Slovenia near the Croatian border. Although this station is not in Italy, the gauge is a critical measurement of streamflow in the European Mediterranean basin [28]. Annual data are given in MCM (million cubic meter). Past studies (e.g., [28]) have shown that the data are sufficient for studies evaluating climate impacts on water resources of the water basins. In addition, direct observations of rivers are provided for two stations [IT3 and IT4].

2.1.4. Australia (Hydrologic Reference Stations)

For stations in Australia, data were retrieved from the Hydrologic Reference Stations (HRS) catchments by the Australian Government Bureau of Meteorology [29]. For this study, annual streamflow (ML/year) was derived from the HRS, which provided high quality daily streamflow data and corresponding statistics for 467 stations [30]. Four stations were selected in Southwestern Australia, near Perth which is part of the Mediterranean region of Australia.

2.2. Analysis of Whiplash—Wet and Dry Periods

For the study shown here, wet and dry periods were identified in the records based on yearly deviations from the long-term average of the historical record. Wet years are positive departures (y) from the long-term average of the historical record (x), and dry years are negative departures (y) where:
y i = x i x ¯
A wet (or dry period) is calculated by summing up consecutive dry or wet years where:
i = 1 n y i = A j
A dry or wet period continues until the accumulated (A) deficit or surplus condition is switched by a single year (y), with a higher opposite sign of deficit or surplus. This sudden shift in state is referred to as “whiplash” (W), since an accumulated state is abruptly changed in one year where:
W     i s   n e g a t i v e   w h e n     y i > A j i s   p o s i t i v e   w h e n   y i > A j
To compare stations with different magnitudes, an indicator ratio (IR) of accumulated deficit or surplus to the long-term mean is calculated.
I R i = A j X ¯
Indicator values that shift from negative to positive or positive to negative in two consecutive years reflect whiplash years.

2.3. Testing of Differences in Populations

The testing of different populations for this study used the F-test. For instance, tests were conducted between countries to evaluate similarities or differences. The F-test evaluates the variance in two populations. This was carried out for differences (or similarities) between countries. Results are displayed and discussed in Section 3.
The sample populations of wet (surplus) and dry (deficit) periods for each country are also presented as box and whisker plots, where the middle of the box represents the median, the top and bottom represent the 75th and 25th percentiles of the population, and the top and bottom of the whisker represent the 90th and 10th percentiles of the population (see Section 3.1.1). In addition, box plots are used to represent the proportion of years that are whiplash years (see Section 3.1.2).

2.4. Analysis of ENSO Impacts

Streamflow data are tested with four different Oceanic Niño Index (ONI) values, a measure of the El Niño-Southern Oscillation [31]. JFM, AMJ, JAS, and OND are used as representations for the year. Correlation between flow and each ONI index are tested for each station.

3. Results

3.1. Weather Whiplash Results

The analyses to test the similarities of Mediterranean regions/countries to weather whiplash are shown in Table 2 and Table 3, Figure 2, Figure 3, Figure 4 and Figure 5. These results are shown for the historical period of records that vary depending on the region (see Table 1).

3.1.1. Wet and Dry Periods

The occurrence of wet and dry periods is noted in Table 2 and Figure 2. In Table 2, two analyses are presented using the entire period of record for all the stations, and another analysis using a common period (1983–2018) for 18 of the 20 stations. Using the entire length of record for all stations, the majority of the stations (14 of 20) have an equal likelihood of wet and dry years (i.e., the number of dry and wet years are about the same). A couple stations have a significantly higher percentage of dry years (over 70%), namely Murray River (AU1) in Australia and Grootriver (SA2) in South Africa. Six stations had at least 60% of years drier than average, with a majority (4/6) of those being in Australia and South Africa. It is noteworthy that none of the stations had a larger portion of years that were wetter than drier, representing a general drying of these regions. Finally, the overall average percentage of dry years (56%) is greater than that of wet years (44%). Using a common period in the record, only 8 of the 18 stations had an equal likelihood of wet and dry years, with nine (9) of the stations indicating a larger number of dry years.
Figure 2 presents boxplots for wet and dry period lengths using the entire record. The periods are relatively the same length for wet periods (Figure 2a); however, there is a larger variation for the dry periods (Figure 2b) in each region. F-tests were conducted for both wet and dry periods between each pair of regions. Values less than 0.05 indicate that the probability that two regions are different is low (Table 3). Therefore, highlighted values mean that the regions tested are statistically similar. In both the wet and dry periods, the United States (California) is statistically similar with each region. Furthermore, the F-test analysis shows that Australia is similar to each region for the dry periods only.

3.1.2. Whiplash Results

The rapid change from dry to wet or wet to dry states (whiplash) is evaluated in Figure 3 and Table 3. Figure 3 provides a compilation of all the indicator values expressed as an indicator ratio described in Section 2.2. A positive indicator ratio is a rapid transition from dry to wet state, and a negative indicator ratio is a rapid transition from wet to dry state. There are higher whiplash events from dry to wet, as shown by the larger positive values in Figure 3. Comparing this result to Figure 2, it is concluded that there are shorter intense wet periods and longer and less intense dry periods. Variability is highest in the United States (California), Australia, and South Africa. Results from Table 3 display that most countries have similar ratio values, with exceptions for the United States (California) and Chile.
Figure 4 presents the proportion of whiplash years that occur in each country for all stations. The US (California) locations have the highest proportion of years that are whiplash years—between 42 and 53% of years. Australia has the largest variability, from 10 to 45%. Italy, Chile, and South Africa are similar, and have about 35% of their years as whiplash years.

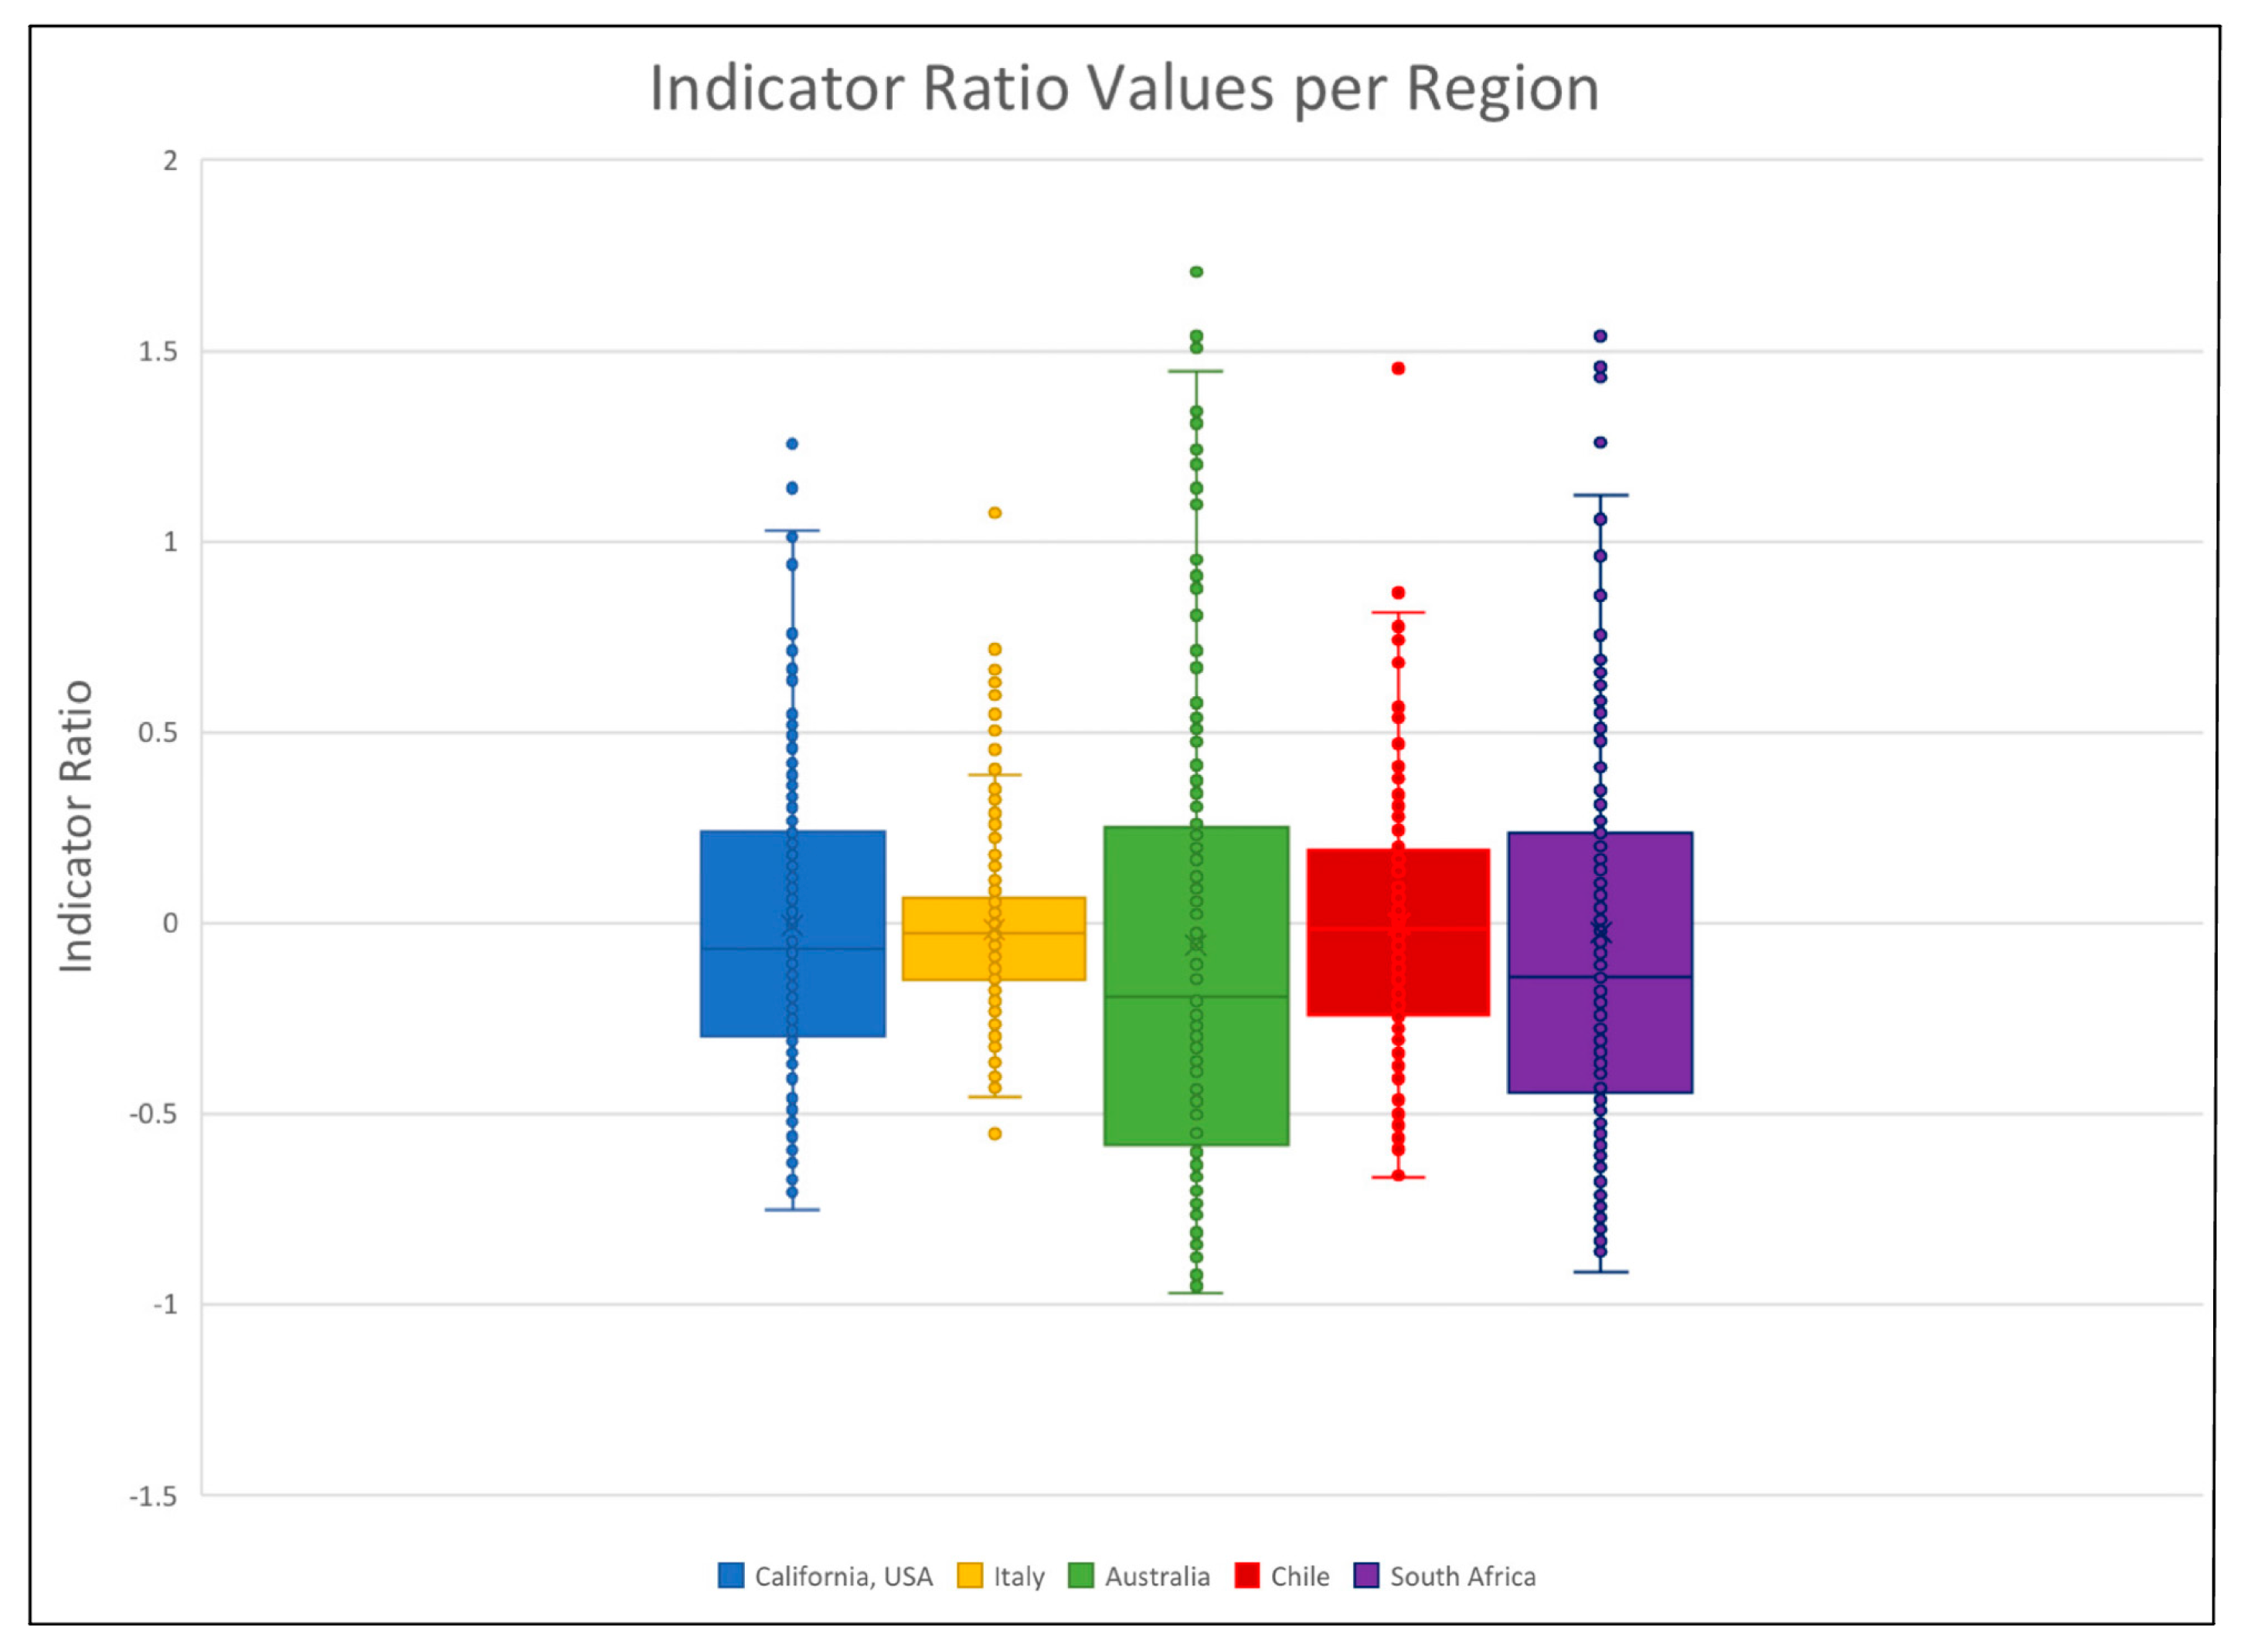
3.1.3. Regional Analysis

The regional analysis of wet and dry periods and associated whiplash events is shown in Figure 5. Three of the five regions show drying in the latter half of the record (Sava (Figure 5b), Donnelly (Figure 5c), Biobio (Figure 5d)). In California (Merced River, US2); the early part of the record (1951 to 1986) had wet and dry periods that were short and mild. In 1987, the dry period became longer, and wet and dry periods became more intense and more frequent. In Italy (Sava River, IT2), 1926–1980 were predominantly wet years, with a switch in 1980 to dry years. In Australia (Donnelly River, AU2), 1953–2000 were predominantly wet years, with a switch in 2000 to dry years, similar to Italy. In Chile, (Biobio River, CH3) dry periods became longer in recent years after 2000. Finally, in South Africa (Kleinrivier, SA3) the data shows that wet and dry periods became more intense later in the record, similar to California (Merced River).

3.2. ENSO Impacts

Table 4 provides a summary of the impact of ENSO on all the regions and rivers of this study. Table 4 displays correlation coefficients for each test. Values are highlighted, with a significance of p = 0.10 and p = 0.05. While ENSO has been shown to have global impacts [32], the areas impacted in this study are fairly limited. Most notable were the stations in Chile, with all four stations showing significance at both 95% and 90% confidence levels. South Africa and United States (California) had some significance, with two and one station(s), respectively, displaying statistical significance. Stations in Italy and Australia did not show statistical significance under either level. The selected season does have an impact on whether ENSO influences streamflow. For instance, the ONI values in JFM were significant in five stations, compared to the other seasons having two significant stations each.

4. Discussion

In this study, historical streamflow data were used to evaluate the presence of water whiplash in Mediterranean regions of the world. Most regions indicated a general drying in terms of the number of years that were dry as opposed to wet. Additionally, many of the regions had longer dry periods than wet periods in terms of number of years. For instance, up to 53% of the years in the US (California) were defined as whiplash years (Figure 4). Previous work has shown California not drying to the same level as other Mediterranean regions [5]. On average for other regions, approximately 35% of the years were water whiplash (Figure 4).
For all regions, there are shorter intense wet periods and longer and less intense dry periods—switching back and forth between conditions of long, dry periods where the soil is dry, and intense, wet periods where soils saturate and produce excess runoff. This intense flooding and rapid shifting between extremes may have adverse impacts on ecosystems and surrounding communities.
In the face of the abrupt shifts due to weather whiplash, developing nations and poorer regions disproportionately experience the impacts of these events. For instance, regions of Chile and South Africa do not have the same means to adapt as other countries such as the United States, Italy, and Australia. These vulnerable regions are usually not equipped in resources and infrastructure, causing greater inequality due to the compiling of damage from multiple whiplash events [33].

5. Conclusions

The results of this research are consistent with previous work that have identified various Mediterranean regions in the world where weather whiplash in precipitation is persistent in future data. The work presented here focuses on the impacts on water, and has implications for management of resources. Comparative analyses of the durations, conditions, and frequencies of wet and dry periods offer insights into the similarities and disparities among these regions. The results underscore a historical trend wherein wet years were more prevalent until the 1980–2000s, after which dry periods increased in frequency and intensity. This research contributes to the evolving field of hydroclimatology in Mediterranean regions, emphasizing the critical role of understanding streamflow patterns in shaping future water supply dynamics. The implications of this study extend to water resources management, emphasizing the need for proactive measures to address the complex challenges posed by climate-induced hydrological variability in Mediterranean regions.

Author Contributions

Conceptualization, C.M., R.B., T.P., W.L. and H.E.-A.; Data curation, C.M., R.B., T.P., C.M. and G.T.; Formal analysis, C.M., R.B. and W.L.; Funding acquisition, H.E.-A. and T.P.; Investigation, C.M., R.B. and T.P.; Methodology, C.M., R.B., T.P. and W.L.; Project administration, T.P.; Resources, T.P. and H.E.-A.; Supervision, T.P.; Validation, C.M., R.B. and W.L.; Visualization, C.M. and R.B.; Writing—original draft, C.M., R.B. and T.P.; Writing—review and editing, C.M., R.B., T.P., W.L., G.T. and H.E.-A. All authors have read and agreed to the published version of the manuscript.

Funding

This research was funded by Department of Education Grant “Earth Systems Science and Data Solutions Lab Applying Data Science Techniques to Achieve the UN Sustainable Development Goals” (P116Z220190).

Data Availability Statement

Data for this study were accessed at the Global Runoff Data Centre’s (GRDC) data portal (Available online: https://portal.grdc.bafg.de/applications/public.html?publicuser=PublicUser, accessed on 10 October 2023), the U.S. Geological Survey (USGS) NWISWeb Data retrieval (Available online: https://waterdata.usgs.gov/nwis/, accessed on 1 February 2023), and the Australian Bureau of Meteorology Hydrologic Reference (HRS) catchments (Available online: http://www.bom.gov.au/water/hrs/, accessed on 25 September 2023). Additional data for stations in Italy were retrieved from previous studies [25,26].

Acknowledgments

We would like to thank Nejc Bezak at University of Ljubljana, and Martin Morlot and Giuseppe Formetta (University of Trento) for providing data for this study.

Conflicts of Interest

The authors declare no conflicts of interest.

References

  1. Chen, D.; Norris, J.; Thackeray, C.; Hall, A. Increasing Precipitation Whiplash in Climate Change Hotspots. Environ. Res. Lett. 2022, 17, 124011. [Google Scholar] [CrossRef]
  2. Swain, D.; Langenbrunner, B.; Neelin, J.; Hall, A. Increasing Precipitation Volatility in Twenty-First-Century California. Nat. Clim. Chang. 2018, 8, 427–433. [Google Scholar] [CrossRef]
  3. Spano, D.; Snyder, R.L.; Cesaraccio, C. Mediterranean Climates. In Phenology: An Integrative Environmental Science; Schwartz, M.D., Ed.; Tasks for Vegetation Science; Springer: Dordrecht, The Netherlands, 2003; pp. 139–156. ISBN 978-94-007-0632-3. [Google Scholar]
  4. Peel, M.; Finlayson, B.; Mcmahon, T. Updated World Map of the Koppen-Geiger Climate Classification. Hydrol. Earth Syst. Sci. Discuss. 2007, 11, 1633–1644. [Google Scholar] [CrossRef]
  5. Polade, S.D.; Gershunov, A.; Cayan, D.R.; Dettinger, M.D.; Pierce, D.W. Precipitation in a Warming World: Assessing Projected Hydro-Climate Changes in California and Other Mediterranean Climate Regions. Sci. Rep. 2017, 7, 10783. [Google Scholar] [CrossRef]
  6. De Luca, P.; Messori, G.; Faranda, D.; Ward, P.J.; Coumou, D. Compound Warm–Dry and Cold–Wet Events over the Mediterranean. Earth Syst. Dyn. 2020, 11, 793–805. [Google Scholar] [CrossRef]
  7. Polade, S.D.; Pierce, D.W.; Cayan, D.R.; Gershunov, A.; Dettinger, M.D. The Key Role of Dry Days in Changing Regional Climate and Precipitation Regimes. Sci. Rep. 2014, 4, 4364. [Google Scholar] [CrossRef]
  8. Giorgi, F.; Lionello, P. Climate Change Projections for the Mediterranean Region. Glob. Planet. Chang. 2008, 63, 90–104. [Google Scholar] [CrossRef]
  9. Mariotti, A.; Pan, Y.; Zeng, N.; Alessandri, A. Long-Term Climate Change in the Mediterranean Region in the Midst of Decadal Variability. Clim. Dyn. 2015, 44, 1437–1456. [Google Scholar] [CrossRef]
  10. Ficklin, D.L.; Null, S.E.; Abatzoglou, J.T.; Novick, K.A.; Myers, D.T. Hydrological Intensification Will Increase the Complexity of Water Resource Management. Earths Future 2022, 10, e2021EF002487. [Google Scholar] [CrossRef]
  11. Francis, J.A.; Skific, N.; Vavrus, S.J.; Cohen, J. Measuring “Weather Whiplash” Events in North America: A New Large-Scale Regime Approach. J. Geophys. Res. Atmos. 2022, 127, e2022JD036717. [Google Scholar] [CrossRef]
  12. Tomozeiu, R.; Lazzeri, M.; Cacciamani, C. Precipitation Fluctuations during the Winter Season from 1960 to 1995 over Emilia-Romagna, Italy. Theor. Appl. Climatol. 2002, 72, 221–229. [Google Scholar] [CrossRef]
  13. Bérubé, S.; Brissette, F.; Arsenault, R. Optimal Hydrological Model Calibration Strategy for Climate Change Impact Studies. J. Hydrol. Eng. 2022, 27, 04021053. [Google Scholar] [CrossRef]
  14. Rasmusson, E.M.; Arkin, P.A. Chapter 40 Interannual Climate Variability Associated with the El Niño/ Southern Oscillation. In Elsevier Oceanography Series; Nihoul, J.C.J., Ed.; Coupled Ocean-Atmosphere Models; Elsevier: Amsterdam, The Netherlands, 1985; Volume 40, pp. 697–725. [Google Scholar]
  15. Ropelewski, C.F.; Jones, P.D. An Extension of the Tahiti–Darwin Southern Oscillation Index. Mon. Weather Rev. 1987, 115, 2161–2165. [Google Scholar] [CrossRef]
  16. Rajagopalan, B.; Cook, E.; Lall, U.; Ray, B.K. Spatiotemporal Variability of ENSO and SST Teleconnections to Summer Drought over the United States during the Twentieth Century. J. Clim. 2000, 13, 4244–4255. [Google Scholar] [CrossRef]
  17. Chiew, F.H.S.; Piechota, T.C.; Dracup, J.A.; McMahon, T.A. El Nino/Southern Oscillation and Australian Rainfall, Streamflow and Drought: Links and Potential for Forecasting. J. Hydrol. 1998, 204, 138–149. [Google Scholar] [CrossRef]
  18. Lenssen, N.J.L.; Goddard, L.; Mason, S. Seasonal Forecast Skill of ENSO Teleconnection Maps. Weather Forecast. 2020, 35, 2387–2406. [Google Scholar] [CrossRef]
  19. Mason, S.; Goddard, L. Probabilistic Precipitation Anomalies Associated with ENSO. Bull. Am. Meteorol. Soc. 2001, 82, 619–638. [Google Scholar] [CrossRef]
  20. Müller-Plath, G.; Lüdecke, H.-J.; Lüning, S. Long-Distance Air Pressure Differences Correlate with European Rain. Sci. Rep. 2022, 12, 10191. [Google Scholar] [CrossRef] [PubMed]
  21. Lüdecke, H.-J.; Müller-Plath, G.; Wallace, M.G.; Lüning, S. Decadal and Multidecadal Natural Variability of African Rainfall. J. Hydrol. Reg. Stud. 2021, 34, 100795. [Google Scholar] [CrossRef]
  22. GRDC Data Portal. Available online: https://portal.grdc.bafg.de/applications/public.html?publicuser=PublicUser (accessed on 10 October 2023).
  23. USGS Water Data for the Nation. Available online: https://waterdata.usgs.gov/nwis (accessed on 1 February 2023).
  24. National Oceanic and Atmospheric Administration; National Weather Service; California Nevada River Forecast Center. Available online: https://www.cnrfc.noaa.gov/?product=espfcstWY&zoom=7&lat=40.506&lng=-121.896 (accessed on 1 April 2023).
  25. Morlot, M.; Rigon, R.; Formetta, G. Hydrological Digital Twin Model of a Large Anthropized Italian Alpine Catchment: The Adige River Basin. J. Hydrol. 2023, 629, 130587. [Google Scholar] [CrossRef]
  26. Formetta, G.; Antonello, A.; Franceschi, S.; David, O.; Rigon, R. Hydrological Modelling with Components: A GIS-Based Open-Source Framework. Environ. Model. Softw. 2014, 55, 190–200. [Google Scholar] [CrossRef]
  27. Formetta, G.; Rigon, R.; Chávez, J.L.; David, O. Modeling Shortwave Solar Radiation Using the JGrass-NewAge System. Geosci. Model Dev. 2013, 6, 915–928. [Google Scholar] [CrossRef]
  28. Tootle, G.; Oubeidillah, A.; Elliott, E.; Formetta, G.; Bezak, N. Streamflow Reconstructions Using Tree-Ring-Based Paleo Proxies for the Sava River Basin (Slovenia). Hydrology 2023, 10, 138. [Google Scholar] [CrossRef]
  29. Hydrologic Reference Stations. Water Information: Bureau of Meteorology. Available online: http://www.bom.gov.au/water/hrs/ (accessed on 25 September 2023).
  30. Amirthanathan, G.E.; Bari, M.A.; Woldemeskel, F.M.; Tuteja, N.K.; Feikema, P.M. Regional Significance of Historical Trends and Step Changes in Australian Streamflow. Hydrol. Earth Syst. Sci. 2023, 27, 229–254. [Google Scholar] [CrossRef]
  31. Climate Prediction Center Internet Team. NOAA’s Climate Prediction Center. Available online: https://origin.cpc.ncep.noaa.gov/products/analysis_monitoring/ensostuff/ONI_v5.php (accessed on 1 October 2023).
  32. Ropelewski, C.F.; Halpert, M.S. Global and Regional Scale Precipitation Patterns Associated with the El Niño/Southern Oscillation. Mon. Weather Rev. 1987, 115, 1606–1626. [Google Scholar] [CrossRef]
  33. Zhang, B.; Wang, S.; Zscheischler, J.; Moradkhani, H. Higher Exposure of Poorer People to Emerging Weather Whiplash in a Warmer World. Geophys. Res. Lett. 2023, 50, e2023GL105640. [Google Scholar] [CrossRef]
Figure 1. Map of global Mediterranean regions studied and associated streamflow stations. The different colors represent the different regions evaluated in this study.
Water 16 00450 g001
Figure 2. Boxplot of the duration in years of (a) wet period length and (b) dry period length averaged by region. The X in the boxplot represents the mean.
Water 16 00450 g002
Figure 3. Boxplot of indicator ratio values averaged by region. The ratio is an indicator of the accumulated deficit or surplus to the long-term mean. Indicator values that shift from negative to positive or positive to negative in two consecutive years reflect whiplash years.
Water 16 00450 g003
Figure 4. Boxplot of the proportion of years that experienced whiplash averaged by region. For each station, whiplash years are identified, being the years that change from wet to dry or dry to wet. The count of whiplash years is divided by the total years in the record, being the proportion.
Water 16 00450 g004
Figure 5. Time series of anomaly (blue and red) and ratio (black) values. Blue areas represent surplus periods and red areas represent deficit periods. One station’s plot that is representative of all four stations in the area is chosen per region: (a) Merced River in California, USA (US2); (b) Sava River in Slovenia (IT2); (c) Donnelly River in Australia (AU2); (d) Biobio River in Chile (CH3); (e) Kleinrivier in South Africa (SA3).
Water 16 00450 g005
Table 1. List of streamflow stations with characteristics for all locations shown in Figure 1.
Station NameIDLocationYear MeasuredStart YearEnd YearLatitudeLongitudeUnits
Sacramento Delta at Sacramento RiverUS1 aCalifornia, USAWater Year1951202340.94−122.42KAF
Happy Isles Bridge near Yosemite at Merced RiverUS2 aCalifornia, USAWater Year1951202337.73−119.56KAF
Mill Creek Near Los Molinos at Mill RiverUS3 aCalifornia, USAWater Year1951202340.05−122.02KAF
Deer Creek Near Vina at Deer RiverUS4 aCalifornia, USAWater Year1951202340.01−121.95KAF
Spondigna at Adige RiverIT1 bItalyCalendar Year1980201846.6310.60mm
Sava Near Catez at Sava RiverIT2 bSloveniaCalendar Year1926202045.8915.60MCM
Montecastello at Fiume Tanaro RiverIT3 cItalyCalendar Year1936200844.948.68m3/s
Farigliano at Fiume Tanaro RiverIT4 cItalyCalendar Year1942200844.517.90m3/s
Yarragil Brook, Yarragil Formation at Murray RiverAU1 dAustraliaCalendar Year19522022−32.80116.12ML
Donnelly Near Strickland at Donnelly RiverAU2 dAustraliaCalendar Year19522022−34.33115.77ML
Big Brook Near O’Neil Rd ay Murray RiverAU3 dAustraliaCalendar Year19832022−32.53116.04ML
Wungong Brook near Vardi Rd at Swan RiverAU4 dAustraliaCalendar Year19812022−32.1015.98ML
Chacabuquito at Aconcagua RiverCH1 cChileCalendar Year19562019−32.85−70.51m3/s
Algarrobal at Elqui RiverCH2 cChileCalendar Year19802019−29.99−70.58m3/s
Desembocadura at Biobio RiverCH3 cChileCalendar Year19692019−36.83−73.07m3/s
San Lorezo at Diguillin RiverCH4 cChileCalendar Year19602019−36.92−71.57m3/s
Dassjes Klip at DuiwenhoksrivierSA1 cSouth
Africa
Calendar Year19682022−34.2520.99m3/s
Grootrivierspoort at GrootrivierSA2 cSouth
Africa
Calendar Year19652022−33.7124.61m3/s
Hagedisberg Outspan at KleinrivierSA3 cSouth
Africa
Calendar year19642021−34.4019.59m3/s
Melkboom at DoringrivierSA4 cSouth
Africa
Calendar Year19282022−31.8618.68m3/s
Notes: a Data obtained from the United States Geological Survey. b Data obtained from [18]. c Data obtained from Global Runoff Data Center. d Data obtained from Hydrologic Reference Stations.
Table 2. Frequency of wet and dry periods per station represented by the count of wet and dry years and percentage compared to the total number of years. Values in parentheses are results of analysis using a common period of record (1983–2018). N/A represents analysis that was not available for these stations. * are stations where the common period of record has unequal number of wet and dry years.
Station IDTotal Wet YearsPercentageTotal Dry YearsPercentage
US1 *36 (13)49% (36%)37 (23)51% (64%)
US2 *32 (14)44% (39%) 41 (22) 56% (61%)
US3 *34 (14)47% (39%) 39 (22)53% (61%)
US4 *35 (14) 48% (39%) 38 (22)52% (61%)
IT119 (18) 49% (50%) 20 (18) 51% (50%)
IT2 *35 (5) 37% (14%) 60 (31) 63% (86%)
IT331(N/A)43% (N/A)42 (N/A)58% (N/A)
IT433 (N/A)50% (N/A)33 (N/A)50% (N/A)
AU1 *20 (3)29% (8%) 49 (33) 71% (92%)
AU2 *31 (10) 45% (28%) 38 (26) 55% (72%)
AU3 *14 (13) 37% (36%) 24 (23) 63% (64%)
AU418 (18) 47% (50%) 20 (18) 53% (50%)
CH133 (19) 52% (53%) 31 (17) 48% (47%)
CH215 (15) 38% (42%) 25 (21) 63% (58%)
CH325 (19) 49% (50%) 26 (18) 51% (50%)
CH431 (18) 52% (50%) 29 (18) 48% (50%)
SA125 (19) 45% (53%) 30 (17) 55% (47%)
SA2 *14 (8) 24% (22%) 44 (28) 76% (36%)
SA3 *31 (23) 53% (64%) 27 (13) 47% (36%)
SA438 (17) 40% (47%) 57 (19) 60% (53%)
Table 3. F-test results comparing each pair of regions with wet period length, dry period length, and indicator ratio. Statistically significant values (at 1% and 5% level) are indicated as regions that are similar in terms of wet and dry periods.
RegionUS-ITUS-AUUS-CHUS-SAIT-AUIT-CHIT-SAAU-CHAU-SACH-SA
Wet Period Length<0.01<0.01<0.01<0.05 <0.01
Dry Period Length <0.01<0.01<0.01<0.05<0.01 <0.01<0.01
Indicator Ratio<0.01<0.01 <0.01<0.01<0.01<0.01<0.01<0.05<0.01
Table 4. Correlation coefficients between streamflow and the respective ONI value for each station. Values that are statistically significant at a 10% level (p < 0.1) are designated with a * symbol. Values that are significant at the 5% level (p < 0.05) are highlighted in grey. Four ONI values were used to represent the year in three-month-long periods (JFM, AMJ, JAS, OND).
Station IDFlow and JFMFlow and AMJFlow and JASFlow and OND
US10.20 *0.17−0.11−0.14
US20.150.19−0.05−0.07
US30.110.14−0.04−0.05
US40.100.15−0.04−0.05
IT1−0.060.050.050.07
IT20.030.120.130.17
IT3−0.120.010.160.21
IT4−0.040.100.140.15
AU1−0.05−0.18−0.13−0.18
AU2−0.06−0.18−0.14−0.18
AU3−0.12−0.15−0.18−0.16
AU40.090.03−0.05−0.10
CH10.260.200.170.07
CH20.310.140.03−0.10
CH3−0.130.27 *0.460.46
CH4−0.120.200.270.30
SA1−0.26 *−0.190.030.06
SA2−0.34−0.33−0.14−0.17
SA3−0.150.000.070.06
SA4−0.15−0.060.020.00
Disclaimer/Publisher’s Note: The statements, opinions and data contained in all publications are solely those of the individual author(s) and contributor(s) and not of MDPI and/or the editor(s). MDPI and/or the editor(s) disclaim responsibility for any injury to people or property resulting from any ideas, methods, instructions or products referred to in the content.

