Abstract
Surface waters, particularly rivers, are paramount in serving as the primary global water source and a pivotal economic driver. Various pollution sources can negatively impact water quality. The Water Framework Directive has established regulations that define specific chemical and ecological statuses for rivers. Consequently, there is an ongoing commitment to monitor their quality closely. This study involved the collection of samples from two watersheds (Laspias and Lissos) within the Eastern Macedonia and Thrace Region. The two rivers flow along regions characterized by notable environmental stressors, including WWTP, landfills, industrial zones, and agricultural areas, which also constitute substantial contributors to the local economy. This study’s outcomes, covering from springs to coast, are presented and analyzed using various indices, including the Canadian Council of Ministers of the Environment Water Quality Index (CCME-WQI), discriminate analysis, and the trophic status index (TRIX). Water quality assessment included the measurement of physicochemical parameters, common pollutants, and major ions. The analysis revealed “bad” water quality status along most of the Laspias and in specific sectors of the Lissos, with parameters exceeding the thresholds set by legislation. The rivers demonstrated significant organic and nutrient pollution. Given that water quality in these rivers is significantly influenced by urban, agricultural, and industrial runoff, the imperative need for change necessitates interventions to improve water quality. Observations and measurements are fundamental prerequisites for raising awareness among citizens and stakeholders and for finding effective management measures for the two river basins.
1. Introduction
Surface water is the main freshwater resource of the world [1] and is a requirement for the welfare of all forms of life and an essential condition of ecological diversity and sustainable development [2,3]. Rivers, as the primary source of freshwater, render an irreplaceable service for human survival and social development. Nowadays, river quality deterioration has raised significant concerns from governments and the public due to the increasing urbanization and rapid growth of the economy [4,5]. Studies have shown that river water quality is mainly affected by the excessive discharge of agricultural drainage [6], as well as from industrial and urban outfalls [1,7]. As a result, environmental protection is rising as an important issue in public policy throughout the word, and the developing countries face a serious threat associated with the lack of appropriate integrated management of aquatic ecosystems and the challenges posed by climate change [8].
Within the European Union (EU), the Water Framework Directive (WFD) 2000/60/EC [9] has been the major legislative driver that regulates the protection and the achievement of good ecological status in streams and rivers [10]. Hence, the WFD and the relevant national legislation impose the continuous monitoring of water bodies to detect pollution violations and deter the spread of associated hazards in inland, transitional, and coastal waters, as well as in groundwater [11]. In addition, the Marine Strategy Framework Directive requires all EU member states to maintain the ecological status of coastal waters at acceptable levels and to take all appropriate measures to prevent and limit marine pollution. Monitoring the quality in both river and coastal waters constitutes a crucial aspect for evaluating their quality status over the watershed. This is particularly important due to the potential pollution of the sea from river discharges, which may result in the contamination of benthic habitats, fish, and mollusks [12].
The imperative for monitoring river quality remains at the core of responsible environmental stewardship and sustainable water resource management [13]. Regular observations and measurements serve as indispensable tools in assessing the health and integrity of river ecosystems. Monitoring allows for the early detection of any adverse changes in water quality, enabling swift responses to potential threats [14]. It plays a crucial role in preservation of the well-being of both aquatic ecosystems and the communities that depend on these water sources. Furthermore, the data obtained from monitoring strategies form the basis for informed decision making, facilitating the development and implementation of effective strategies to address and mitigate environmental challenges [10]. In essence, the necessity of monitoring river quality is paramount in ensuring the long-term viability and resilience of our water systems. Important factors in developing sustainable watershed management policies are understanding the variation in river water quality and identifying the contamination sources through collecting reliable data on watersheds [3,15]. To address the plurality of datasets from long-term monitoring and to easily communicate significant findings, data analyses can be of assistance since they are able to collate, summarize, and explain relevant information. Data analyses, including mathematical models and multivariate statistical analyses, are capable tools to interpret environmental data [16,17]. In recent years, several water quality indices (WQIs) have been used, aiming to combine water quality datasets and produce an integrated, cumulatively derived value for the level of water quality. The water quality index (WQI) and the Canadian Council of Ministers of the Environment Water Quality Index (CCME-WQI) are in widespread use for water quality evaluation, and they have received excellent assessments due to several advantages [18,19]. The CCME-WQI was selected for its ability to incorporate the highest possible number of parameters [10]. Many studies assess water quality by discriminate analysis (DA), which divides a database into the best possible groups [20,21,22]. In addition, in order to assess the quality of coastal water, reference thresholds should be used [23]. The ecological status of coastal waters is usually assessed using the trophic status index (TRIX) [24]. Consequently, all indices that preceded can play a significant role in the management of water resources for decision makers.
In the framework of the research program “Eye4water”, a series of comprehensive monitoring campaigns were carried out covering two small catchments in northern Greece (Thrace District). The project was designed as a “springs to coast eye”, focusing on assessing the water quality, identifying the sources of pollution and their impacts, and leading towards integrated water management. The decision to monitor these watersheds was based on the lack of systematic data, despite the fact that they receive runoff from various pollution sources. This work presents collected data from the two river basins derived from a two-year monitoring program. In order to provide a more precise evaluation of water quality in these rivers, the dataset was analyzed using thresholds defined by legislation and statistical models. The Water Framework Directive classification scheme was employed, followed by the Canadian Council of Ministers of the Environment Water Quality Index (CCME-WQI) and the trophic status index (TRIX) for the evaluation of coastal water quality. The findings of this study constitute fundamental prerequisites for raising awareness among citizens and stakeholders and for implementing effective governance and management practices. Given that these two watersheds have a significant ecological and economical footprint (agriculture), there is an imperative need to control environmental pollution to preserve public health (following the farm-to-fork approach) and biodiversity.
2. Materials and Methods
2.1. Study Area Description
The Laspias River basin is located in the Prefecture of Xanthi (24°53′ E; 40°59′ N), covering an area of 212 km2, with the main river course being 30 km long (Figure 1a). This river basin is characterized in the River Basin Management Plan as a heavily modified water body (HMWB) (GR1207R0005010051H, GR1207R0005010050H) [25], owing to morphological alterations it has undergone during its passage through purely agricultural areas and the pressures arising from agricultural activities. The Laspias River constitutes an integral part of a local irrigation network due to the lack of an organized irrigation system in the region [25]. Also, it discharges in an area protected by the Ramsar Convention on Wetlands of International Importance, while the river’s lowlands are included in the NATURA 2000 network (GR1150001, GR1150014). The Laspias River is also situated near the wastewater treatment plant (WWTP) of the city of Xanthi, the solid waste landfill of the prefecture, and several livestock units. It should be noted that the wastewater from local industries is directed to the WWTP for treatment. Significant farming activities are also evident in the area, predominantly characterized by pig livestock units. Ιt is noteworthy that an average local pig farm may generate a pollutant load of 119 tn BOD/year, 57.5 tn TN/year, and 16.7 tn TP/year. Lastly, the primary nonpoint source of pollution in the watershed is agricultural runoff, given that a significant portion of Xanthi’s plain is used for agriculture. The Laspias watershed has approximately 122 km2 of cultivated land, and it receives an annual inflow of approximately 1358 tn of total nitrogen (TN) and 239 tn of total phosphorus (TP) [26].
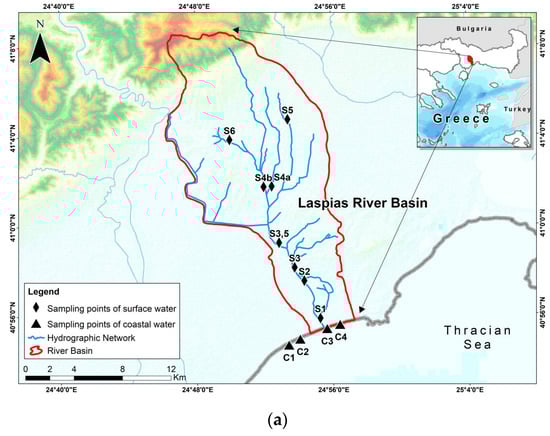
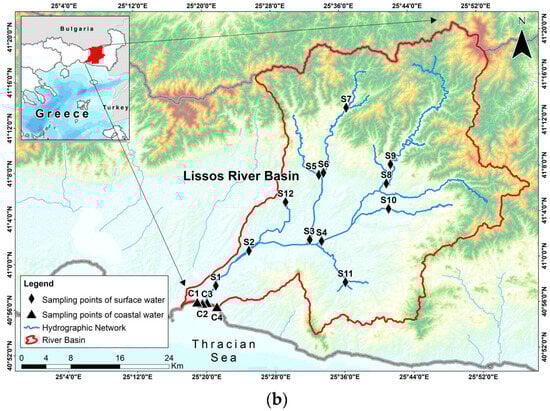
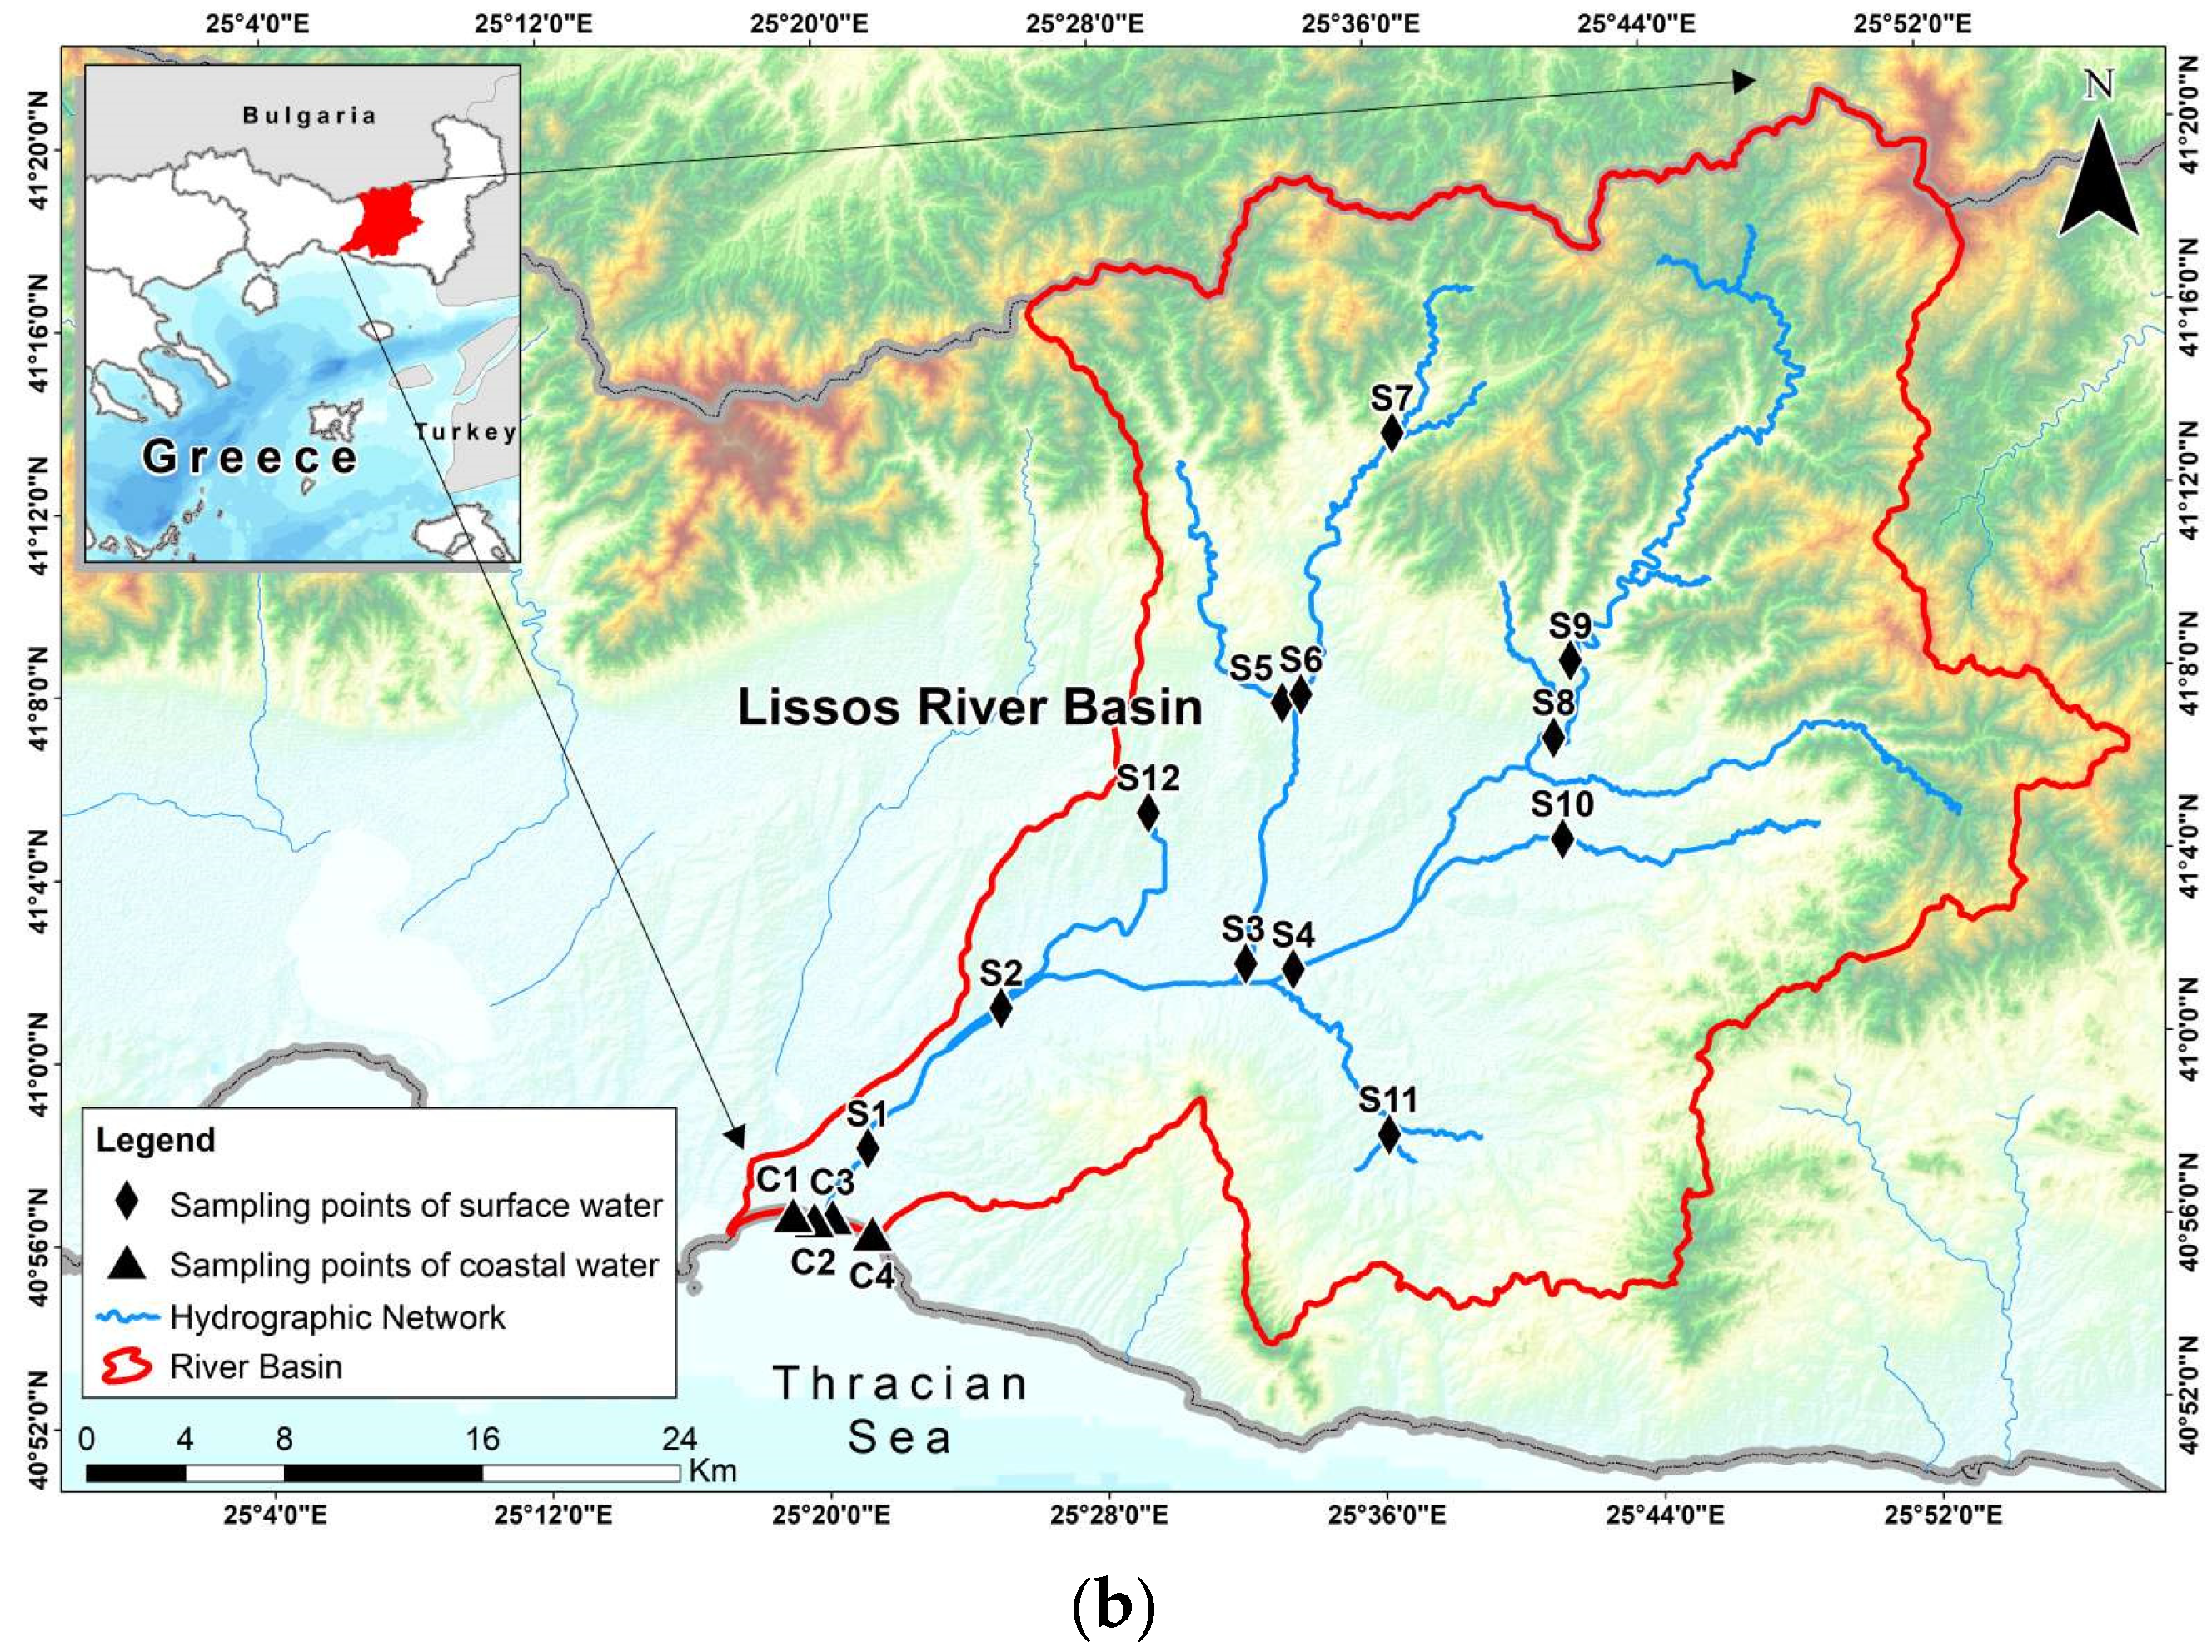
Figure 1.
Sampling stations in (a) Laspias and (b) Lissos river basins.
The Lissos River watershed is located in the Prefecture of Rhodope (25° 31′ E; 41° 01′ N), covering an area of 1486 km2, with a length of 45 km (Figure 1b). Parts of the Lissos are characterized as an HMWB (GR1209R00020000102H, GR1209R0002000091H, GR1209R0002030093H, GR1209R0002030095H, GR1209R0002030094H), while its estuary is protected by the Ramsar Convention. The Lissos River has been subjected to modifications, including channelization, embankment construction, and realignment, as a result of flood control and drainage works [25]. The Lissos watershed is near the WWTP of the Komotini industrial area, where the treated effluent discharges into water flow, while water quality is influenced by agricultural activities [27]. A characteristic example of an industrial entity in this region is the thermal power plant operated by the Public Power Corporation (DEI) [25]. Both rivers outflow to the coastal zone of the Thracian Sea, a marine area with important benthic habitats (mostly Posidonia oceanica) and pelagic fish stocks.
2.2. Sampling Strategy in River and Coastal Zones
The integrated water quality monitoring campaigns were conducted in both watersheds for the period from June 2021 to January 2023. A sampling network of 26 stations was configured to monitor the ecological status of each watershed, consisting of 7 stations along the Laspias River (Figure 1a) and 12 stations along the main route of the Lissos River and its tributaries (Figure 1b). Moreover, 8 stations were positioned along the coastal zone, in the vicinity of both river mouths (4 for Laspias and 4 for Lissos). The choice of monitoring station locations was based upon significant pollution sources (Table 1). Sampling campaigns took place every three months to incorporate the seasonal variability (wet and dry season); consequently, 133 surface water samples were collected during 7 sampling campaigns (49 and 84 for Laspias and Lissos, respectively). Not all sites were sampled in all seasons, due to drought or inability to sample. The monitoring campaigns featured in situ measured parameters, such as dissolved oxygen, electrical conductivity, salinity, temperature, and pH, measured directly in the stream water using a multiparametric probe (EcoSense EC300A, EcoSense ODO200, and EcoSense pH100A). Furthermore, water samples were collected in sterile bottles and analyzed according to the standard methods of the APHA [28], for the following parameters: biochemical oxygen demand (BOD5), chemical oxygen demand (COD), total nitrogen (TN), total suspended solids (TSSs), and chlorophyll-a (Chl-a).

Table 1.
Sampling stations for each river basin.
In order to evaluate the concentrations of Chl-a, the OECD’s classification for trophic status [29] was adopted based on the measured abiotic parameters. Also, the concentration of a range of cations and anions (Li+, Na+, NH4+-N, K+, Mg2+, Ca2+, F−, Cl−, NO2−-N, NO3−-N, Br−, PO43−-P, and SO42−, in mg/L) was analyzed using ion chromatography (IC) (Dionex 6000). Surface water samples from the coastal zone were analyzed for the following parameters: BOD5, Chl-a, TSSs, and TN. In addition, seawater nutrients (NH4+-N, NO2−-N, NO3−N, and PO43−-P, mg/L) were measured with ion chromatography (IC) Dionex 6000.
2.3. Surface Water Quality Assessment
2.3.1. Assessment Based on the WFD
Table 2 illustrates the nutrients classification scheme followed in the current study [9]. Specifically, the parameters NO3−-N, NO2−-N, NH4+-N, PO43−-P, and DO fall under five categories, ranging from high to bad quality [30,31], while pH, BOD5, and TSSs fall within fewer categories, i.e., good and moderate [11,32].
Table 2.
The trophic conditions classification scheme adopted in the current study [9].
To classify the nutrients’ status at each station according to Table 2, and consequently the water quality of each river, the mean concentration for each parameter was calculated for the whole monitoring period (June 2021–January 2023).
2.3.2. Assessment Based on the CCME-WQI
To assess river quality and overcome difficulties from comparisons among various studies, a water quality index (WQI) has been introduced [16]. In this study, the river quality was also assessed based on the Canadian Council of Ministers of the Environment Water Quality Index (CCME-WQI) [33]. To perform this methodology, a matrix of at least four samples and at least four parameters is required [16]. Since our campaign included seasonal samplings at 7 and 12 sampling stations of the Laspias and Lissos rivers, respectively, this methodology could be applied with certainty. Equation (1) shows the formula of the CCME-WQI.
where F1 is a factor that deals with the scope and refers to the ‘failed variables’ (percentage of variables that do not meet the objectives), F2 is a factor that deals with the frequency and refers to the ‘failed tests’ (amount by which individual tests do not meet the objectives), and F3 is a factor that deals with the amplitude of deviation by which failed test values do not meet the objectives. The above equation ranges between 0 and 100. Therefore, the water quality falls under 4 categories according to the CCME-WQI score: 0–44 poor; 45–64 marginal; 65–79 fair; 80–94 good; and 95–100 excellent. The calculation of the CCME-WQ index was calculated using Equation (1), while interpretation of results was based on two legislations, the Directive 2006/44/EC and the Directive 91/271/EEC. The use of both indices is necessary as the Laspias River is characterized as a natural water body by river basin management plans, but it has also been identified as a treated-wastewater-receiving water body.
CCME − WQI = 100 − ((F12 + F22 + F32)1/2/1.732),
2.4. Coastal Water Quality Assessment
It is essential to assess if the coastal waters near the Laspias and Lissos are of good quality. Therefore, to distinguish acceptable and nonacceptable environmental conditions, threshold values for key parameters should be applied [11]. To assess the eutrophication status in the selected coastal areas, several indicators and indices were applied: (a) Chl-a biomass classification scheme [34] and (b) trophic status index (TRIX) [24,35].
Chlorophyll-a represents an important ecological quality parameter for the coastal environment [36]. Therefore, the assessment of the coastal water quality in the Laspias and Lissos area was based upon the ecological quality scale for eastern Mediterranean waters proposed first by Karydis [37] and further developed by Simboura et al. [34] (Table 3).
Table 3.
Indices used for the eutrophication assessment in the examined coastal zones.
In addition, TRIX is an index that is often used in Greek seas for the assessment of eutrophication status by researchers [24,35].
TRIX is defined by Equation (2), where CDIN is the concentration of dissolved inorganic nitrogen (CNO2 + CNO3 + CNH4), CPO4 is the concentration of phosphates, CNO3 is the concentration of nitrates, CNO2 is the concentration of nitrites, CNH4 is the concentration of ammonium, CChl-a is the concentration of chlorophyll-a, and D%O2 is the % deviation of the dissolved oxygen concentration from saturation conditions. The water quality status can be classified from high to bad, where <1.6 corresponds to high, 1.6–2.8 to good, 2.8–4.0 to moderate, 4.0–5.3 to poor, and >5.3 to bad quality status.
TRIX = (log10 (CPO4 × CDIN × CChl-a × D%O2) + 15)/1.2,
All the above indices and their classification assessment schemes are summarized in Table 3.
Establishing Reference Conditions
It is necessary to establish reference condition standards (thresholds) to assess the physicochemical quality of coastal water [23]. Reference conditions describe the nutrients’ status corresponding to undisturbed conditions, with minor or even no human impact (according to the WFD, 2000/60/EC [9]). This is difficult to accomplish since there is a lack of areas unimpacted and undisturbed by human activities. This is the case also in the studied areas since they receive many pressures from the inland surface water (Laspias and Lissos rivers) and frequent continental runoff. Moreover, little or no historical data are available to be used as “virtual” reference locations. According to Borja et al. [38] and Bald et al. [23], to estimate the concentration of several parameters (DO, NH4+, NO3−, and PO43−), a dilution pattern based on salinity was followed (Table 4). Based on the dilution pattern for each parameter and the reference types published by Borja et al. [38] and Bald et al. [23], the values of key physicochemical parameters were estimated based on salinity (Table 4).
Table 4.
Key physicochemical parameters based on salinity.
2.5. Statistical Analyses
In the present study, stepwise discriminant analysis (DA) was performed to identify a function of the physicochemical parameters and nutrients (observed data) that best separates dry and wet periods (groups). The DA is a multivariate statistical method that splits two or more groups of observations based on X measured variables [39]. The DA method includes the contributions of each variable to the separated groups. Moreover, it finds multiple linear combinations of the chosen variables and it is expressed as follows:
where Z is the discriminant score, a is the constant, b is the discriminant coefficient, and Xn are the independent variables. The dry and wet periods were the grouping (dependent) variables, whereas all the measured parameters constituted the independent variables. The independent variables were divided into two categories as follows [39]:
Z = α + b1X1 + b2×2 + bnXn,
- Category 1: Parameters associated with pollution (pH, EC, DO, TDS, TSSs, CODtot, BOD5, Chl-a, NO2-N, NO3-N, PO4-P, NH4-N, TN).
- Category 2: Parameters naturally observed in surface waters (Li+, Na+, K+, Mg2+, Ca2+, F−, Br−, Cl−, SO42−).
Prior to the analysis, all parameters were log-transformed [log(x + 1)]. The SPSS software 27.0.1 [40] was used to perform the above analysis.
To evaluate the relationships between the physicochemical parameters and nutrients, Spearman’s rank correlation analysis was applied to omit intercorrelated parameters (rs > 0.8). Then, principal component analysis (PCA) was performed to investigate environmental gradients and identify the parameters that most explain the variability among samplings. Correlation analysis was conducted with the “corrplot” package [41] and PCA with Primer v6 software [42].
Additionally, cluster analysis [43] was applied to the physicochemical parameters and nutrients to identify possible spatial patterns. The Euclidean distance similarity index was used for the extraction of the resemblance [43]. Then, similarity percentage analysis (SIMPER) was applied to determine which parameters and nutrients contributed most to the observed similarities and dissimilarities between groups, with a cut-off limit of 90% [44]. All the above statistical analyses were performed using Primer v6 software [42].
3. Results
3.1. River Water Quality Status
The results for the physicochemical parameters and nutrients determined in the water samples obtained from each sampling station along the Laspias and Lissos rivers are presented in Tables S1 and S2, respectively.
3.1.1. Laspias River
The Laspias River demonstrated the highest temperature value at station 5 located near the WWTP (Figure 1a), while the lowest was determined at higher altitude stations. In terms of DO and EC, the Laspias River demonstrated a “moderate” to “bad” water quality status (Table S1), with high values often exceeding the threshold values. Specifically, station 4A demonstrated the lowest DO mean concentration (1.97 mg/L—bad) and EC mean concentrations varied from 670.54 (station 3) to 1309.23 μS/cm (station 4A).
Lab analyses included organic matter (BOD5 and COD), solids (TSSs), and nutrients, including nitrites (NO2−-N), nitrates (NO3−-N), phosphates (PO43−-P), ammonium (NH4+-N), total nitrogen (TN), and chlorophyll-a determinations. The Laspias River demonstrated significantly high concentrations in both BOD5 and COD, recording values even up to 200 mg/L and 1350 mg/L, respectively. Regarding BOD5, values at all monitoring stations, except for station 3, exceeded the limit set by the EU for fisheries and aquatic life (3–6 mg/L, Table S1 [45]), but only stations 4A and 5 exceeded the limit set by the EU requirements for discharges from urban wastewater treatment plants (25 mg/L, [46]). Especially, at stations 4A and 5, BOD5 concentrations reached 58.00 and 200.00 mg/L (Table S1), respectively. The same patterns were observed for COD concentrations, which exceeded in some cases even the limit set by the EU (125 mg/L, [46]), and station 5 recorded the highest mean value, reaching 341.06 mg/L (Table S1). TSSs exceeded the threshold value of 35 mg/L [46] at stations 4A and 5. As reported in Section 2.2, the OECD’s classification to evaluate the trophic status of the Laspias River was used. The methodology was designed for the monitoring of stagnant waters, such as lakes and dams. Although the Laspias is a running water system, its values exceeded the eutrophic level at some parts. Specifically, the system exhibited eutrophic (stations 2, 3, 4a, and 6) and hypertrophic levels (stations 1, 4b, and 5).
River water quality was mainly in the classes “poor” and “bad” regarding nutrient concentrations (Table 2 and Table S1). It is clear that nutrient concentrations were steadily high in the Laspias River. Mean NH4+-Ν concentrations ranged from 5.76 (station 2) to 30.78 mg/L (station 4A), while TN concentrations ranged from 8.28 (station 2) to 33.12 mg/L (station 4A). The NH4+-N limit set by the EU for fisheries and aquatic life is 40–1000 μg/L [45], while Chapman [47] set a threshold of 100 μg/L for NH4+-N for freshwater. However, mean NH4+-N concentrations at all stations were significantly above the threshold set by Chapman [46] and the upper limit set by the EU for fisheries and aquatic life, reaching values even up to 30 mg/L (Table S1). Moreover, mean TN values exceeded the permissible limit of 15 mg/L [46] at all monitoring stations. These relatively high values may have originated either from natural or human activities, such as overfertilization, the application of river water to wash tanks used for spraying agrochemicals, agriculture runoff, etc. [3,10].
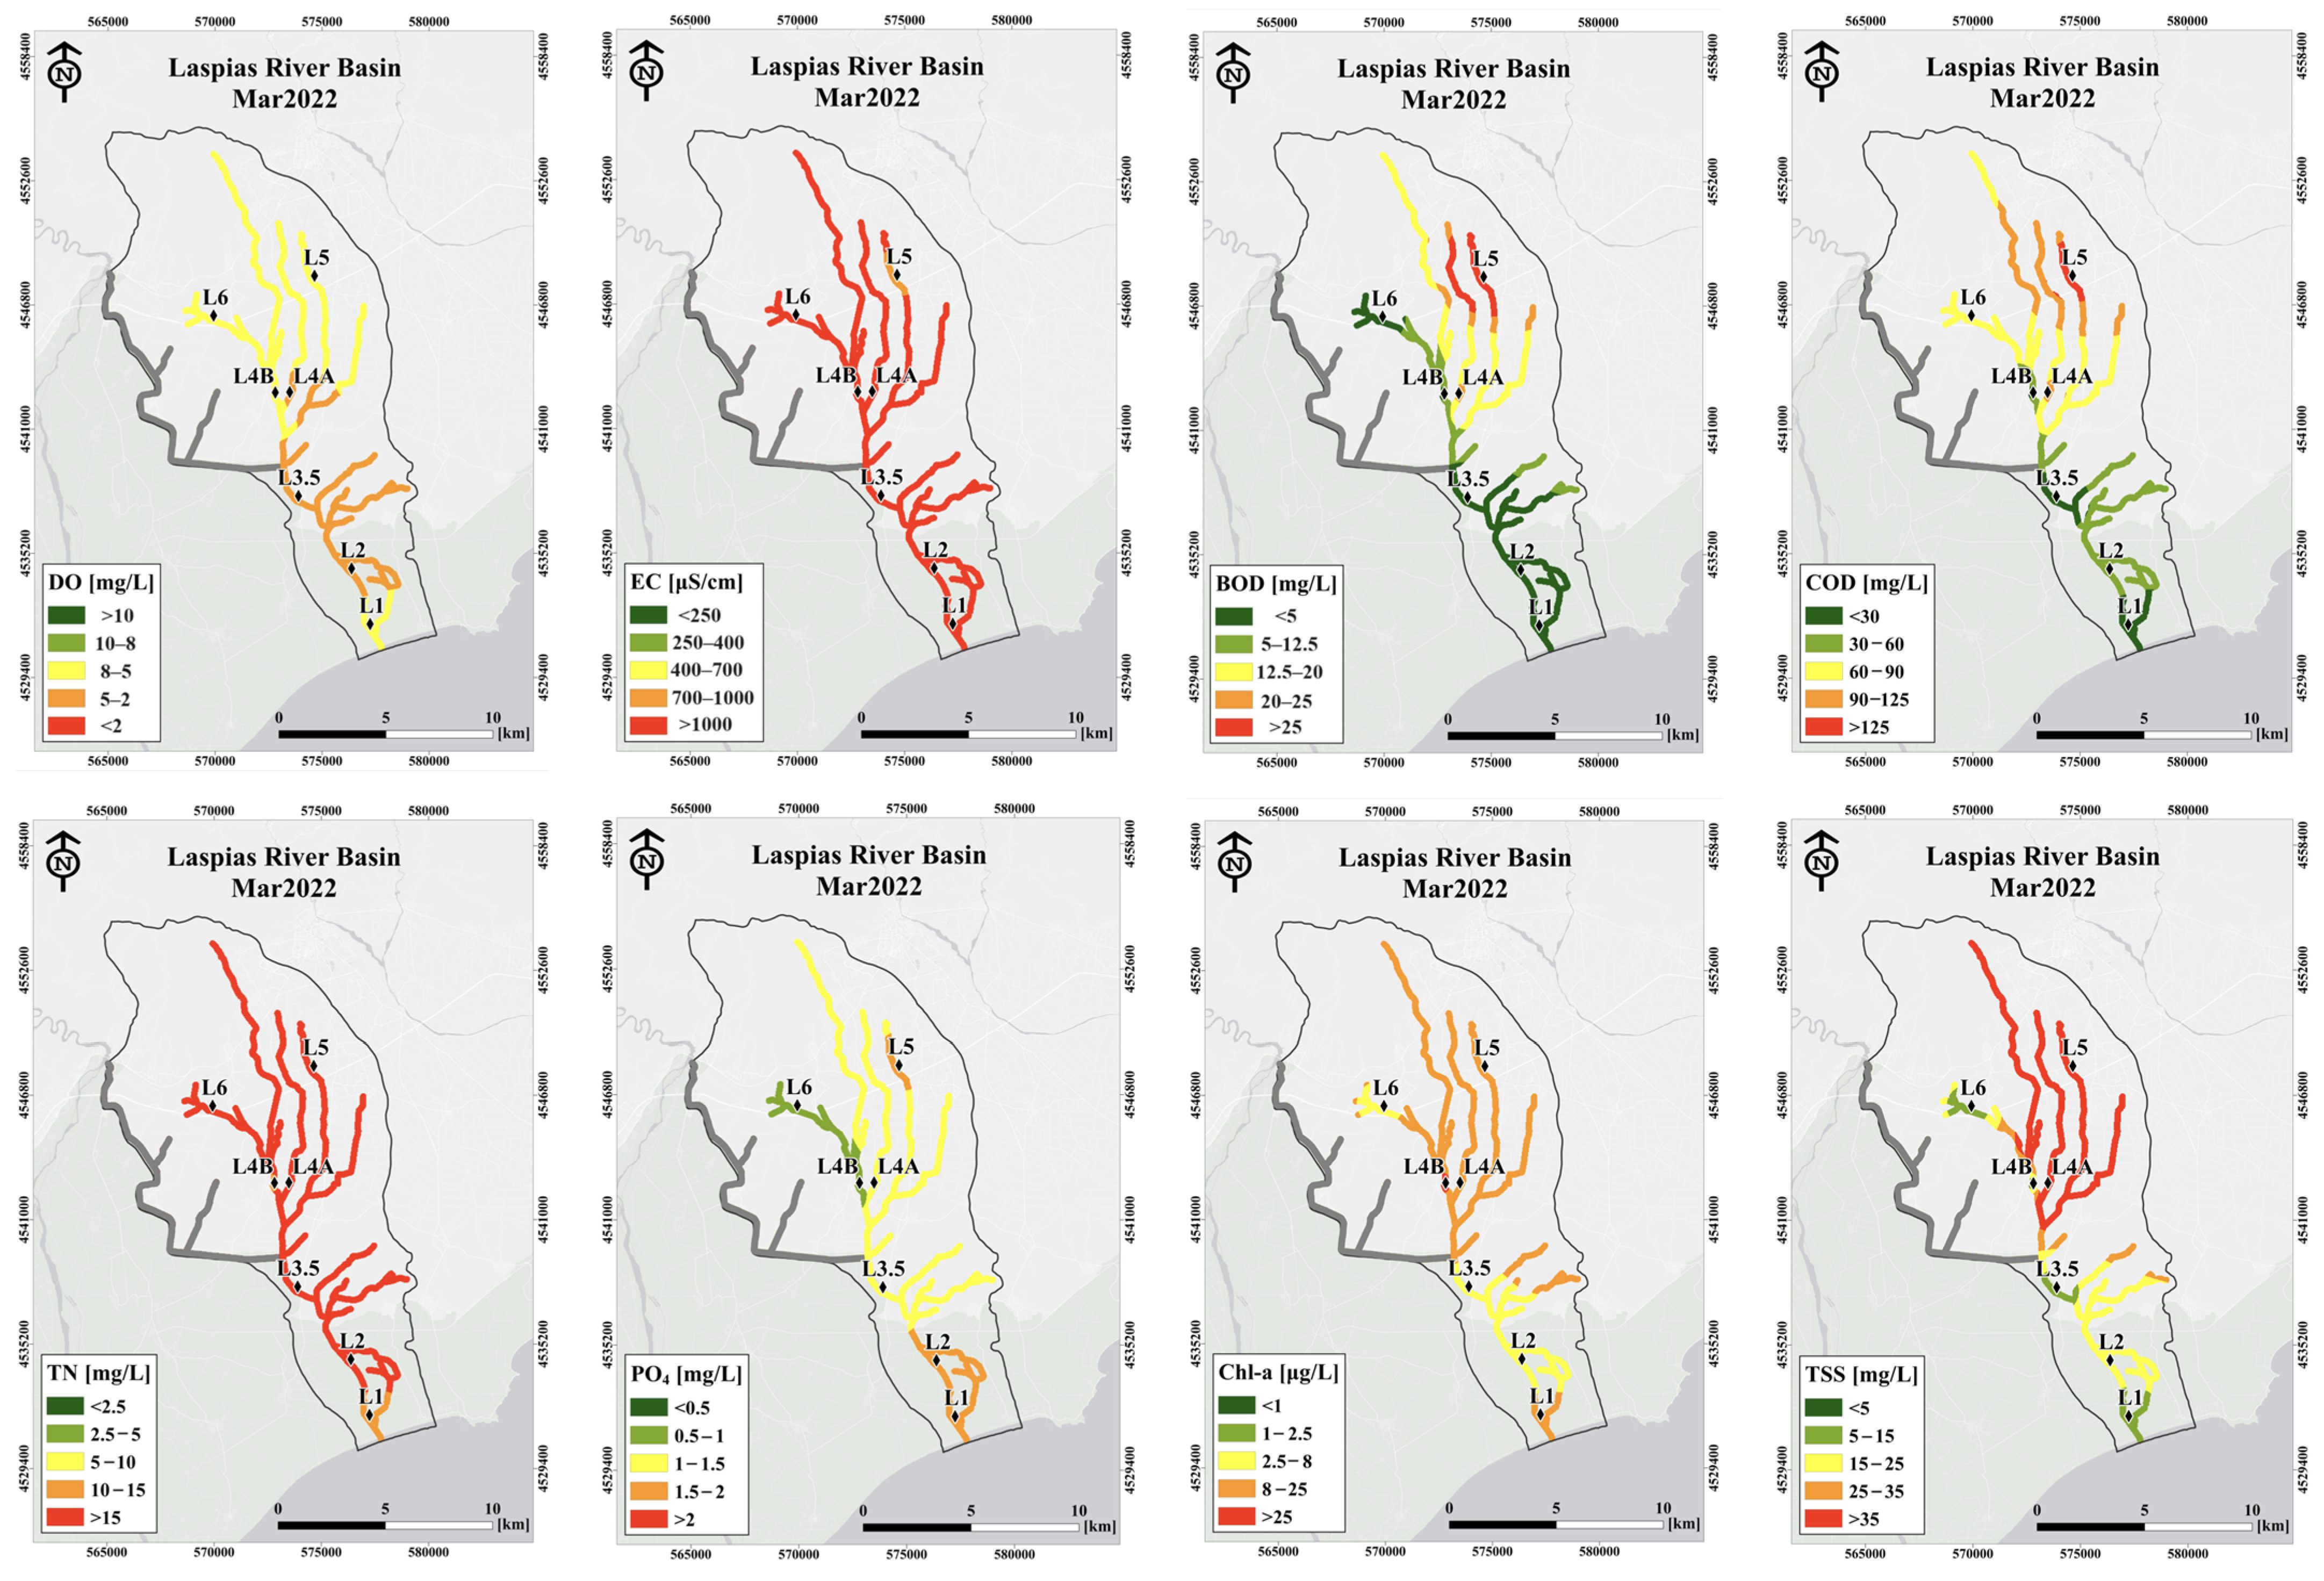
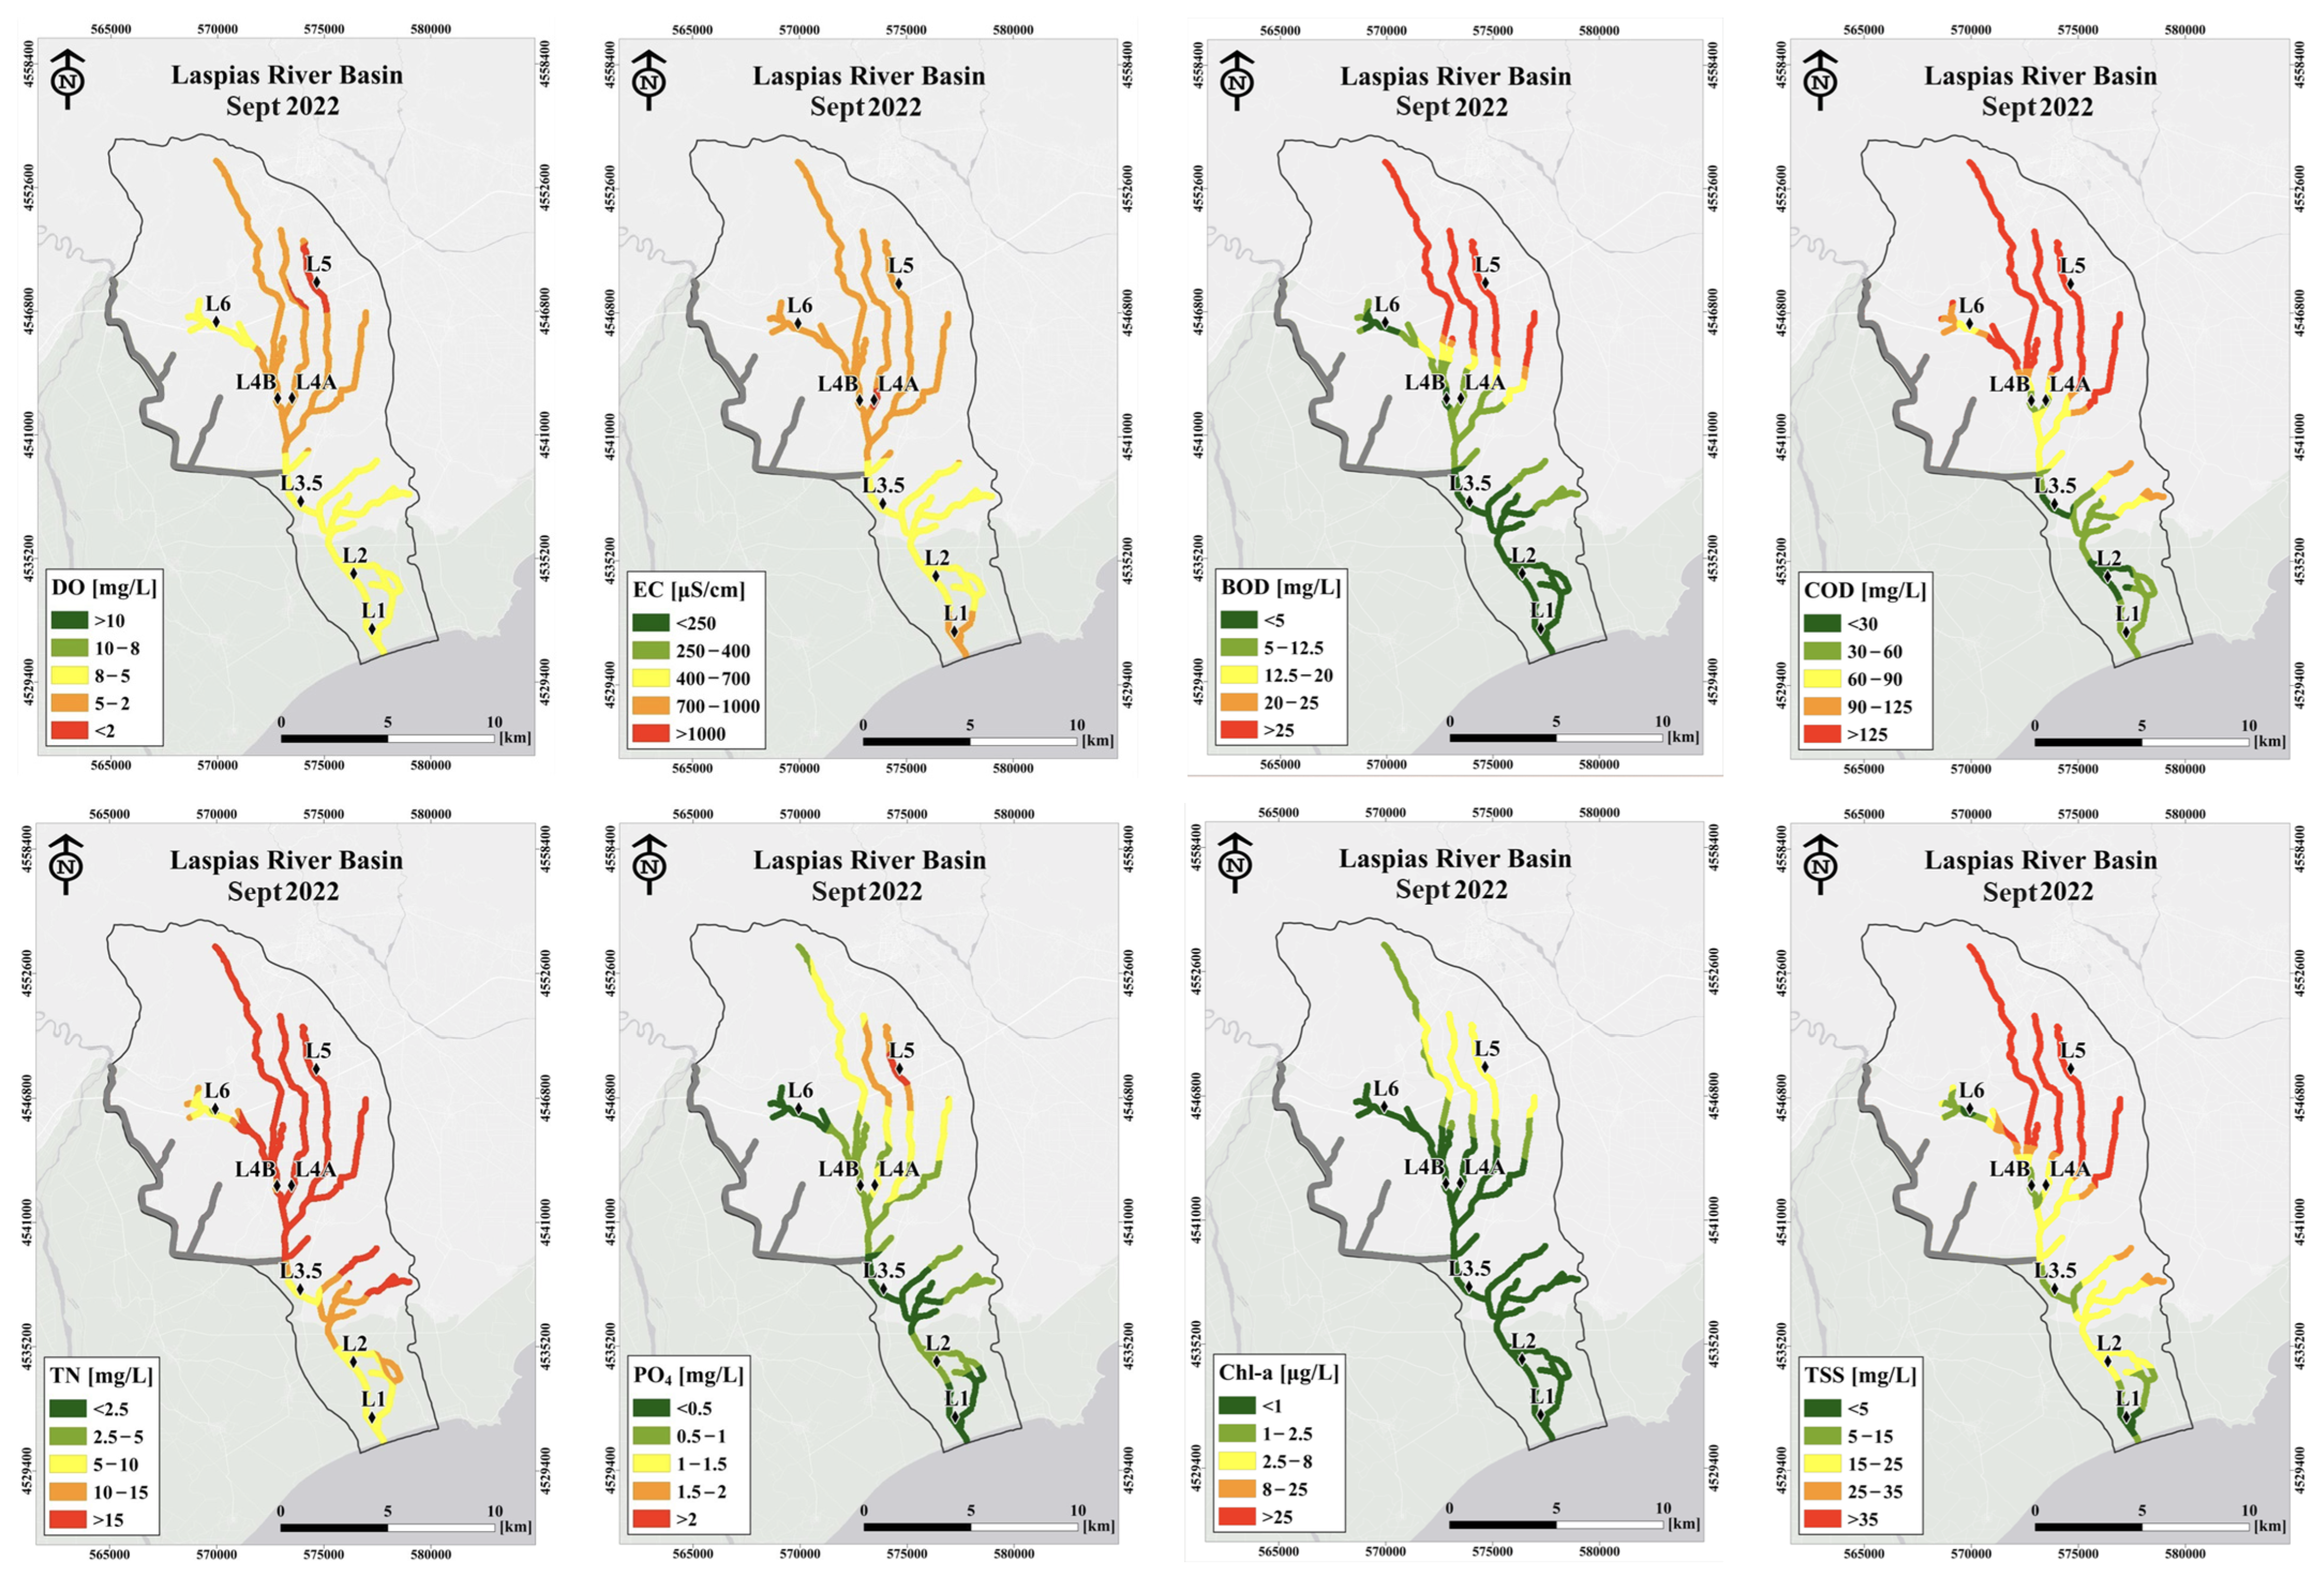
Figure 2, which consists of a series of maps constructed for two representative sampling periods (March 2022 and September 2022), illustrates the physicochemical parameters and nutrients determined in order to assess the water quality along the Laspias River.
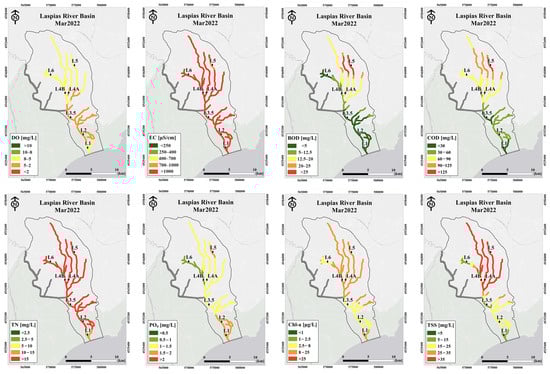
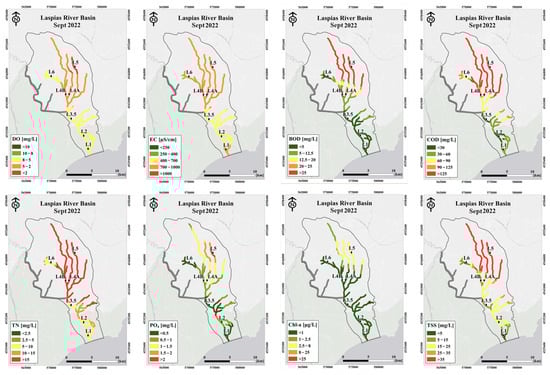
Figure 2.
Map distribution of dissolved oxygen—DO [mg L−1], electrical conductivity—EC [μS cm−1], biochemical oxygen demand—BOD [mg L−1], chemical oxygen demand—COD [mg L−1], total nitrogen—TN [mg L−1], orthophosphates—PO4 [mg L−1], chlorophyll a—Chl-a [mg L−1], and total suspended solids—TSS [mg L−1] concentrations along the Laspias river basin based on water analysis for two sampling periods (March 2022 and September 2022). Labels L1–6 denote the locations of sampling stations. A five-level color classification was used: green color represents “very good” status, while red color “bad” status. Values were assigned to their respective colors through a modification of the WFD categorization scheme adopted by Greece.
It is evident from the data and the maps that the water quality of the Laspias River was characterized by high concentrations of organic matter and inorganic nutrients, predominantly in the upstream areas (stations 6, 5, and 4a). Seasonal analysis showed that there was a decrease in water quality during dry periods; however, a poor condition was evident throughout the year, across almost all recorded parameters.
3.1.2. Lissos River
The Lissos River demonstrated mostly “good” and “excellent” water quality in terms of DO and EC (Table S2). According to EC values, stations 10 and 12 demonstrated the highest values (1295.90 and 1703.33 μS/cm, respectively). These high values can be attributed to the fact that station 1 lies in the delta of the river and is affected by salinity variability, and stations 10 and 12 are affected by industrial effluents.
Regarding organic matter, the Lissos River scored “good” water quality, apart from stations 4, 11, and 12, which demonstrated concentrations exceeding in some cases the EU limits [46]. Specifically, the station with the worst quality was station 11, which received livestock waste from a nearby farming facility. Station 11 also had the highest COD levels (mean 793.60 mg/L; max 2688.00 mg/L) (Table S2). TSS mean concentrations were in most stations below the threshold value of 35 mg/L [46], apart from stations 10 and 11. Based on the OECD classification scheme, most sampling points exhibited oligotrophic conditions (stations 5, 6, 7, 8, 9, and 10), while station 11 was hypertrophic.
Experimental data from the Lissos River revealed a quality that was classified from “moderate” to “bad” regarding NO2−-N and NO3−-N (Table S2), reporting values up to 0.19 and 2.37 mg/L, respectively, mainly due to anthropogenic activity and nitrification processes. Regarding orthophosphates, the Lissos River demonstrated an excellent water quality (Table S2), apart from station 11, at which the PO4-P mean concentration was 2.29 mg/L, indicating “bad” quality.
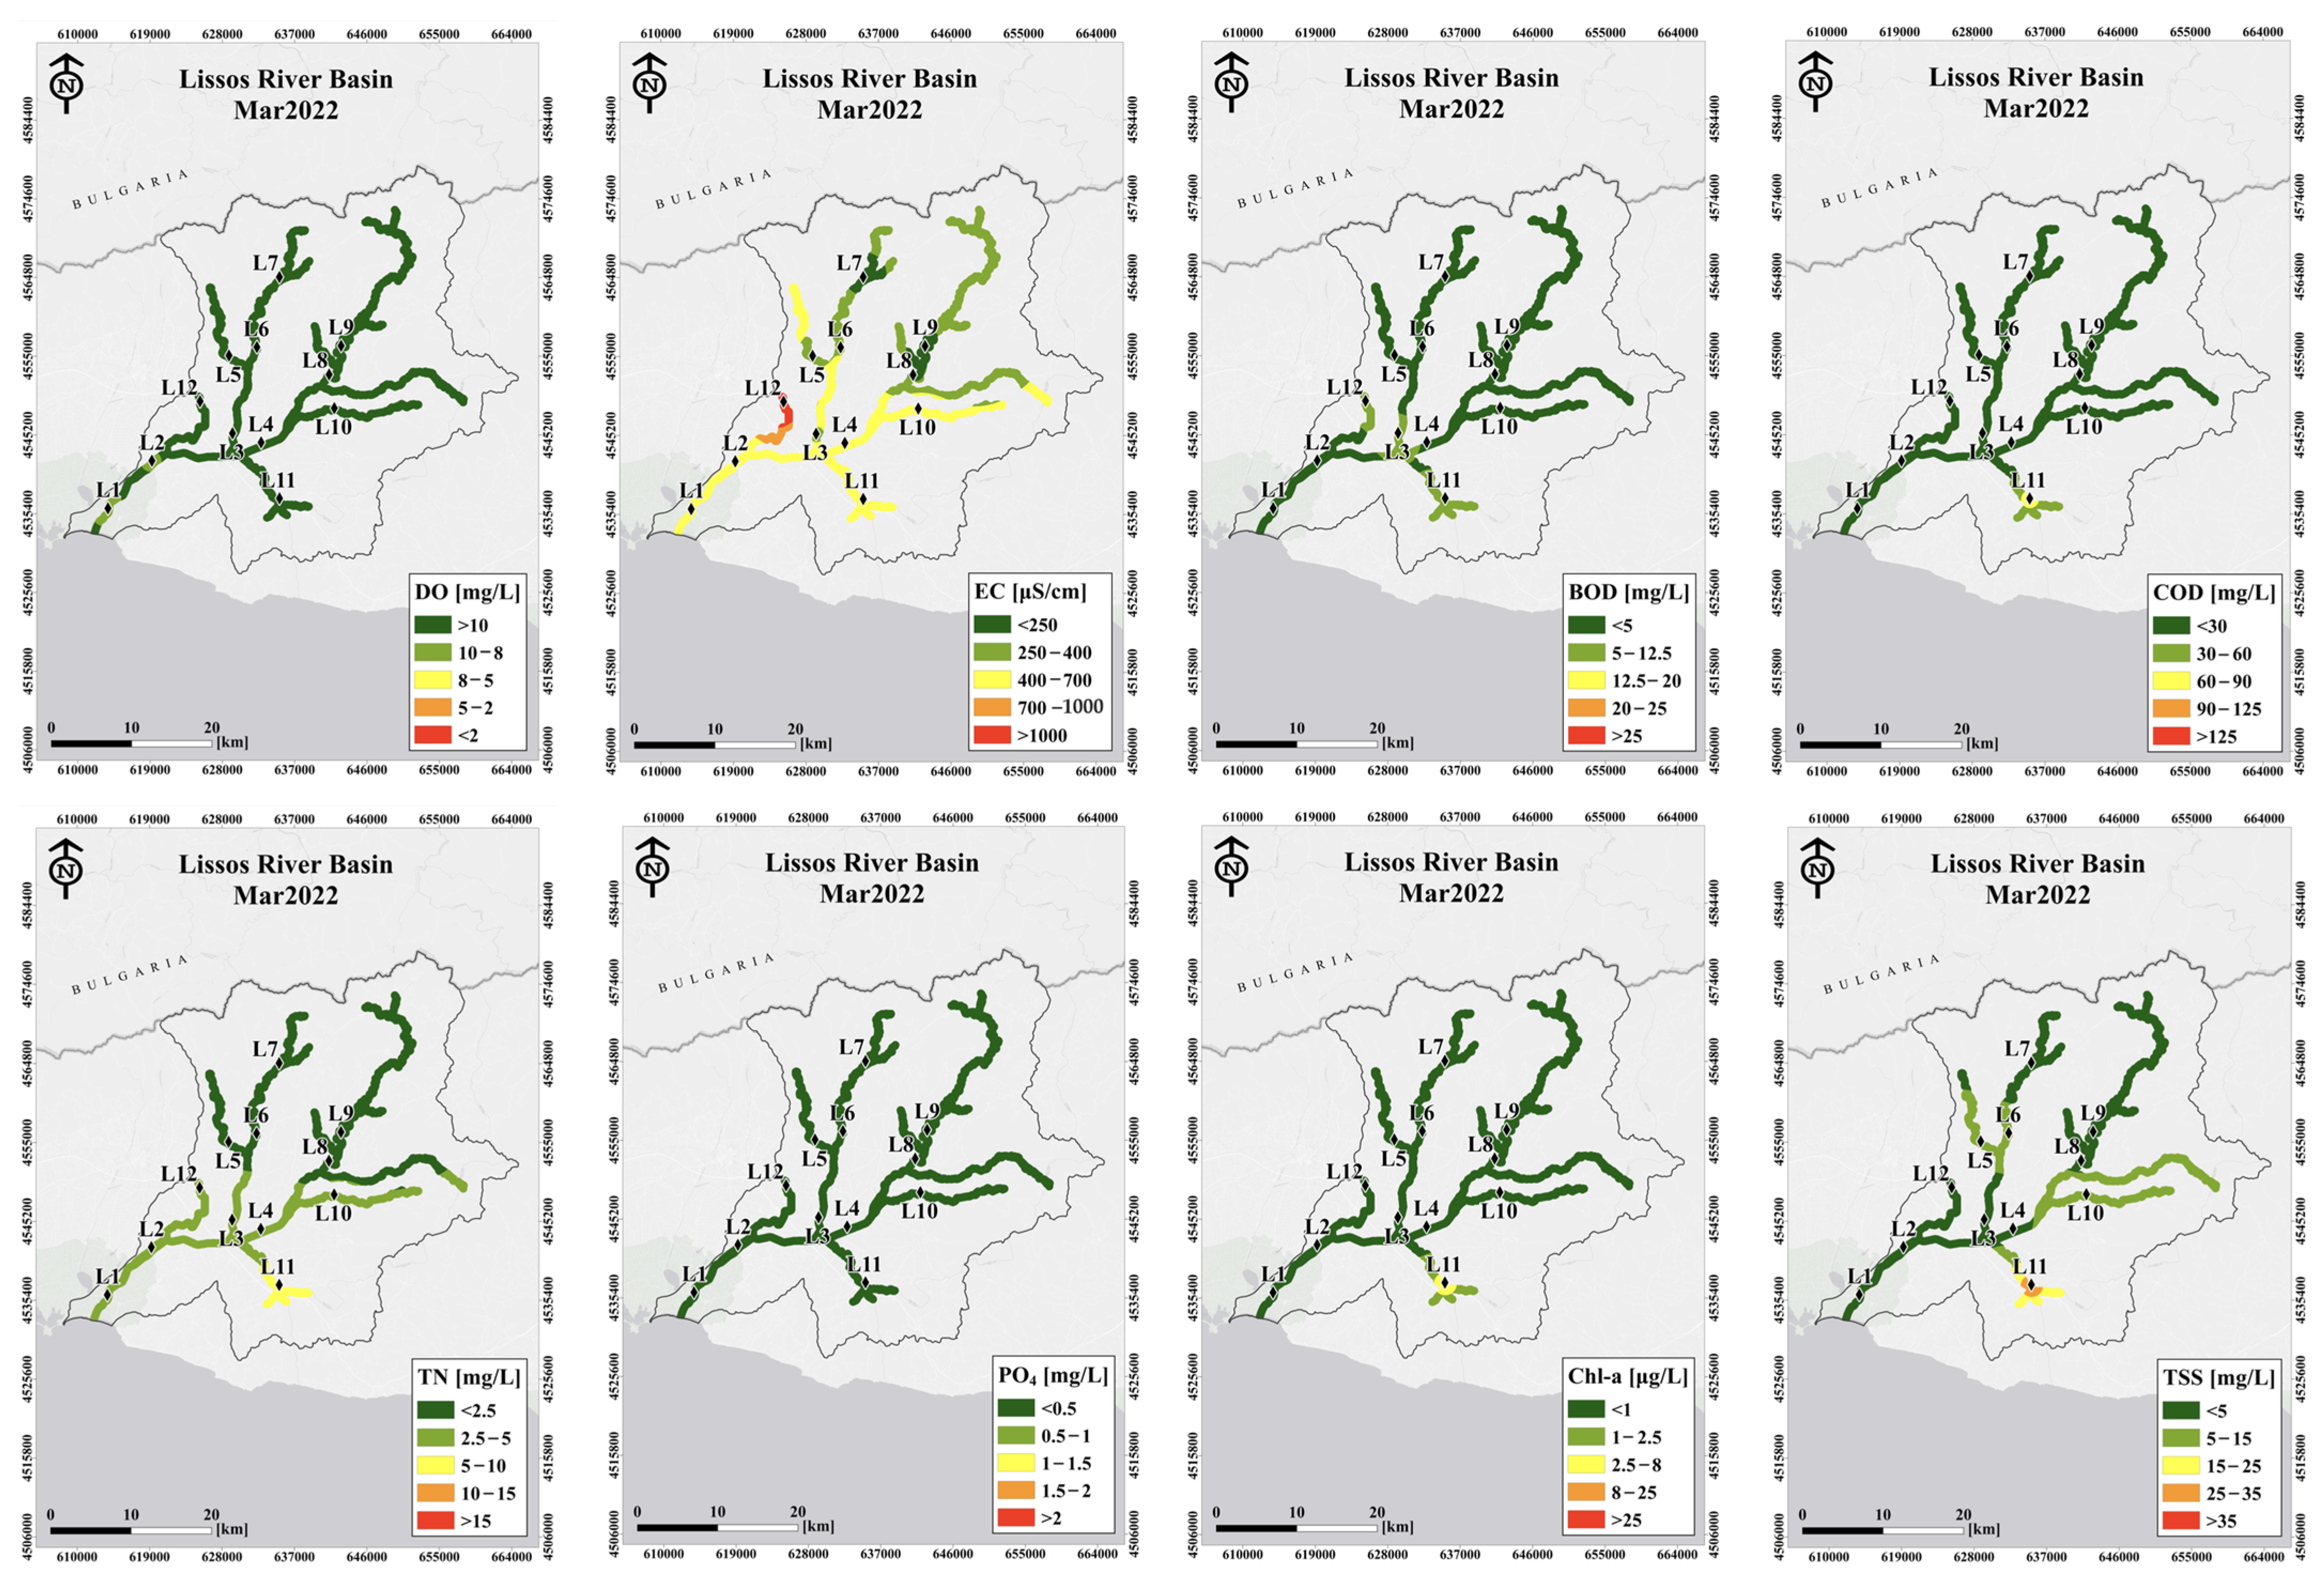
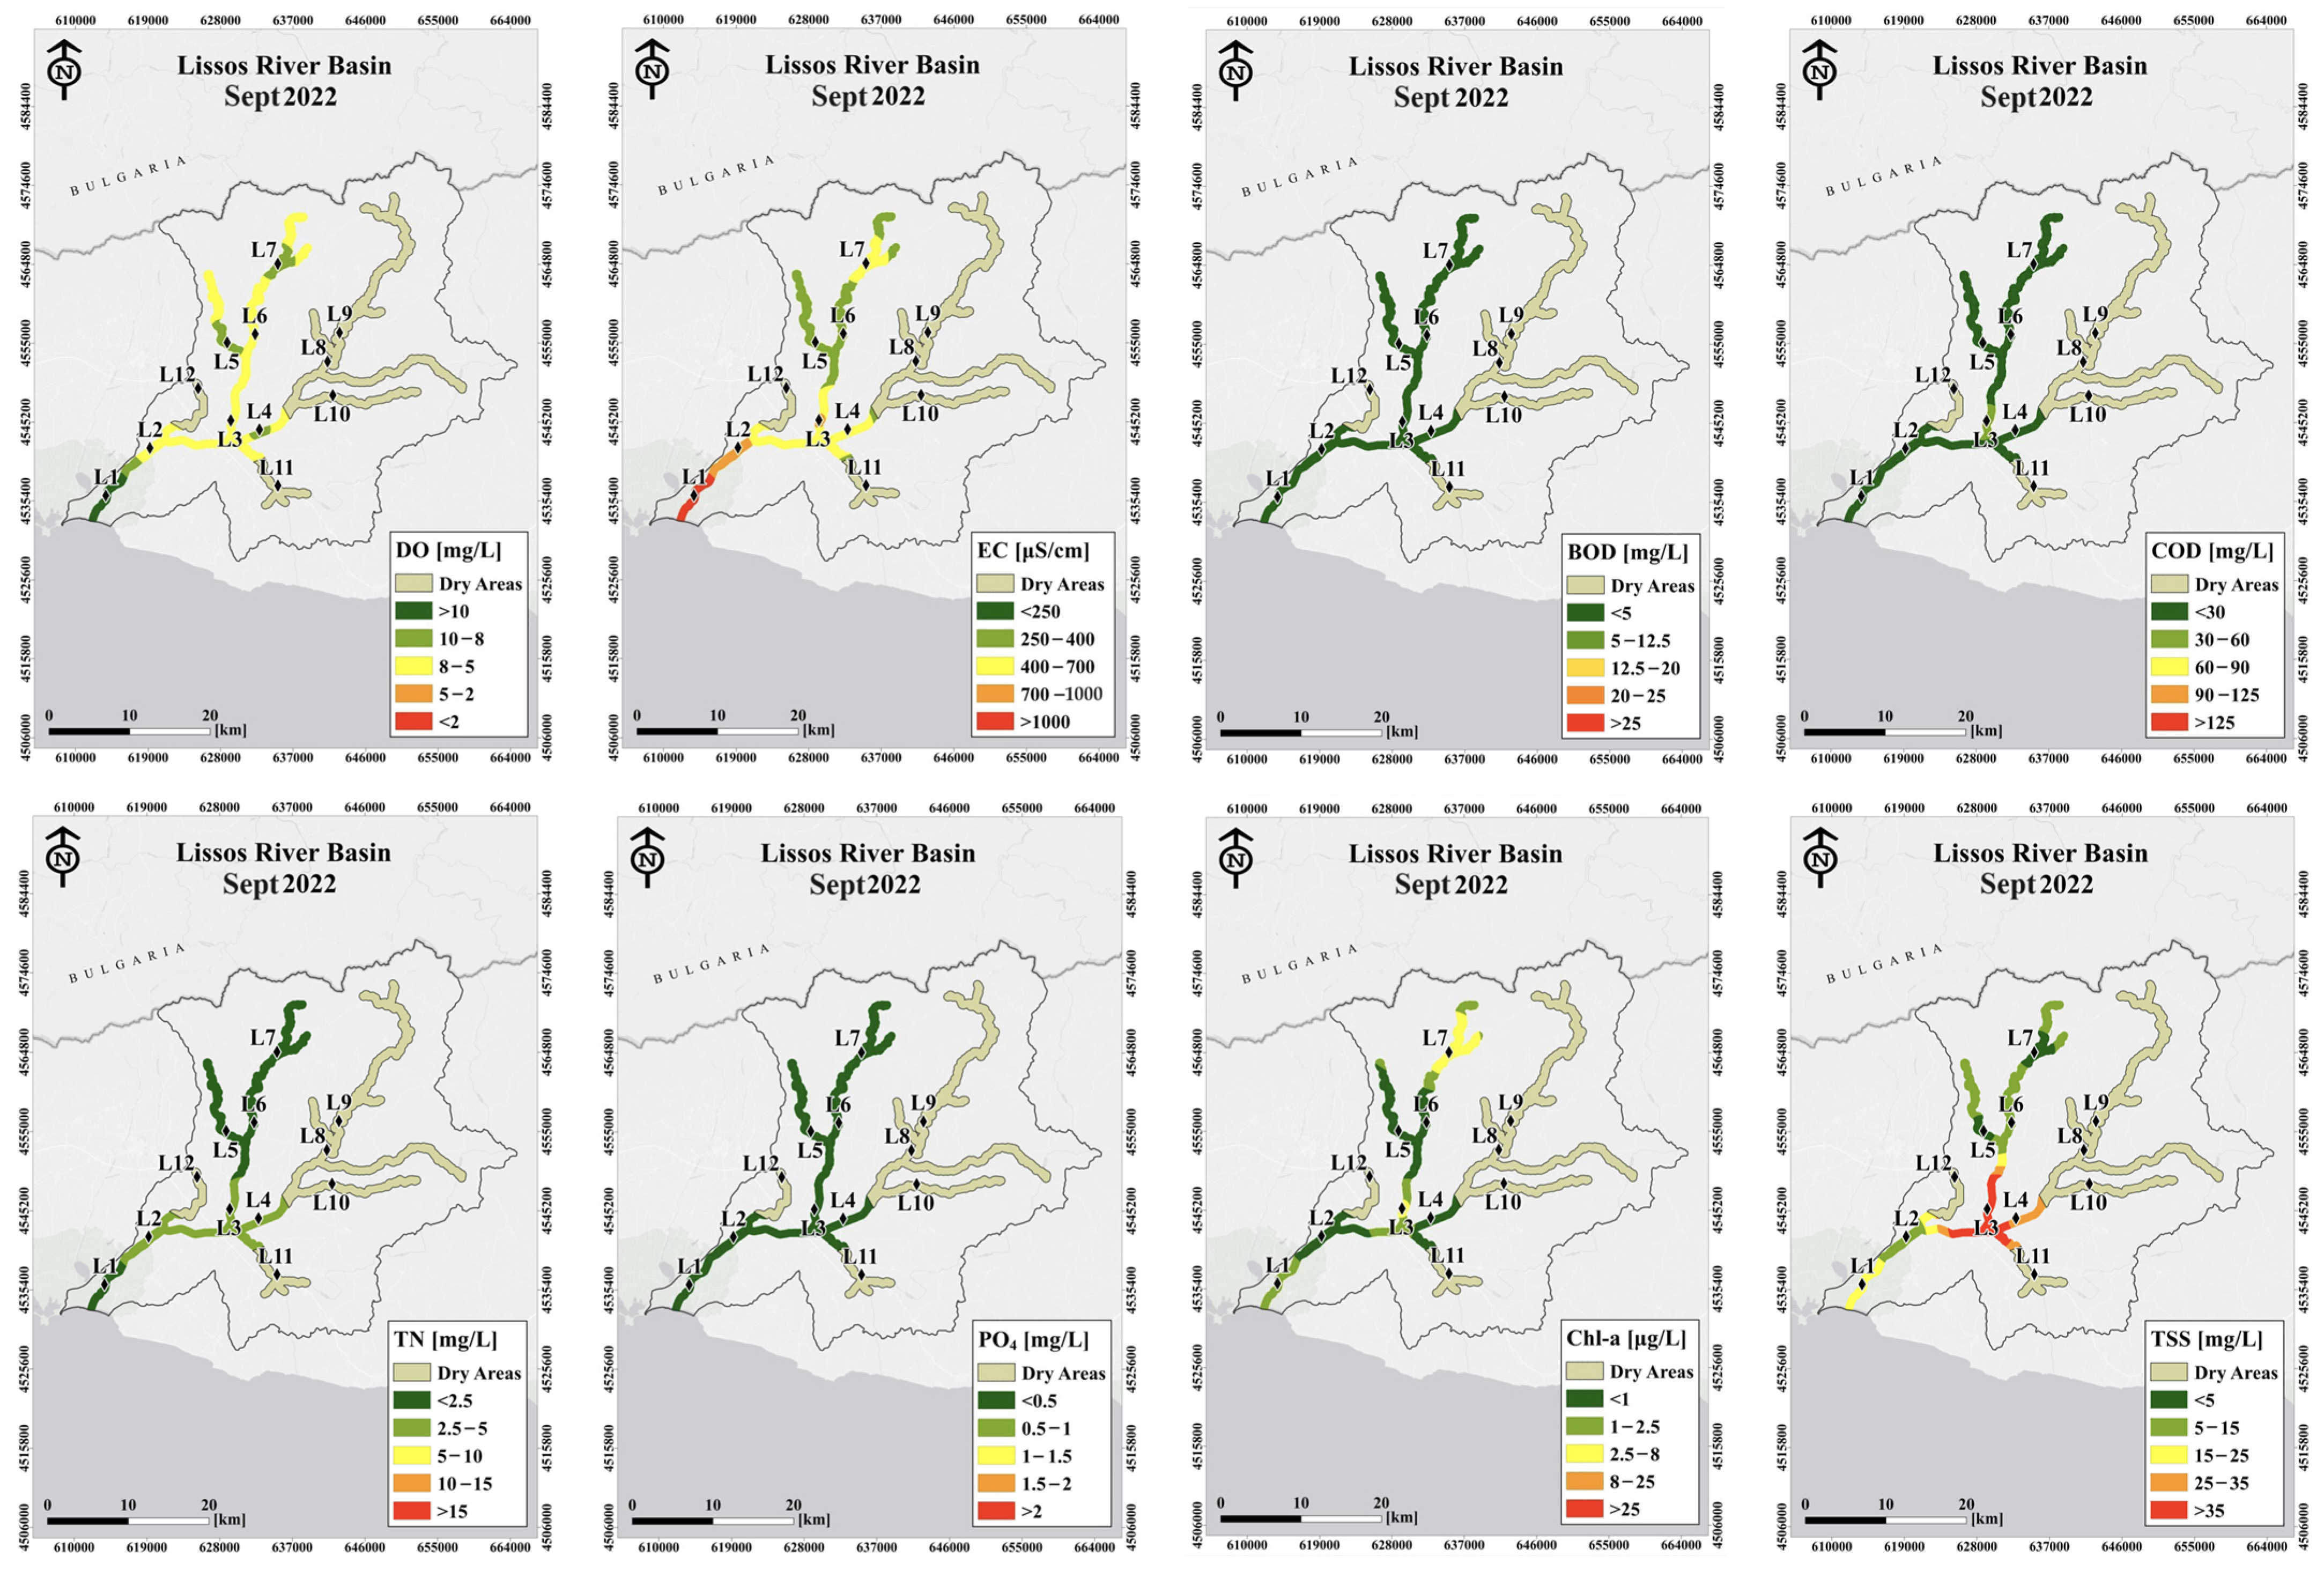
Moreover, mean NH4+-N concentrations at all stations were above the threshold of 100 μg/L set by Chapman [47], whereas NH4+-N concentrations at stations 4, 10, and 11 exceeded the upper limit set by the EU [45]. It should be noted that at stations 8, 10, 11, and 12 during dry periods, water was stagnant or even absent (no flow). The same applies for station 12 in winter and for stations 10 and 11 in summer 2022 (Table S2). Figure 3 presents the maps made to illustrate the variation in physicochemical parameters and nutrients in the Lissos River for two seasonal sampling periods. Variations in the river’s water quality were observed at certain sampling stations during wet and dry periods. The intermittent flow in numerous sectors of the Lissos River affected most of the monitored parameters, justifying the standard deviations presented in Table S2. Lastly, sampling point 11 was identified as the most adversely affected throughout the monitoring campaigns.
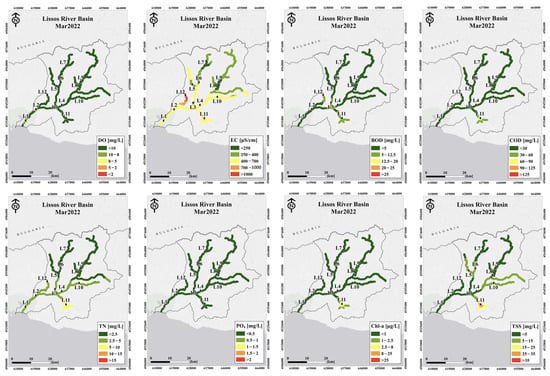
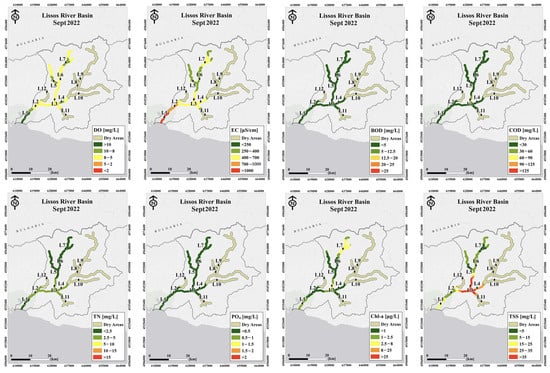
Figure 3.
Map distribution of dissolved oxygen—DO [mg L−1], electrical conductivity—EC [μS cm−1], biochemical oxygen demand—BOD [mg L−1], chemical oxygen demand—COD [mg L−1], total nitrogen—TN [mg L−1], orthophosphates—PO4 [mg L−1], chlorophyll a—Chl-a [mg L−1], and total suspended solids—TSS [mg L−1] concentrations along the Lissos river basin based on water analysis for two sampling periods (March 2022 and September 2022). Labels L1-6 denote the locations of sampling stations.
3.1.3. River Water Quality Assessment Based on CCME-WQI
The CCME-WQ indices were calculated twice based on two different legislations [45,46]. The parameters used for the first legislation [45] were NO3−-N, NO2−-N, NH4+-N, PO43−-P, DO, pH, BOD, and TSSs, while the parameters used for the second legislation [46] were pH, BOD5, COD, TSSs, TP, and TN. Table 5 and Table 6 demonstrate the CCME-WQIs calculated for the Laspias and Lissos rivers, respectively.
Table 5.
CCME-WQI for Laspias River.
Table 6.
CCME-WQI for Lissos River.
In the Laspias, station 1 fell under the “marginal” class, stations 2, 4B, and 6 under the “fair” class, and stations 4A and 5 under the “poor” class, while only station 3 belonged to the “good” water quality class (flexible criteria). Considering the first legislation [45], the overall status of the Laspias River based on the CCME-WQI values indicated “poor” water quality at all monitoring stations, throughout the monitoring period (Table 5).
In the Lissos River, following the second legislation [46], the majority of stations fell under “high” and “good” quality (stations 1, 4, 5, 6, 7, 8, 9, and 12), except for stations 2, 3, and 10 (“fair”) and station 11 (“poor”). When applying the criteria of the first legislation [45], the whole river scored “marginal” and “poor” water quality (Table 6).
3.2. Coastal Water Quality Status
The results for the various physicochemical and water quality parameters from each sampling station along the coastal zone near the outflow of the Laspias and Lissos rivers are presented in Tables S3 and S4, respectively.
3.2.1. Coastal Waters
In general, both coastal zones appear well oxygenated. Water temperature exhibited seasonal variability with higher values during summer and autumn and lower during winter and spring. In both coastal areas, the water exhibited an alkaline character as pH values ranged from 8.15 to 10.56 (Laspias) and from 8.09 to 9.91 (Lissos). BOD5 in the Laspias ranged from 0 to 12.90 mg/L (station 3), while BOD5 values in the Lissos were up to 8.40 mg/L. TSS concentrations were reported up to 143.2 and 140.9 mg/L in the coastal zones of the Laspias and Lissos rivers, respectively.
Seasonality affects the temporal fluctuation of river discharge, which is very high in December and March and starts to decrease from June to September. The mean NH4+-N concentrations in the Laspias River were characterized as “high” at stations 1, 2, and 4, while station 3 revealed a “bad” water quality status (Table 2 and Table S3). On the other hand, all Lissos River stations scored in the “bad” class. The NH4+-N displayed higher values in the dry period in the case of the Laspias River, as opposed to the Lissos River, where higher levels were recorded in the wet season. The mean NO2−-N concentrations fell in the “moderate” quality class at all stations in the Laspias coastal zone, while in that of the Lissos, stations 1 and 2 scored “poor” and stations 3 and 4 “moderate” water quality status. Overall, the Lissos River had higher nitrate concentrations, especially in the dry season (June, September). These higher levels in the Lissos coastal zone may be attributed to intense seaweed decomposition, thus raising significantly the concentrations of all nitrogen species (ammonia, nitrites, and nitrates).
Lastly, PO43−-P did not indicate any seasonal variation, since orthophosphates remained stable throughout the monitoring period. According to Table 2, all mean values for PO43−-P corresponded to the “high” and “good” water quality statuses (Tables S3 and S4).
3.2.2. Coastal Water Reference Conditions
Based on the dilution patterns for each parameter illustrated in Table 3, the physicochemical reference conditions were defined and reported in Table 7. The O2% and phosphate concentrations fell within the “high” water quality class in the coastal zones of both the Laspias and Lissos rivers. On the other hand, regarding ammonium, 59.26% and 40.74% of water samples from the Laspias scored in the “high” and “bad” water quality class. The coastal area of the Lissos River seemed worse in water quality, since only 30.77% of the samples scored in the “high” class, while the remaining were characterized in the “bad” water quality class. In terms of nitrates, 33.33% of the Laspias and 34.62% of the Lissos samples were found to be of “high” water quality status, while the remaining were found to be in the “bad” qualitative status.
Table 7.
Physicochemical reference conditions of high and bad water quality status.
3.2.3. Coastal Water Eutrophication Assessment
For the eutrophication assessment, two indicators were used: Chl-a concentration and TRIX. The first one (Chl-a) involves five scales of trophic status (Table 3). In the coastal zone of the Laspias River, only 3.70% of the samples were assessed as “good”, 48.15% were “poor”, and 40.74% had “bad” eutrophication status. None of the samples were characterized as “high”. The pattern was similar or even worse in the Lissos coastal area, where only 7.69% scored “high”, while 34.62% were in the “poor” and 57.69% in the “bad” trophic category.
TRIX results showed that the coastal water of the Laspias River area was assessed as being of “moderate” to “poor” quality status, since 37.04% and 33.33% of the samples corresponded to the “moderate” and “poor” classes, respectively, while 14.81% belonged to the “good” class, 7.41% to the “bad”, and only 7.41% showed “high” quality. In the Lissos coastal area, the eutrophication problem, according to TRIX, was significantly worse. The majority of the samples were characterized as of “bad” quality (53.85%), and 23.08% corresponded to the “moderate” and “poor” scales, while none of the samples were of “good” or “high” quality. It can be noted that there was an agreement between Chl-a and TRIX in depicting mainly moderate to poor conditions in the Laspias coastal zone, while the Lissos coastal area demonstrated worse trophic status, belonging mainly to the poor and bad scales of the indicators.
3.3. Statistical Analyses
3.3.1. Laspias River
Stepwise discriminant analysis was performed for all category 1 parameters and the results revealed that EC and BOD5 were statistically significant for discriminating between the dry and wet periods. Concerning category 2, only Ca2+ was statistically significant. For category 1, Wilk’s lambdas of 0.177 and 0.060, p < 0.005, were obtained for the two functions, respectively, whereas for category 2, a Wilk’s lambda of 0.212, p = 0.08, was estimated. The significant values (p < 0.05) of Wilk’s lambdas in category 1 indicated that the discriminant function was responsible for the differentiation of the certain groups. The functions that provided the separation between the periods were:
For Category 1:
DF1: −1857.65 + 1420.72 * EC − 306.87 * BOD5
DF2: −2283.26 + 1578.12 * EC − 347.258 * BOD5
For Category 2:
DF1: −578.11 + 675.10 * Ca+
DF2: −695.36 + 740.47 * Ca+
Regarding Spearman’s correlation analysis for the Laspias River, there were significant positive correlations between 18 pairs of parameters (TDS—EC, BOD5—CODtot, PO43−-P—TSSs, TN—CODtot, TN—BOD5, F−—NO3−-N, Cl−—TDS, Br−—TDS, Br−—Cl−, SO42−—Br−, Na+ -TDS, Na+—Cl−, Na+—Br−, K+—EC, K+—TDS, K+—CODtot, K+—TN, Mg2+—SO42−; p < 0.05, Figure 4).
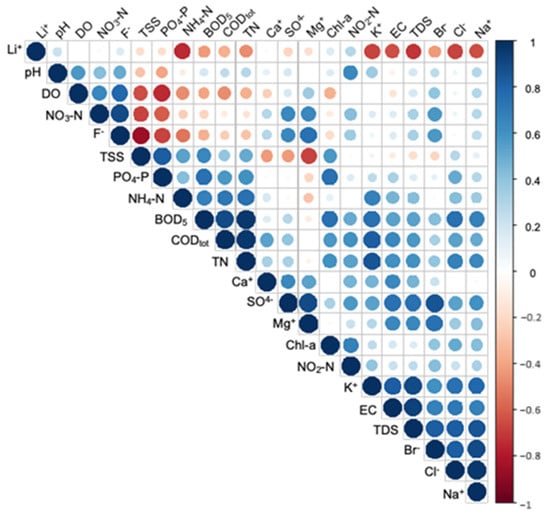
Figure 4.
Correlogram of Spearman’s correlation coefficients among physicochemical and nutrient parameters in Laspias River. Positive and negative correlations are represented by blue and red dots. The sizes and the shades of the dots reflect the strengths of correlation between pairs of physicochemical and nutrient parameters. Colors range from bright blue (strong positive correlation; i.e., rs = 1.0) to bright red (strong negative correlation; i.e., rs = −1.0). Figure drawn using the R corrplot package.
Concerning the PCA with the physicochemical parameters and nutrients from the Laspias River, the results showed that the two first axes explained 87.6% of the total variance. The first principal component (PC1) was highly and negatively correlated with CODtot and BOD5 (organic pollution), while the second one (PC2) with PO43−-P and NO3−-N (nutrient pollution) (Figure 5).
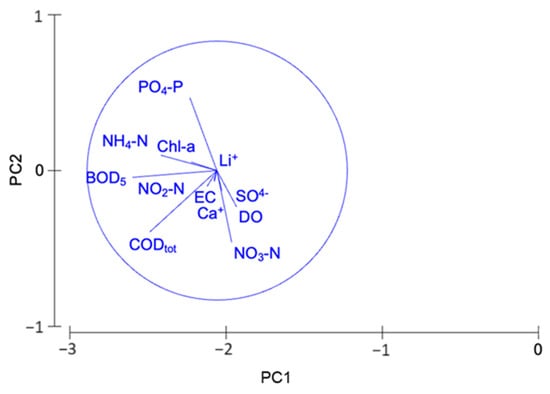
Figure 5.
Principal component analysis of physicochemical parameters and nutrients of Laspias River during the survey (2021–2023).
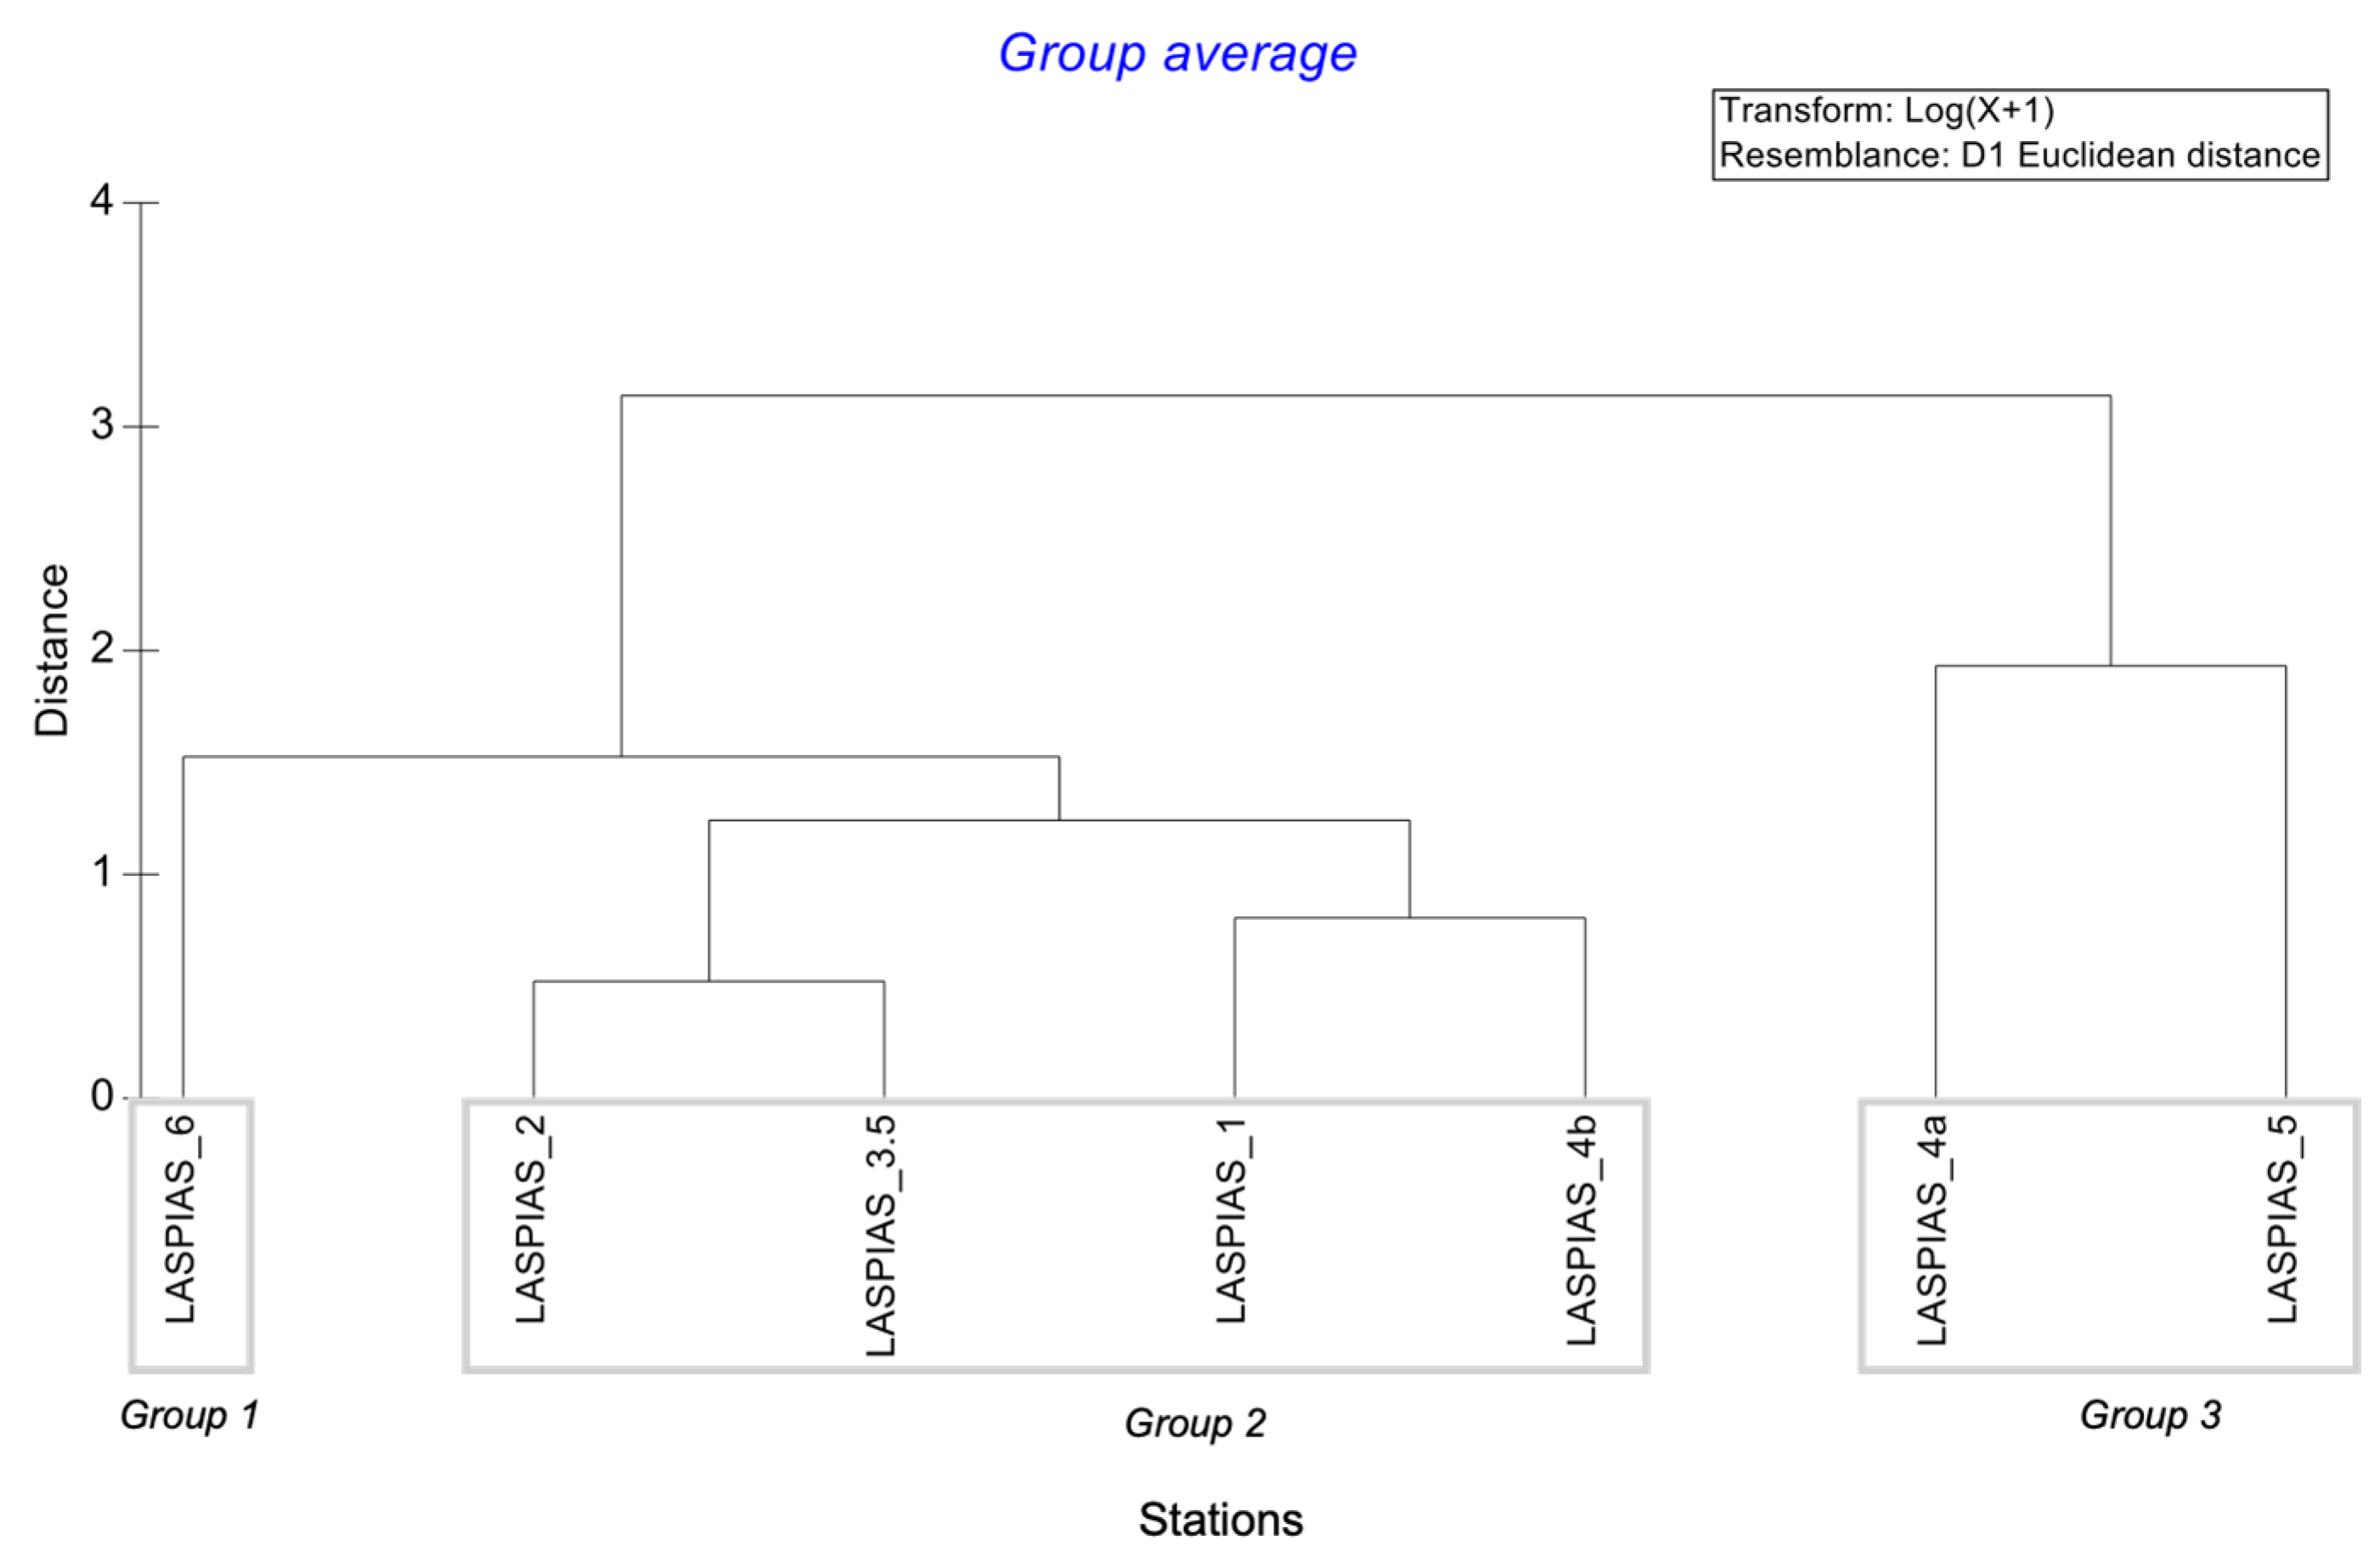
Cluster analysis revealed a spatial pattern and formed three distinct groups (Figure 6). Station 6 located downstream to the landfill site belonged to the first group (Figure 6), which differed from all other sampling locations. The second group consisted of sampling locations along the main torrent (1, 2, 3.5) and one station in a tributary (4B) (Figure 6), which had low and moderate levels of eutrophication. SIMPER analysis showed that these stations were grouped mainly due to chlorophyll-a (47.7% contribution). Finally, the third group comprised stations 5 and 4A, which had the highest organic matter values, since the group was formed due to the high concentrations of BOD5 and CODtot (35.32% and 37.28% contributions, respectively). Station 6 was differentiated from groups 2 and 3 due to CODtot (SIMPER; 26.26% contribution) and BOD5 (SIMPER; 35.63% contribution). Finally, group 2 was separated from group 3 because of BOD5 values (SIMPER; 37.63% contribution).
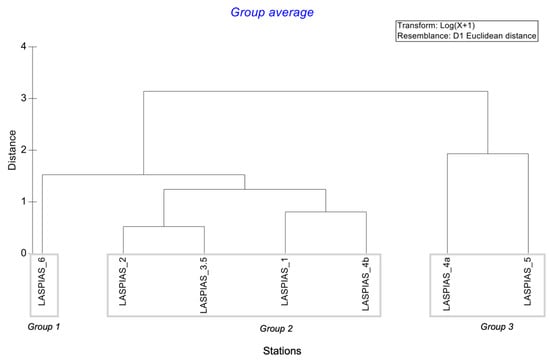
Figure 6.
Hierarchical cluster analysis of physicochemical parameters and nutrients in the sampling stations of Laspias River during the survey (2021–2023).
3.3.2. Lissos River
Stepwise discriminant analysis was performed for category 1 parameters and the results revealed that DO was statistically significant for discriminating between the dry and wet periods, whereas it was SO42− for category 2. Wilk’s lambdas of 0.355 and 0.212, p < 0.005, were obtained for the two categories, respectively. The functions that provided the separation between the periods were:
For Category 1:
DF1: −675.64 + 1339.86 * DO
DF2: −762.83 + 1423.77 * DO
For Category 2:
DF1: −164.27 + 185.29 * SO4−
DF2: −132.19 + 166.13 * SO4−
The Spearman’s correlation analysis for the Lissos River showed significant positive correlations between 29 pairs of parameters (TDS—EC, NO2=-N—EC, NO2−-N—TDS, NO2−-N—BOD5, NO3−-N—EC, F−—NO2−-N, Cl−—EC, Cl−—TDS, Cl−—NO2−-N, Br−—Cl−, SO42−—EC, SO42−—TDS, SO42−—NO2−-N, SO42−—F−, SO42−—Cl−, Na+—EC, Na+—TDS, Na+—NO2−-N, Na+—Cl−, Na+—Br−, Na+—SO42−, K+—TDS, K+—NO2−-N, K+—F−, K+—Cl−, K+—SO42−, K+—Na+, Mg2+—Br−, Ca2+—TDS; p < 0.05, Figure 7).

Figure 7.
Correlogram of Spearman’s correlation coefficients among physicochemical and nutrient parameters in Lissos River. Positive and negative correlations are represented by blue and red dots. The sizes and the shades of the dots reflect the strengths of correlation between pairs of physicochemical and nutrient parameters. Colors range from bright blue (strong positive correlation; i.e., rs = 1.0) to bright red (strong negative correlation; i.e., rs = −1.0). Figure drawn using the R corrplot package.
The PCA on the physicochemical and nutrient parameters from the Lissos revealed that the two axes explained 93.5% of the total variance. The first principal component (PC1) was highly and positively correlated with TSSs and CODtot, while the second one (PC2) was negatively correlated with EC and Ca (Figure 8).
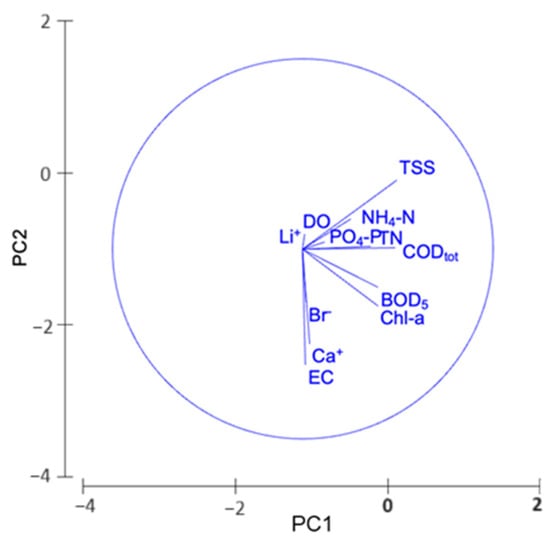
Figure 8.
Principal component analysis of physicochemical parameters and nutrients of Lissos River during the survey (2021–2023).
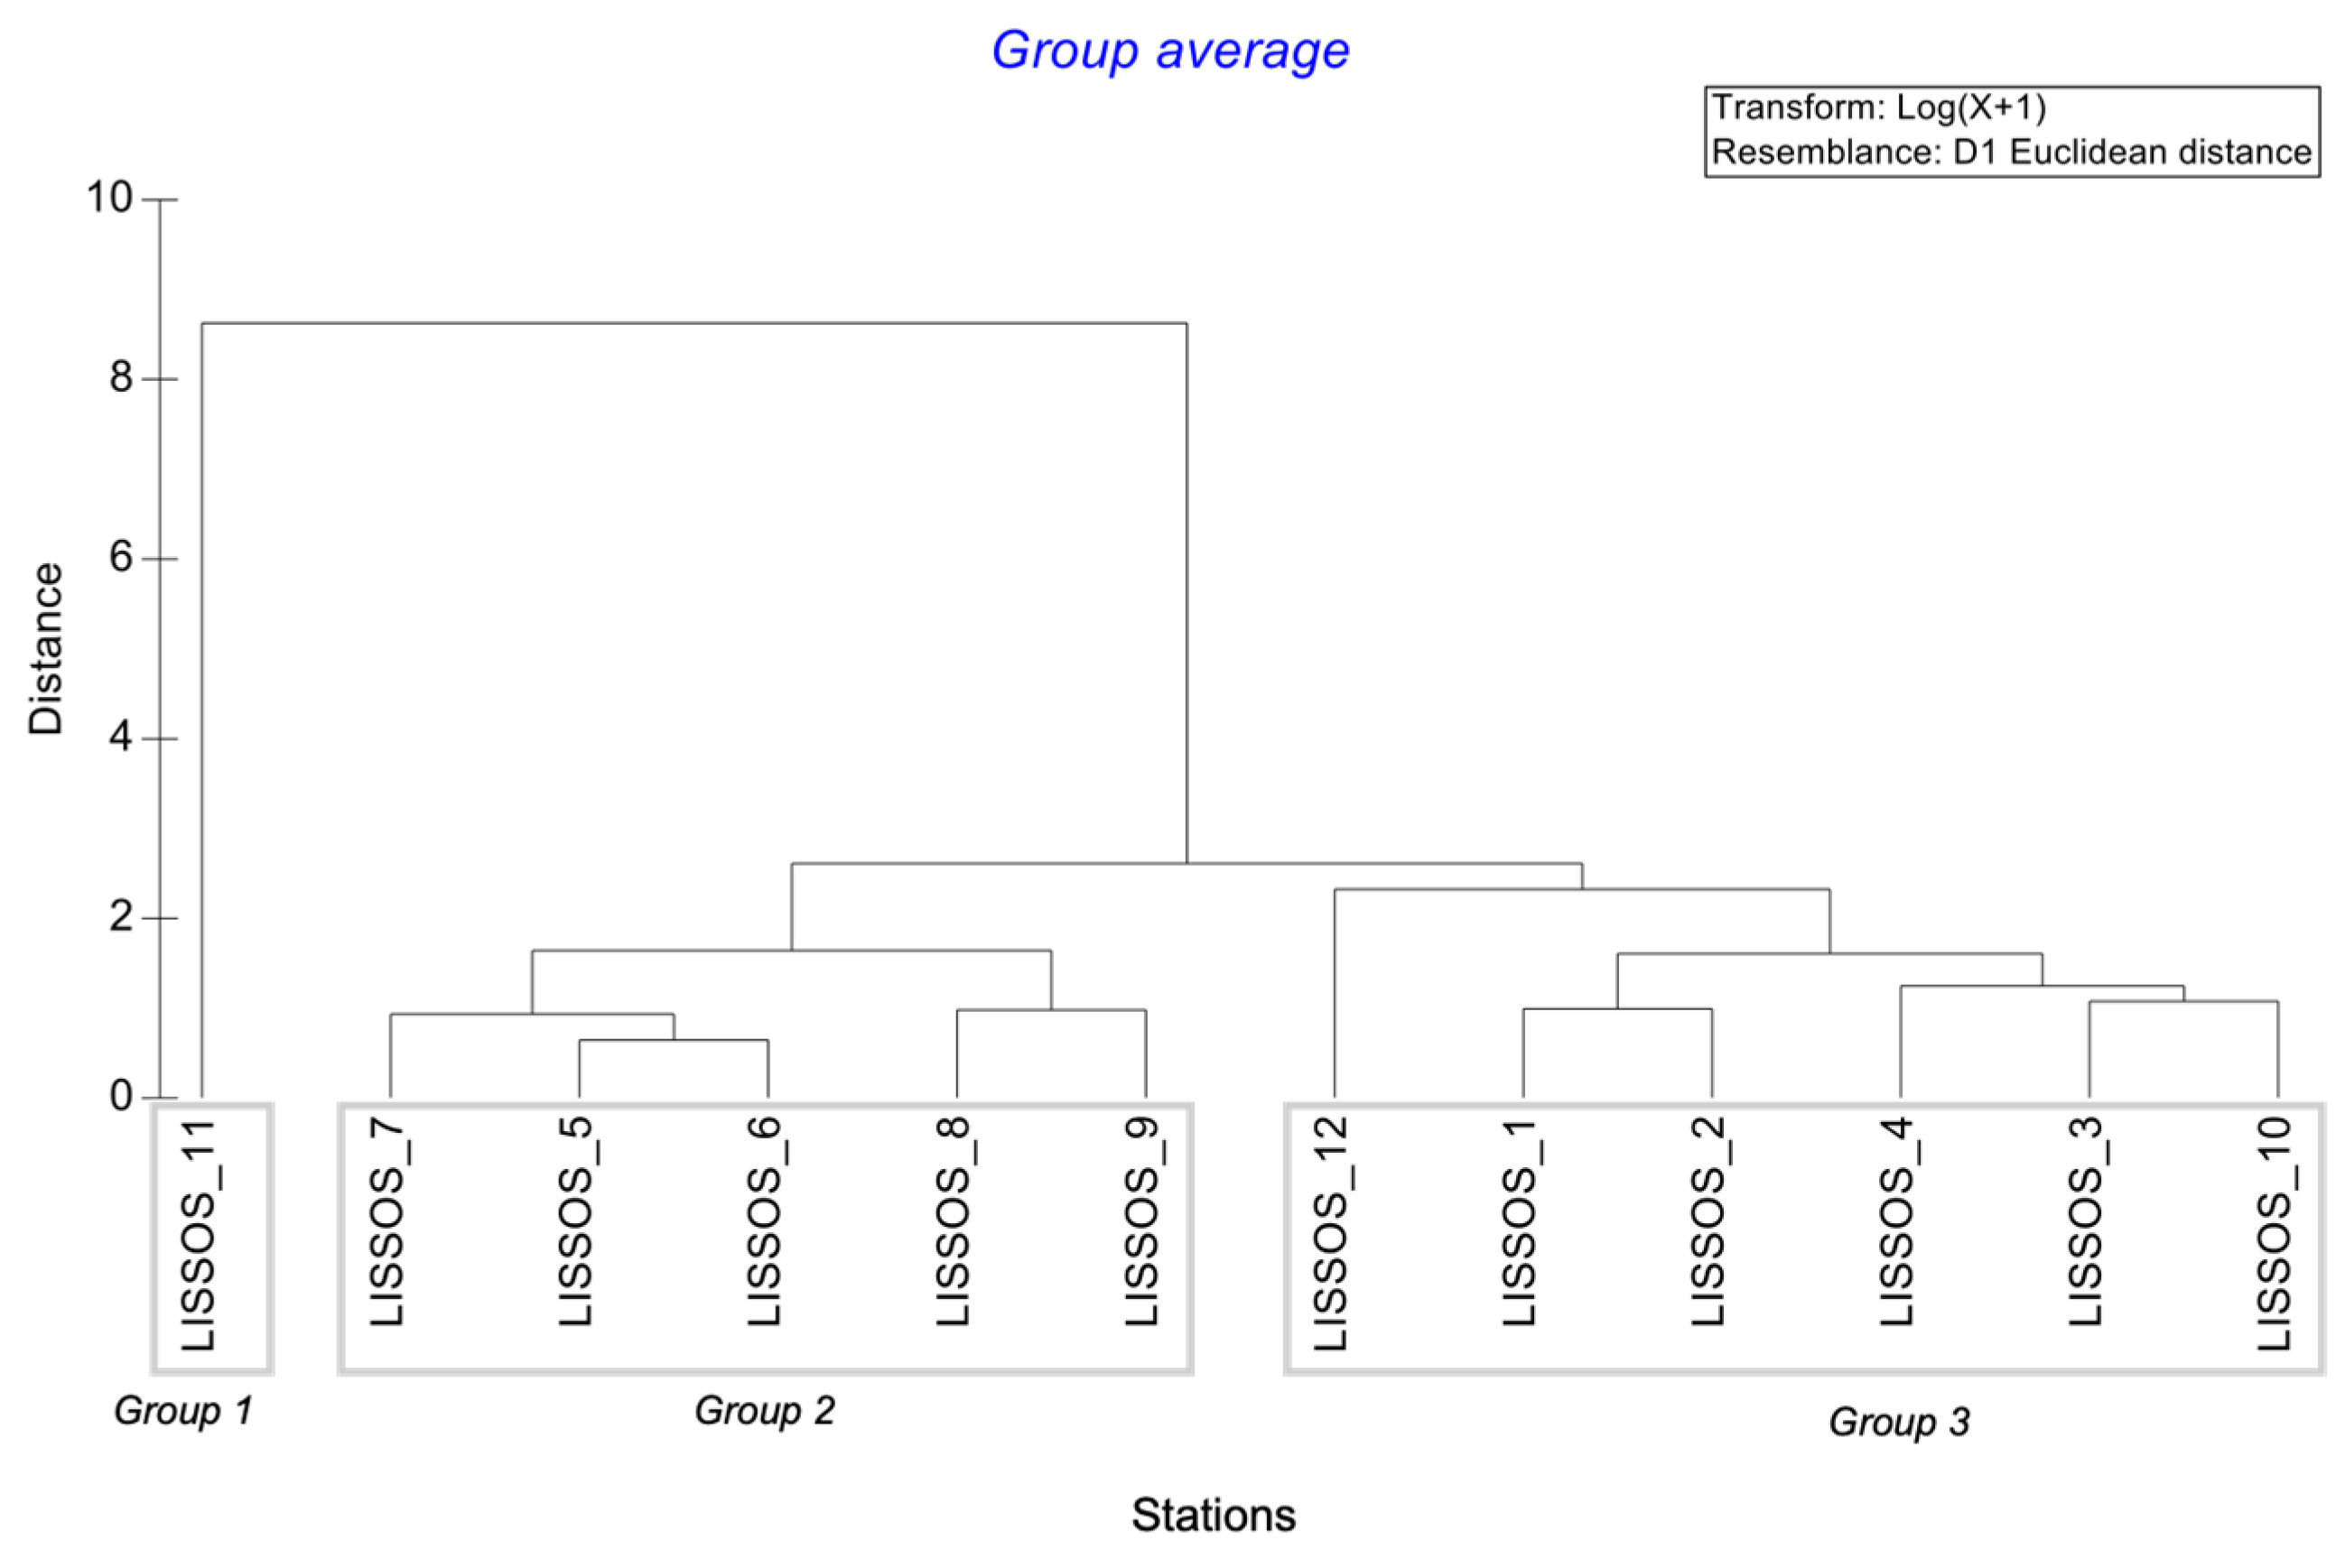
Cluster analysis revealed a spatial pattern and separated three groups (Figure 9). Station 11 located downstream of a dairy industry formed the first group (Figure 9), which differed from all other sampling stations. The second one consisted of all upstream stations (5, 6, 7, 8, 9) (Figure 9), grouped mainly due to low TSS and Ca values (23.94% and 29.34% contributions, respectively). The last group comprised downstream stations (1, 2, 3, 4, 10, 13), grouped by the high EC and TSS levels (25.71% and 30.56% contributions, respectively). Station 11 was differentiated from groups 2 and 3 due to CODtot (SIMPER; 23.65% and 25.32% contributions, respectively). Finally, group 2 was separated from group 3 because of Chl-a and TSSs (SIMPER; 24.25% and 23.55% contributions, respectively).
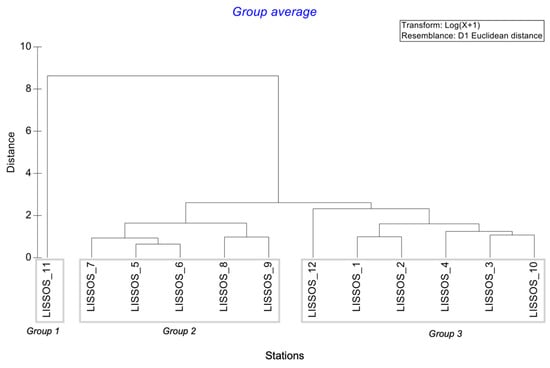
Figure 9.
Hierarchical cluster analysis of physicochemical parameters and nutrients in the sampling stations of Lissos River during the survey (2021–2023).
4. Discussion
The Laspias River demonstrated significant organic and nutrient pollution with signs of eutrophic and supertrophic levels. This is due to several anthropogenic activities, including agricultural and livestock runoff, inappropriate agricultural practices (overfertilization), etc. [3,10]. The situation was better in the Lissos River, which received less pressures in comparison to the Laspias. Specifically, in the Laspias River, it has been observed that certain sampling points register DO concentrations falling below 2 mg/L [47], values leading to fish death in many cases. Similarly, EC values for most freshwater have ranged from 10 to 1000 μS/cm, while for polluted waters, they exceeded 1000 μS/cm [47]. This can be attributed to high ion concentrations (such as nitrates, chlorides, sulfates, calcium, etc.) in certain parts of the Laspias watershed due to the discharge of untreated livestock waste into the river and the use of fertilizers on agricultural land [26]. The prevalence of high organic matter concentrations was verified by measurements of COD and BOD5. However, lower-altitude sampling points demonstrated better water quality status concerning organic matter, implying that the Laspias tributary, despite its significant pollution level, exerts minimal influence on the primary river’s water quality, possibly due to its lower flow compared to the main river. Furthermore, the high concentrations of ammonia nitrogen across all sampling points may mark organic pollution originating from domestic sewage, industrial waste, and fertilizer runoff. The levels of NO2-N remained consistently minimal or non-existent at all monitoring stations. Nitrate compounds found in the Laspias River originate from agriculture and are also generated through the conversion of ammonia into nitrites and nitrates (nitrification). According to Chapman [47], the typical concentration of total phosphorus (TP) in most natural surface water bodies falls within the range of 0.005 to 0.02 mg P. Exceeding this limit could be attributed to the proximity of existing livestock facilities near the sampling sites. The most common effect of increased N and P in aquatic ecosystems (i.e., rivers, lakes, reservoirs, and coastal areas) is the increase in the abundance of aquatic plants and algae. These results indicate a potential negative impact on the aquatic coastal ecosystem where the river empties.
On the other hand, the Lissos River indicated a much better chemical condition, except for station 11. Sampling station 11 was located next to a farming industry. According to Chapman [47], it exceeded the limits for organic matter (BOD5, COD) and nutrients (NH4-N, NO3-N, and PO4-P). Additionally, increased nitrogen levels at some stations were observed near agricultural land, indicative of intense agricultural activities in the area. Finally, fluctuations in water quality at many stations may be attributed to the unstable river flow, as some points were periodically dry. The above observations agree with previous studies [26,48]. It is noteworthy that there is a lack of literature concerning the investigation of the two study areas, indicating an insufficient examination, despite their notable significance due to the many pressures they face, the use of their water for irrigation, and their discharge into swimming areas. An exception is the research addressing seawater intrusion into the groundwater aquifer [49,50,51].
Since there are no water quality indices developed specifically for Mediterranean rivers, an initial attempt was made using the CCME-WQI [52] for the assessment of water quality in the two watersheds, because it is one of the most popular water quality indices. Perrin et al. [53] assessed the water quality of the Vene River (France) and the Oued Fez and Sebou rivers (Morocco) in the Mediterranean region using 17 WQIs, including the CCME-WQI. The results showed that the index was sensitive to hydrological conditions and different geographical locations. The CCME index clearly reflected changes in water quality along the rivers, even under extreme low flow conditions that characterize most ephemeral rivers in the Mediterranean region [10]. Furthermore, Hamlat et al. [54] provided results for the Tafna watershed (northwestern Algeria) similar to those for the Laspias River in this study, regarding the relative performance of the CCME index, emphasizing that results differ from one region to another depending on local conditions. Previous studies have demonstrated the efficacy of the CCME index in delineating spatial and temporal alterations within river water. Consequently, the integration of the CCME index stands as a valuable instrument for system administrators and policymakers.
The impact of the transfer of nutrients and organic descriptors from rivers to the downstream coastal zones has been assessed and proven [55]. In other words, coastal waters are exposed to local runoff and aquaculture. Instances within the Mediterranean region reveal that rivers with significant environmental pressures negatively impact the quality of the seas they discharge into. Notable illustrations include the Po and Rhone rivers, discharging into the northern Adriatic Sea and the Gulf of Lion, respectively [56]. These river basins stand amongst the most densely populated and exploited in Europe, reporting nutrient loads sourced from agriculture, as well as untreated or inadequately treated domestic and industrial wastewater. The degradation of coastal area quality may precipitate phenomena such as eutrophication and heightened algal proliferation. To prevent such phenomena and evaluate the eutrophic status of coastal zones, indices are used. In the present study, the assessment of their eutrophic status was made using two indices, TRIX and Chl-a, which are well-established in the context of Greek seas [22,33].
There exist numerous rivers and their reaches in Greece that are significantly degraded [57]. One of the primary challenges for the rivers under consideration persists in the form of point source pollution. The untreated domestic wastewater from urban point pollution sources constitutes a substantial contributor, representing 20% of organic pollution and serving as the primary source of phosphorus inputs. Moreover, diffuse land use pressures contribute to 17.5% of nitrogen inputs and 40% of phosphorus inputs [58]. Generally, there is a decline in diffuse pollution originating from agricultural sources, as evidenced by a considerable overall reduction in nitrate concentrations in the recent period. This is due to a long-term drop in fertilizer application in Greece, Bulgaria, and North Macedonia, and possibly to the application of the Nitrates Directive. The recent improvements in the quality of a number of rivers, such as the Evros, Nestos, Axios, Pinios, Acheloos, and Aoos, are positive examples related to decreased fertilizer application [57]. Conversely, there are rivers in Greece presenting persistently elevated nutrient levels, estimated to stem from agricultural activities. For example, the Louros river has been highlighted as vulnerable for eutrophication, and published studies have classified the water quality as “fair” or “poor to fair” [59,60,61], with agricultural activity identified as the primary source of pollution. On the other hand, it is apparent that in terms of BOD and nitrogen inputs, livestock breeding is the most environmentally polluting activity [58]. Given that, predicting its environmental impact is accompanied by a degree of uncertainty. This uncertainty arises from a lack of data regarding the locations of livestock farms and associated pasture lands. Greece suffers mainly from ineffective national environmental policy planning coupled with inadequate implementation of environmental legislation. It was concluded that only 10–15% of water bodies can be identified as not at risk of failing the good status target [62].
The European Union’s Water Framework Directive (WFD) [9] has established objectives to prevent the deterioration of water bodies, including inland, transitional, and coastal waters. These objectives aim to achieve and maintain a good ecological status for these water bodies [63]. The evaluation of a river’s ecological status is grounded in river basin management plans, which encompass monitoring programs that consider various parameters of water quality. The ecological status is determined based on three qualitative elements: biological, physicochemical, and hydromorphological criteria [64,65]. After 22 years of implementing the WFD in Europe, there is concern that the goal of achieving good or higher status in all EU waters bodies has not yet been achieved [66], and the effectiveness of ecological assessment is being evaluated with the exploration of improvements [67,68]. It should be emphasized that these indices evaluate the physicochemical condition of the waters, which was the classical assessment of water quality used before the implementation of the WFD. The inclusion of ecological lines of evidence (LoE) in the assessment of water bodies is an innovation of the WFD [68]. Consequently, for the evaluation of the ecological status of water systems, in accordance with the WFD requirements, the results obtained from the WQIs can be utilized to assess the physicochemical component, and this assessment can be supplemented by the evaluation of biological quality elements.
5. Conclusions
Within the framework of the research program entitled “Eye4water” (https://eye4water.com, accessed on 20 February 2021), an investigation of water quality and trophic status was conducted in two relatively understudied river systems situated in northern Greece. Results revealed noticeable impacts on water quality, possibly attributable to anthropogenic activities. Specifically, the Laspias River demonstrated “poor” and “bad” water quality status for the majority of monitored parameters. The river received high organic loads, as indicated by the determined BOD5 and COD concentrations, which were above the EU and national legislative limits. Furthermore, the Lissos River showed “good” and “excellent” water quality for most of the examined parameters, with the exception of sampling point 11, where major organic pollution was observed. Notably, in the vicinity of the deltaic zone, the intrusion of seawater was evident from the increased EC and ion concentrations. “Bad” conditions were noted for all nitrogenous compounds (nitrates, nitrites, and ammonium), as a possible consequence of the intense agricultural activity taking place in the area.
The coastal zones of the two watersheds were characterized by high nutrients content. This may be attributed to the decomposition of seaweed covering the coastal zone. The trophic status could be classified as “moderate to poor” in the Laspias coastal zone and as “bad” status in the Lissos coastal zone.
Since the water quality in these rivers is significantly influenced by runoff from urban, agricultural, and industrial activities, the imperative for a change requires interventions to preserve water quality. Thus, sustainable solutions, like constructed wetlands or vegetated buffer strips, can be implemented to treat agricultural runoff prior to its release in the aquatic ecosystems. This nature-based approach constitutes an alternative and cost-effective solution that has been widely used for water pollution originating from agricultural activities [69,70,71]. Since both the Laspias and Lissos rivers are highly affected by agricultural runoff, these applications look rather promising in the field of water purification.
Supplementary Materials
The following supporting information can be downloaded at: https://www.mdpi.com/article/10.3390/w16020259/s1, Table S1: Physicochemical water quality parameters and pollutants in surface water (mean values ± standard deviations, min and max values) along Laspias River for the monitoring period (June 2021–January 2023); Table S2: Physicochemical water quality parameters and pollutants in surface water (mean values ± standard deviations, min and max values) along Lissos River for the monitoring period (June 2021–January 2023); Table S3: Physicochemical water quality parameters and pollutants in coastal water (mean values ± standard deviations, min and max values) along Laspias River for the monitoring period (June 2021–January 2023); Table S4: Physicochemical water quality parameters and pollutants in coastal water (mean values ± standard deviations, min and max values) along Lissos River for the monitoring period (June 2021–January 2023).
Author Contributions
Conceptualization, V.P., D.L., G.S., P.M., S.N., I.K. and C.S.A.; Methodology, V.P., K.A.B., C.N., D.L., N.K., K.Z., M.Z., A.M., K.A., N.I., G.S., P.M., S.N., I.K. and C.S.A.; Software, V.P., C.N., D.L., N.K., N.I. and G.S.; Formal Analysis, V.P., K.A.B., C.N., D.L., N.I., G.S., P.M., S.N., I.K. and C.S.A.; Investigation, V.P., K.A.B., C.N., D.L., N.K., K.Z., M.Z., A.M., K.A., N.I. and C.S.A.; Data Curation, V.P., K.A.B., C.N., D.L. and N.I.; Writing—Original Draft Preparation, V.P., K.A.B., G.S. and C.S.A.; Writing—Review and Editing, V.P., K.A.B., C.N., D.L., N.K., K.Z., M.Z., A.M., K.A., N.I., G.S., P.M., S.N., I.K. and C.S.A.; Visualization, V.P., K.A.B. and N.I; Supervision, V.P., D.L., G.S., P.M., S.N., I.K. and C.S.A. All authors have read and agreed to the published version of the manuscript.
Funding
This study was produced for the Eye4Water project, MIS 5047246, and implemented under the action “Support for Research Infrastructure and Innovation” by the operational program “Competitiveness, Entrepreneurship and Innovation” in the framework of the European Regional Development Fund co-financed by Greece and the European Union.
Data Availability Statement
Data is contained within the article.
Conflicts of Interest
The authors declare no conflict of interest.
References
- Aldrees, A.; Javed, M.F.; Bakheit Taha, A.T.; Mustafa Mohamed, A.; Jasiński, M.; Gono, M. Evolutionary and ensemble machine learning predictive models for evaluation of water quality. J. Hydrol. Reg. Stud. 2023, 46, 101331. [Google Scholar] [CrossRef]
- Taş, B.; Tepe, Y.; Ustaoğlu, F.; Alptekin, S. Benthic algal diversity and water quality evaluation by biological approach of Turnasuyu Creek, NE Turkey. DWT 2019, 155, 402–415. [Google Scholar] [CrossRef]
- Ustaoğlu, F.; Taş, B.; Tepe, Y.; Topaldemir, H. Comprehensive assessment of water quality and associated health risk by using physicochemical quality indices and multivariate analysis in Terme River, Turkey. Environ. Sci. Pollut. Res. 2021, 28, 62736–62754. [Google Scholar] [CrossRef] [PubMed]
- Gholizadeh, M.; Melesse, A.; Reddi, L. A Comprehensive Review on Water Quality Parameters Estimation Using Remote Sensing Techniques. Sensors 2016, 16, 1298. [Google Scholar] [CrossRef] [PubMed]
- Xu, S.; Zhou, S.; Xing, L.; Shi, P.; Shi, W.; Zhou, Q.; Pan, Y.; Song, M.-Y.; Li, A. Fate of organic micropollutants and their biological effects in a drinking water source treated by a field-scale constructed wetland. Sci. Total Environ. 2019, 682, 756–764. [Google Scholar] [CrossRef] [PubMed]
- Adeniyi, A.G.; Ighalo, J.O. Biosorption of pollutants by plant leaves: An empirical review. J. Environ. Chem. Eng. 2019, 7, 103100. [Google Scholar] [CrossRef]
- Eletta, O.A.A.; Adeniyi, A.G.; Ighalo, J.O.; Onifade, D.V.; Ayandele, F.O. Valorisation of Cocoa (Theobroma cacao) pod husk as precursors for the production of adsorbents for water treatment. Environ. Technol. Rev. 2020, 9, 20–36. [Google Scholar] [CrossRef]
- United Nations. Water Quality and Sanitation; United Nations: New York, NY, USA, 2016. [Google Scholar]
- WFD. Directive of the European Parliament and of the Council 2000/60/EC Establishing a Framework for Community Action in the Field of Water Policy. Off. J. Eur. Communities 2000, C513, 1–72. [Google Scholar]
- Gikas, G.D.; Sylaios, G.K.; Tsihrintzis, V.A.; Konstantinou, I.K.; Albanis, T.; Boskidis, I. Comparative evaluation of river chemical status based on WFD methodology and CCME water quality index. Sci. Total Environ. 2020, 745, 140849. [Google Scholar] [CrossRef]
- Makrogianni, D.I.; Karapanos, I.C.; Passam, H.C. Seasonal Fluctuations in Pollen Production and Viability in Eggplant and the Quality of Seed-Containing and Seedless (Auxin-Set) Fruits. J. Plant Growth Regul. 2018, 37, 937–946. [Google Scholar] [CrossRef]
- Kumar, R.; Sinha, R.; Rakib, M.R.J.; Padha, S.; Ivy, N.; Bhattacharya, S.; Dhar, A.; Sharma, P. Microplastics pollution load in Sundarban delta of Bay of Bengal. J. Hazard. Mater. Adv. 2022, 7, 100099. [Google Scholar] [CrossRef]
- Everard, M. A socio-ecological framework supporting catchment-scale water resource stewardship. Environ. Sci. Policy 2019, 91, 50–59. [Google Scholar] [CrossRef]
- Flint, R.W. The sustainable Development of Water resources. Water Resour. Update 2004, 127, 48–59. [Google Scholar]
- Varol, M. Use of water quality index and multivariate statistical methods for the evaluation of water quality of a stream affected by multiple stressors: A case study. Environ. Pollut. 2020, 266, 115417. [Google Scholar] [CrossRef]
- Bilgin, A. Evaluation of surface water quality by using Canadian Council of Ministers of the Environment Water Quality Index (CCME WQI) method and discriminant analysis method: A case study Coruh River Basin. Environ. Monit. Assess. 2018, 190, 554. [Google Scholar] [CrossRef] [PubMed]
- Wenning, R.J.; Erickson, G.A. Interpretation and analysis of complex environmental data using chemometric methods. TrAC Trends Anal. Chem. 1994, 13, 446–457. [Google Scholar] [CrossRef]
- Akkoyunlu, A.; Akiner, M.E. Pollution evaluation in streams using water quality indices: A case study from Turkey’s Sapanca Lake Basin. Ecol. Indic. 2012, 18, 501–511. [Google Scholar] [CrossRef]
- Bordalo, A. Water quality and uses of the Bangpakong River (Eastern Thailand). Water Res. 2001, 35, 3635–3642. [Google Scholar] [CrossRef]
- Boyacioglu, H. Utilization of the water quality index method as a classification tool. Environ. Monit. Assess. 2010, 167, 115–124. [Google Scholar] [CrossRef]
- Shrestha, S.; Kazama, F. Assessment of surface water quality using multivariate statistical techniques: A case study of the Fuji river basin, Japan. Environ. Model. Softw. 2007, 22, 464–475. [Google Scholar] [CrossRef]
- Wang, X.; Yang, G.; Feng, Y.; Ren, G.; Han, X. Optimizing feeding composition and carbon–nitrogen ratios for improved methane yield during anaerobic co-digestion of dairy, chicken manure and wheat straw. Bioresour. Technol. 2012, 120, 78–83. [Google Scholar] [CrossRef]
- Bald, J.; Borja, A.; Muxika, I.; Franco, J.; Valencia, V. Assessing reference conditions and physico-chemical status according to the European Water Framework Directive: A case-study from the Basque Country (Northern Spain). Mar. Pollut. Bull. 2005, 50, 1508–1522. [Google Scholar] [CrossRef]
- Primpas, I.; Karydis, M. Scaling the trophic index (TRIX) in oligotrophic marine environments. Environ. Monit. Assess. 2011, 178, 257–269. [Google Scholar] [CrossRef] [PubMed]
- River Basin Management Plans; Environment Agency: Rotherham, UK, 2013.
- Gikas, G.D. Water quantity and hydrochemical quality monitoring of Laspias River, North Greece. J. Environ. Sci. Health Part A 2017, 52, 1312–1321. [Google Scholar] [CrossRef] [PubMed]
- Gikas, G.D.; Dimou, D.; Tsihrintzis, V.A. River water quantity and quality monitoring in an agricultural basin in north greece. Fresenius Environ. Bull. 2013, 22, 2006–2016. [Google Scholar]
- Baird, R.; Eaton, A.; Rice, E. Standard Methods for the Examination of Water and Wastewater, 23rd ed.; American Public Health Association: Washington, DC, USA, 2017. [Google Scholar]
- OECD. Eutrophication of Waters: Monitoring, Assessment and Control; Organization for Economic Cooperation and Development: Paris, France, 1982; pp. 75–85. [Google Scholar]
- Skoulikidis, N.T. Defining chemical status of a temporary Mediterranean River. J. Environ. Monit. 2008, 10, 842. [Google Scholar] [CrossRef] [PubMed]
- Skoulikidis, N.T.; Amaxidis, Y.; Bertahas, I.; Laschou, S.; Gritzalis, K. Analysis of factors driving stream water composition and synthesis of management tools—A case study on small/medium Greek catchments. Sci. Total Environ. 2006, 362, 205–241. [Google Scholar] [CrossRef]
- Cardoso, A.C.; Duchemin, J.; Magoarou, P.; Premazzi, G. Criteria for the Identification of Freshwater Subject to Eutrophication. Their Use for the Implementation of the “Nitrates” and Urban Waste Water Directives; EUR 19810 EN, EU—JRC, 87; Publications Office of the European Union: Luxembourg, 2001. [Google Scholar]
- CCME—Canadian Council of Ministers of the Environment. Canadian Water Quality Guidelines for the Protection of Aquatic Life: Water Quality Index User’s Manual; Excerpt from Publication No. 1299; CCME: Winnipeg, MB, Canada, 2001; ISBN 1-896997-34-1. [Google Scholar]
- Simboura, N.; Panayotidis, P.; Papathanassiou, E. A synthesis of the biological quality elements for the implementation of the European Water Framework Directive in the Mediterranean ecoregion: The case of Saronikos Gulf. Ecol. Indic. 2005, 5, 253–266. [Google Scholar] [CrossRef]
- Pavlidou, A.; Simboura, N.; Rousselaki, E.; Tsapakis, M.; Pagou, K.; Drakopoulou, P.; Assimakopoulou, G.; Kontoyiannis, H.; Panayotidis, P. Methods of eutrophication assessment in the context of the water framework directive: Examples from the Eastern Mediterranean coastal areas. Cont. Shelf Res. 2015, 108, 156–168. [Google Scholar] [CrossRef]
- Simboura, N.; Maragou, P.; Paximadis, G.; Kapiris, K.; Papadopoulos, V.P.; Sakellariou, D.; Pavlidou, A.; Hatzianestis, I.; Salomidi, M.; Arvanitidis, C. Greece. In World Seas: An Environmental Evaluation; Academic Press: Cambridge, MA, USA, 2019; pp. 227–260. [Google Scholar]
- Karydis, M. Eutrophication assessment of coastal waters based on indicators: A literature review. Glob. NEST J. 2013, 11, 373–390. [Google Scholar] [CrossRef]
- Borja, Á.; Franco, J.; Valencia, V.; Bald, J.; Muxika, I.; Jesús Belzunce, M.; Solaun, O. Implementation of the European water framework directive from the Basque country (northern Spain): A methodological approach. Mar. Pollut. Bull. 2004, 48, 209–218. [Google Scholar] [CrossRef]
- Alkarkhi, A.F.M.; Alqaraghuli, W.A.A. Discriminant Analysis and Classification. In Discriminant Analysis and Classification; Academic Press: London, UK, 2019; pp. 161–175. [Google Scholar]
- IBM Corp. IBM SPSS Statistics for Windows, Version 28.0; Released 2021; IBM Corp: Armonk, NY, USA, 2021. [Google Scholar]
- Wei, T.; Simko, V. R Package “Corrplot”: Visualization of a Correlation Matrix; Version 0.84; 2017. Available online: https://github.com/taiyun/corrplot (accessed on 15 February 2022).
- Clarke, K.R. and Gorley, R.N. PRIMER v6: User Manual/Tutorial (Plymouth Routines in Multivariate Ecological Research); PRIMER-E: Plymouth, UK, 2006. [Google Scholar]
- Clarke, K.; Warwick, R.M. Change in Marine Communities: An Approach to Statistical Analysis and Interpretation; Primer-E, Ltd.: Plymouth, UK, 2001. [Google Scholar]
- Clarke, K.R.; Gorley, R.N.; Somerfield, P.J.; Warwick, R.M. Change in Marine Communities: An Approach to Statistical Analysis and Interpretation, 3rd ed.; PRIMER-E Ltd.: Plymouth, UK, 2014. [Google Scholar]
- EU. Directive 2006/44/EC of the European Parliament and of the Council of 6 September 2006 on the quality of fresh waters needing protection or improvement in order to support fish life. Off. J. Eur. Union 2006, L 264, 20–31. [Google Scholar]
- Commission of the European Communities (CEC). Implementation of Council Directive 91/271/ECConcerning Urban Wastewater Treatment–Summary of the Measures Implemented by the Member States and Assessment of the Information Received Pursuant to Articles 17 and 13 of the Directive; COM(98)775final 1999; European Commission: Luxembourg, 1999. [Google Scholar]
- Chapman, D.V. (Ed.) Water Quality Assessments: A Guide to the Use of Biota, Sediments and Water in Environmental Monitoring, 2nd ed.; E & FN Spon: London, UK, 1996; ISBN 978-0-419-21590-5. [Google Scholar]
- Gikas, G.D.; Lergios, D.; Tsihrintzis, V.A. Comparative Assessment of the Application of Four Water Quality Indices (WQIs) in Three Ephemeral Rivers in Greece. Water 2023, 15, 1443. [Google Scholar] [CrossRef]
- Pedreira, R.; Kallioras, A.; Pliakas, F.; Gkiougkis, I.; Schuth, C. Groundwater vulnerability assessment of a coastal aquifer system at River Nestos eastern Delta, Greece. Environ. Earth Sci. 2015, 73, 6387–6415. [Google Scholar] [CrossRef]
- Xeidakis, G.S.; Delimani, P. Coastal erosion problems in Northern Aegean coastline, Greece. The case of the Rhodope Prefecture coasts. Coast. Environ. 2002, 58, 152–159. [Google Scholar]
- Pliakas, F.; Mouzaliotis, A.; Kallioras, A.; Diamantis, I. Hydrogeological Assessment of the Salinization Problem of Xilagani–Imeros Aquifer System in Sw Plain Area of Rhodope Prefecture, Greece. Geosociety 2007, 40, 536. [Google Scholar] [CrossRef]
- Cude, C.G. Oregon Water Quality Index a Tool for Evaluating Water Quality Management Effectiveness. J. Am. Water Resour. Assoc. 2001, 37, 125–137. [Google Scholar] [CrossRef]
- Perrin, J.-L.; Salles, C.; Bancon-Montigny, C.; Raïs, N.; Chahinian, N.; Dowse, L.; Rodier, C.; Tournoud, M.-G. Comparison of index systems for rating water quality in intermittent rivers. Environ. Monit. Assess. 2018, 190, 70. [Google Scholar] [CrossRef]
- Hamlat, A.; Guidoum, A.; Koulala, I. Status and trends of water quality in the Tafna catchment: A comparative study using water quality indices. J. Water Reuse Desalination 2017, 7, 228–245. [Google Scholar] [CrossRef]
- Palma, P.; Fialho, S.; Lima, A.; Mourinha, C.; Penha, A.; Novais, M.H.; Rosado, A.; Morais, M.; Potes, M.; Costa, M.J.; et al. Land-Cover Patterns and Hydrogeomorphology of Tributaries: Are These Important Stressors for the Water Quality of Reservoirs in the Mediterranean Region? Water 2020, 12, 2665. [Google Scholar] [CrossRef]
- Viaroli, P.; Nizzoli, D.; Pinardi, M.; Soana, E.; Bartoli, M. Eutrophication of the Mediterranean Sea: A watershed—Cascading aquatic filter approach. Rend. Fis. Acc. Lincei 2015, 26, 13–23. [Google Scholar] [CrossRef]
- Skoulikidis, N.T.; Karaouzas, I.; Amaxidis, Y.; Lazaridou, M. Impact of EU Environmental Policy Implementation on the Quality and Status of Greek Rivers. Water 2021, 13, 1858. [Google Scholar] [CrossRef]
- Andreadakis, A.; Gavalakis, E.; Kaliakatsos, L.; Noutsopoulos, C.; Tzimas, A. The implementation of the Water Framework Directive (WFD) at the river basin of Anthemountas with emphasis on the pressures and impacts analysis. Desalination 2007, 210, 1–15. [Google Scholar] [CrossRef]
- Psaltopoulos, D.; Wade, A.J.; Skuras, D.; Kernan, M.; Tyllianakis, E.; Erlandsson, M. False positive and false negative errors in the design and implementation of agri-environmental policies: A case study on water quality and agricultural nutrients. Sci. Total Environ. 2017, 575, 1087–1099. [Google Scholar] [CrossRef]
- Ovezikoglou, V.; Ladakis, E.; Dassenakis, M.; Skoullos, M. Nitrogen, Phosphorus and Organic Carbon in Main Rivers of the Western Greece. Glob. NEST J. 2013, 5, 147–156. [Google Scholar] [CrossRef]
- Kotti, M.E.; Vlessidis, A.G.; Thanasoulias, N.C.; Evmiridis, N.P. Assessment of River Water Quality in Northwestern Greece. Water Resour Manag. 2005, 19, 77–94. [Google Scholar] [CrossRef]
- Skoulikidis, N.T. The environmental state of rivers in the Balkans—A review within the DPSIR framework. Sci. Total Environ. 2009, 407, 2501–2516. [Google Scholar] [CrossRef]
- Tsakiris, G. The Status of the European Waters in 2015: A Review. Environ. Process. 2015, 2, 543–557. [Google Scholar] [CrossRef]
- Papadaki, C.; Soulis, K.; Bellos, V.; Ntoanidis, L.; Dimitriou, E. Estimation of a Suitable Range of Discharges for the Development of Instream Flow Recommendations. Environ. Process. 2020, 7, 703–721. [Google Scholar] [CrossRef]
- Zacharias, I.; Liakou, P.; Biliani, I. A Review of the Status of Surface European Waters Twenty Years after WFD Introduction. Environ. Process. 2020, 7, 1023–1039. [Google Scholar] [CrossRef]
- Carvalho, L.; Mackay, E.B.; Cardoso, A.C.; Baattrup-Pedersen, A.; Birk, S.; Blackstock, K.L.; Borics, G.; Borja, A.; Feld, C.K.; Ferreira, M.T.; et al. Protecting and restoring Europe’s waters: An analysis of the future development needs of the Water Framework Directive. Sci. Total Environ. 2019, 658, 1228–1238. [Google Scholar] [CrossRef] [PubMed]
- Andricevic, R. Ecological quality assessment under uncertainty for transitional and coastal waters: Central Eastern Adriatic Sea study. Ecol. Indic. 2022, 138, 108850. [Google Scholar] [CrossRef]
- Santos, J.I.; Vidal, T.; Gonçalves, F.J.M.; Castro, B.B.; Pereira, J.L. Challenges to water quality assessment in Europe–Is there scope for improvement of the current Water Framework Directive bioassessment scheme in rivers? Ecol. Indic. 2021, 121, 107030. [Google Scholar] [CrossRef]
- Wang, M.; Zhang, D.; Dong, J.; Tan, S.K. Application of constructed wetlands for treating agricultural runoff and agro-industrial wastewater: A review. Hydrobiologia 2018, 805, 1–31. [Google Scholar] [CrossRef]
- Hsu, C.-Y.; Yan, G.-E.; Pan, K.-C.; Lee, K.-C. Constructed Wetlands as a Landscape Management Practice for Nutrient Removal from Agricultural Runoff—A Local Practice Case on the East Coast of Taiwan. Water 2021, 13, 2973. [Google Scholar] [CrossRef]
- Tang, Z.; Wood, J.; Smith, D.; Thapa, A.; Aryal, N. A Review on Constructed Treatment Wetlands for Removal of Pollutants in the Agricultural Runoff. Sustainability 2021, 13, 13578. [Google Scholar] [CrossRef]


Disclaimer/Publisher’s Note: The statements, opinions and data contained in all publications are solely those of the individual author(s) and contributor(s) and not of MDPI and/or the editor(s). MDPI and/or the editor(s) disclaim responsibility for any injury to people or property resulting from any ideas, methods, instructions or products referred to in the content. |
© 2024 by the authors. Licensee MDPI, Basel, Switzerland. This article is an open access article distributed under the terms and conditions of the Creative Commons Attribution (CC BY) license (https://creativecommons.org/licenses/by/4.0/).