You are currently viewing a new version of our website. To view the old version click .
Water
  • Article
  • Open Access

25 December 2023

Detection of Floating Objects on Water Surface Using YOLOv5s in an Edge Computing Environment

,
,
,
,
,
,
and
1
Henan Costar Group Co., Ltd., Nanyang 473000, China
2
College of Information Engineering, Henan University of Science and Technology, Luoyang 471000, China
3
Henan Engineering Research Center of Intelligent Processing for Big Data of Digital Image, School of Artificial Intelligence and Software Engineering, Nanyang Normal University, Nanyang 473061, China
4
State Key Laboratory of Networking and Switching Technology, Beijing University of Posts and Telecommunications, Beijing 100876, China
This article belongs to the Special Issue Eye4water—Strengthening the Water Management Practices (in EMT-R) through the Development of Innovative ICT Methodologies and Improvement of Research Infrastructures

Abstract

Aiming to solve the problems with easy false detection of small targets in river floating object detection and deploying an overly large model, a new method is proposed based on improved YOLOv5s. A new data augmentation method for small objects is designed to enrich the dataset and improve the model’s robustness. Distinct feature extraction network levels incorporate different coordinate attention mechanism pooling methods to enhance the effective feature information extraction of small targets and improve small target detection accuracy. Then, a shallow feature map with 4-fold down-sampling is added, and feature fusion is performed using the Feature Pyramid Network. At the same time, bilinear interpolation replaces the up-sampling method to retain feature information and enhance the network’s ability to sense small targets. Network complex algorithms are optimized to better adapt to embedded platforms. Finally, the model is channel pruned to solve the problem of difficult deployment. The experimental results show that this method has a better feature extraction capability as well as a higher detection accuracy. Compared with the original YOLOv5 algorithm, the accuracy is improved by 15.7%, the error detection rate is reduced by 83% in small target task detection, the detection accuracy can reach 92.01% in edge testing, and the inference speed can reach 33 frames per second, which can meet the real-time requirements.

1. Introduction

Water is one of the most crucial components of natural resources, with a total volume of approximately 1.4 billion cubic kilometers. However, only 2.5% of this is freshwater, and within freshwater, only 0.01% is suitable for human use []. Rivers are freshwater resources that are relatively easy for humans to use and are important in our lives. However, with the rapid development of industry and agriculture, the self-purification ability of river water ecosystems is being seriously damaged, and ecosystem imbalances occur [].
Water quality issues are a major challenge that humanity is facing in the twenty-first century []. With the accelerated process of urbanization, river water resources face contamination from various factors, such as heavy metals [], chemical agents [], plastic products [,], and more. Specifically, plastic waste entering water bodies through different pathways can result in the entanglement and ingestion of aquatic organisms, leading to death or reproductive issues among them. This, in turn, disrupts the entire aquatic ecosystem. Plastic waste can further degrade into microplastics [,,], adsorbing toxic substances and causing widespread water pollution, posing a serious threat to drinking water safety. In managed water bodies like ponds, lakes, and rivers, the survival of aquatic organisms, primarily fish, is a crucial indicator in the water management system. If dead fish are not removed in time, an ammonia reaction facilitated by microorganisms and various enzymes will occur. Pathogenic bacteria carried by the dead fish, along with lipids, spread throughout the water, posing a severe threat to aquatic life, water quality, and the surrounding drinking water safety []. Therefore, real-time monitoring of visible floating objects on the river surface significantly enhances the efficiency of timely detection and treatment by managers. This approach can reduce the negative impact of floating pollutants on organisms, fisheries, and tourism while minimizing the threat to drinking water safety.
With the traditional method, river managers usually manually inspect or view surveillance videos to confirm the type and location of floating objects. These methods demand substantial resources and are incapable of conducting 24 h uninterrupted real-time detection. Due to the diminutive size of certain floating objects, detection errors are prone to arise during manual monitoring processes. With the application of computer vision, many fields have rapidly developed, including face recognition [], autonomous driving [], and medical image processing []. For the detection of floating objects in a river, we can use target detection based on the CNN (Convolutional Neural Network, CNN). Target detection technology mainly realizes the localization of a target, which is classified into two- and one-stage algorithms. Feature extraction is used in the two-stage algorithm, and it then generates an RP (region proposal, RP) and locality regression. These representative algorithms are R-CNN [,], Faster R-CNN [,], and SPP-Net [], which are characterized by high accuracy. The one-stage algorithm performs localization regression directly after feature extraction. These representative algorithms are YOLO [,,], SSD (Single Shot MultiBox Detector, SSD) [,], and RetinaNet [], which are characterized by being fast. Many researchers have adopted different algorithms and targeted improvements according to unique business scenarios, with the main objective of improving detection accuracy or speed. In this paper, we adopt YOLOv5 [,] as the river drift detection algorithm. YOLOv5 has better accuracy and speed. This paper is dedicated to improving the detection effect of floating objects by improving YOLOv5. For target detection with CNN, a large number of the data samples are primary, and these samples are trained to continuously update the relevant weights to achieve better detection results. How to obtain more data that are valid samples with a limited number of datasets is the first problem we face. Then, for the specific context of the detection of floating objects on the water surface in this paper, surveillance cameras are often used to obtain data. The cameras are deployed at a certain distance from the river, and thus, more small targets are detected. Since small targets occupy fewer pixels in an image and contain less feature information, how to better extract feature information is one of the main problems that must be solved in this paper. Finally, the video transmission post-processing approach causes a certain delay, which is deployed using edge computing [,] in this paper. This limits the volume and computational capacities of the model due to the limited arithmetic power of the edge nodes.
Our main contributions in this article are as follows:
  • An enhanced coordinate attention mechanism is incorporated into the YOLOv5 feature extraction network, and the FPN (Feature Pyramid Network, FPN) is refined to strengthen the fusion capability of feature extraction.
  • The complex operators in the network are optimized for better adaptation to embedded platforms at the edge.
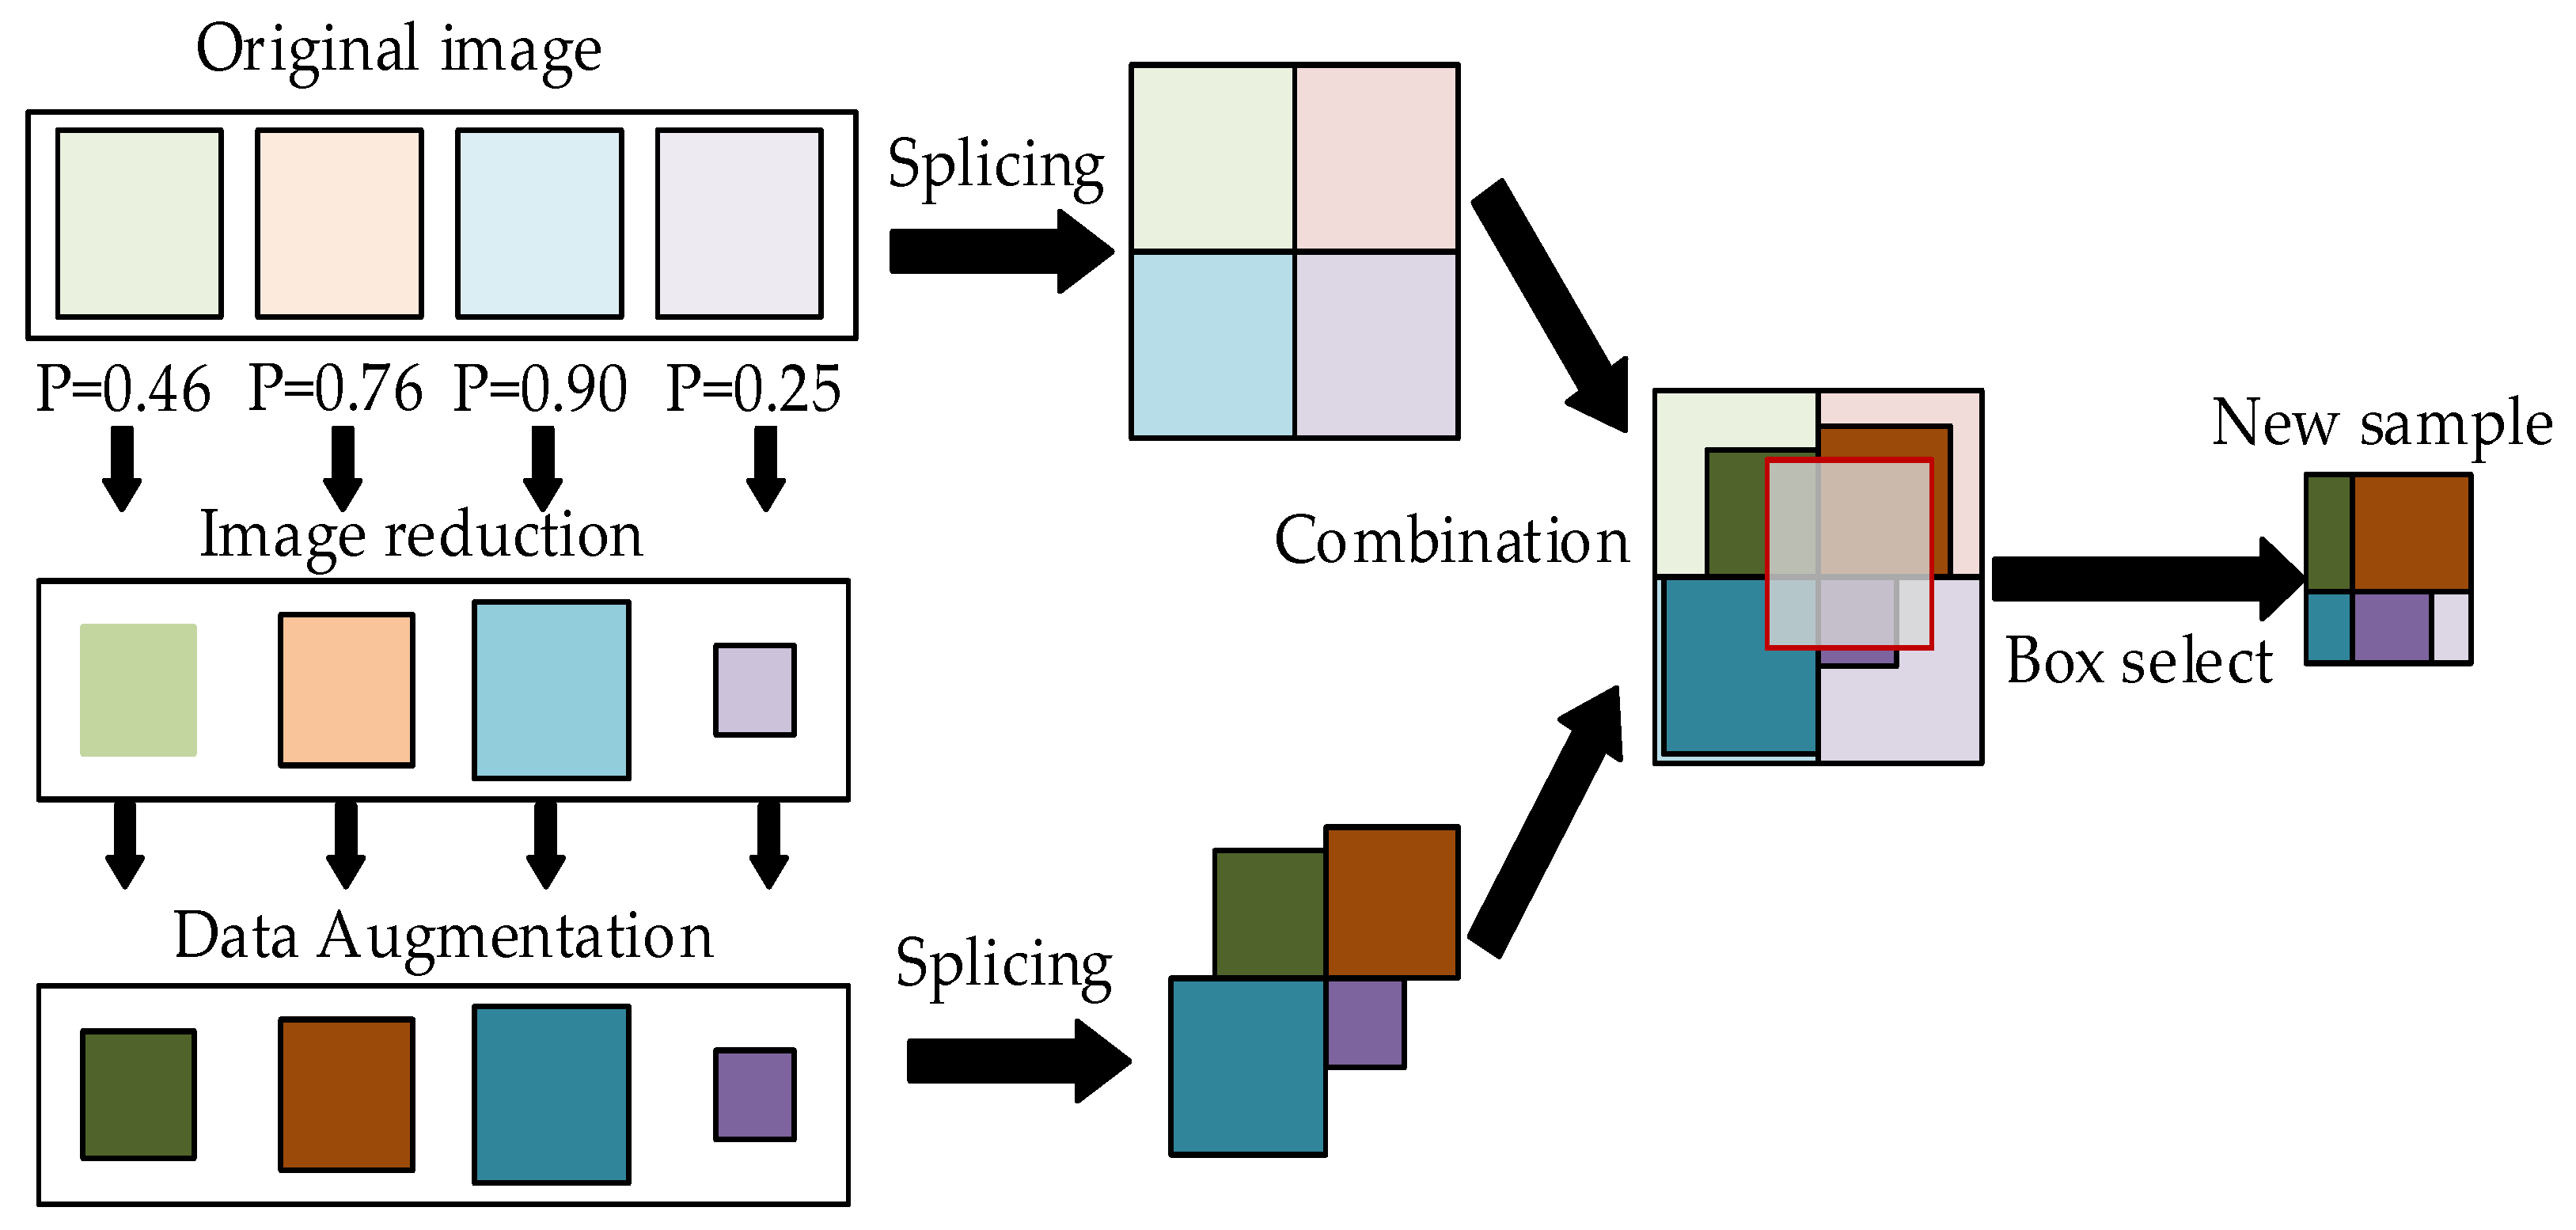
  • A small target data augmentation method based on Mosaic is introduced to the model. The model’s robustness is improved by adding data samples containing more small targets.
  • A channel-level pruning method is used to compress the model volume, which is then deployed in edge devices for testing.
  • Ablation experiments were performed to verify the effectiveness of the improved model, as well as to compare and analyze the performances of different models in an edge environment.
The remainder of this article is organized as follows. Section 2 summarizes the related work on target detection, in particular, surface floating object detection. Section 3 elucidates the original network architecture of YOLOv5 and the improved YOLOv5 network in this paper. Section 4 outlines the datasets and experimental environment employed in this study. Section 5 presents the metrics utilized for network performance evaluation, training outcomes, as well as experimental results and analyses. Section 6 provides a summary and discussion of desirable improvements in this domain and outlines future work.

3. Methods

3.1. Yolov5 Network Structure

The YOLOv5s model is among the smallest variants in terms of depth and width compared to other versions. The network structure is divided into four components: input, backbone, neck, and prediction. The YOLOv5s network structure is illustrated in Figure 1.
Figure 1. YOLOv5 network structure.
The input section primarily handles image scaling and normalization. The backbone comprises the Focus structure and CSP (Cross Stage Partial, CSP). YOLOv5 incorporates two CSP structures: CSP1_X in the backbone and CSP2_X in the neck. These structures enhance the model’s learning capability, allowing it to maintain accuracy while remaining lightweight. The neck utilizes an FPN + PAN (Pyramid Attention Network, PAN) structure. FPN employs a top-down approach, transmitting feature information from higher layers through up-sampling and fusion to generate feature maps for predictions. In contrast, PAN aggregates strong localization features from various backbone layers to different detection layers. GIOU (Generalized IoU, GIOU)_Loss serves as the bounding box loss function on the prediction side, based on IOU (Intersection over Union, IOU), addressing issues when bounding boxes lack overlap. In the post-processing phase of target detection, NMS (Non-Maximum Suppression, NMS) is employed to improve the recognition of targets with overlapping occlusion.

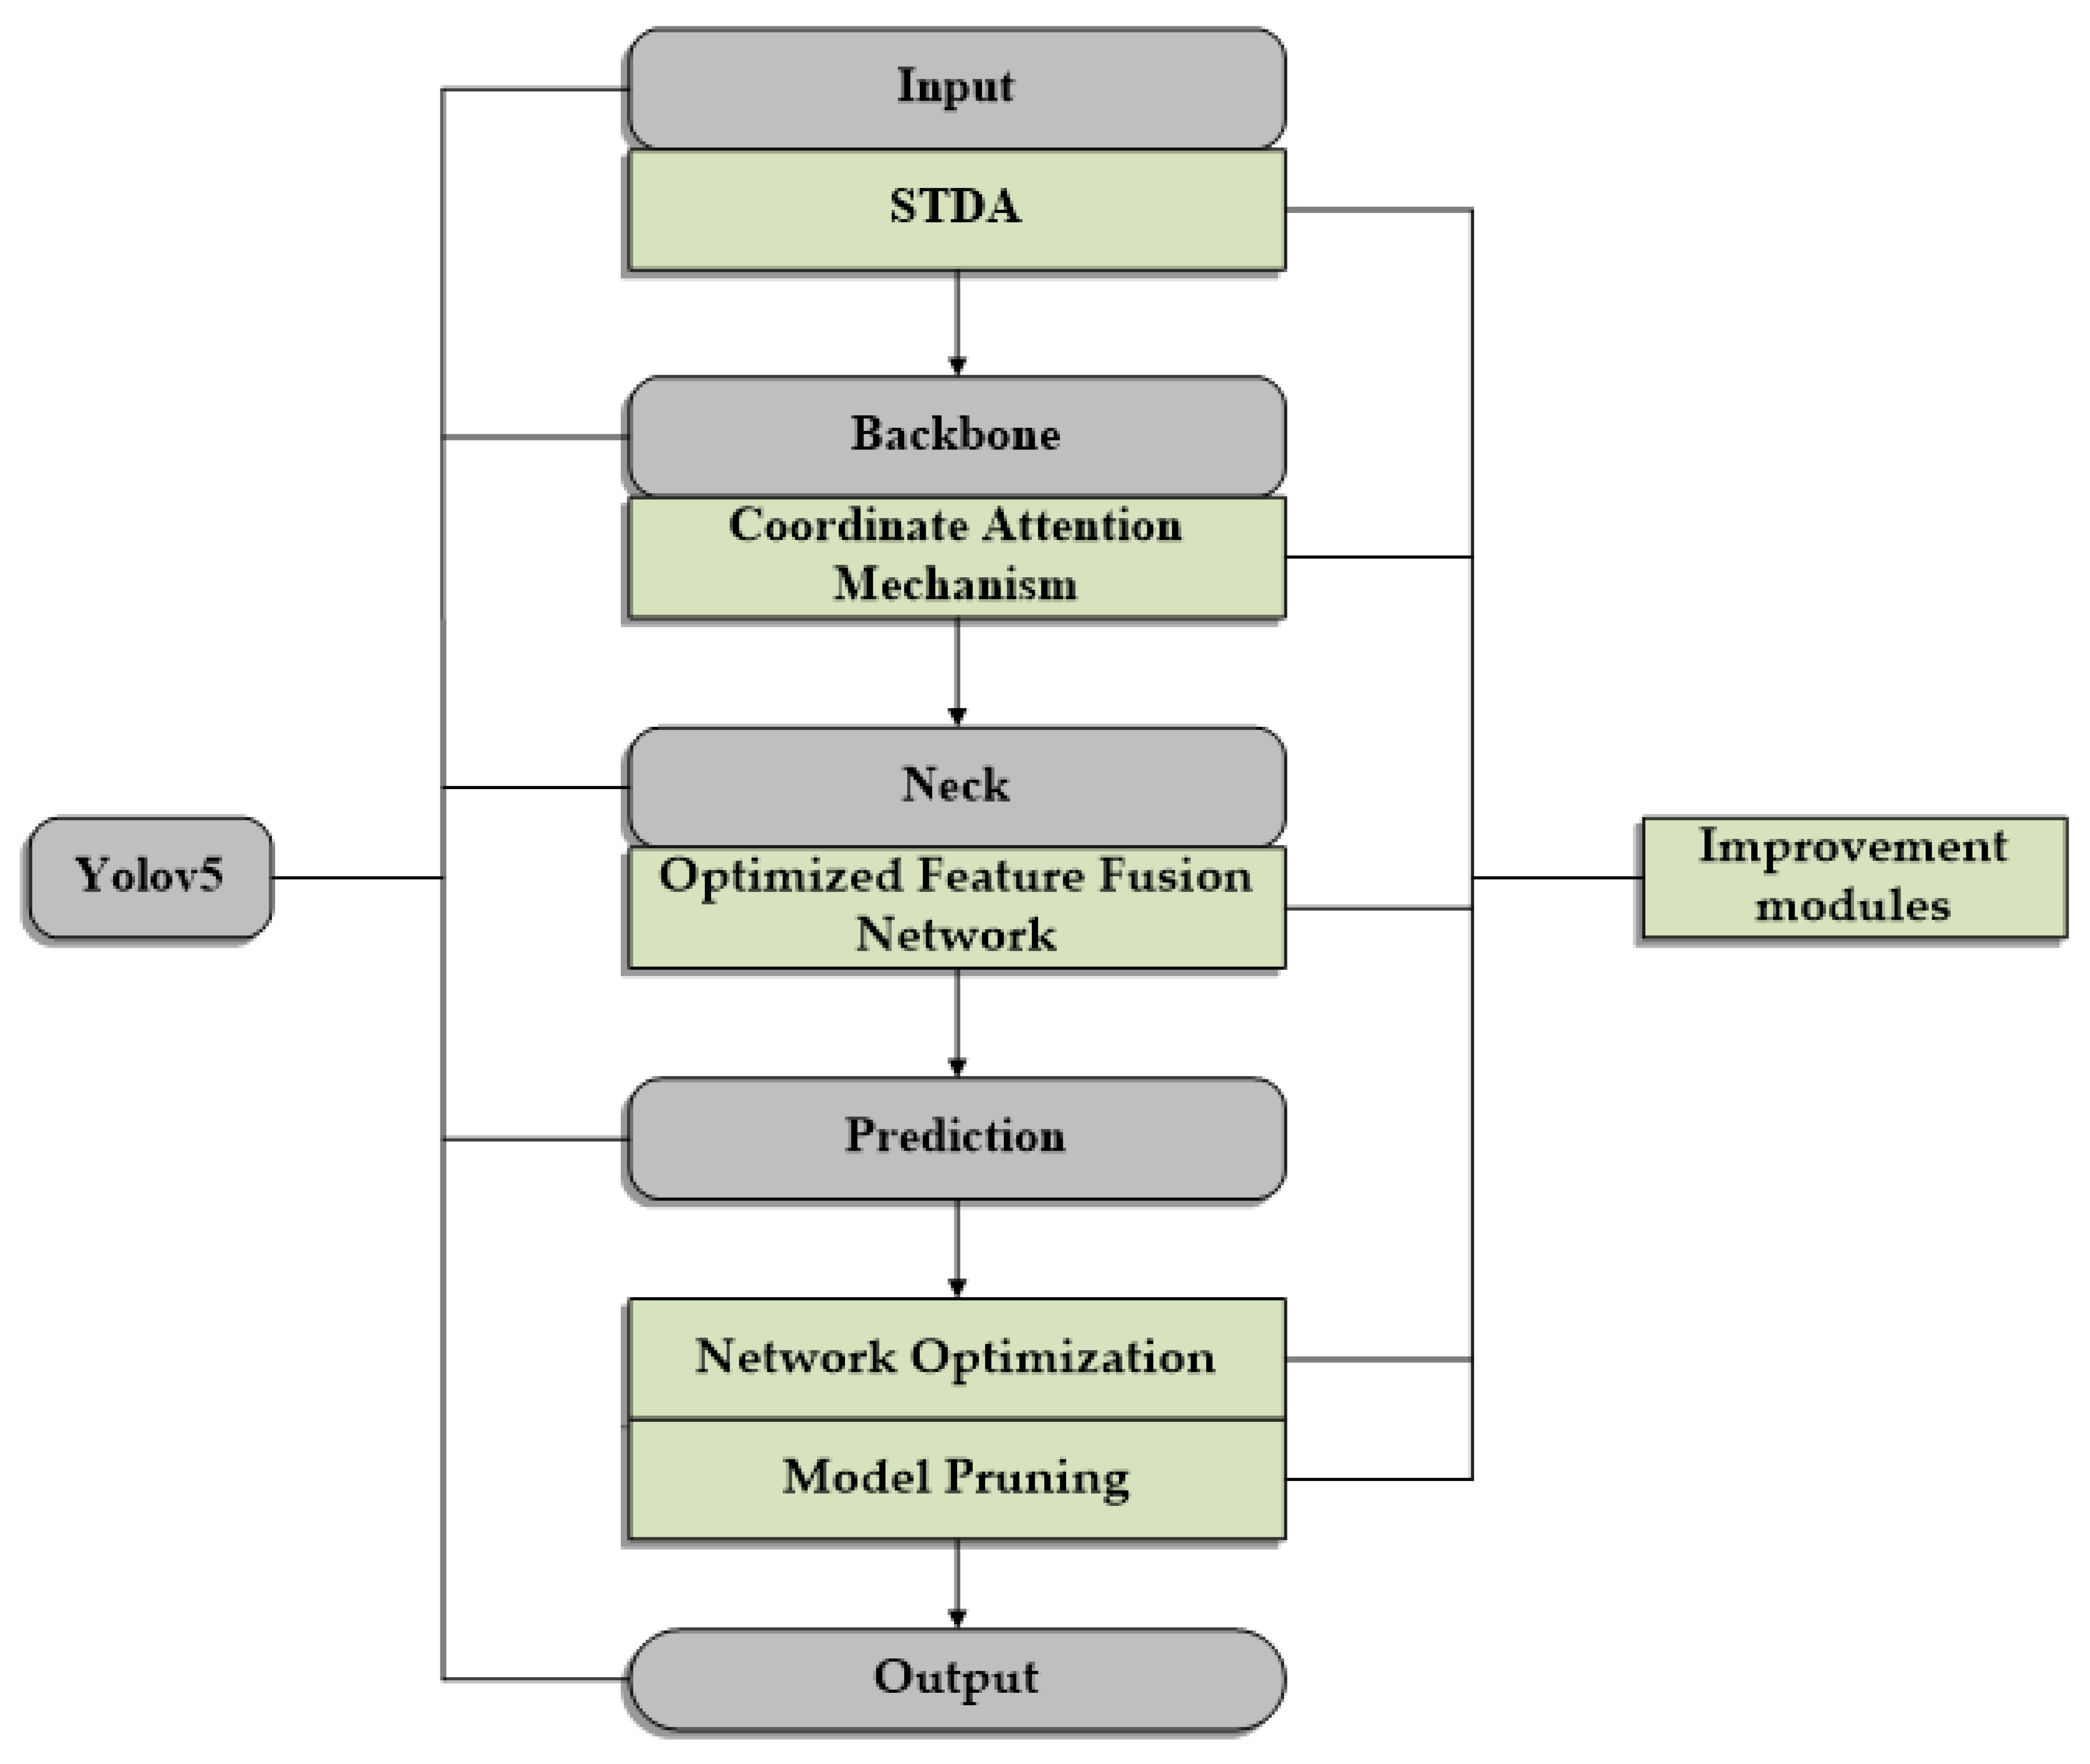
3.2. Improved YOLOv5 Network

The original YOLOv5 network is improved to identify floating debris in rivers. The improved YOLOv5 network flowchart is shown in Figure 2. A Small Target Data Augmentation module has been added to the input module of YOLOv5, providing a more complex background and more samples for the dataset. The coordinate attention mechanism is added in the Backbone module to reduce the interference of redundant information. Simultaneously, we enhance the original Feature Fusion Network of YOLOv5, improving the network’s capability to extract features from small targets. Additionally, to better suit embedded development platforms, optimizations and pruning of certain operators in the network are performed to enhance the detection capability when deploying the network at the edge. The specific description of the improved YOLOv5 network is as follows.
Figure 2. Improved YOLOv5 network flowchart.

3.2.1. Small Target Data Augmentation

Traditional data augmentation methods enhance the dataset by applying operations such as mirror flipping, scaling, and contrast enhancement to the images. The CutMix [] algorithm stitches two images before feeding them into the neural network for training. In addition, the Mosaic [] algorithm of YOLOv5s stitches four images so that the synthetic image contains multiple targets at different scales. To address the problem of small targets being easily missed and mistakenly detected in application scenarios, this paper proposes a data augmentation method, STDA (Small Target Data Augmentation, STDA), for small target training using the Mosaic algorithm. The STDA process [] is shown in Figure 3.
Figure 3. STDA process.
The procedure initiates with the fusion of four original images, followed by random scaling down and the application of data augmentation operations, such as flipping and merging. Subsequently, the two synthetic images are combined in a way that aligns their center points. Finally, a fixed-size selection box is utilized to extract the new sample. This newly created sample image encompasses a broader spectrum of small target classes and introduces a more intricate training context compared to the original image. Consequently, it facilitates effective training without requiring a large hyperparameter batch size, thereby enhancing the training efficiency of the network model and reducing computational overhead.

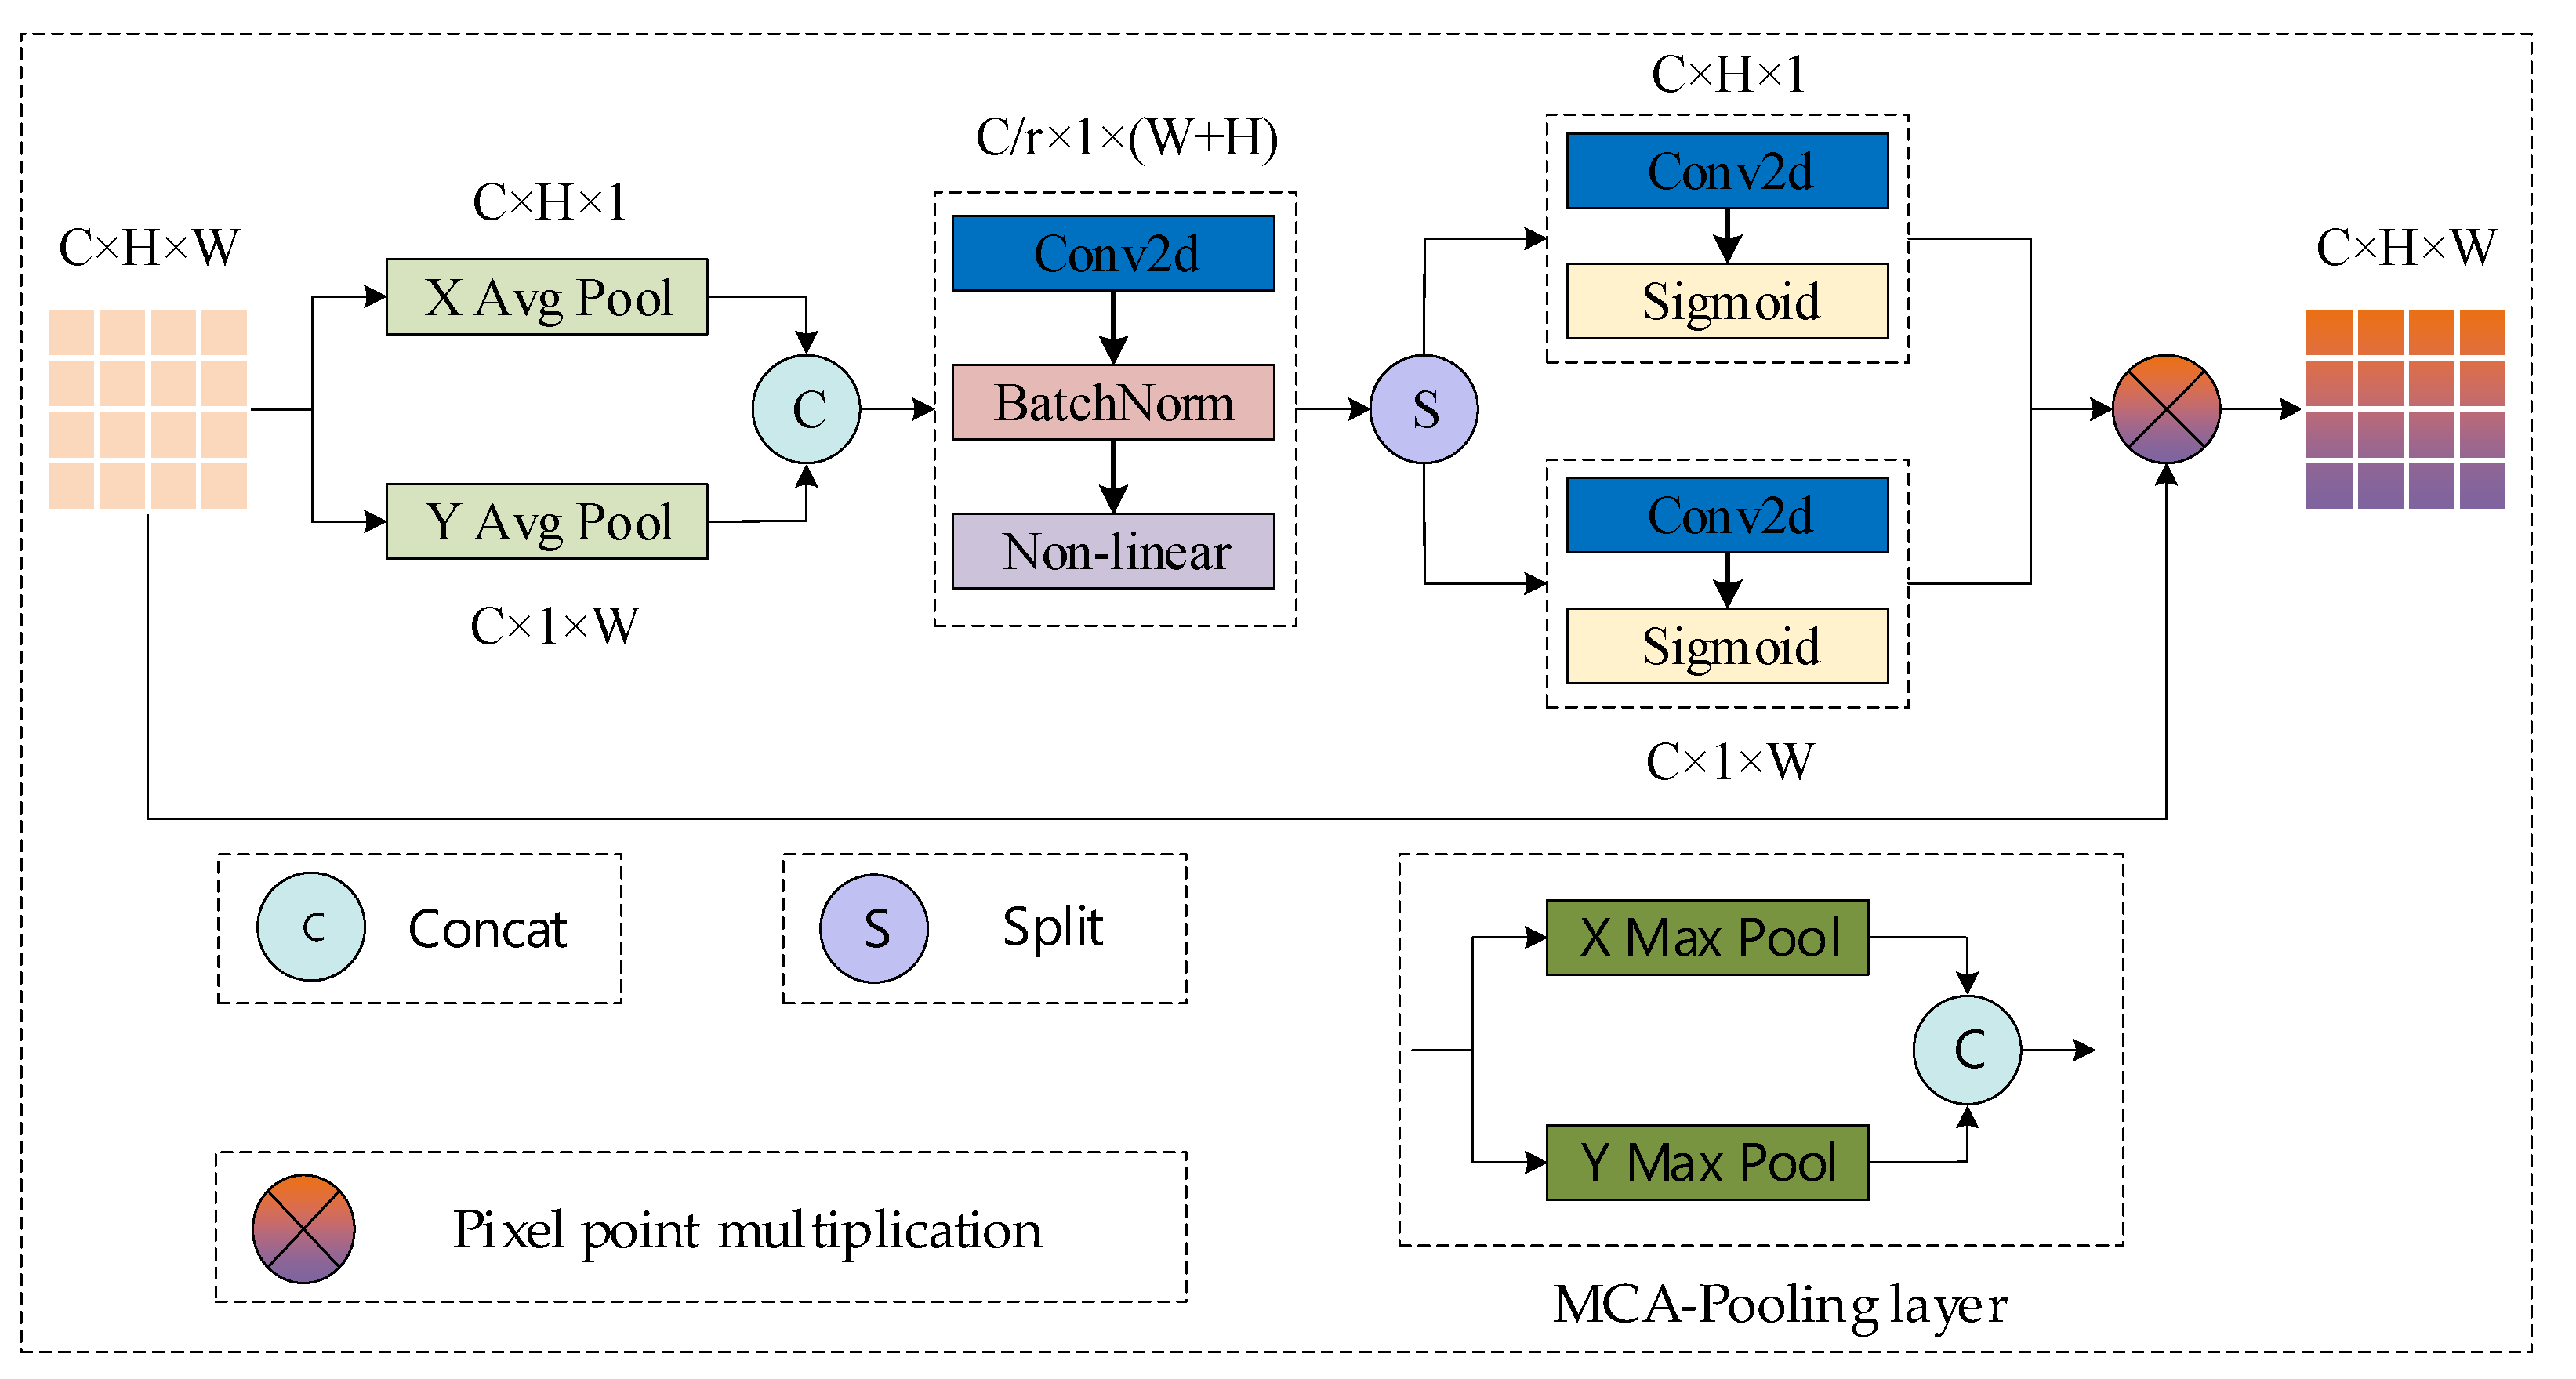
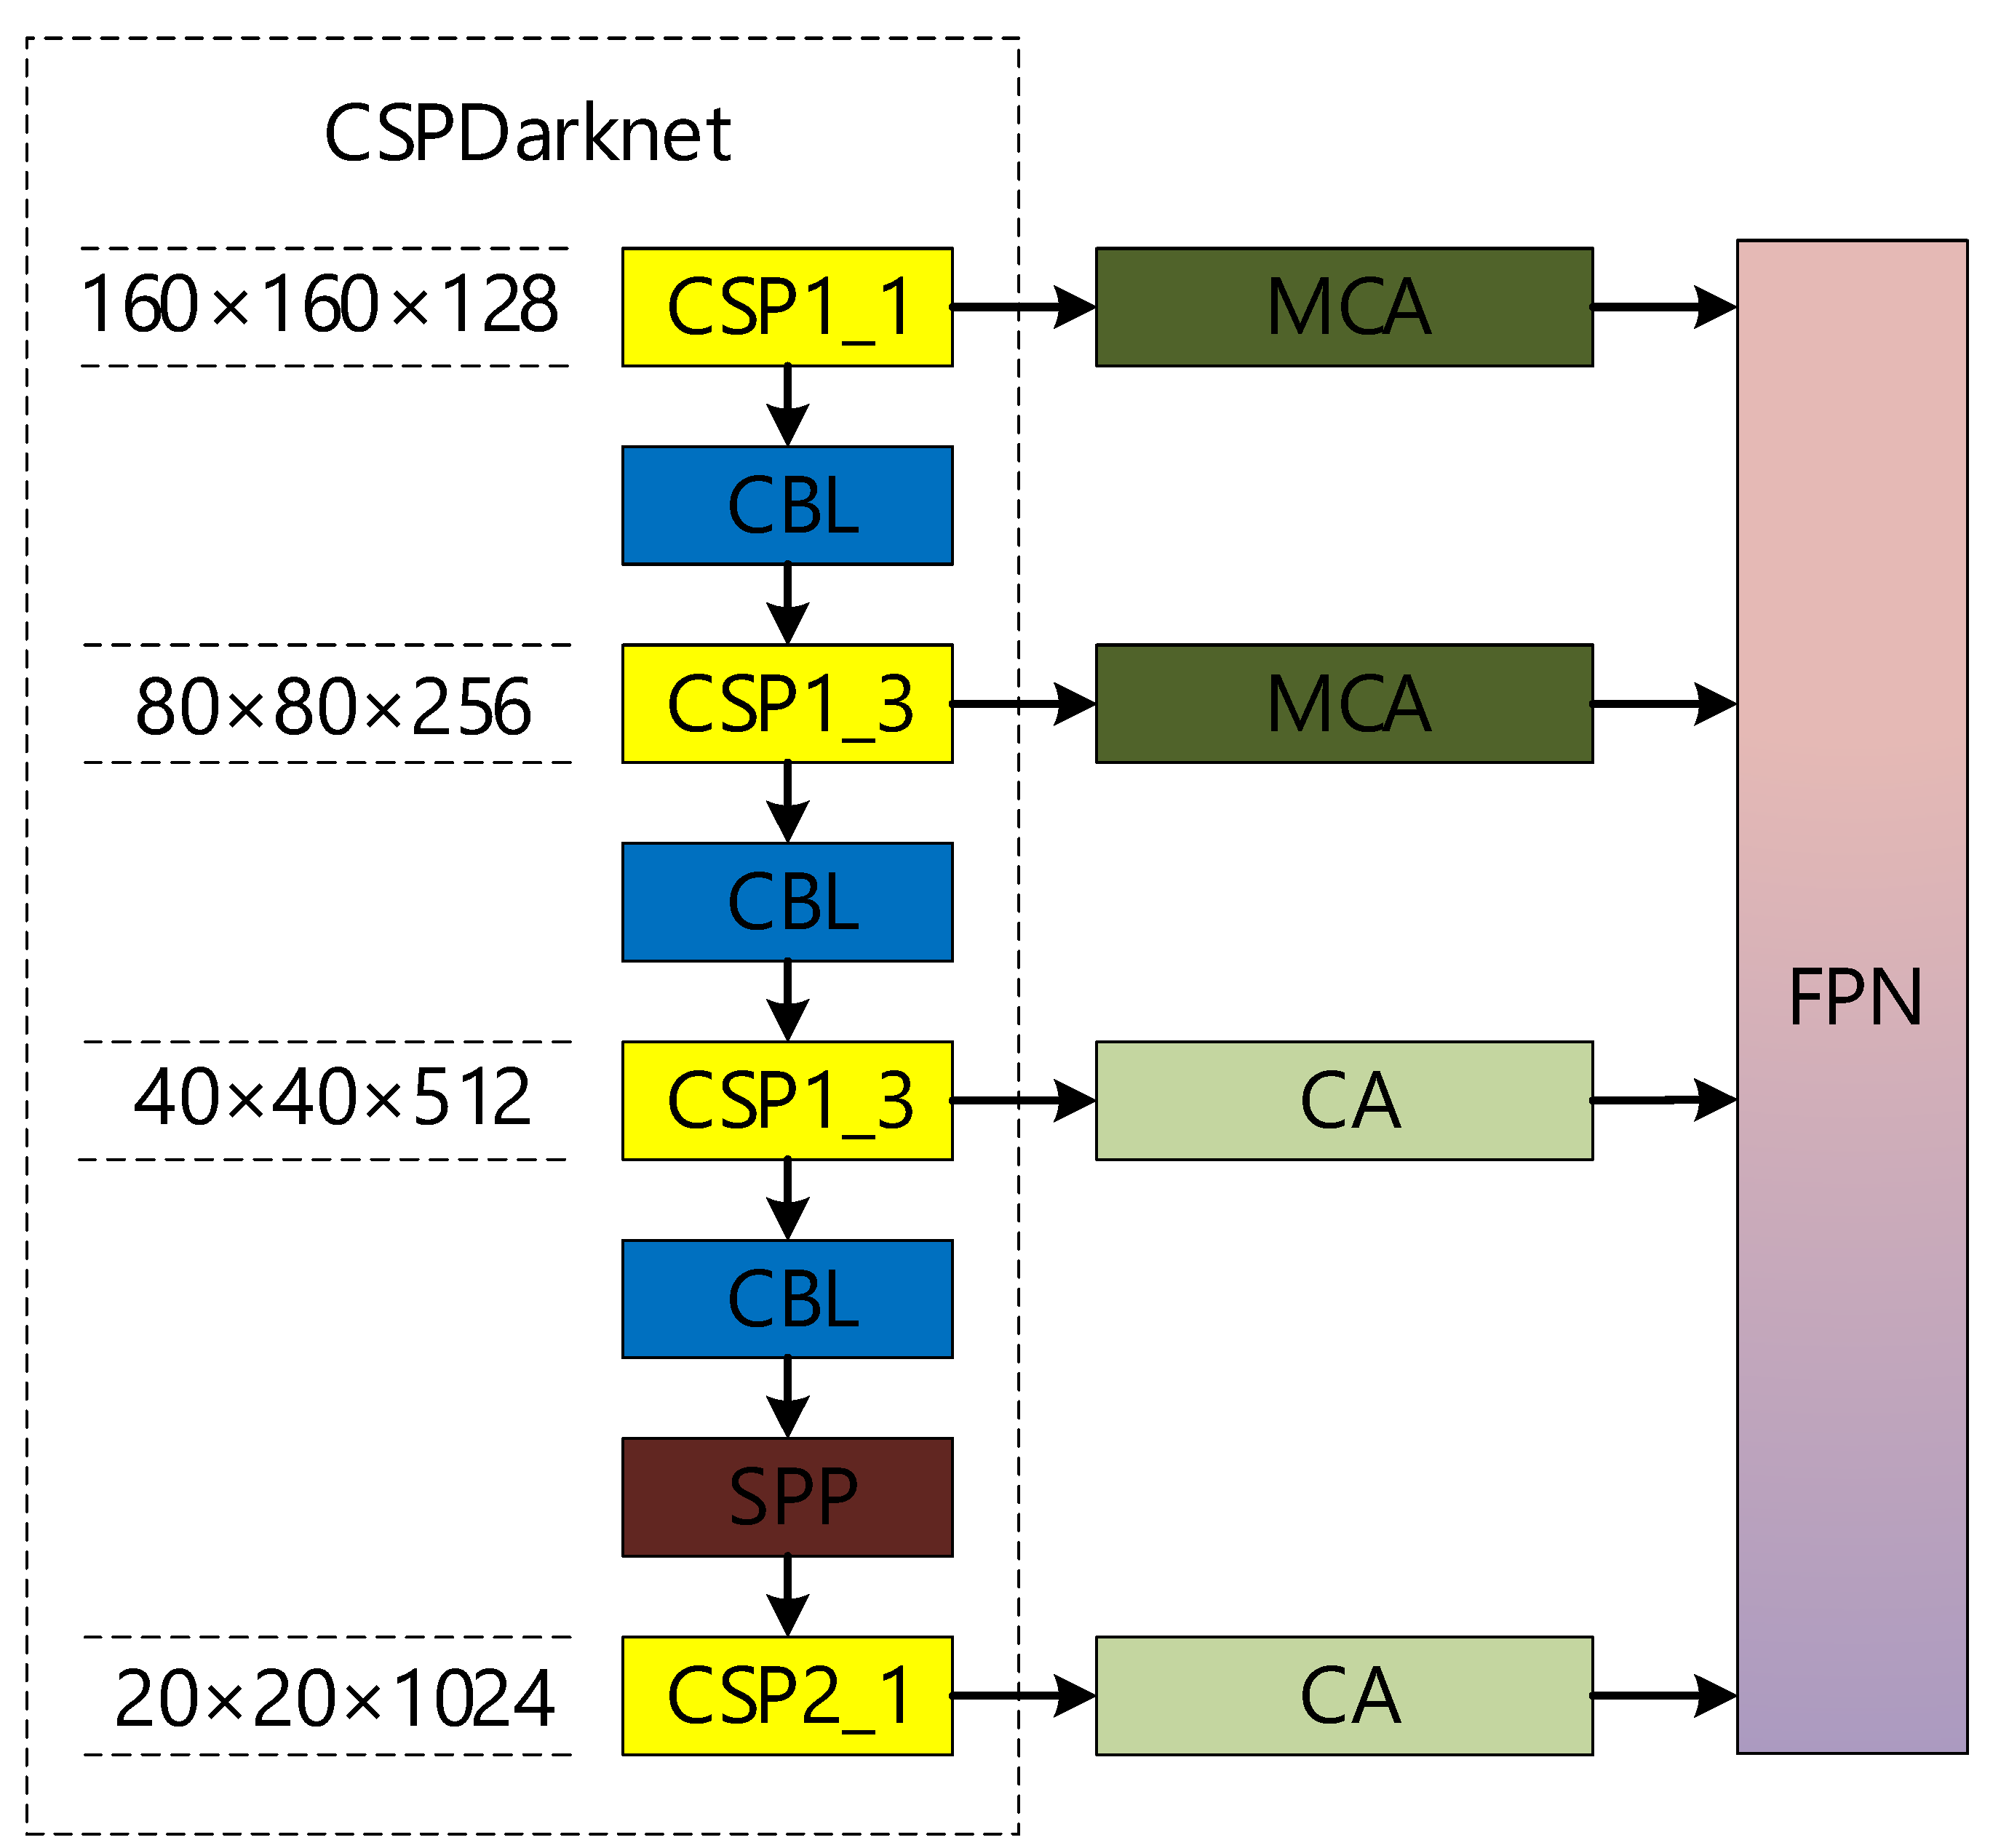
3.2.2. Feature Extraction Network Incorporating Coordinate Attention Mechanism

SE (Squeeze and Excitation, SE) [] and CBAM (Convolutional Block Attention Module, CBAM) [] are both widely used attention mechanisms. However, their fundamental idea revolves around the limitation of simple convolution operations in capturing long-range dependencies essential for visual tasks, as they primarily focus on processing local neighborhoods. The proposed CA (Coordinate Attention, CA) can effectively solve the above problems. The CA module aggregates the features and fuses them along horizontal and vertical directions, respectively, which not only captures remote dependencies, but also retains precise location information and can better capture the overall structural information of the target.
Although the targets at different scales are detected by extracting features at different levels using the YOLOv5s network, there are still problems, such as interference of complex backgrounds with feature extraction for the detection of river floaters. Therefore, to address the problem of small target floating objects in rivers containing less feature information and being easily disturbed by background factors, this paper proposes to incorporate the CA module in the feature extraction network CSP-Darknet of YOLOv5s. Since the shallow feature maps contain a lot of useless background information, the deep feature maps contain a lot of local feature target information. In this investigation, we adapt the pooling operation of the CA module to suit diverse layers of feature maps. This adaptation introduces a novel coordinate attention mechanism, denoted as MCA (Max-pooling Coordinate Attention, MCA), utilizing maximum pooling. The MCA pooling layer is shown in Figure 4.
Figure 4. CA structure diagram.
The CA module first embeds coordinate information along two-dimensional directions for feature map pooling encoding. For each channel xc of the input feature map X of dimension (C, H, W), a global averaging pooling operation is performed along the horizontal and vertical directions. Respectively, to obtain two one-dimensional feature codes, where C, H, and W denote the number of channels, the height, and the width of the feature map, and the pooling kernels of (H, 1) and (W, 1) are used in the horizontal (X-axis) and vertical (Y-axis) directions, respectively. The specific calculations are shown in Equations (1) and (2).
z c h ( h ) = 1 W 0 i < W x c ( h , i )
z c w ( w ) = 1 H 0 j < H x c ( j , w )
Using the concatenate mechanism, the row vector undergoes transposition, and is then concatenated with the column vector. This concatenated vector subsequently undergoes a series of operations, including 1 × 1 convolution, BN (Batch Normalization, BN), and nonlinear activation, adhering to scientific writing conventions. The 1 × 1 convolution operation is used for channel compression. The calculation is shown in Equation (3).
f = δ ( F 1 ( [ z h ; z w ] ) )
where [zh;zw] denotes the transposition, followed by splicing along the spatial dimension; δ represents the nonlinear activation function; F1 represents the convolutional transform function; and the generated f represents an intermediate feature mapping encoding both the horizontal and vertical directions.
Two feature vectors f h R C / r × H and f w R C / r × W , are split along the spatial dimension, and then 1 × 1 convolution and nonlinear activation operations are performed on these two feature vectors. The hyper-parameter r introduced here denotes the compression rate, and controls the depth of the output feature map by varying the number of convolution filters. Then, 1 × 1 convolution is used to adjust the number of channels in f h and f w , which are consistent with the input feature map X. The calculations are shown in Equations (4) and (5).
g h = σ ( F h ( f h ) )
g w = σ ( F w ( f w ) )
where F h and F w denote the convolutional transform functions of f h and f w , respectively, and σ denotes the Sigmoid activation functions. Finally, g h and g w are used as attention weights, which are multiplied by the corresponding channels of the input feature map X to generate the final attention-weighted feature map. The weighted calculation is shown in Equation (6).
y c ( i , j ) = x c ( i , j ) × g c h ( i ) × g c w ( j )
The YOLOv5 network builds an FPN by extracting three feature layers. Due to the high resolution of the feature map obtained by the shallow network, which contains rich, local information, it can capture more information about the small targets.
In this study, we introduce a feature extraction layer with dimensions (160, 160, 128) into the YOLOv5 network’s feature extraction module to enhance the detection of small targets. Then, the CA and MCA modules are inserted after each of the four feature layers, and the insertion positions are shown in Figure 5.
Figure 5. CA and MCA’s location in the network.

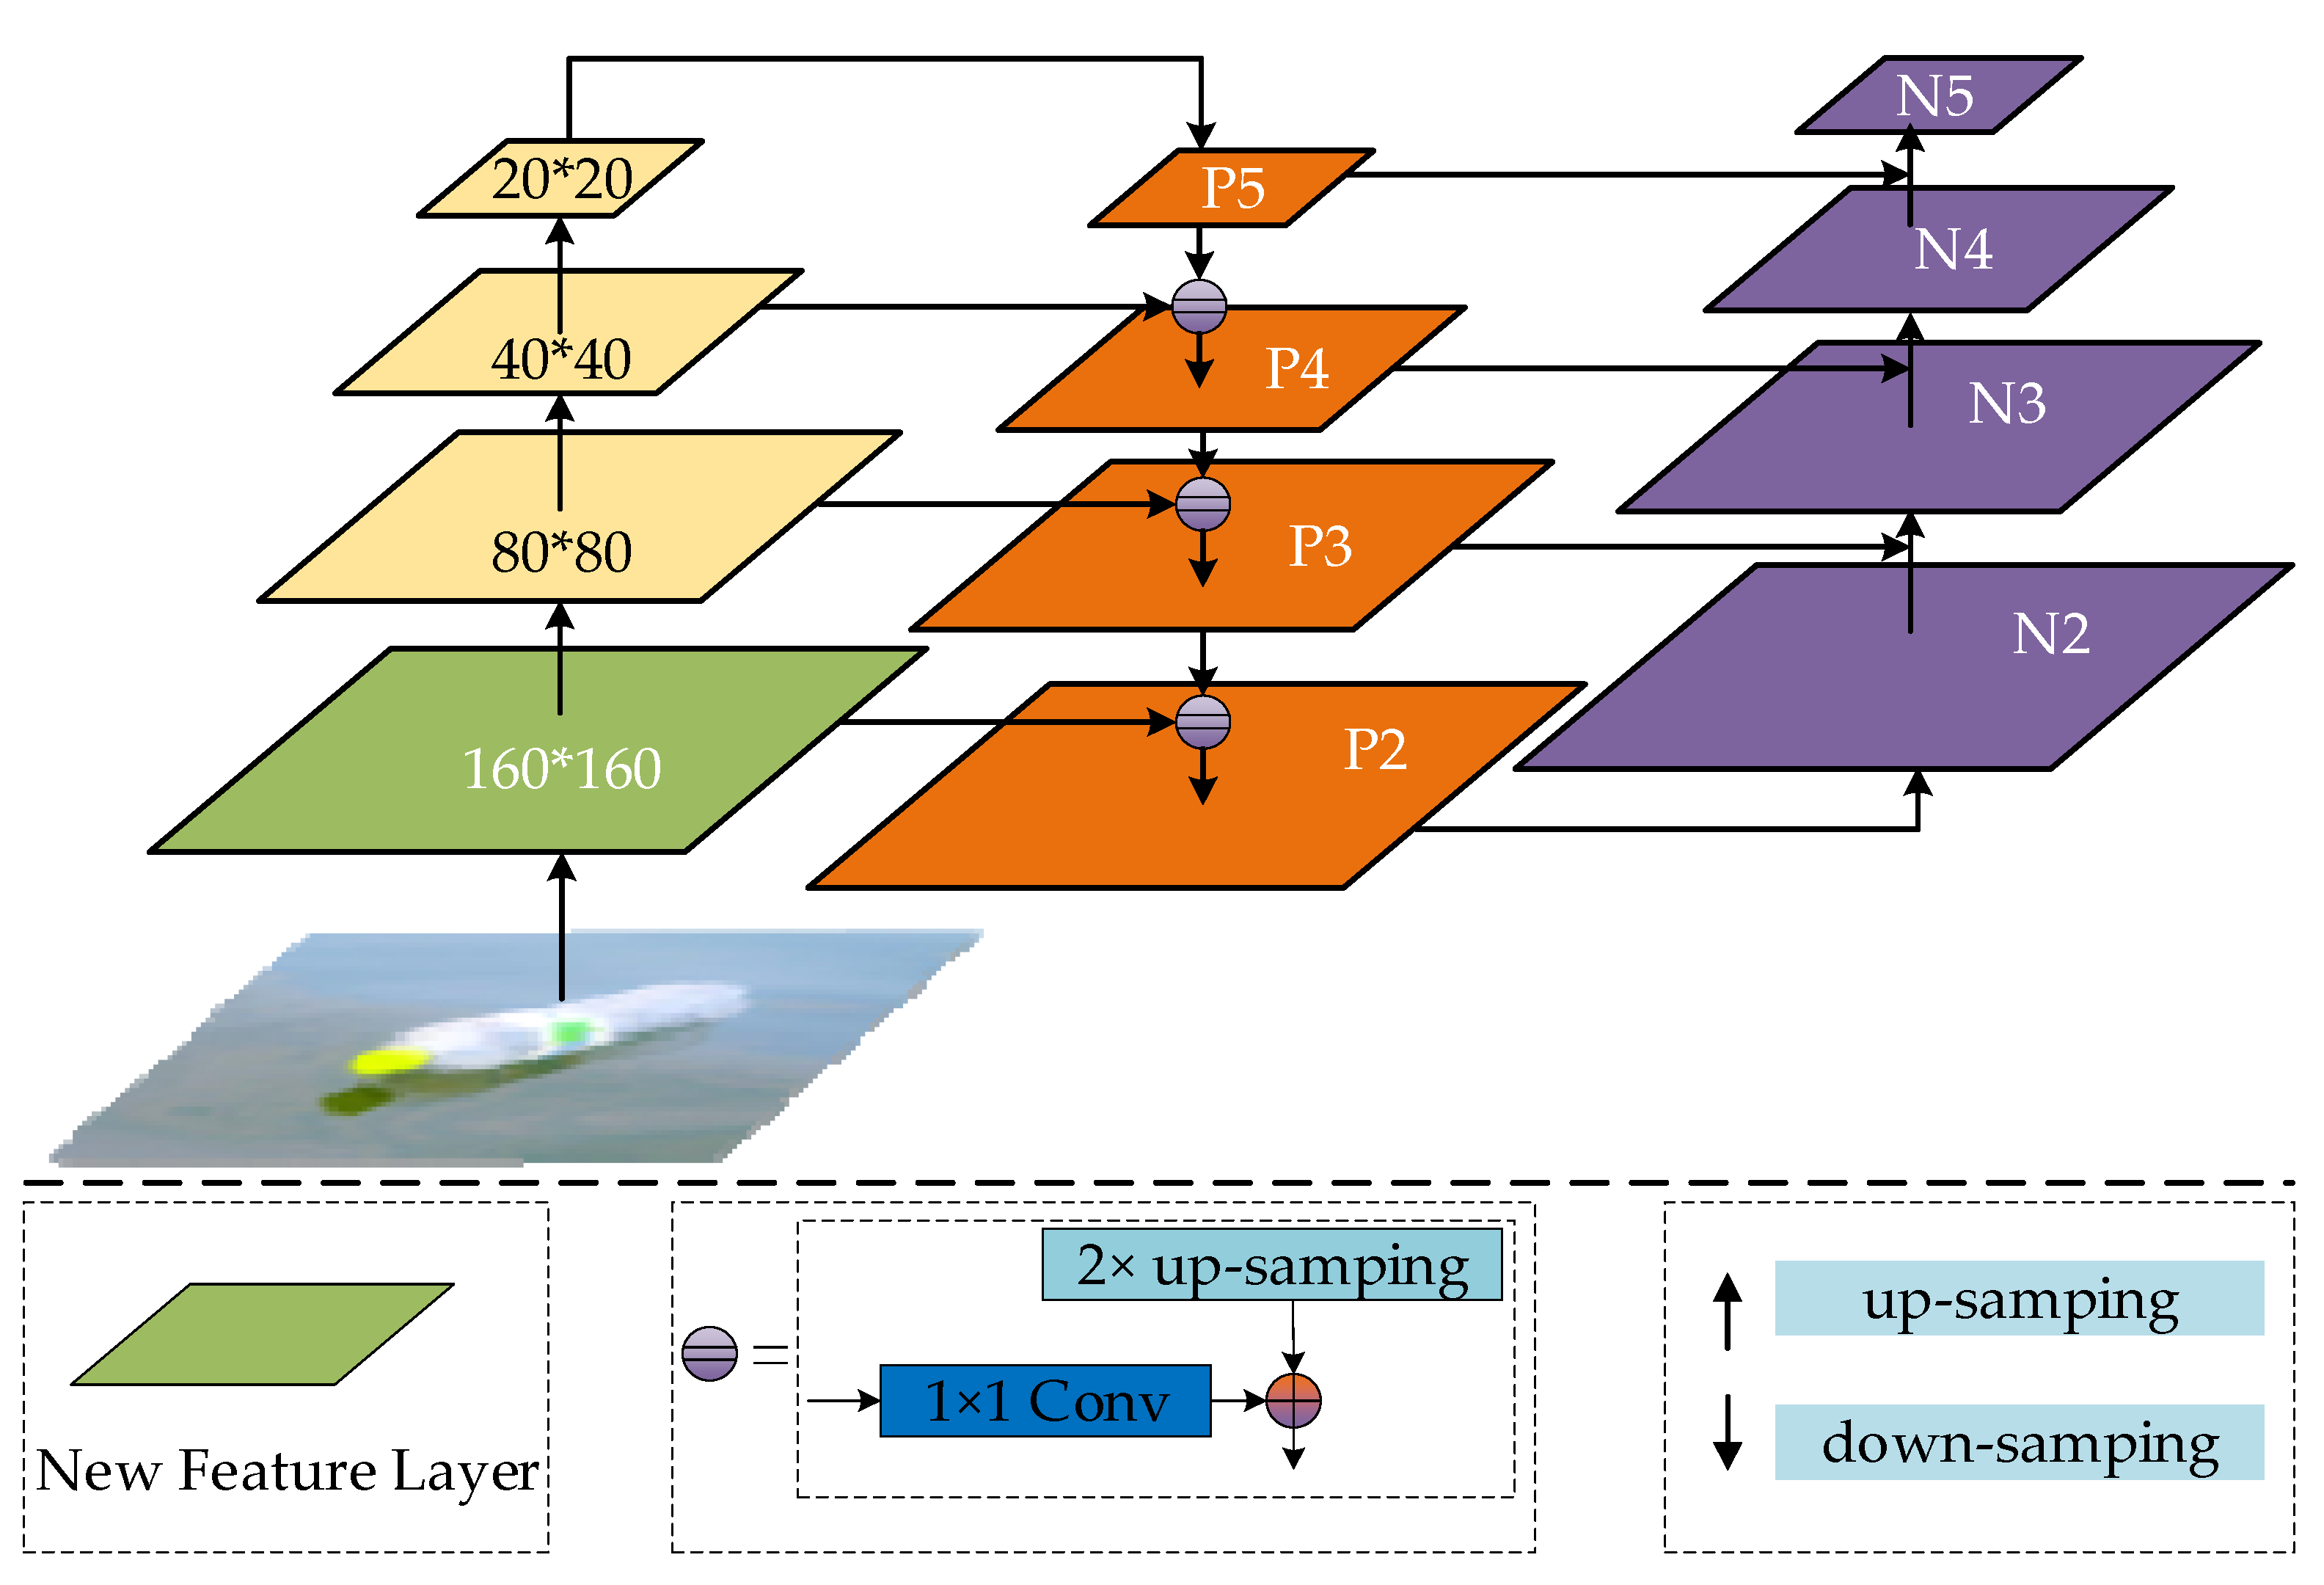
3.2.3. Optimized Feature Fusion Network

In CNN, different convolutional layers can extract different target feature information through convolutional operations. Integrating information from feature maps with varying scales is advantageous for distinguishing targets, effectively addressing the challenge of target scale variations, and enhancing the network’s detection performance. In the YOLOv5s network, the FPN transmits high-level semantic information in a top-down fashion. Additionally, a bottom-up pyramid is employed to convey location information, improving feature fusion across different layers and augmenting the network’s capacity to learn features.
For small target detection, an excessively high sampling rate can result in the loss of feature information, thereby affecting the detection effectiveness. In the previous subsection, we added a feature layer of size (160, 160, 128) to the feature extraction network. The 4× down-sampling rate retains more target feature information than the other high sampling rates do. As shown in Figure 6, we combine the added feature layer with the other three original feature layers to construct a new Feature Pyramid Network.
Figure 6. New feature pyramid structure.
The up-sampling operation in the FPN network uses the nearest-neighbor interpolation algorithm. Although this algorithm is simple, there are obvious mosaic and jagged phenomena, which cause a large reduction in image quality. However, this undoubtedly increases the difficulty of detection for small targets that occupy fewer pixel points. In this paper, we adopt the bilinear interpolation method instead of the nearest-neighbor interpolation method. The bilinear interpolation method considers the influence of correlation among the four surrounding neighboring points during the calculation process. This effectively addresses the limitation of discontinuous nearest-neighbor interpolation.

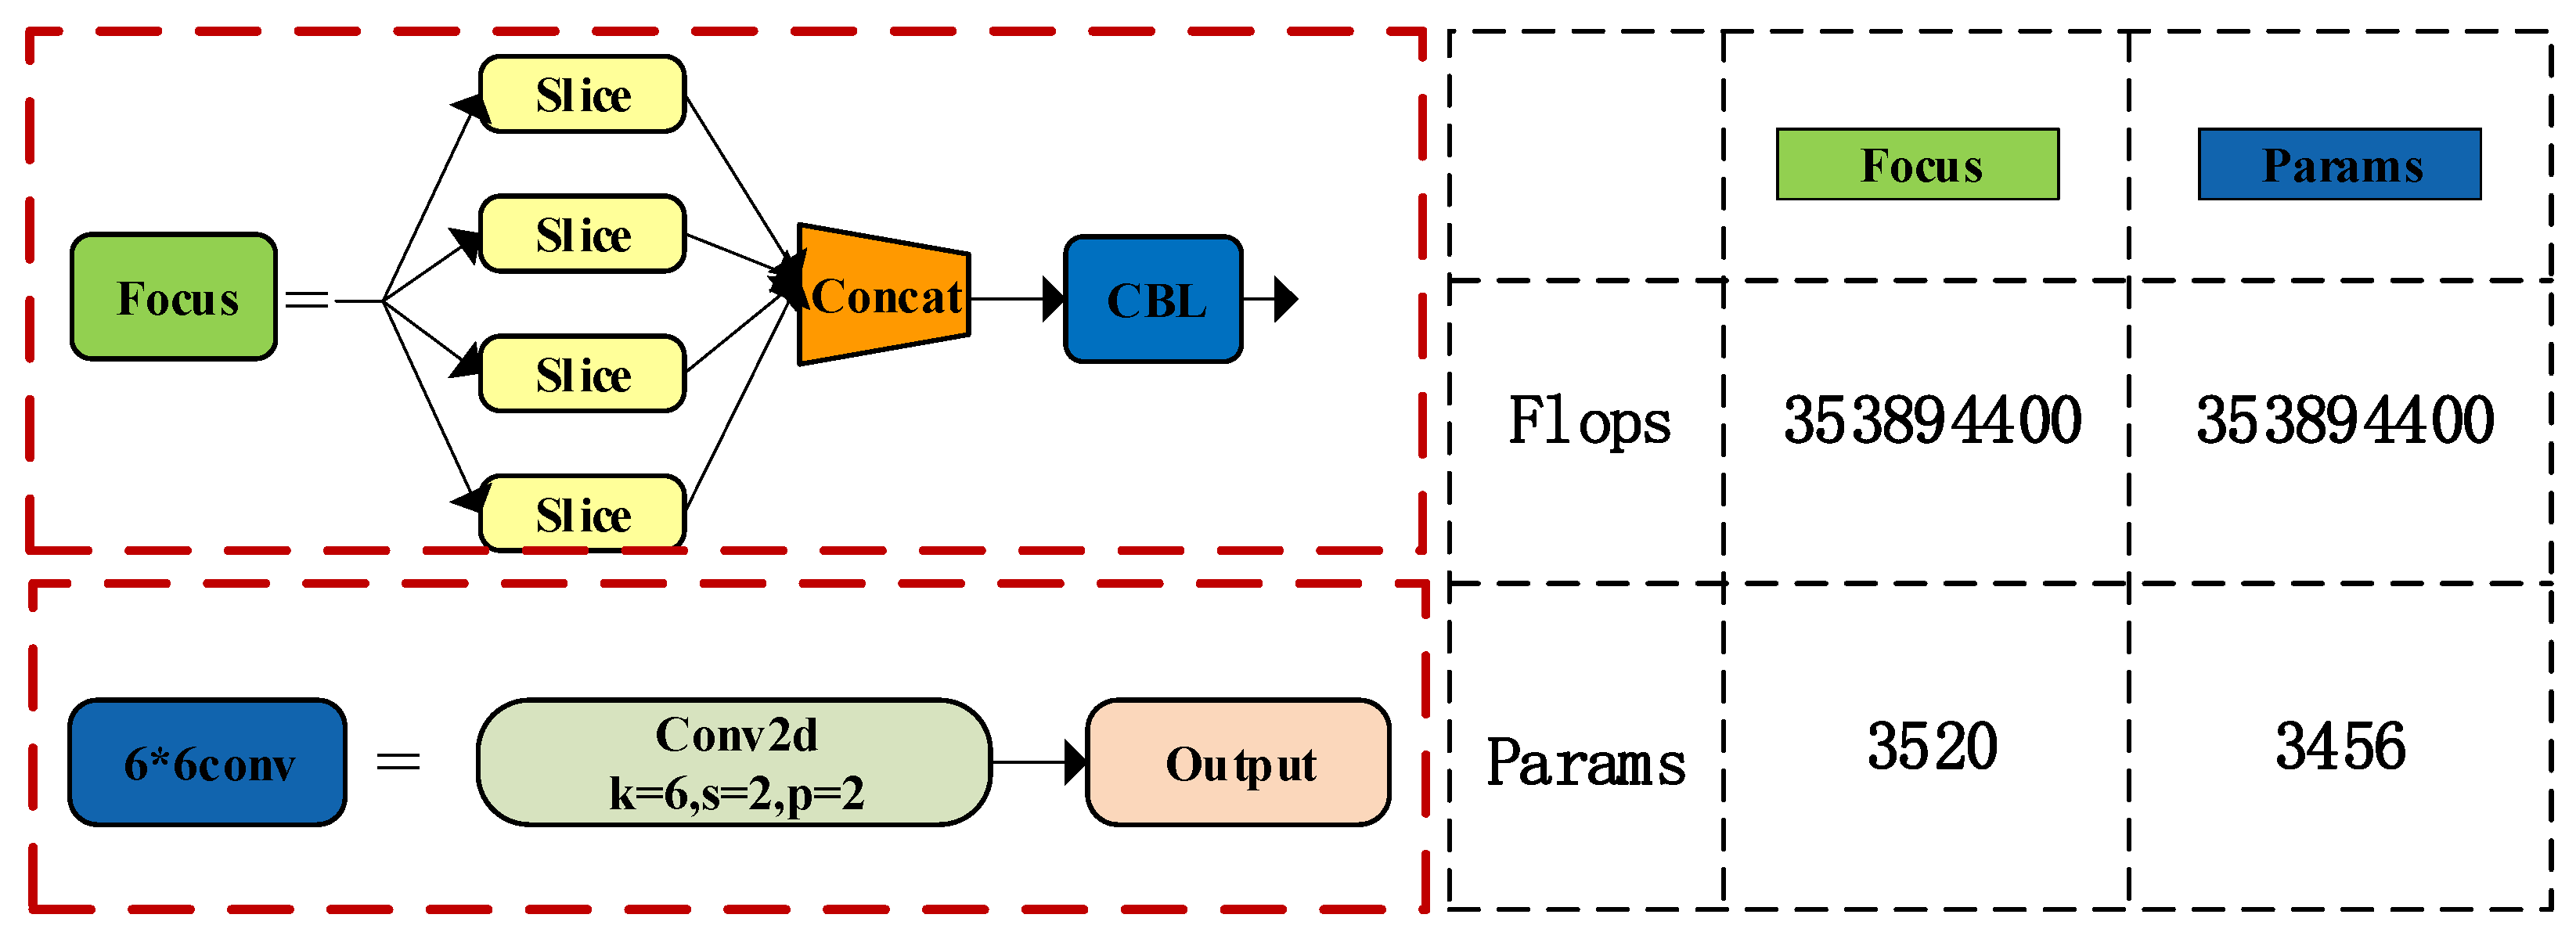
3.2.4. Network Optimization for Edge Devices

In the embedded devices at the edge, convolution operations can be better adapted, and small size convolutions have a faster computational speed than large size convolutions do. In YOLOv5, the Focus module is designed to retain more image information. However, due to the fact that this information is located at a lower level, its practical application has a limited impact on improving the network’s detection accuracy. Additionally, most chip manufacturers do not provide a Focus interface, which hinders the conversion and deployment of the YOLOv5 model. To achieve better hardware support, we opt to replace the Focus module with a convolutional layer of stride 2 and size 6 × 6. As shown in Figure 7, the comparative results indicate that both approaches possess computational capabilities, and the convolutional layer has fewer parameters.
Figure 7. Focus and 6 × 6 convolution.
The SPP (Spatial Pyramid Pooling, SPP) module initially reduces the input channels by half using a convolutional module. Subsequently, it performs three parallel max-pooling operations on the feature map, followed by concatenating and merging these results with the original features. Finally, it enlarges their size using a convolutional module, with filter sizes of 5, 9, and 13; larger filter sizes require more computation and parameters. Small filter sizes have a smaller receptive field, and using small-size pooling directly instead of large-size pooling may lead to the loss of global information, affecting the network’s detection performance. In this study, we use 2, 3, and 5 consecutive 3 × 3 pooling layers in the SPP module to replace 5 × 5, 9 × 9, and 13 × 13 pooling, respectively.

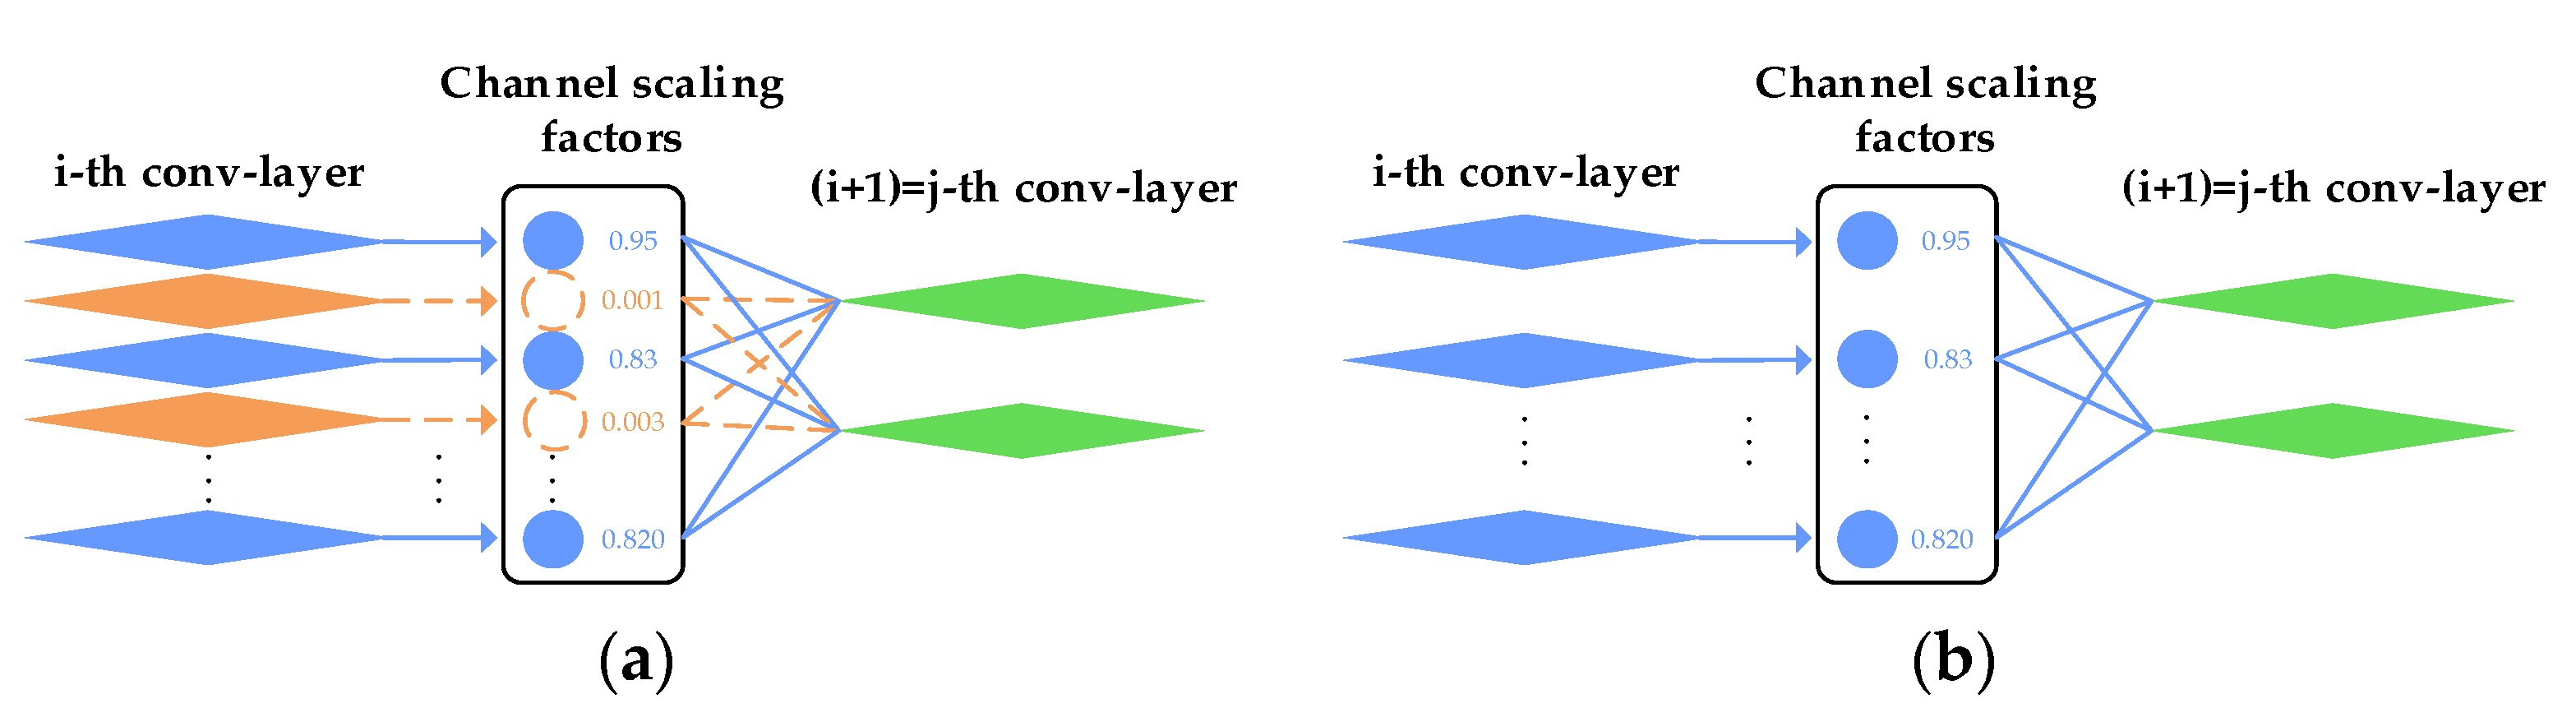
3.2.5. Model Pruning

The network depth and width of YOLOv5s are only about 1/3 and 1/2 as large as those of the standard network, respectively. Nevertheless, the model continues to impose computational demands on edge nodes that have restricted computational resources. The direct deployment of the model does not result in the best detection performance, and it is difficult to meet the real-time requirements of business scenarios. Model pruning [] can compress the model’s size and improve its inference speed. Unstructured pruning is computationally inefficient and often necessitates specific software or hardware accelerators for implementation. On the other hand, the fine-grained, excessively conservative pruning approach lacks flexibility and complicates control of the scale of the pruning process. In this paper, we employ structured channel-level pruning []. This method correlates the scale of the BN layer with those of the convolutional channels and selectively prunes a certain percentage of channels, using it as an indicator to identify the important channels.
The CBL (Convolutions with Batch Normalization and Leaky, CBL) modules in the YOLOv5s network mainly consist of three components: the convolutional and BN layers, and the ReLU (Rectified Linear Unit, ReLU) activation function. These components are responsible for performing convolution, normalization, and activation operations. According to the above method, we prune the convolutional layers in all the CBL modules. Firstly, the following transformation is performed on the BN layer, as shown in Equation (7).
x ^ = x μ Β σ B 2 + ε ;   y = γ x ^ + β
Using the parameter in the BN layer as the required scale for pruning, this will not impose an additional overhead on the network. x and y represent the inputs and outputs of the BN layer. B = {x1, x2,…, xn} indicates the current small batch; μB and σB represent the mean and standard deviation of the input activation degree pair B, respectively; γ and β represent the trainable affine transformation parameters with respect to scale and displacement, respectively. Jointly training the network weights and these scale factors with sparse regularization involves adding the L1 regularity constraint, as depicted in Equation (8).
L = ( x , y ) l ( f ( x , W ) , y ) + λ γ Γ g ( γ )
where (x, y) denotes the training input and target, respectively; W denotes the trainable weights; the first sum denotes the network normal training loss function; and the second sum is the regularization of the scale factor. In this paper, we set g(λ) = |λ|, where λ is penalized sparsity, and we used it to balance the two terms. After channel-level sparse training, a model with many scale factors close to zero is obtained, as shown in Figure 8a; then, we prune these channels with scale factors close to zero. Finally, we remove the input–output connections of these channels and the corresponding weights to obtain a more compact model (as shown in Figure 8b).
Figure 8. Channel pruning process. (a) Shows the original network; (b) shows the pruned network.
For the YOLOv5s model used in this paper, we control the ratio by controlling the size of the threshold T in the pruning process. For different datasets, the pruning effect will be different. For the dataset used in this article, after pruning 55% of the convolutional channels, the network detection accuracy and speed are very balanced. Therefore, the pruning threshold in this article is set to 0.55.

4. Dataset and Experimental Environment
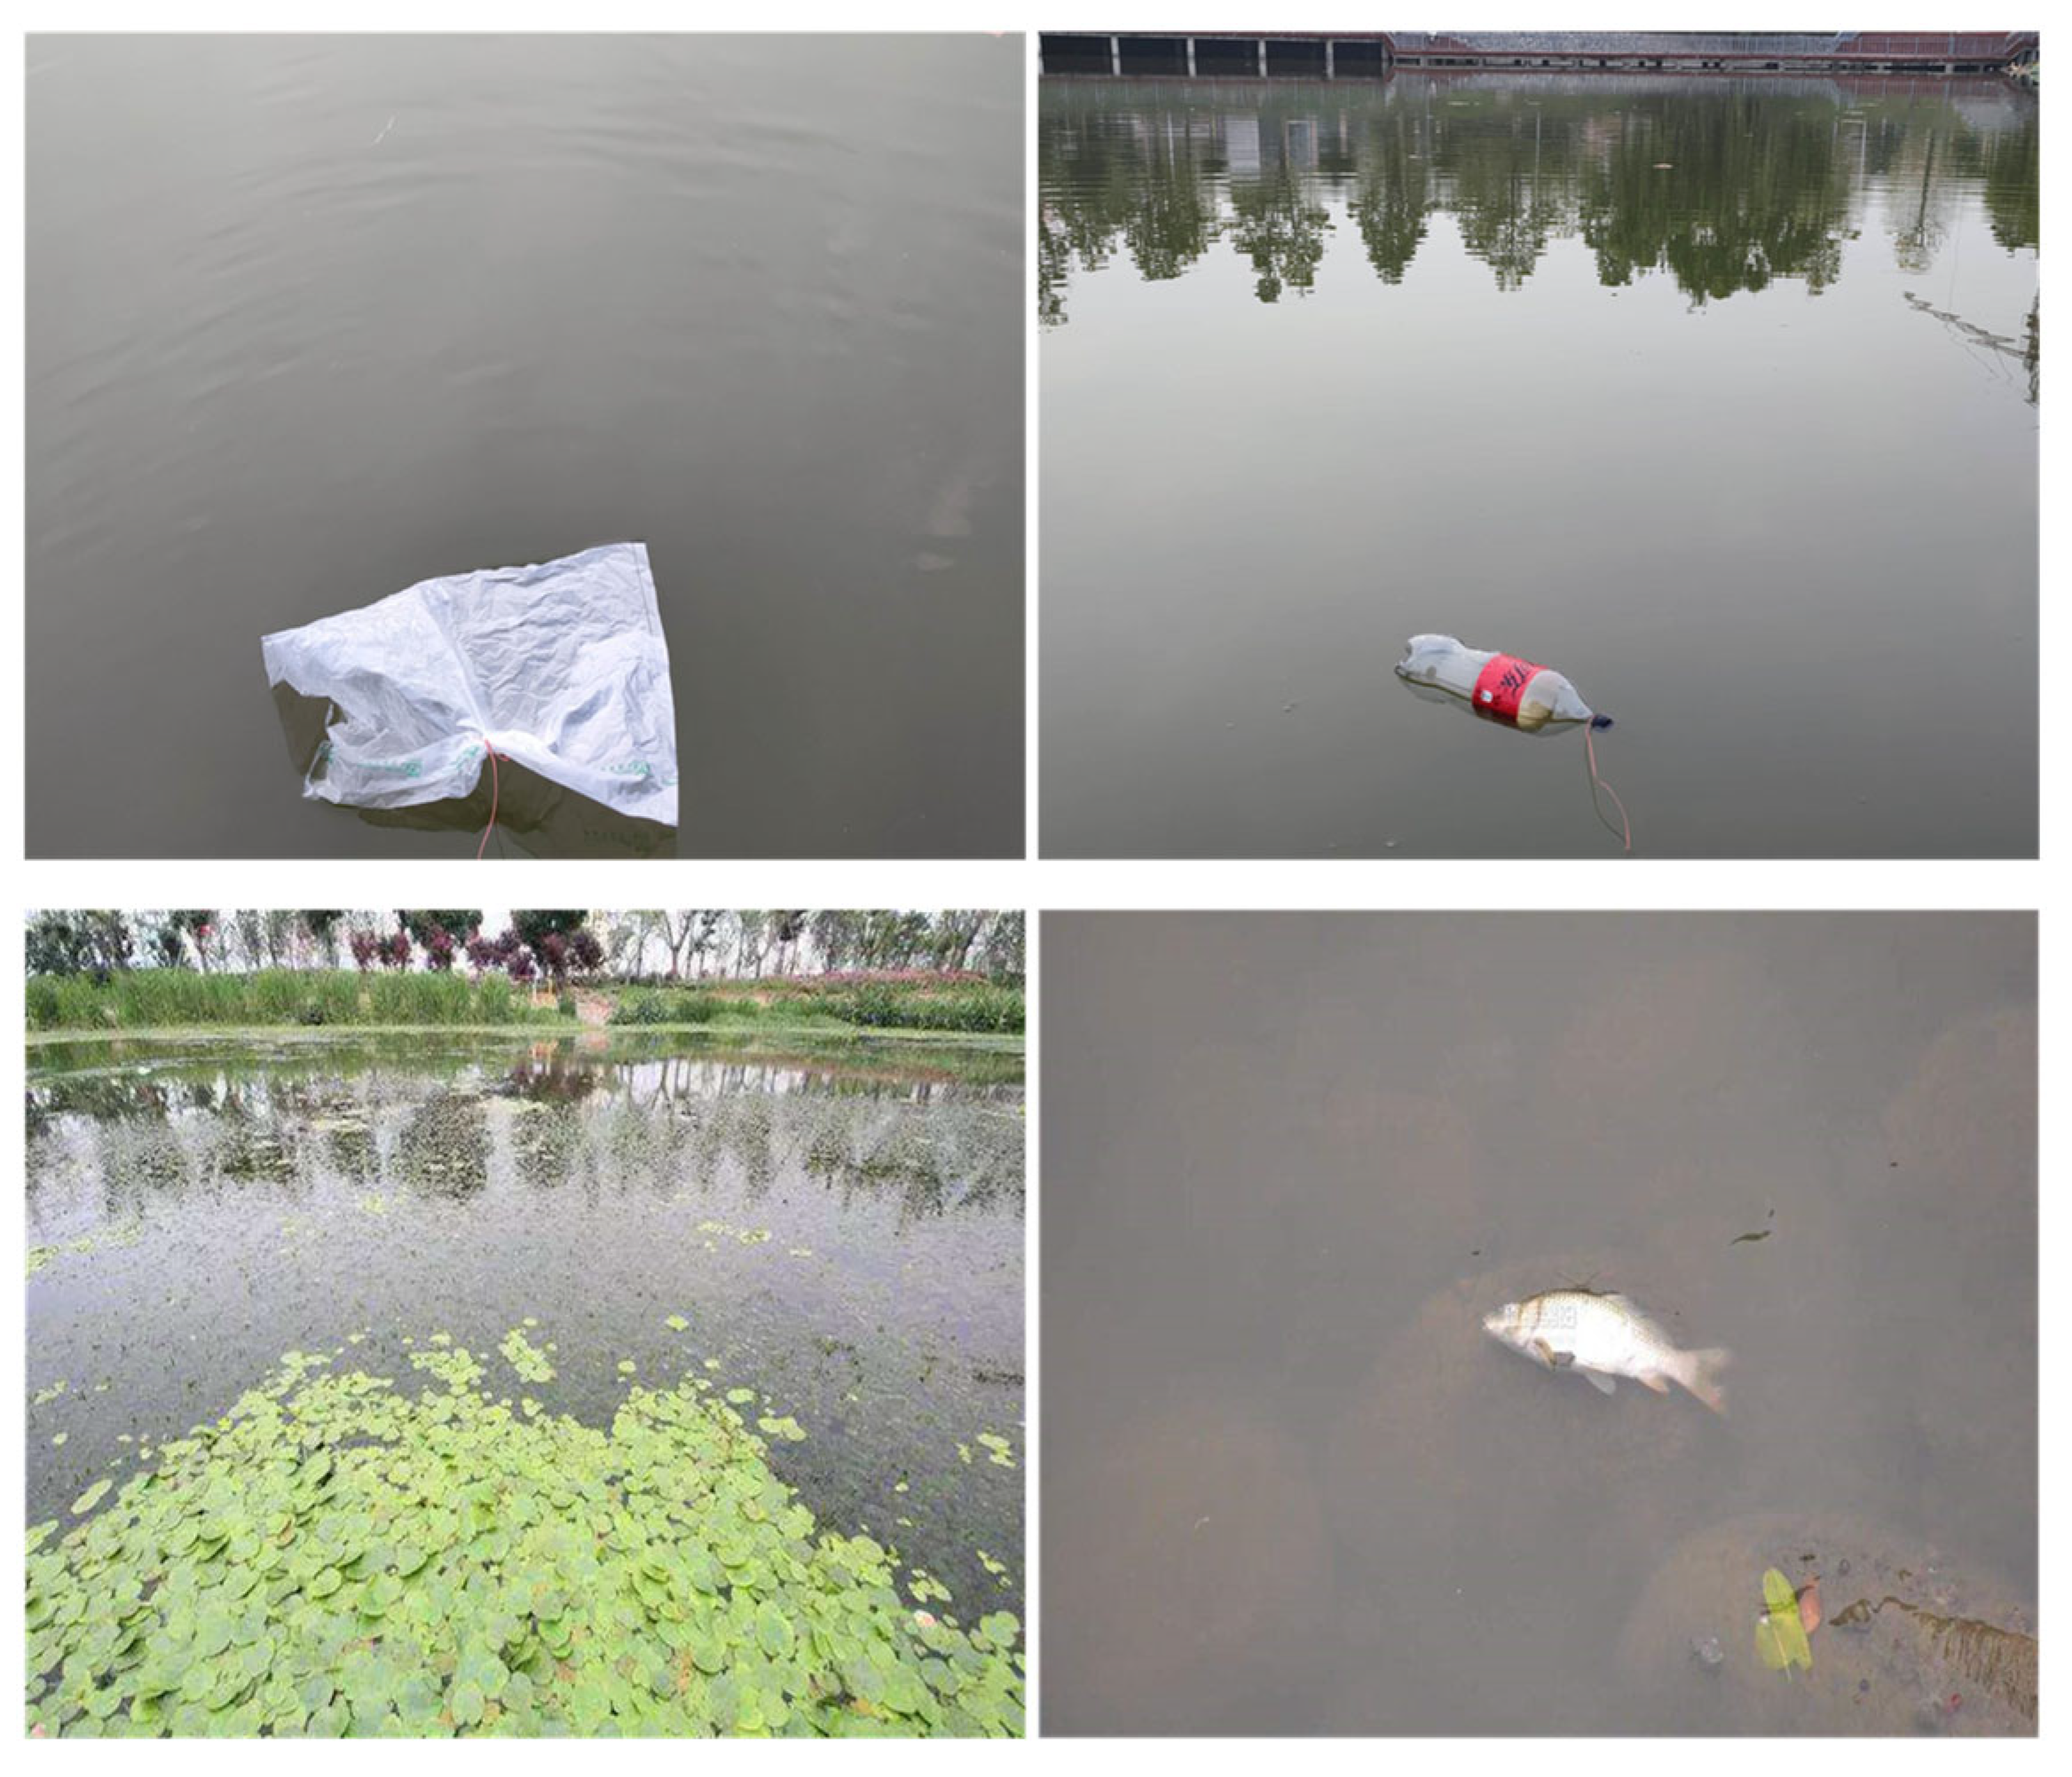
4.1. Datasets

In this paper, the dataset was mainly collected through the Internet and obtained by taking our own photographs. The dataset in this paper contains 10,100 images of floating objects, including four categories of plastic bottles, plastic bags, water plants, and dead fishes. After the dataset was labeled with the labeling tool, the training, validation, and test sets were divided in a ratio of 8:1:1, as shown in Table 1, and a sample of the main categories of the dataset [] is shown in Figure 9.
Table 1. Float dataset.
Figure 9. Sample dataset main categories.

4.2. Experimental Environment

To verify the effectiveness of the improvements to the YOLOv5 network in Section 3 and the performance of the model in real deployment applications, two experimental environments are set up in this paper. The first of these is a network model training environment, where the effectiveness of each improvement module is verified in ablation experiments. The second one is an edge deployment environment, in which the performances of the different models are compared and analyzed. The test results are presented in the next section. The main environment configuration and parameters are shown in Table 2.
Table 2. Main environment configuration and parameters.
In this paper, we use a network model based on edge computing to deploy surveillance cameras around a river to collect data and use SOCs (Systems on a Chip, SOCs) to provide arithmetic support to realize the analysis and inference of the data. We chose Hi3519AV100 from HISILICON (Shenzhen, China) as the edge node data processing unit. This is mainly used in surveillance IP cameras, aerial drones, and many other products. It also has a 2.0 Tops neural network computing performance, a dual-core CORTEX-A53 + IVE, a hardware acceleration unit NNIE (Neural Network Inference Engine, NNIE), and a DSP (Digital Signal Processor, DSP), supporting deep learning. Where 1.8” in Table 2 means 1.8 inches CMOS stands for Complementary Metal Oxide Semiconductor.

5. Results and Discussion

5.1. Evaluation Metrics

YOLO introduces the notion of an objectivity (confidence) score, reflecting the network’s confidence in the presence of an object within a designated bounding box. A prediction is deemed a TP (True Positive, TP) if it satisfies the following criteria: the objectivity score exceeds or equals the confidence threshold, the predicted category aligns with the true label, and the IOU within the true category surpasses or equals the IOU threshold. If either of the latter two conditions do not hold, the prediction is a FP (False Positive, FP). IOU is a metric used to evaluate the correctness of a bounding box, and it represents the ratio of the intersection of the detection box to the ground truth and the merged part. The experimental part of this paper introduces four metrics, precision, recall, mAP (Mean Average Precision, mAP), and FPS, as quantitative criteria for judging the effectiveness of the detection of the model, and the detection results are analyzed and compared. Precision represents the percentage of TPs in all the predictions, and recall represents the percentage of FPs in floating object detection. The mAP measures the ability of the trained model to detect targets in all the classes. As a frame rate per second, the FPS indicates the number of images that are processed per second to evaluate the speed of object detection. Mathematically,
I o U = D G D G
P r e c i s i o n = T P T P + F P
R e c a l l = T P T P + F N
m A P = i = 1 k A P i K
where D denotes the detection frame, and G denotes the ground truth; FP and FN are false positives and negatives, respectively. The AP calculation can be defined as the area contained by the interpolated precision–recall curve on the X-axis. This approach is called: AUC (Area Under the Curve, AUC). K represents the number of target classes.

5.2. Network Training

During the training process, we set the number of iterations to 300, the weight decay coefficient to 0.0001, the learning rate momentum to 0.937 for mitigating model overfitting, and the maximum training batch to 32. The dynamics of precision, recall, and mAP are illustrated in Figure 10, with the horizontal axis representing the number of training steps and the vertical axis indicating the magnitude of each value.
Figure 10. The curves of precision, recall, mAP@0.5, and mAP@0.5:0.95.
Figure 11 illustrates the loss function curve, with the lower values indicating a better performance; the ideal value is 0. As the number of training iteration steps increases, the loss consistently decreases, stabilizing after 300 rounds. When the classification loss decreases, this means that the classification prediction becomes more similar to the label, which indicates more accurate classification. When the box loss decreases, this means that the error between the predicted and labeled boxes becomes smaller.
Figure 11. The curve of loss function.

5.3. Experimentation and Analysis

For the improvement of the YOLOv5s network structure, we conduct the following ablation experiments to verify the effectiveness of the proposed method: original network and comparative experiments, involving adding CA and CA + MCA, respectively; ablation experiments on each improved module in the network in this paper; comprehensive performance comparison experiments on the different network models in the edge environments.
In this paper, we incorporate CA and MCA in feature layers at different depths, respectively, to focus on the different levels of feature information. To verify the effectiveness of the CA module on the original network and its ability to enhance the network after adding the MCA module, we conduct the following experiments. Firstly, 200 images with 507 small target annotations are selected as the small target test set. The error detection rate is the performance indicator in this test. The error detection rate represents the ratio of the number of mistakenly detected and missed small target objects to the total number of small targets. The test results are shown in Table 3.
Table 3. Comparison of CA and MCA module ablation experiments.
From the above data, it is clear that the original network is not ideal for small target detection, with 18 wrongly detected targets, and a false detection rate of 0.035%. The error detection rate decreased by 0.026 percent after adding CA, and after replacing shallow CA with MCA, the error detection rate decreased by another 0.003 percent due to the addition of CA. With the addition of the attention mechanism, the mode size increased. In this paper, by changing some CA modules to MCA modules, this only creates a difference in the method of feature extraction and does not increase the model size, while improving the detection effect. This shows that the data in this paper can effectively enhance the detection capability of the network for small targets by incorporating a coordinate attention mechanism.
For the same homemade floater dataset, a second experiment is conducted, which involves ablation, incorporating each improvement module in the YOLOv5s network. According to the analysis of the data in Table 4, it is clear that the improved modules in this paper all have differently improved detection accuracies. The inclusion of the attention mechanism caused the largest improvement in accuracy, with a 4.09 percentage increase. In the test after the incorporation of all the modules, the accuracy reached a maximum of 93.76%. Table 3 lists the performance indexes after incorporating each improved module in YOLOv5s, respectively. Combining all the data, the improved modules in this paper can effectively enhance the detection accuracy of YOLOv5s. It is evident that, compared to the original network, the improved algorithm in this paper exhibits superior performance in the test on small target floating objects in the river.
Table 4. Comparison of the results of the improved module ablation experiment.
The third experiment deploys the original and improved networks separately in the edge test for comparative performance analysis. The test results are shown in Table 5.
Table 5. Performance of different networks in edge testing.
Mainly the original networks with and without channel pruning, and the improved networks with and without channel pruning are tested in this paper. In this paper, the network model not only requires a high accuracy and efficiency, but also a balance between accuracy and speed to make the system work better. Analysis shows that for the edge nodes with a limited arithmetic power, the oversized Fast R-CNN and SSD can perform correctly, but the inference speed is too slow to meet the real-time requirement. EfficientDet is a lightweight, scalable detection network, and it contains a total of eight models; the accuracy and time complexity of the model increases with the model size []. As a small object detection network, EfficientDet has a slightly higher computational cost than that of YOLOv5s, while its detection accuracy is also lower than that of YOLOv5s. The pruned network compressed the volume by 69% and improved the detection speed at the edge end 1.53 times, achieving an FPS of 33 and enabling real-time detection. The pruned network reduced the detection accuracy by 1.75% compared to that of the training end of the network. The small accuracy loss is acceptable when considering the speed improvement.

6. Conclusions

To ensure both the inference speed and accuracy of the YOLOv5 network at the edge, this study has introduced improvements to the model, and the effectiveness of these modifications has been validated through ablation experiments. The improved model outperforms the other models in terms of its detection accuracy and speed by deploying different models to compare and analyze various performance metrics. In this paper, using the improved model, it achieved a 92.01% correction rate at the edge end and an inference speed of 33 FPS, which meet the real-time performance. It provides a feasible solution for the embedded deployment of river floating object detection.
In the future, we may face challenges posed by larger datasets or more intricate water surface environments. For the enhanced YOLOv5 network model in this study, the next crucial step involves improving the model’s capacity to handle noise information, thereby addressing the dynamic nature of external environments. Furthermore, we will conduct operator optimizations specifically tailored for designated embedded platforms to elevate the overall model’s performance. Building upon the enhancements achieved in this study for the YOLOv5 network model, our future endeavors will focus on utilizing YOLOv5 as the foundational unit of embedded platforms, contributing to the development of an edge-coordinated target detection network.

Author Contributions

Conceptualization, H.L. and S.Y.; methodology, H.L.; software, S.Y.; validation, formal analysis, and investigation, H.L. and R.Z.; resources, P.Y. and Y.Y.; data curation, Z.F. and X.W.; writing—original draft preparation, H.L. and S.Y.; writing—review and editing, visualization, supervision, project administration, and funding acquisition, M.K. and Z.F. All authors have read and agreed to the published version of the manuscript.

Funding

This work was partly supported by the National Natural Science Foundation of China [grant no. 62002180], the Key Scientific Research Projects of Colleges and Universities in Henan Province [grant Nos. 24A520030, 22A520037], the Training Plan for Young Backbone Teachers in Higher Education Institutions in Henan Province [grant No. 2023GGJS120], the Scientific and Technological Project in Henan Province of China [grant No. 222102320369], and the 2022 Nanyang City Science and Technology Tackling Plan Project [grant No. KJGG105].

Data Availability Statement

The authors have retained the analysis and simulation datasets, but the datasets are not public.

Conflicts of Interest

Authors He Li, Rui Zhang and Xiangyang Wang were employed by the company Henan Costar Group Co., Ltd. The remaining authors declare that the research was conducted in the absence of any commercial or financial relationships that could be construed as a potential conflict of interest.

References

  1. Paquin, M.; Cosgrove, C. The United Nations World Water Development Report 2016: Water and Jobs; UNESCO for UN-Water; United Nations Water: Geneva, Switzerland, 2016. [Google Scholar]
  2. Kilic, Z. Water pollution: Causes, negative effects and prevention methods. İstanbul Sabahattin Zaim Üniversitesi Fen Bilim. Enstitüsü Derg. 2021, 3, 129–132. [Google Scholar] [CrossRef]
  3. Schwarzenbach, R.P.; Egli, T.; Hofstetter, T.B.; Von Gunten, U.; Wehrli, B. Global water pollution and human health. Annu. Rev. Env. Resour. 2010, 35, 109–136. [Google Scholar] [CrossRef]
  4. Zamora-Ledezma, C.; Negrete-Bolagay, D.; Figueroa, F.; Zamora-Ledezma, E.; Ni, M.; Alexis, F.; Guerrero, V.H. Heavy metal water pollution: A fresh look about hazards, novel and conventional remediation methods. Environ. Technol. Inno. 2021, 22, 101504. [Google Scholar] [CrossRef]
  5. Porretti, M.; Arrigo, F.; Di Bella, G.; Faggio, C. Impact of pharmaceutical products on zebrafish: An effective tool to assess aquatic pollution. Comp. Biochem. Phys. C 2022, 261, 109439. [Google Scholar] [CrossRef] [PubMed]
  6. MacLeod, M.; Arp, H.P.H.; Tekman, M.B.; Jahnke, A. The global threat from plastic pollution. Science 2021, 373, 61–65. [Google Scholar] [CrossRef] [PubMed]
  7. Lechthaler, S.; Waldschläger, K.; Sandhani, C.G.; Sannasiraj, S.A.; Sundar, V.; Schwarzbauer, J.; Schüttrumpf, H. Baseline Study on Microplastics in Indian Rivers under Different Anthropogenic Influences. Water 2021, 13, 1648. [Google Scholar] [CrossRef]
  8. Galloway, T.S.; Cole, M.; Lewis, C. Interactions of microplastic debris throughout the marine ecosystem. Nat. Ecol. Evol. 2017, 1, 0116. [Google Scholar] [CrossRef] [PubMed]
  9. Jambeck, J.R.; Geyer, R.; Wilcox, C.; Siegler, T.; Perryman, M.; Andrady, A.; Narayan, R.; Law, K.L. Plastic waste inputs from land into the ocean. Science 2015, 347, 768–771. [Google Scholar] [CrossRef] [PubMed]
  10. Lamb, J.B.; Willis, B.L.; Fiorenza, E.A.; Couch, C.S.; Howard, R.; Rader, D.N.; True, J.D.; Kelly, L.A.; Ahmad, A.; Jompa, J.; et al. Plastic waste associated with disease on coral reefs. Science 2018, 359, 460–462. [Google Scholar] [CrossRef]
  11. Syanya, F.J.; Litabas, J.A.; Mathia, W.M.; Ntakirutimana, R. Nutritional fish diseases in aquaculture: A human health hazard or mythical theory: An overview. Eur. J. Nutr. Food Saf. 2023, 15, 41–58. [Google Scholar] [CrossRef]
  12. Chaudhari, A.; Bhatt, C.; Krishna, A.; Travieso-González, C.M. Facial Emotion Recognition with Inter-Modality-Attention-Transformer-Based Self-Supervised Learning. Electronics 2023, 12, 288. [Google Scholar] [CrossRef]
  13. Zhang, K.Y.; Amineh, R.K.; Dong, Z.Q.; Nadler, D. Microwave Sensing of Water Quality. IEEE Access 2019, 7, 69481–69493. [Google Scholar] [CrossRef]
  14. Phung, K.A.; Nguyen, T.T.; Wangad, N.; Baraheem, S.; Vo, N.D.; Nguyen, K. Disease Recognition in X-ray Images with Doctor Consultation-Inspired Model. J. Imaging 2022, 8, 323. [Google Scholar] [CrossRef] [PubMed]
  15. Hoang, T.; Hoang, D.; Jo, K.H. Realtime Multi-Person Pose Estimation with RCNN and Depthwise Separable Convolution. In Proceedings of the 2020 RIVF International Conference on Computing and Communication Technologies (RIVF), Ho Chi Minh, Vietnam, 14–15 October 2020. [Google Scholar]
  16. Zhang, W.; Wang, S.H.; Sophanyouly, T.C.; Chen, J.Z.; Qian, Y.T. Deconv R-CNN for Small Object Detection on Remote Sensing Images. In Proceedings of the IGARSS 2018—2018 IEEE International Geoscience and Remote Sensing Symposium, Valencia, Spain, 22–27 July 2018. [Google Scholar]
  17. Widiyanto, S.; Wardani, D.T.; Wisnu Pranata, S. Image-Based Tomato Maturity Classification and Detection Using Faster R-CNN Method. In Proceedings of the 2021 5th International Symposium on Multidisciplinary Studies and Innovative Technologies (ISMSIT), Ankara, Turkey, 21–23 October 2021. [Google Scholar]
  18. Zhang, X.; Cui, J.; Liu, H. Weed Identification in Soybean Seedling Stage Based on Optimized Faster R-CNN Algorithm. Agriculture 2023, 13, 2023. [Google Scholar] [CrossRef]
  19. Zhang, X.B.; Zhang, Y.; Hu, M.; Ju, X.M. Insulator defect detection based on YOLO and SPP-Net. In Proceedings of the 2020 International Conference on Big Data & Artificial Intelligence & Software Engineering (ICBASE), Bangkok, Thailand, 30 October–1 November 2020. [Google Scholar]
  20. Zailan, N.A.; Mohd Khairuddin, A.S.; Khairuddin, U.; Taguchi, A. YOLO-based Network Fusion for Riverine Floating Debris Monitoring System. In Proceedings of the International Conference on Electrical, Communication, and Computer Engineering, Kuala Lumpur, Malaysia, 12–13 June 2021. [Google Scholar]
  21. Song, W.; Suand, S.A. TSR-YOLO: A Chinese Traffic Sign Recognition Algorithm for Intelligent Vehicles in Complex Scenes. Sensors 2023, 23, 749. [Google Scholar] [CrossRef] [PubMed]
  22. Alqaysi, H.; Fedorov, I.; Qureshi, F.Z.; O’Nils, M. A Temporal Boosted YOLO-Based Model for Birds Detection around Wind Farms. J. Imaging 2021, 7, 227. [Google Scholar] [CrossRef]
  23. Liu, Z.P.; Fang, W.; Sun, J. SSD small object detection algorithm based on feature enhancement and sample selection. In Proceedings of the 2021 20th International Symposium on Distributed Computing and Applications for Business Engineering and Science (DCABES), Nanning, China, 10–12 December 2021. [Google Scholar]
  24. Liu, S.C.; Shi, H.J.; Guo, Z. Remote sensing image object detection based on improved SSD. In Proceedings of the 2022 3rd International Conference on Computer Vision, Image and Deep Learning & International Conference on Computer Engineering and Applications (CVIDL & ICCEA), Changchun, China, 20–22 May 2022. [Google Scholar]
  25. Zhang, L.L.; Wei, Y.X.; Wang, H.B.; Shao, Y.H.; Shen, J. Real-Time Detection of River Surface Floating Object Based on Improved RefineDet. IEEE Access 2021, 9, 81147–81160. [Google Scholar] [CrossRef]
  26. Dai, M.; Dorjoy, M.M.H.; Miao, H.; Zhang, S. A New Pest Detection Method Based on Improved YOLOv5m. Insects 2023, 14, 54. [Google Scholar] [CrossRef]
  27. Liu, X.; Chen, Y.J.; Liu, B.J. Target Recognition Algorithm Based on YOLOv5 Network and Depth Camera for 2D Interference Elimination. In Proceedings of the 2022 IEEE International Conference on Advances in Electrical Engineering and Computer Applications (AEECA), Dalian, China, 20–22 May 2022. [Google Scholar]
  28. Kim, Y.; Yi, S.; Ahn, H.; Hong, C.H. Accurate Crack Detection Based on Distributed Deep Learning for IoT Environment. Sensors 2023, 23, 858. [Google Scholar] [CrossRef]
  29. Donno, M.D.; Tange, K.; Dragoni, N. Foundations and Evolution of Modern Computing Paradigms: Cloud, IoT, Edge, and Fog. IEEE Access 2019, 7, 150936–150948. [Google Scholar] [CrossRef]
  30. Sun, X.; Deng, H.; Liu, G.; Deng, X. Combination of Spatial and Frequency Domains for Floating Object Detection on Complex Water Surfaces. Appl. Sci 2019, 9, 5220. [Google Scholar] [CrossRef]
  31. Zhang, R.B.; Xiao, Y.F.; Zheng, Y.N. Detection of Floating Objects on Water Surface Based on Fusion of Lidar and Vision. Appl. Laser 2021, 41, 619–628. [Google Scholar]
  32. Jin, X.L.; Niu, P.W.; Liu, L.F. A GMM-Based Segmentation Method for the Detection of Water Surface Floats. IEEE Access 2019, 7, 119018–119025. [Google Scholar] [CrossRef]
  33. He, X.Q.; Wang, J.C.; Chen, C.B.; Yang, X.Q. Detection of the floating objects on the water surface based on improved YOLOv5. In Proceedings of the IEEE 2nd International Conference on Information Technology, Big Data and Artificial Intelligence (ICIBA 2021), Chongqing, China, 17–19 December 2021. [Google Scholar]
  34. Lin, F.; Hou, T.; Jin, Q.; You, A. Improved YOLO Based Detection Algorithm for Floating Debris in Waterway. Entropy 2021, 23, 1111. [Google Scholar] [CrossRef] [PubMed]
  35. Wang, J.; Xiao, W.; Ni, T. Efficient object detection method based on improved YOLOv3 network for remote sensing images. In Proceedings of the IEEE 3rd International Conference on Artificial Intelligence and Big Data (ICAIBD 2020), Chengdu, China, 28–31 May 2020. [Google Scholar]
  36. Li, G.J.; Yao, D.Y.; Ai, J.Y. Floating objects detection based on improved YOLOv3. J. Guangxi Univ. Nat. Sci. Ed. 2021, 46, 1569–1578. [Google Scholar]
  37. Tharani, M.; Amin, A.W.; Maaz, M.; Taj, M. Attention neural network for trash detection on water channels. arXiv 2020, arXiv:2007.04639. [Google Scholar]
  38. Li, H.; Yang, S.P.; Liu, J.J.; Fang, H.; Fu, Z.M.; Zhang, R.; Jia, H.M.; Lv, L.M. A method for detecting floating objects on water based on edge computing. In Proceedings of the IEEE International Symposium on Broadband Multimedia Systems and Broadcasting (BMSB 2023), Beijing, China, 14–16 June 2023. [Google Scholar]
  39. Walawalkar, D.; Shen, Z.Q.; Liu, Z.C.; Savvides, M. Attentive Cutmix: An Enhanced Data Augmentation Approach for Deep Learning Based Image Classification. In Proceedings of the ICASSP 2020—2020 IEEE International Conference on Acoustics, Speech and Signal Processing (ICASSP), Barcelona, Spain, 4–8 May 2020. [Google Scholar]
  40. Wang, C.L.; Zhou, Z.R.; Chen, Z.M. An Enhanced YOLOv4 Model with Self-Dependent Attentive Fusion and Component Randomized Mosaic Augmentation for Metal Surface Defect Detection. IEEE Access 2022, 10, 97758–97766. [Google Scholar] [CrossRef]
  41. Li, H.; Yang, S.P.; Liu, J.J.; Yang, Y.; Kadoch, M.; Liu, T.Y. A Framework and Method for Surface Floating Object Detection Based on 6G Networks. Electronics 2022, 11, 2939. [Google Scholar] [CrossRef]
  42. Hu, J.; Shen, L.; Albanie, S.; Sun, G.; Wu, E.H. Squeeze-and-Excitation Networks. IEEE Trans. Pattern Anal. Mach. Intell. 2020, 42, 2011–2023. [Google Scholar] [CrossRef]
  43. Fan, R.X.; Qiu, Z.P. Improved YOLOv5 Algorithm Based on CBAM Attention Mechanism. In Proceedings of the 2022 International Conference on Frontiers of Artificial Intelligence and Machine Learning (FAIML), Hangzhou, China, 19–21 June 2022. [Google Scholar]
  44. Chang, C.C.; Huang, C.H.; Chu, Y.S. A hardware-friendly pruning approach by exploiting local statistical pruning and fine grain pruning techniques. In Proceedings of the 2022 IEEE International Conference on Consumer Electronics-Asia (ICCE-Asia), Yeosu, Korea, 26–28 October 2022. [Google Scholar]
  45. Liu, Z.; Li, J.G.; Shen, Z.Q. Learning Efficient Convolutional Networks through Network Slimming. In Proceedings of the 2017 IEEE International Conference on Computer Vision (ICCV), Venice, Italy, 24–27 October 2017. [Google Scholar]
  46. Song, S.J.; Jing, J.F.; Huang, Y.Q.; Shi, M.Y. EfficientDet for fabric defect detection based on edge computing. J. Eng. Fibers Fabr. 2021, 16, 15589250211008346. [Google Scholar] [CrossRef]
Disclaimer/Publisher’s Note: The statements, opinions and data contained in all publications are solely those of the individual author(s) and contributor(s) and not of MDPI and/or the editor(s). MDPI and/or the editor(s) disclaim responsibility for any injury to people or property resulting from any ideas, methods, instructions or products referred to in the content.

Article Metrics

Citations

Article Access Statistics

Multiple requests from the same IP address are counted as one view.