1. Introduction
Urban flood control is essential due to the significant damage that flood events can cause to infrastructure, property, and human lives. Accurate prediction of these events is crucial, especially in low-lying or coastal areas, as it offers opportunities to mitigate associated risks [
1]. Numerical modeling techniques are vital tools for forecasting and managing flood risks effectively [
2].
1.1. Forecasting of Stormwater Levels
The Stormwater Management Model (SWMM) and machine learning (ML) are two prominent approaches for predicting flooding. SWMM [
3] offers a comprehensive platform for simulating urban hydrology incorporating intricate representations of various processes such as rainfall–runoff, drainage systems, and pollutant transport. In contrast, ML utilizes data-driven algorithms to analyze patterns, potentially providing advantages in model building simplicity, computational speed, and adaptability.
SWMM’s strength lies in its detailed simulation of hydrological processes within urban environments, leveraging extensive data on land use, topography, and hydraulic structures. By providing a comprehensive representation of the urban hydrological cycle, SWMM enables the evaluation of various flood scenarios and flood risk management strategies, making it widely used in hydrology and flood-related studies [
4,
5,
6,
7].
Originally developed by the United States Environmental Protection Agency (EPA) in 1971, SWMM has undergone several iterations, with the latest major release, SWMM 5, being redeveloped from scratch and released as open-source software in the mid-2000s. SWMM 5 introduced a more robust and flexible modeling environment, facilitating integration with other software and adaptation to a wide range of applications, such as PYSWMM [
8], which enables interaction with SWMM via a Python interface.
SWMM is increasingly used to assess the impacts of climate change [
9] on urban drainage systems, simulating various climate scenarios to understand how rising temperatures and changing precipitation patterns could affect urban water systems and guide adaptations to enhance resilience. It also aids in evaluating flood risks and developing flood mitigation strategies, supporting real-time decision-making in stormwater management. However, a significant limitation of SWMM models is their high degree of specificity, which restricts their reusability across different contexts. Furthermore, these models typically necessitate the calibration of numerous parameters, which can be a complex and resource-intensive process [
10,
11,
12].
Machine learning (ML) has emerged as a promising alternative to SWMM for flood prediction. Unlike SWMM, which relies on explicit hydrological modeling, ML is a data-driven approach that requires high-quality data and has merits in computational cost and speed [
13]. ML algorithms can automatically identify complex patterns and relationships in hydrological data, enabling more flexible and adaptive flood prediction models.
Additionally, ML techniques are often more scalable and computationally efficient, allowing for real-time or near-real-time flood forecasting in urban environments. The results in [
14] indicate that the model achieved a higher degree of accuracy and incurred lower computational costs compared to a hydrological model (SWMM).
However, the effectiveness of ML for flood prediction depends on the quality and quantity of available data, as well as the selection and optimization of appropriate ML algorithms. Inadequate or biased data can result in inaccurate predictions and restrict the applicability of ML models. However, using IoT sensor data as inputs to an ML model has been shown to increase the model accuracy [
15], and SWMM has been used to augment existing data in [
16].
In an extensive literature review [
17], the efficacy of various prediction methods for both long-term and short-term floods was assessed through a qualitative analysis focusing on robustness, accuracy, effectiveness, and computational speed, thus providing a comprehensive understanding of the different techniques employed for flood predictions.
The specific challenge of short-term forecasting of flooding in stormwater systems has been addressed using multiple models, including Recurrent Neural Networks (RNN) and non-linear ARX models [
18], as well as linear regression, support vector machine and others [
19] and deep reinforced learning [
20]. The study [
21] proposes an event-based decision support algorithm for real-time flood forecasting driven by non-linear machine learning models.
1.2. Kristianstad Municipality IoT-Platform
Recognizing the pivotal role of data in managing the risk of flooding, Kristianstad municipality in Southern Sweden, home to the nation’s lowest point with an elevation at −2.32 m below the sea level, has implemented a comprehensive network of IoT sensors. Developed in collaboration with Kristianstad University and supported by Vinnova [
22], this IoT network comprises three types of sensors: (1) weather sensors strategically positioned to monitor precipitation levels across key urban locations, (2) water level sensors installed at critical points within the stormwater system, as well as in nearby streams, and lakes to monitor water depth, and (3) sensors designed to measure groundwater levels.
In total, 653 units have been deployed in and around the city of Kristianstad. The geographical distribution of these sensors is depicted in
Figure 1. Notably, in the vicinity of the village of Degeberga, a total of 49 sensors have been installed.
All sensors are equipped with wireless communication capability via an LoRaWAN [
23] network, which is built and maintained by the municipality. The sensors transmit data to an IoT portal, from which the image in
Figure 1 is derived. Most sensors are situated in the city center, focusing on surface channels and underground drainage systems. Additionally, sensors are deployed in surrounding villages and along waterways, including the small river that traverses the city. The deployed sensors serve various purposes, including monitoring water levels in stormwater pipes (101) and wastewater pipes (286), as well as groundwater levels (54), water levels in streams, lakes, and at sea (83), rain gauges (38), among others. The deployment of the IoT sensor network started in 2021.
2. Materials and Methods
This paper compares the accuracy of water level predictions between a hydrological model developed using SWMM and NARX models utilizing data from the IoT platform.
Degeberga, a village located 25 km south of Kristianstad, was selected as the evaluation site for the study for several reasons. Firstly, Degeberga was one of the initial villages to implement a comprehensive, updated SWMM model. Secondly, its geographical position, being distant from both the seashore and large bodies of water, significantly simplifies the SWMM model and the subsequent analysis of the stormwater system, as it experiences minimal or no influence from outfalls to the sea or water streams. Lastly, the stormwater pipe system in Degeberga is relatively small and easily comprehensible, making it an ideal case study for this comparative analysis.
2.1. IoT-Water Level Sensors
The red and blue dots in
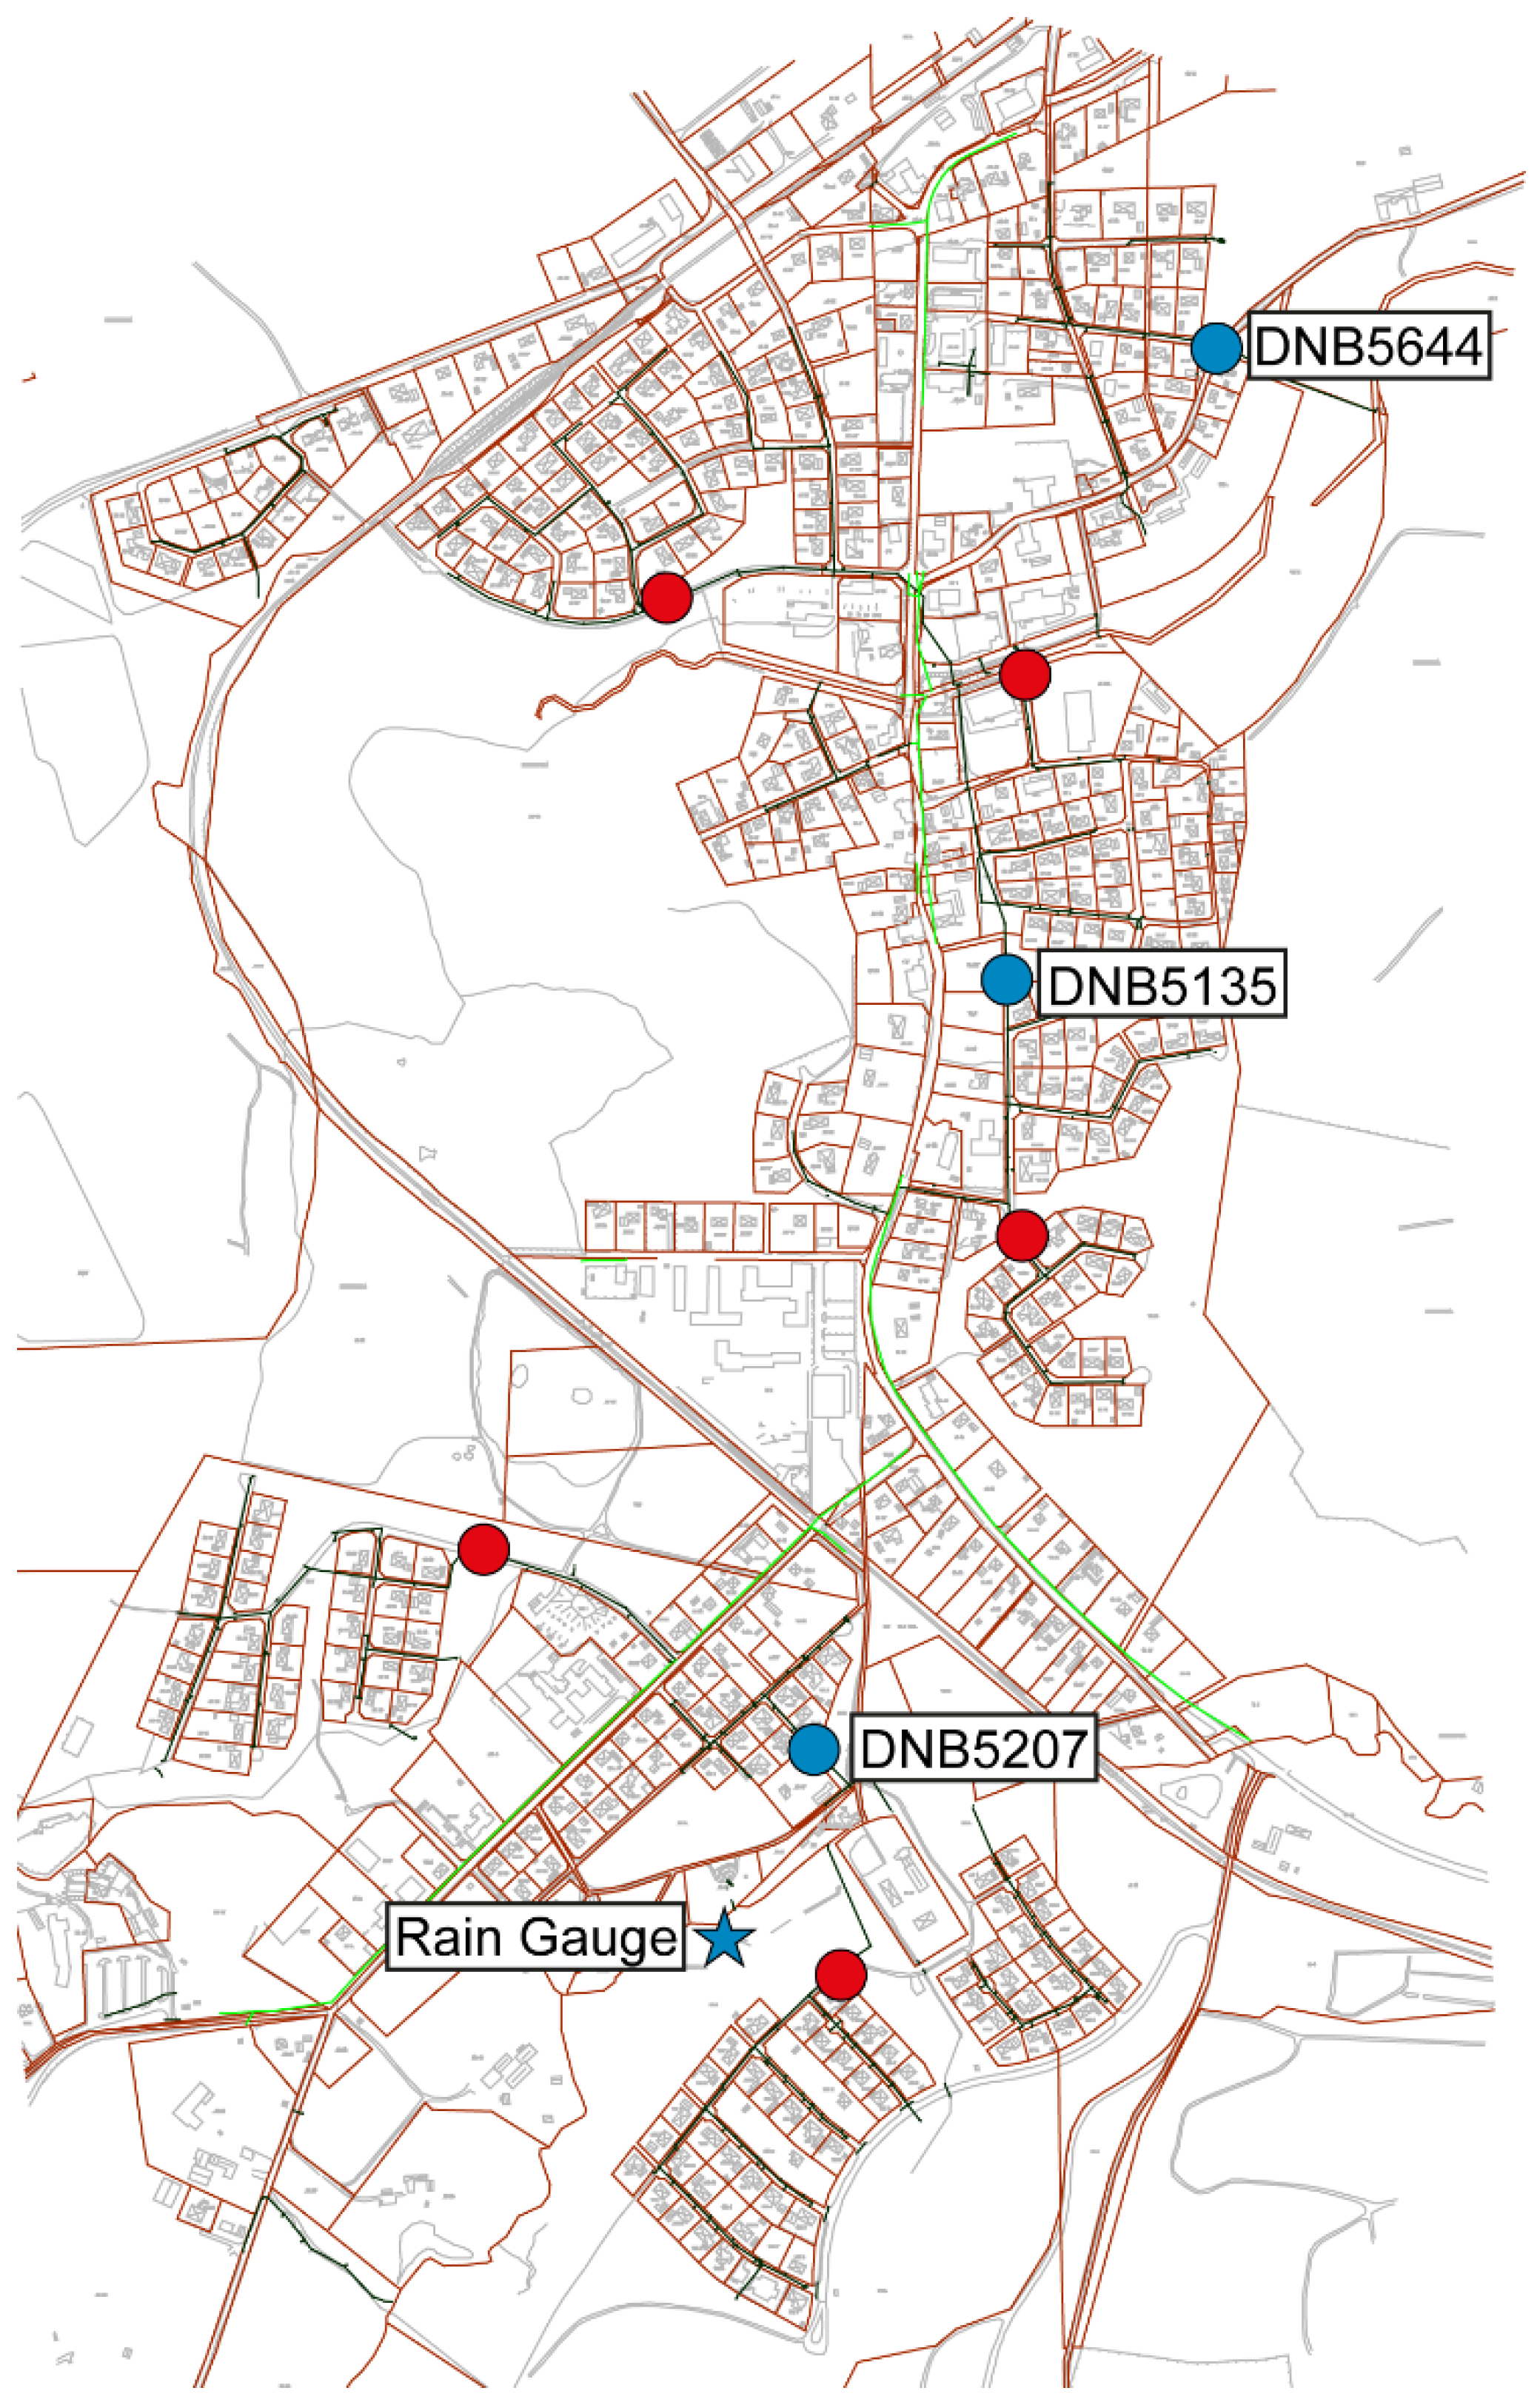
Figure 2 show the location of the deployed sensors that are measuring the water level in the stormwater pipes. The blue dots show the location of the sensors that have been included in this study. The red dots indicate the location of the sensors that have been excluded from the analysis due to incomplete or unreliable readings. The procedure for the exclusion is explained below. The blue star shows the position of the local rain gauge sensor.
The AxSensor [
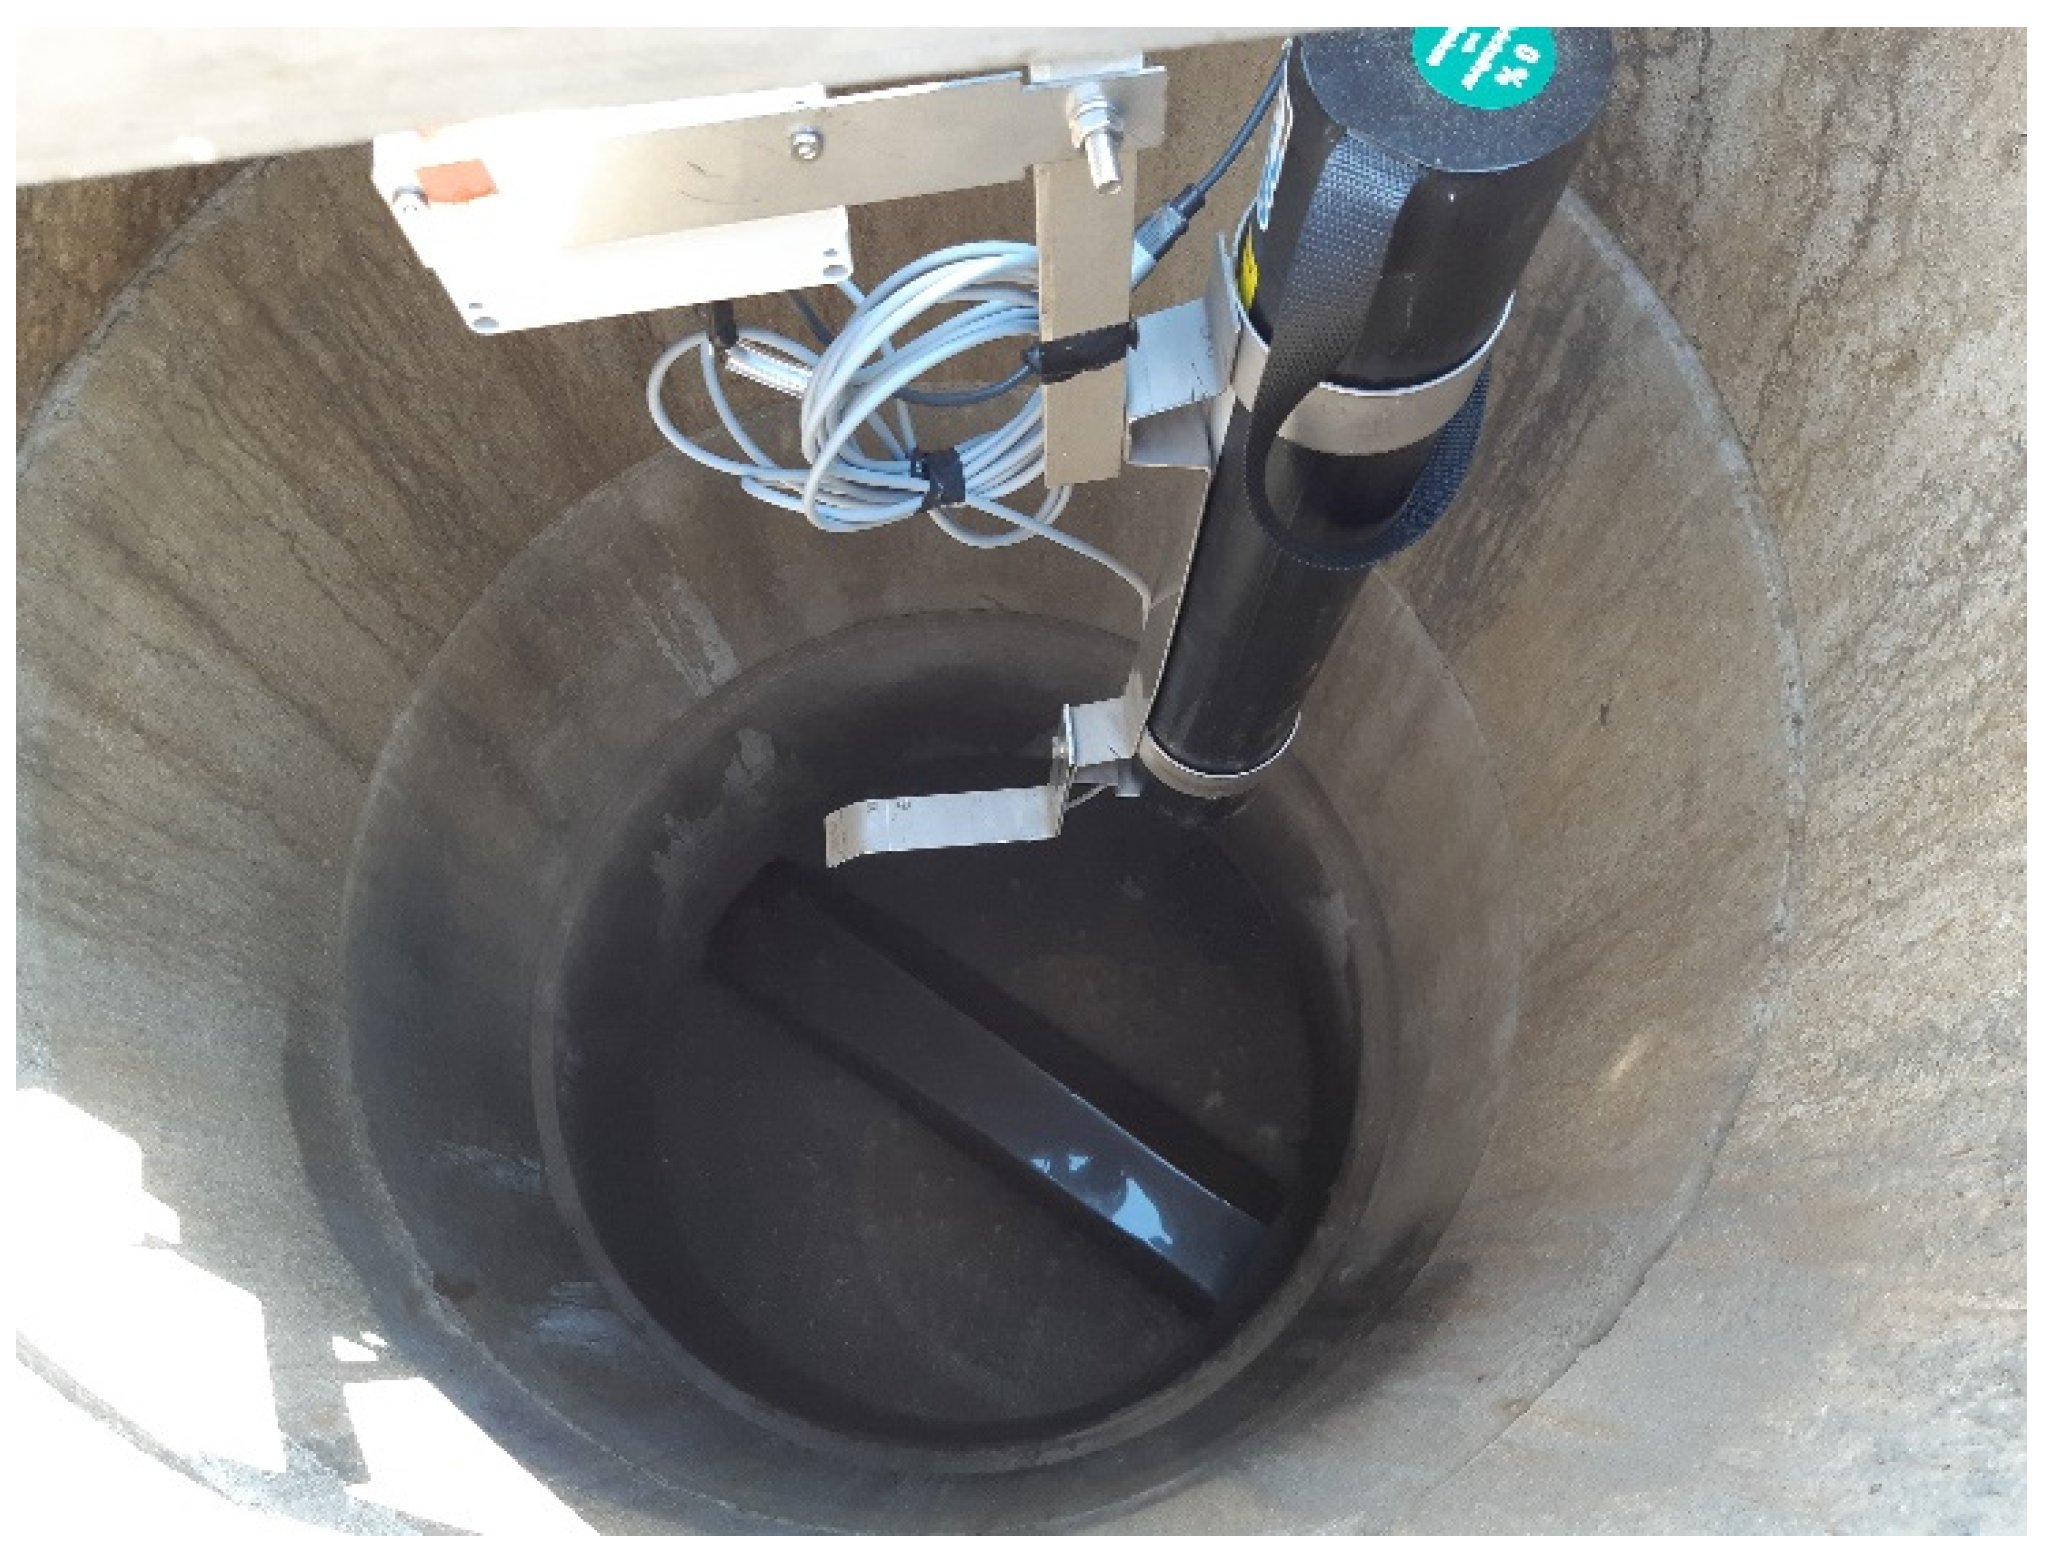
24] is the device most utilized for measurements in the stormwater system and is also the predominant gauge used in Degeberga. It comprises a measuring tube that is positioned at the flow bed. An acoustic pulse is emitted by the sensor within the tube towards the liquid surface and compared to a reference point within the tube. An example of a deployed sensor is displayed in
Figure 3.
The water level is measured approximately every 10 min, indicating a sample time of 10 min, with one important exception. The sensor unit is configured to enter sleep mode if the water level falls below 20 mm. Consequently, if the water level is under 20 mm, the sensor unit will not transmit any data via the LoRaWAN network. Data transmission will resume once the measured water level exceeds 20 mm. The precision of the sensor unit is ±5 mm, as specified by the manufacturer. Additionally, there is a rain gauge [
25] installed in Degeberga, which measures precipitation approximately every 10 min with a resolution of 0.2 mm.
2.2. Machine Learning Model and Training Set
The water levels in the stormwater management system were predicted using a NARX approach, which has successfully forecasted water levels in numerous instances (see [
26,
27,
28,
29]). The NARX model (1) consists of three components:
An autoregressive part that utilizes actual water levels up to time t − p, where p in this study is either one hour or 24 h.
An exogenous part that incorporates actual precipitation up to t − 10 min, including interaction terms.
A logarithmic transformation to address issues such as non-linearity, heteroscedasticity, and non-normality of the residuals.
Parameter estimation for the model was performed using the least squares optimization technique in scikit-learn [
30] on a training dataset consisting of sensor data from 1 September 2023 to 31 January 2024.
where:
is the water level at time t.
is the intercept term.
are the autoregressive coefficients.
are lagged values of the water level up to a time t − p.
are the coefficients associated with the exogenous variables are the coefficients associated with the interaction terms between
is the error term
Preceding the modeling phase, the sensor data underwent preprocessing by recalculating water levels at regular 10 min intervals, commencing at 00:00:00, 00:10:00, and so forth. This process utilizes linear interpolation between recorded measurements to accommodate variations in reporting times from IoT sensors and to address occasionally missing data points. Additionally, any values below 20 mm were adjusted to 20 mm to align with the sensor’s threshold value.
In the context of forecasting, a direct methodology was employed to project water levels for two distinct timeframes: one hour and 24 h. The direct methodology involves training the model to make specific predictions for each of these time horizons directly rather than iteratively predicting one step ahead or relying on intermediate forecasts. This approach helps in addressing the unique challenges and uncertainties associated with shorter and longer forecasting periods. For the one-hour forecast, the model captures the immediate impacts of recent rainfall and water level changes, providing valuable information for near-term decision-making. The 24 h forecast, on the other hand, accounts for the cumulative effects over a longer period, including potential lag effects in the stormwater system’s response to precipitation events. By employing this dual timeframe forecasting approach, the methodology ensures that both short-term and long-term water level predictions are accurately assessed, offering a comprehensive understanding of the system’s behavior under varying conditions.
2.3. Test Set and Evaluation Metrics
The model was validated with an independent test dataset from 1 February 2024 to 24 February 2024, utilizing the evaluation metrics mentioned below. To compare the performance of the SWMM and NARX models in forecasting water levels, two evaluation metrics were employed: mean absolute error (MAE) and Nash–Sutcliffe Efficiency (NSE). MAE quantifies the average magnitude of the errors between the predicted and observed values, providing an intuitive measure of forecast accuracy. It reflects how close the model predictions are to the actual measurements on average. NSE, on the other hand, is a widely used statistical metric in hydrological modeling that assesses the predictive power of models by comparing the variance of the residuals to the variance of the observed data. An NSE value of 1 signifies perfect predictive accuracy, while an NSE value of 0 indicates that the model is as accurate as the mean of the observed data. Using these metrics allows for a comprehensive evaluation and direct comparison of the SWMM and NARX models, highlighting their respective strengths and limitations in representing water level dynamics within the stormwater management system.
2.4. SWMM
The municipality maintains the stormwater system using dpWater [
31], a mapping software that documents all details of the municipality’s piping systems. This includes depths measured in RH2000 [
32] (the official national Swedish height system), gradients, placements, nomenclatures, materials, and construction years.
The stormwater model in dpWater is exported to SWMM for simulations of precipitation and water level forecasting and to simulate reconstruction and expansion of the existing stormwater system. Degeberga village, located in Kristianstad municipality, is the first area to be fully modeled in SWMM.
Figure 2 provides an overview of the village extracted from the SWMM model. The stormwater system consists of several separate pipe networks, each having outfalls discharging into different local water streams. The three water level sensors selected for this study are associated with different, unconnected subsystems.
The SWMM simulation of the water levels was conducted using the PYSWMM [
8] software, enabling a more straightforward comparison of the results from the NARX model and the SWMM model within the same Python environment. The input for the SWMM simulation model was actual precipitation data sourced from the IoT portal, and the output was compared to the observed water levels from the sensors.
Despite meticulous efforts in model development, the SWMM simulation output exhibited significant discrepancies compared to the observed water levels, with substantial differences in both the mean and amplitude, as indicated by the high MAE in
Table 1. Attempts were made to calibrate the SWMM model to historical data, but this proved challenging due to the occasional presence of spurious water flows. It is suspected that groundwater may be leaking into the system, creating additional water flows. This phenomenon is particularly evident when there is water running in the stormwater system despite the absence of rain. These issues made it difficult to achieve a well-calibrated SWMM model, thereby impacting its performance compared to the NARX model.
Despite this, the SWMM output demonstrated a moderate to high correlation with the sensor readings, as shown in
Table 2. To address the discrepancies and facilitate a meaningful comparison between the methods, a linear transformation (2) was applied to adjust the simulated SWMM values.
where
dadj is the adjusted water level and
dSWMM is the water level from the SWMM simulation. The two parameters,
α and
β, are chosen to minimize the error term
ε for the training period.
2.5. Data Acquisition Issues
The large-scale deployment of sensors in Kristianstad municipality faced numerous obstacles and unforeseen challenges that compromised data integrity and continuity of data collection. One significant issue was measurement drift, a common problem where sensor accuracy degrades over time, necessitating frequent recalibration to maintain data reliability. This issue was exacerbated by deficiencies in the early versions of the AxSensors, particularly in certain plastic components, and software problems that failed to adequately account for the effects of ambient temperature and humidity on the units, leading to data fluctuations.
In addition, low battery levels resulted in intermittent data losses. There is an inherent conflict between maintaining high sampling rates and minimizing energy consumption in battery-powered sensors. To enhance system reliability and extend battery life, experiments were conducted with various sampling frequencies, as well as the implementation of a deadband, where water levels below a certain threshold were not reported by the sensor.
Communication issues were also prevalent, with signal interference and range limitations frequently disrupting data transmission. Moreover, the physical security of the equipment emerged as a concern, with multiple incidents of vandalism recorded at various sites. While placing antennas high above the ground can address signal issues, safeguarding the sensors from vandalism often requires hidden or underground placement, creating a challenging conflict between optimizing signal strength and ensuring security.
These challenges highlight the complexity and dynamic nature of managing large-scale sensor networks and emphasize the importance of comprehensive planning and continuous monitoring to effectively mitigate such issues. Over time, multiple software updates were necessary, each causing temporary disruptions in data collection. However, through iterative improvements and the refinement of both hardware and software, the stability and accuracy of the sensor network gradually improved, ultimately paving the way for more reliable data collection and the long-term sustainability of the monitoring system.
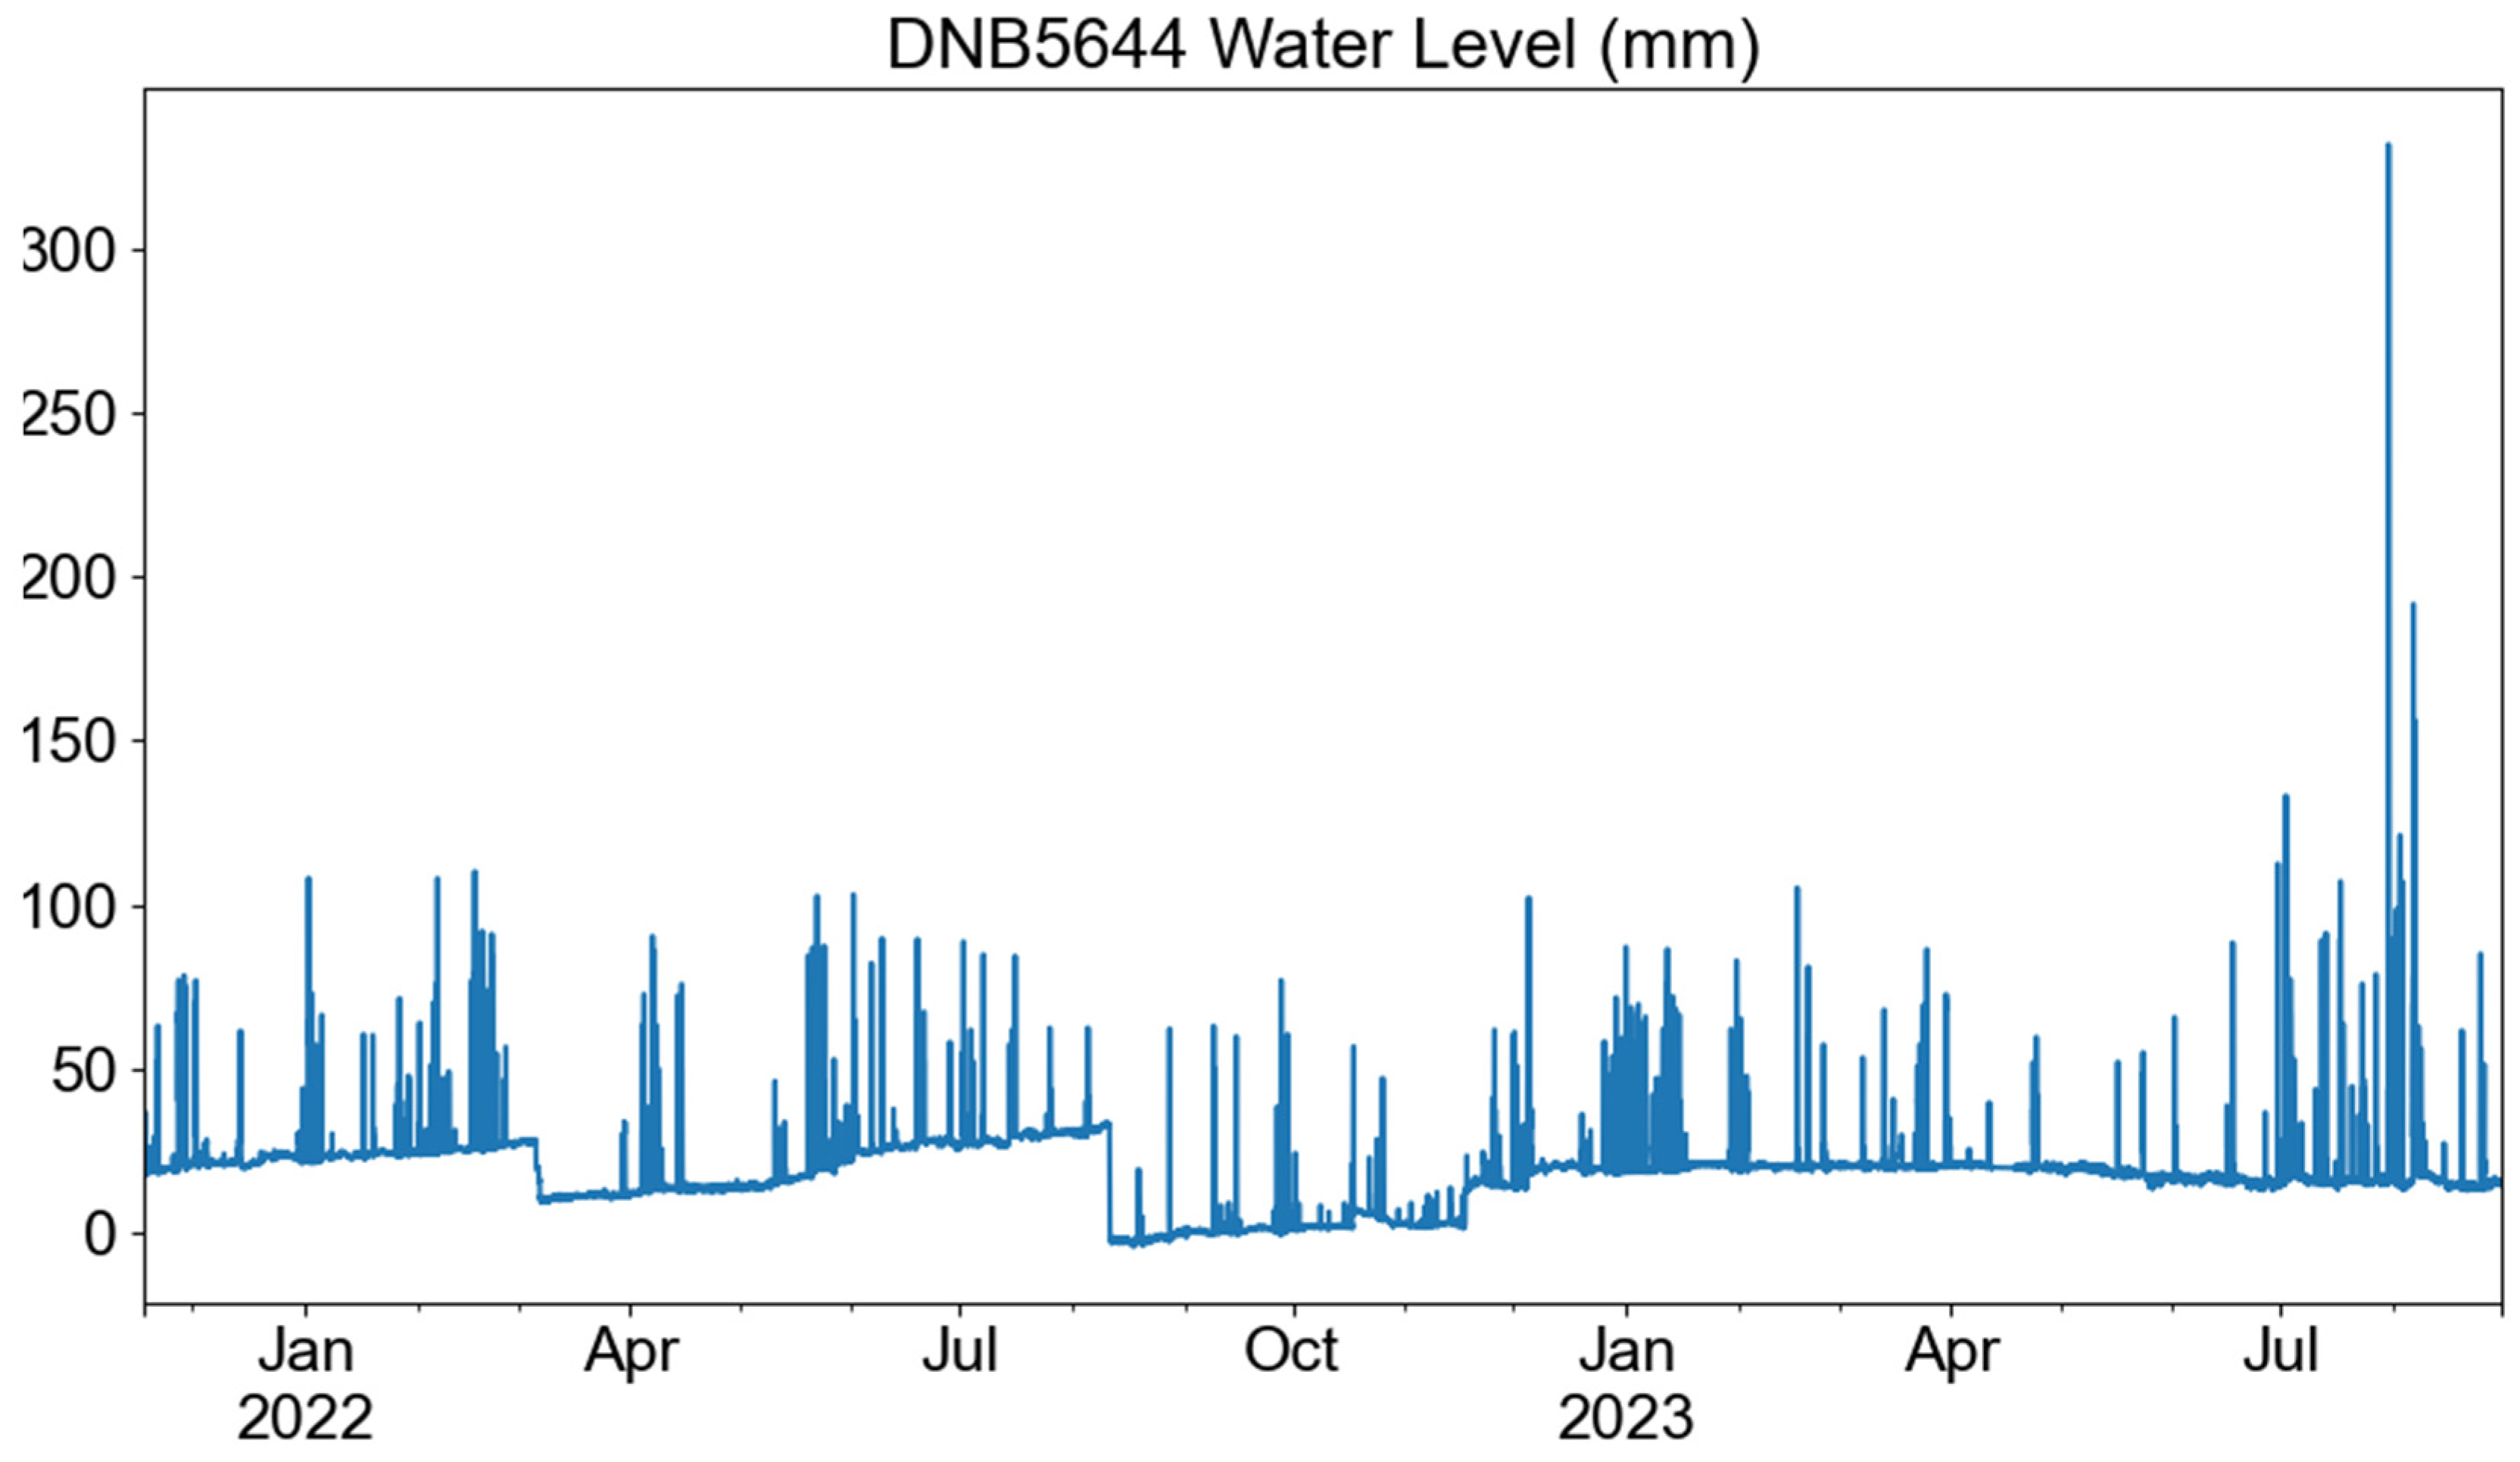
Figure 4 presents measurements from a sensor, illustrating the challenges discussed above, such as shifts due to software and hardware updates and measurement drift over time. Due to these persistent challenges, the scope of this study was narrowed to three independent subsystems of the Degeberga stormwater management system, where continuous and reliable data were available. This focus allowed for a more reliable comparison of forecasting methodologies within a controlled and stable environment.
3. Results
Water levels simulated in SWMM demonstrate moderate to high correlations with the observed water levels, as depicted in
Table 1. However, despite efforts to correct the model, the simulation output is not calibrated to the sensor readings, leading to disparities in both the mean and amplitude, as evidenced by the high MAE in
Table 2 and negative NSE values in
Table 3. The linear adjustment of the simulated SWMM improves the situation and significantly reduces the MAE, increasing NSE while maintaining the same correlation, see
Table 1,
Table 2 and
Table 3.
However, despite the efforts to correct the SWMM model, both NARX models, with 1 h and 24 h forecasting horizons, outperform SWMM in terms of accuracy. The NARX models exhibit superior correlation coefficients, lower MAE values, and higher NSE values. Notably, the 24 h NARX model achieves an MAE reduction of 33–37% compared to the SWMM model, as shown in
Table 2. Among the NARX models, the 1 h forecast surpasses the 24 h forecast in overall accuracy.
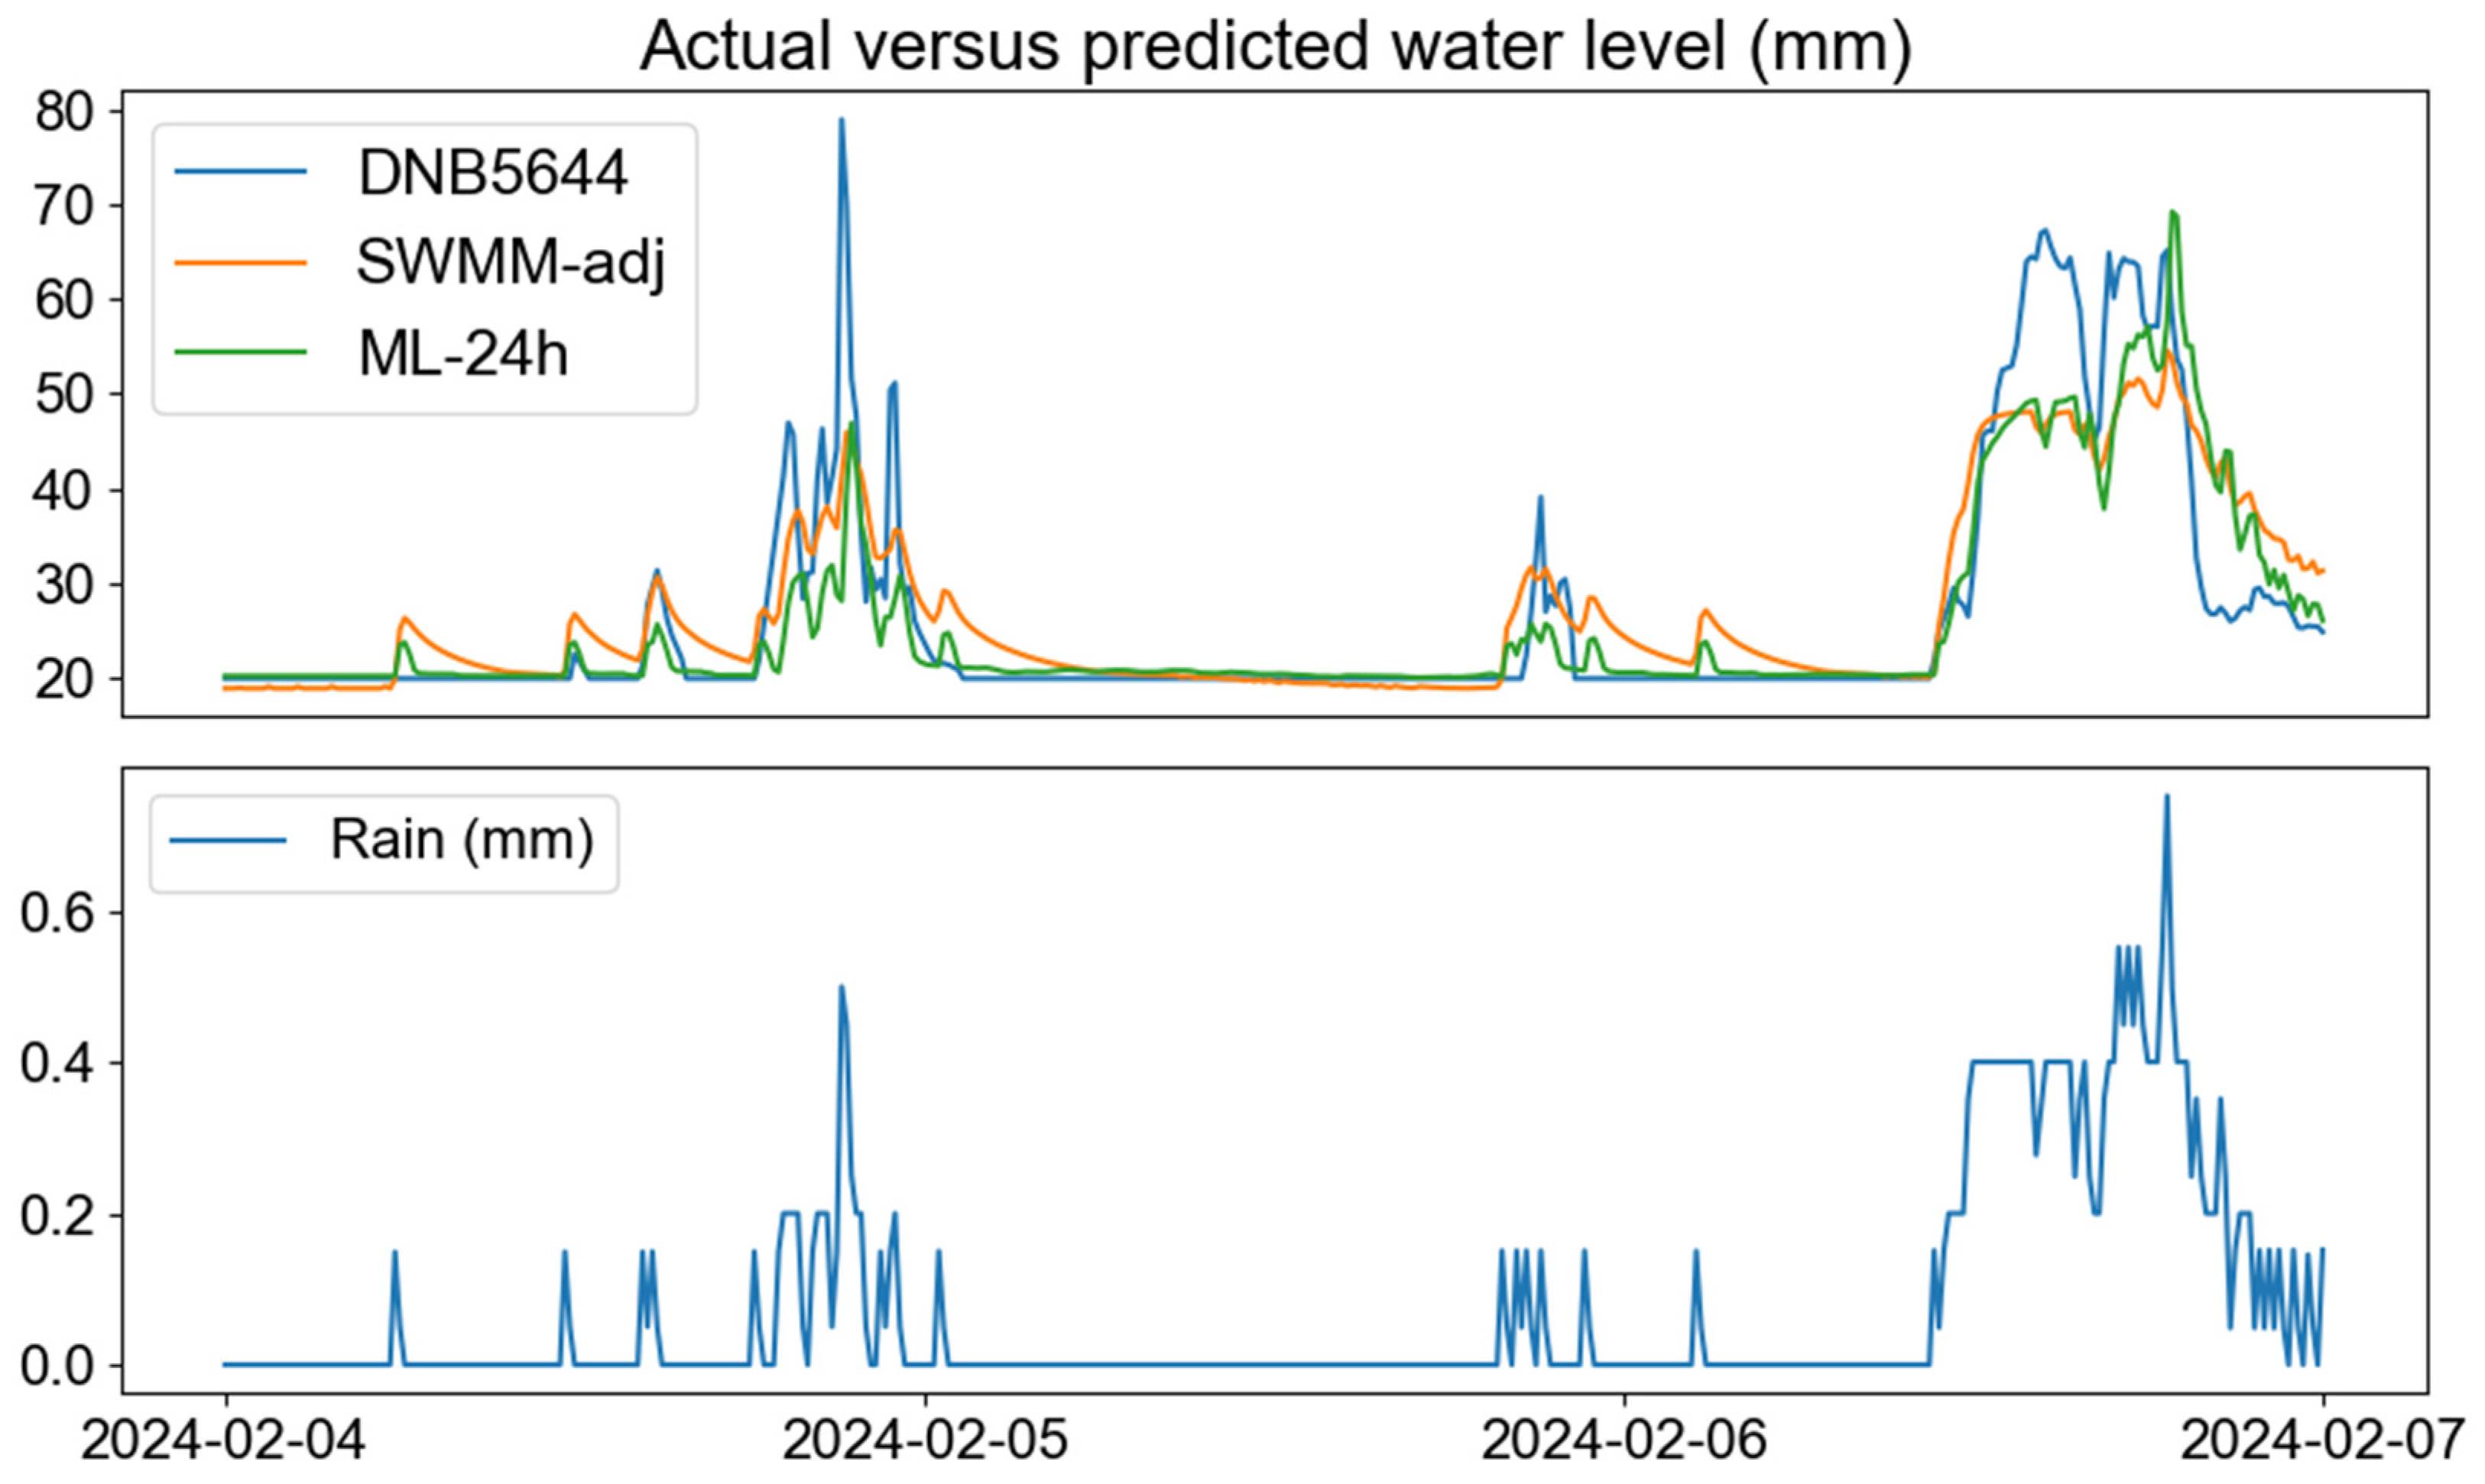
In
Figure 5, a comparison between the actual water level and the two predictions is shown for one of the analyzed sensor nodes. The actual water level and rainfall data reported by the sensors are depicted in blue, while the adjusted SWMM simulation values are represented in orange. Additionally, the 24 h forecast produced by the NARX model is illustrated in green, spanning a three-day duration at the beginning of February.
4. Discussion
Comparing the two methodologies reveals that both approaches can effectively forecast water levels within the stormwater management system. However, constructing SWMM models demands significantly more technical expertise than developing a NARX model. Despite the diligent efforts of the municipality’s engineers, the simulation output of SWMM still requires an adjustment to align with sensor readings. Nevertheless, even after recalibration, the SWMM model performs less effectively than the NARX models.
While NARX models appear superior in this investigation, it’s important to recognize that the SWMM model does include potential system defects like groundwater infiltration into the stormwater network or other leaks. Moreover, although ML models excel at detecting patterns within the available data, they may struggle to extrapolate values beyond the observed range. The dataset’s lack of major flooding incidents further restricts the models’ ability to accurately predict significant flooding events resulting from prolonged heavy rainfall. This absence of major flood event data is a significant limitation, emphasizing the need to address this gap for better assessment of models’ effectiveness during extreme weather events.
To mitigate this limitation, future efforts should focus on expanding the dataset to include extreme event simulations. This can be completed by systematically incorporating historical data from past flood events or by creating high-fidelity simulated events using hydrological models. Integrating such data would enhance the models’ predictive capabilities under varied conditions, making forecasts more reliable during extreme weather scenarios.
In this context, SWMM models can be invaluable for data augmentation, supplementing the existing dataset with simulated water levels for intense rainfall events. This would create a more comprehensive training dataset for all types of ML algorithms, potentially improving their predictive capabilities. However, ensuring the representativeness and realism of the augmented data, as well as reconciling differences between simulated and real-world data, are practical challenges that need to be addressed. Future research should focus on methodologies for seamlessly integrating synthetic and observed datasets to enhance ML models’ robustness.
In this study, actual rainfall data, collected by a rain gauge at 10 min intervals, was used as input for both the SWMM simulation and the NARX model. In practical applications, however, rainfall forecasts would be sourced from meteorological services, which are likely to be less accurate than direct measurements and typically available on an hourly basis. Consequently, this could result in less accurate water level forecasts. Nonetheless, the performance differences between the two models are expected to remain consistent.
Despite the promising results, the study also highlights some of the challenges with obtaining reliable data on water levels in a stormwater management system, e.g., unwanted shift and drift in measurement levels due to battery usage, sensor software updates and vandalism, and missing values due to LoRaWAN communication issues.
Yet, these challenges also present opportunities for improvement. By implementing more robust sensor technologies, refining data collection protocols, upgrading wireless communication systems, and integrating SWMM simulations with sensor data to inform ML models, there is potential for an even more effective approach to forecasting the risk of flooding events.
5. Conclusions
This study demonstrates that both NARX models and SWMM can effectively forecast water levels within a stormwater management system. Constructing SWMM models, however, requires significantly more technical expertise than developing NARX. Despite extensive efforts in model development, the simulation output from SWMM still necessitates further adjustments to align with the observed water levels. Even after recalibration, the accuracy of the SWMM models does not achieve the same levels as that of the NARX models.
While NARX models demonstrate superior performance in this investigation, with higher NSE and lower MAE, it is crucial to recognize their limitations. Statistical time-series methods excel at identifying patterns within data but may struggle to extrapolate values beyond the observed range. The dataset used in this study, which lacks major flooding incidents, may result in NARX models that fail to accurately predict significant flooding resulting from prolonged heavy rainfall.
In this context, SWMM models could be valuable for data augmentation, supplementing the existing dataset with simulated water levels for intense rainfall events. This augmentation would create a more comprehensive training dataset for all types of ML algorithms, potentially enhancing their predictive capabilities.
The study also highlights several challenges associated with obtaining reliable data on water levels in a stormwater management system. Issues such as unwanted shifts and drifts in measurement levels due to battery usage, sensor software updates, vandalism, and missing values caused by LoRaWAN communication issues were noted. Despite these challenges, they present opportunities for improvement. By implementing more robust sensor technologies, refining data collection protocols, upgrading wireless communication systems, and integrating SWMM simulations with sensor data to inform ML models, there is potential for an even more effective approach to forecasting the risk of flooding events.
In conclusion, while both SWMM and NARX models offer effective tools for forecasting stormwater levels, NARX models demonstrate superior accuracy and are less resource-intensive to develop and maintain. However, to fully leverage the strengths of both models, future research should prioritize enhancing data reliability and integrating the two approaches. Expanding datasets to include extreme weather events, generating synthetic data through SWMM simulations, and validating predictions with real-world flood scenarios will significantly improve the robustness and predictive power of NARX models. Additionally, addressing challenges in IoT sensor data collection, such as measurement drift, communication issues, and vandalism, through the adoption of more reliable sensor technologies and improved maintenance protocols will be crucial. These improvements not only enhance forecasting accuracy but also provide practical benefits for stormwater management system operators relying on IoT sensor networks. Finally, future research could explore different ML models beyond NARX to predict water levels, offering potential improvements in forecasting capabilities.


