Article

Effect of Rice–Carp Coculture on Phytoplankton and Microzooplankton Community Composition in Paddy Water during Different Rice Growth Stages

1
Wuxi Fisheries College, Nanjing Agricultural University, Wuxi 214081, China
2
Key Laboratory of Integrated Rice-Fish Farming Ecology, Ministry of Agriculture and Rural Affairs, Freshwater Fisheries Research Center, Chinese Academy of Fishery Sciences, Wuxi 214081, China
*
Authors to whom correspondence should be addressed.
Water 2024, 16(19), 2775; https://doi.org/10.3390/w16192775
Submission received: 15 August 2024 / Revised: 25 September 2024 / Accepted: 27 September 2024 / Published: 29 September 2024
(This article belongs to the Section Biodiversity and Functionality of Aquatic Ecosystems)

Abstract

:
Integrated rice–fish farming, an agricultural practice that combines cultivating rice and breeding fish in the same field, has attracted widespread attention. However, there is limited research on how the rice–carp coculture impacts the community structure of phytoplankton and microzooplankton in paddy water. This study employed eDNA metabarcoding sequencing to analyze the composition of phytoplankton and microzooplankton in a rice monoculture system (RM) and a rice–carp coculture system (RF). Following annotation, we identified 9 phyla, 89 families, 275 genera, and 249 species of phytoplankton, along with 20 phyla (or subphyla and classes), 85 families, 222 genera, and 179 species of microzooplankton. The alpha diversity indices revealed significantly higher richness, diversity, and evenness in the RF group compared to the RM group during grain-filling stage. Principal coordinates analysis (PCoA) demonstrated notable differences in the phytoplankton and microzooplankton compositions between the two groups across various rice growth stages. Composition analysis showed that rice–carp coculture increased the relative abundance of dominant phytoplankton phyla such as Bacillariophyta, Chrysophyta, and Euglenophyta while decreasing that of Cryptophyta. In microzooplankton, the coculture resulted in an increased abundance of Intramacronucleata (subphylum) and a decrease in Conoidasida (class). In conclusion, the rice–carp coculture enhances the diversity of plankton, particularly during the grain-filling stage, and simultaneously alters the composition and abundance of dominant plankton species in the paddy water. These findings enhance understanding of the broader impacts of integrated rice–carp farming on agricultural ecosystems, emphasizing alterations in the diversity and composition of aquatic microorganisms

1. Introduction

The rice–fish farming is an integrated approach to agriculture that combines the cultivation of rice and the breeding of fish in the same field. This method has been traditionally employed across various Asian countries, notably including China, India, Japan, and Thailand [1]. In China, integrated rice–fish farming has rapidly expanded to become a significant food production strategy. In 2023, integrated rice–fish farming in China covered an area of 2,993,560 hectares (44,903,400 mu), stabilizing rice production at 22.5 million tons and yielding 4,166,500 tons of various aquatic products [2]. This symbiotic arrangement not only optimizes the use of land but also benefits both crops and aquatic animals [3]. Fish in rice paddies contribute to pest and weed control, thereby reducing the dependency on chemical pesticides and herbicides. Their movement in the water stimulates root growth and enhances oxygen availability for the rice [4]. Meanwhile, the rice plants help maintain an optimal microclimate around the water, and protect fish from predators [5]. The rice–fish coculture is praised for enhancing ecosystems and reducing poverty and is promoted as boosting biodiversity, lowering the use of fertilizer and pesticides, and enhancing system sustainability [6,7]. According to several studies, rice–fish farming led to an increase in aquaculture production, which raised farmers’ income [8]. In addition, research in Ruyuan County, China, demonstrated that the ecosystem services value of rice–fish coculture ecosystems amounted to RMB 255,529 per hectare per year, representing a 37.9% increase compared to rice monoculture systems [9].
Phytoplankton and zooplankton are vital components in aquaculture water, serving as foundational elements of the aquatic food web [10,11]. Phytoplankton performs photosynthesis, generating oxygen and fixing carbon dioxide, roles crucial for net primary production and biological carbon cycling [12]. As an important dietary source, phytoplankton directly or indirectly supplies energy to herbivorous aquatic animals. Additionally, some phytoplankton species are capable of forming harmful algal blooms that significantly disrupt aquatic ecosystem functions [13]. These blooms not only frequently reduce critical oxygen levels in the water, thereby endangering aquatic organisms, but also release toxins [14]. Microzooplankton are responsible for transferring energy to higher trophic levels in the food chain as they primarily consume phytoplankton [15]. Both phytoplankton and microzooplankton exhibit rapid responses to environmental changes. Numerous studies have documented the adverse effects of anthropogenic pollution on plankton communities, which significantly disrupt the structure and functionality of aquatic ecosystems [16,17]. Fish movement and predation can regulate plankton population levels, thereby influencing species’ abundance and composition [18]. Alterations in plankton diversity and abundance can broadly affect water quality and nutrient cycling, impacting other biota and the stability of ecosystems [19].
In integrated rice–fish systems, phytoplankton and zooplankton play essential roles that bolster agricultural productivity and ecological balance. The composition and function of these organisms are now receiving significant attention, acknowledging their critical contributions to these integrated environments. Early studies have revealed that in the Mekong Delta rice–fish systems, fish significantly influence the Cladocera–Rotifera ratio, with increases in Rotifera populations occurring in response to fish-induced stimulation of phytoplankton growth [20]. Frei et al. [21] reported that in rice–fish coculture systems, fish activity stimulated phytoplankton growth and increased chlorophyll-a concentrations. In a rice–fish-prawn coculture system, the phytoplankton levels increased, yet this did not enhance the dissolved oxygen levels in the paddy water [22]. Conversely, some studies have reported a decline in plankton and soil benthic communities within rice-based integrated agricultural systems, suggesting their consumption by fish and ducks in these paddy ecosystems [23]. Nevertheless, existing research largely employs traditional microscopic observation to assess phytoplankton and zooplankton populations in rice–fish farming systems. The diversity, composition, and ecological functions of phytoplankton and zooplankton have yet to be fully elucidated in the systems.
Recently, technological advancements have increasingly underscored the benefits of environmental DNA (eDNA) metabarcoding in biodiversity assessment. Organisms release eDNA into aquatic environments, from which it can be collected directly and noninvasively. This approach provides heightened sensitivity compared to traditional monitoring methods, enabling the detection of a wider variety of plankton species and yielding faster results [24]. It has been extensively employed in aquatic biodiversity assessment, as evidenced by its significant impact on monitoring small and elusive amphibians [25]. Furthermore, He et al. (2023) have shown that eDNA metabarcoding is an efficient tool for tracking fish biodiversity in coastal eelgrass beds [26]. In plankton community structure analysis, eDNA metabarcoding is considered a reliable method. It has been employed to reveal the biodiversity and composition of plankton in river ecosystems [27], and confirmed its utility for monitoring natural lake ecosystems, serving as a viable complementary tool to traditional microscopy for assessing phytoplankton communities [28]. However, there has yet to be reported use of eDNA metabarcoding to explore plankton diversity and composition in integrated rice–fish farming systems. The eDNA technology facilitates the accurate and rapid identification of biodiversity from environmental samples. This method can detect a greater number of species and generate more precise data compared to conventional techniques, which is essential for monitoring the health of ecosystems and comprehending the ecological interactions in rice–fish systems. Therefore, in this study, we applied eDNA metabarcoding techniques to compare the differences in plankton diversity and community composition between integrated rice–fish farming systems and rice monoculture systems. These findings will enhance our understanding of the benefits and challenges associated with fish-rice coculture, with significant implications for sustainable agriculture and ecosystem management

2. Materials and Methods

2.1. Experimental Design and Sample Collection

The experiment was carried out at the Jingjiang experimental base located in Jingjiang (Taizhou, China). The experiment was divided into two groups: a rice monoculture group (RM) and a rice–carp coculture group (RF), with each group having two replicates. Each paddy field area is about 4000 m2. Within this, the planting area is 3600 m2 (water depth 10–20 cm), and the area of the breeding ditch on the inner side of the field is 400 m2 (depth 80 cm). Before transplantation, a base fertilizer (16% nitrogen, 8% phosphorus, and 16% potassium) was applied at a rate of 20 kg per mu (approximately 0.067 hectares). During the experiment, no pesticides and fertilization were used to maintain the stability of the rice paddy ecosystem. A total of 6000 common carp (Cyprinus carpio) (average initial weight 10.3 ± 2.1 g) were placed in each paddy on July 10 and harvested on October 24 (average final weight 52.6 ± 10.3 g) in the RF group. The carp were fed once daily with commercial feed (31.0% crude protein, 4.0% crude fat, and 18.0% crude ash; Cargill Group Co., Ltd., Changzhou, China) comprising about 1% of their body weight. Throughout the trial, traditional local practices were employed to manage the paddy fields (standard number SC/T 1135.1-2017) [29]. In both rice-only and rice–fish coculture systems, the water temperature fluctuated between 23.13 and 29.65 °C and pH levels ranged from 7.24 to 7.89. Dissolved oxygen levels ranged from 3.2 to 5.0 mg/L. These parameters showed no significant differences between the two groups.
During the study, water samples were collected from the paddy water at various stages of the rice growth cycle: tillering (T, sampling on 15 August), jointing (J, sampling on 6 September), flowering (F, sampling on 25 September), and grain-filling (G, sampling on 17 October). Sampling was conducted using 500 mL polyethylene bottles that had been sterilized and then rinsed with ultrapure water. Using the five-point sampling method (Figure S1) [30], 2.5 L of water were collected at each point. Immediately after collection, the samples were stored in a refrigerated cooler and transported to the laboratory for homogenization. An appropriate volume of the homogenized sample was filtered through a 0.22 µm fiber filter membrane using an SHZ-D (III) circulating water multipurpose vacuum pump (Tohe electromechanical Technology Co., Ltd., Shanghai, China). The filtered water was used to analyze physicochemical indicators, while the filter membrane was employed for detecting phytoplankton and zooplankton. Sample codes for rice monoculture at different growth stages—tillering, jointing, flowering, and grain-filling—are, respectively, designated as RMT, RMJ, RMF, and RMG. Correspondingly, sample codes for the rice–fish coculture system at these stages are RFT, RFJ, RFF, and RFG.

2.2. Measurement of Nutrients in the Water

Water samples underwent filtration to eliminate sediment and planktonic organisms prior to water quality assessment. Total phosphorus levels were measured using the ammonium molybdate spectrophotometric method [31]. Total nitrogen was quantified via alkaline potassium persulfate digestion followed by ultraviolet spectrophotometry [32]. Ammonia nitrogen concentrations were determined employing the Nessler reagent spectrophotometric method [33]. Nitrate and nitrite nitrogen levels were assessed using ultraviolet and standard spectrophotometric methods, respectively [34,35]. Nutrient levels were utilized to assess the influence of environmental factors on the community composition of phytoplankton and microzooplankton in paddy water, using distance-based redundancy analysis (db-RDA) [36].

2.3. Planktonic DNA Extraction, PCR Amplification and Sequencing

Microbial DNA from filter membranes was isolated using the PowerWater DNA Isolation Kit (Qiagen, Valencia, CA, USA) according to the manufacturer’s instructions. The quality of the extracted DNA was confirmed by agarose gel electrophoresis at a 1% concentration. High-quality DNA is characterized by the presence of a distinct, unbroken band on the gel. DNA concentration was assessed using a spectrophotometer (NanoDrop ND-1000, NanoDrop Technologies, Wilmington, DE, USA). Amplification of the V9 region of the 18S rRNA in the plankton from paddy water was conducted using primers 18SV9F (5′-CCCTGCCNTTTGTACACAC-3′) and 18SV9FR (5′-CCTTCNGCAGGTTCACCTAC-3′) [37]. PCR amplification was performed using TransStart FastPfu DNA Polymerase (TransGen Biotech, Beijing, China). The reaction conditions were as follows: an initial denaturation step at 95 °C for 5 min; followed by cycles of 30 s at 95 °C, 30 s at 58 °C, and 45 s at 72 °C; and a final extension at 72 °C for 10 min. Quantification of PCR products was performed using the Quantus™ Fluorometer (Promega, Madison, WI, USA). The pooled DNA product was then used to construct an Illumina pair-end library, following the genomic DNA library preparation protocol specified by Illumina. Subsequently, the amplicon library underwent paired-end sequencing using the Illumina NovaSeq PE250 platform (Shanghai BIOZERON Co., Ltd., Shanghai, China).

2.4. Data Processing

The raw DNA sequencing data are subjected to quality control, filtering, and chimera removal to obtain clean reads [38]. High-quality reads were attributed to specific samples based on unique barcodes located at the end of reverse primers. Subsequently, these reads were assigned to amplicon sequence variants (ASVs) using the Divisive Amplicon Denoising Algorithm 2 (DADA2) method within the Quantitative Insights Into Microbial Ecology 2 (QIIME2) framework [39]. Taxonomic annotation of ASVs was conducted using the QIIME2 pipeline, which is based on the SILVA 138 database [40]. ASVs associated with phytoplankton and microzooplankton were separately categorized using an in-house R script (Shanghai BIOZERON Co., Ltd.). Subsequently, the taxonomic classifications at the phylum (or subphylum and class) level were reassigned.

2.5. Statistical Analysis

All statistics analyses were performed using the R v4.0.2 platform. The alpha diversity analysis (Chao1, Shannon, Pielou_J, and PD_faith) for each sample was conducted using the Vegan package in R. The Bray–Curtis algorithm was employed to measure the distances between samples from RM and RF groups. Principal coordinates analysis (PCoA) and analysis of similarities (ANOSIM) were utilized to assess variations in the plankton community compositions between the RM and RF groups. Differences in alpha diversity indices, relative abundance, and community distances between samples from RM and RF groups were analyzed using the Kruskal–Wallis test and Mann–Whitney U-test. Statistical significance was determined by a p-value less than 0.05.

3. Results

3.1. Annotation of Plankton

According to the sequencing and data processing, this study obtained 10,060,582 sequencing reads from 80 water samples (Table S1). The ASVs associated with phytoplankton and microzooplankton were successfully annotated at the phylum (or class) level, achieving a 100% success rate (Figure S2). In total, 9 phyla, 89 families, 275 genera, and 249 species of phytoplankton were identified (Table S2). Additionally, 20 phyla (subphyla and classes), 85 families, 222 genera, and 179 species of zooplankton were identified (Table S3).

3.2. Differences in Alpha Diversity of Phytoplankton and Microzooplankton

In phytoplankton communities, the Chao1 and PD_faith diversity indices exhibited similar patterns, both increasing initially and then decreasing from the tillering to the grain-filling stages (Figure 1A,D). Specifically, the Chao1 index was lower in the RF group than in the RM group during the tillering and flowering stages; however, it surpassed the levels seen in the RM group at the grain-filling stage (p < 0.05). The PD_faith index was higher in the RF group compared to the RM group during the grain-filling stage (p < 0.05). The Shannon and Pielou’s evenness indices displayed similar trends from the tillering to the grain-filling stages, with notable increases in the RF group compared to the RM group specifically at the grain-filling stage (Figure 1B,C; p < 0.05), while no significant differences were noted at other stages.
In microzooplankton communities, the Chao1 and PD_faith diversity indices were significantly higher in RF groups compared to RM groups during the flowering and grain-filling stages (p < 0.05; Figure 2A,D). The Shannon and Pielou’s evenness indices displayed consistent trends from the tillering to the grain-filling stages; specifically, these indices in RF group were lower at the tillering stage but increased at the jointing and grain-filling stages (p < 0.05; Figure 2B,D).

3.3. Differences in Beta Diversity of Phytoplankton and Microzooplankton

Bray–Curtis distance was used to evaluate the variations of phytoplankton and microzooplankton communities among different groups. The PCoA demonstrated that there was a significant difference in the phytoplankton community among different groups (ANOSIM: R = 0.8024, p = 0.001) (Figure 3A). Concurrently, the group distance analysis indicated a more pronounced effect of rice–carp coculture on phytoplankton communities. Moreover, the composition of the phytoplankton community exhibited significant variations across different growth stages of rice (Figure 3B). Similar to the phytoplankton community, microzooplankton communities from different groups clustered separately. Significant differences in the composition of microzooplankton communities between different groups were confirmed (ANOSIM: R = 0.838, p = 0.001) (Figure 3C). Furthermore, the Bray–Curtis distances of microzooplankton communities in RF group were significantly larger than those in RM, and the composition of the microzooplankton community exhibited significant variations across different growth stages of rice (Figure 3D).

3.4. Differences in Compositions of Phytoplankton

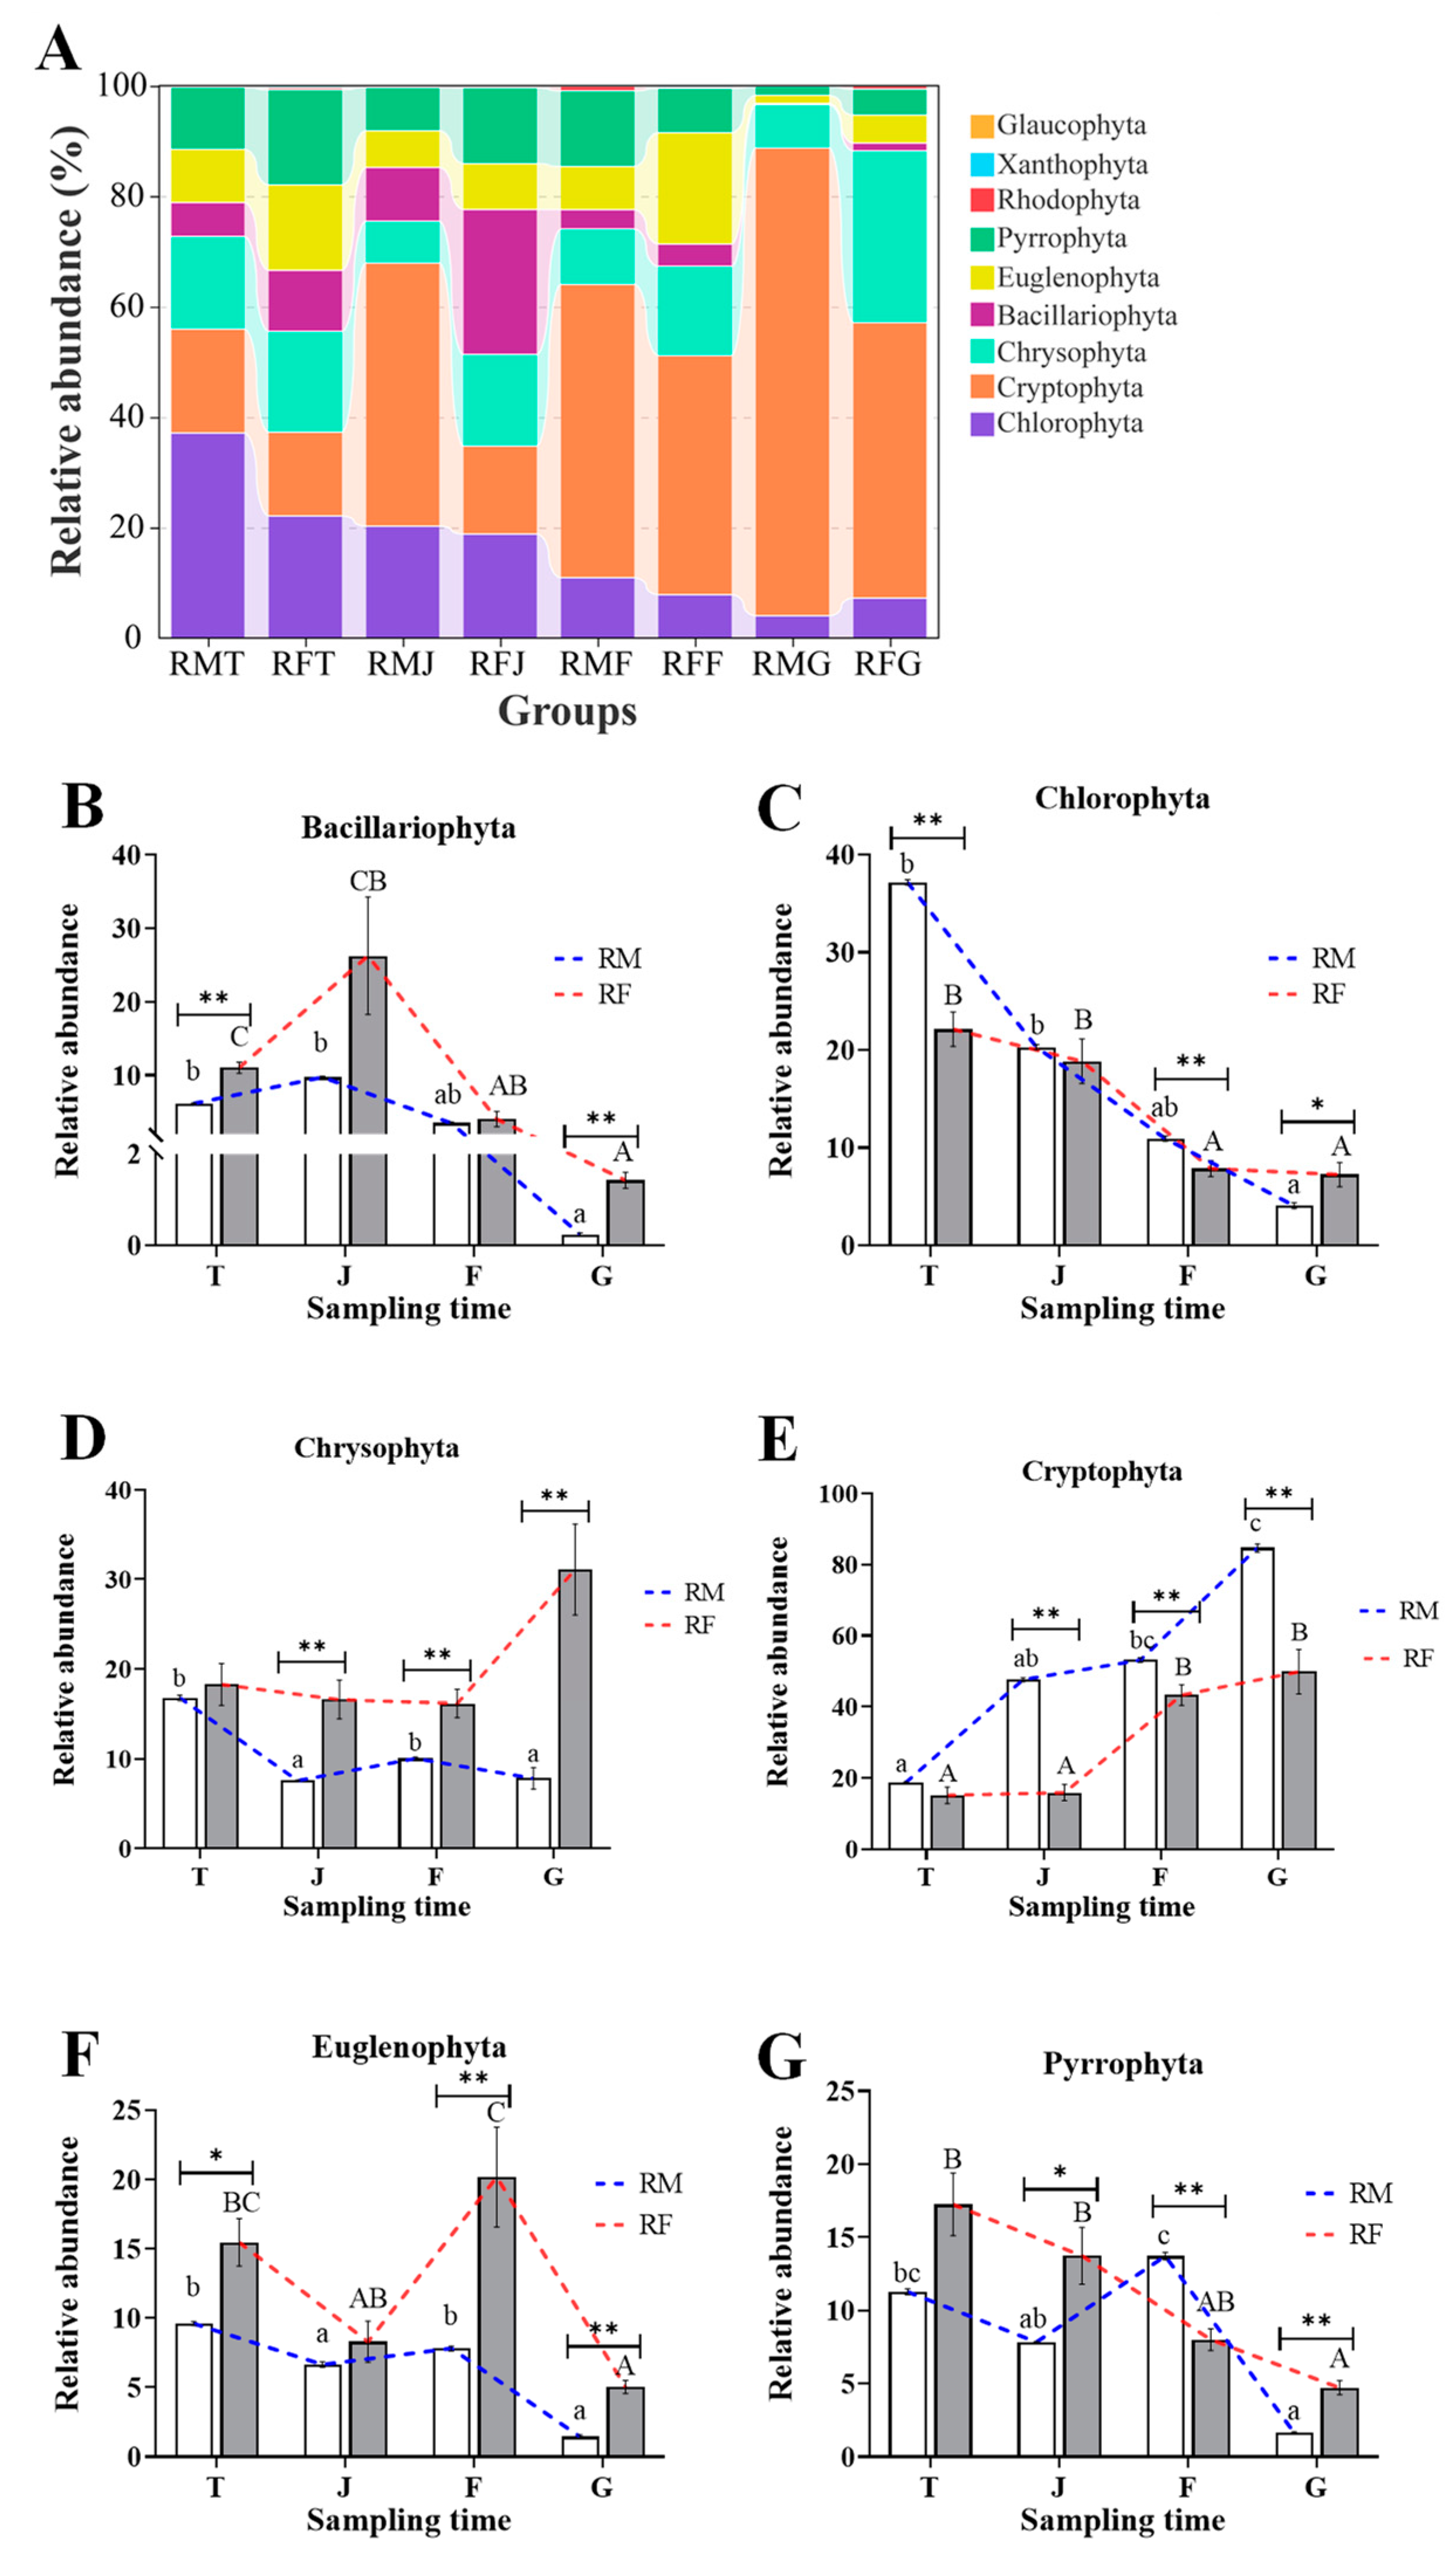
Comparative analysis between the RM and RF groups identified the presence of nine phytoplankton phyla: Cryptophyta, Chrysophyta, Chlorophyta, Pyrrophyta, Euglenophyta, Bacillariophyta, Rhodophyta, Xanthophyta, and Glaucophyta. Notably, Chrysophyta, Chlorophyta, Bacillariophyta, Pyrrophyta, and Euglenophyta emerged as the top six abundant phytoplankton (Figure 4A). Bacillariophyta demonstrated a trend of initial increase followed by a decrease in relative abundance from the tillering to the grain-filling stages, and was significantly more abundant in the RM group during the tillering and the grain-filling stages (Figure 4B; p < 0.05). Chlorophyta showed a marked decline from the tillering to the grain-filling phase in both groups, with lower levels observed in the RF group during the tillering and flowering stages, although it increased during the grain-filling stage (Figure 4C; p < 0.05). The relative abundance of Chrysophyta significantly increased from the jointing to the grain-filling stages in the RF group compared with the RM group (Figure 4D; p < 0.05). Similarly, the relative abundance of Euglenophyta was significantly higher at the tillering, flowering, and grain-filling stages in the RF group compared to the RM group (Figure 4F; p < 0.05). In contrast, Cryptophyta showed a significant decrease from jointing to grain-filling stages in the RF group relative to the RM group (Figure 4E; p < 0.05). Pyrrophyta’s relative abundance in the RF group increased at the jointing and grain-filling stages, yet decreased at the flowering stage relative to the RM group (Figure 4G; p < 0.05).
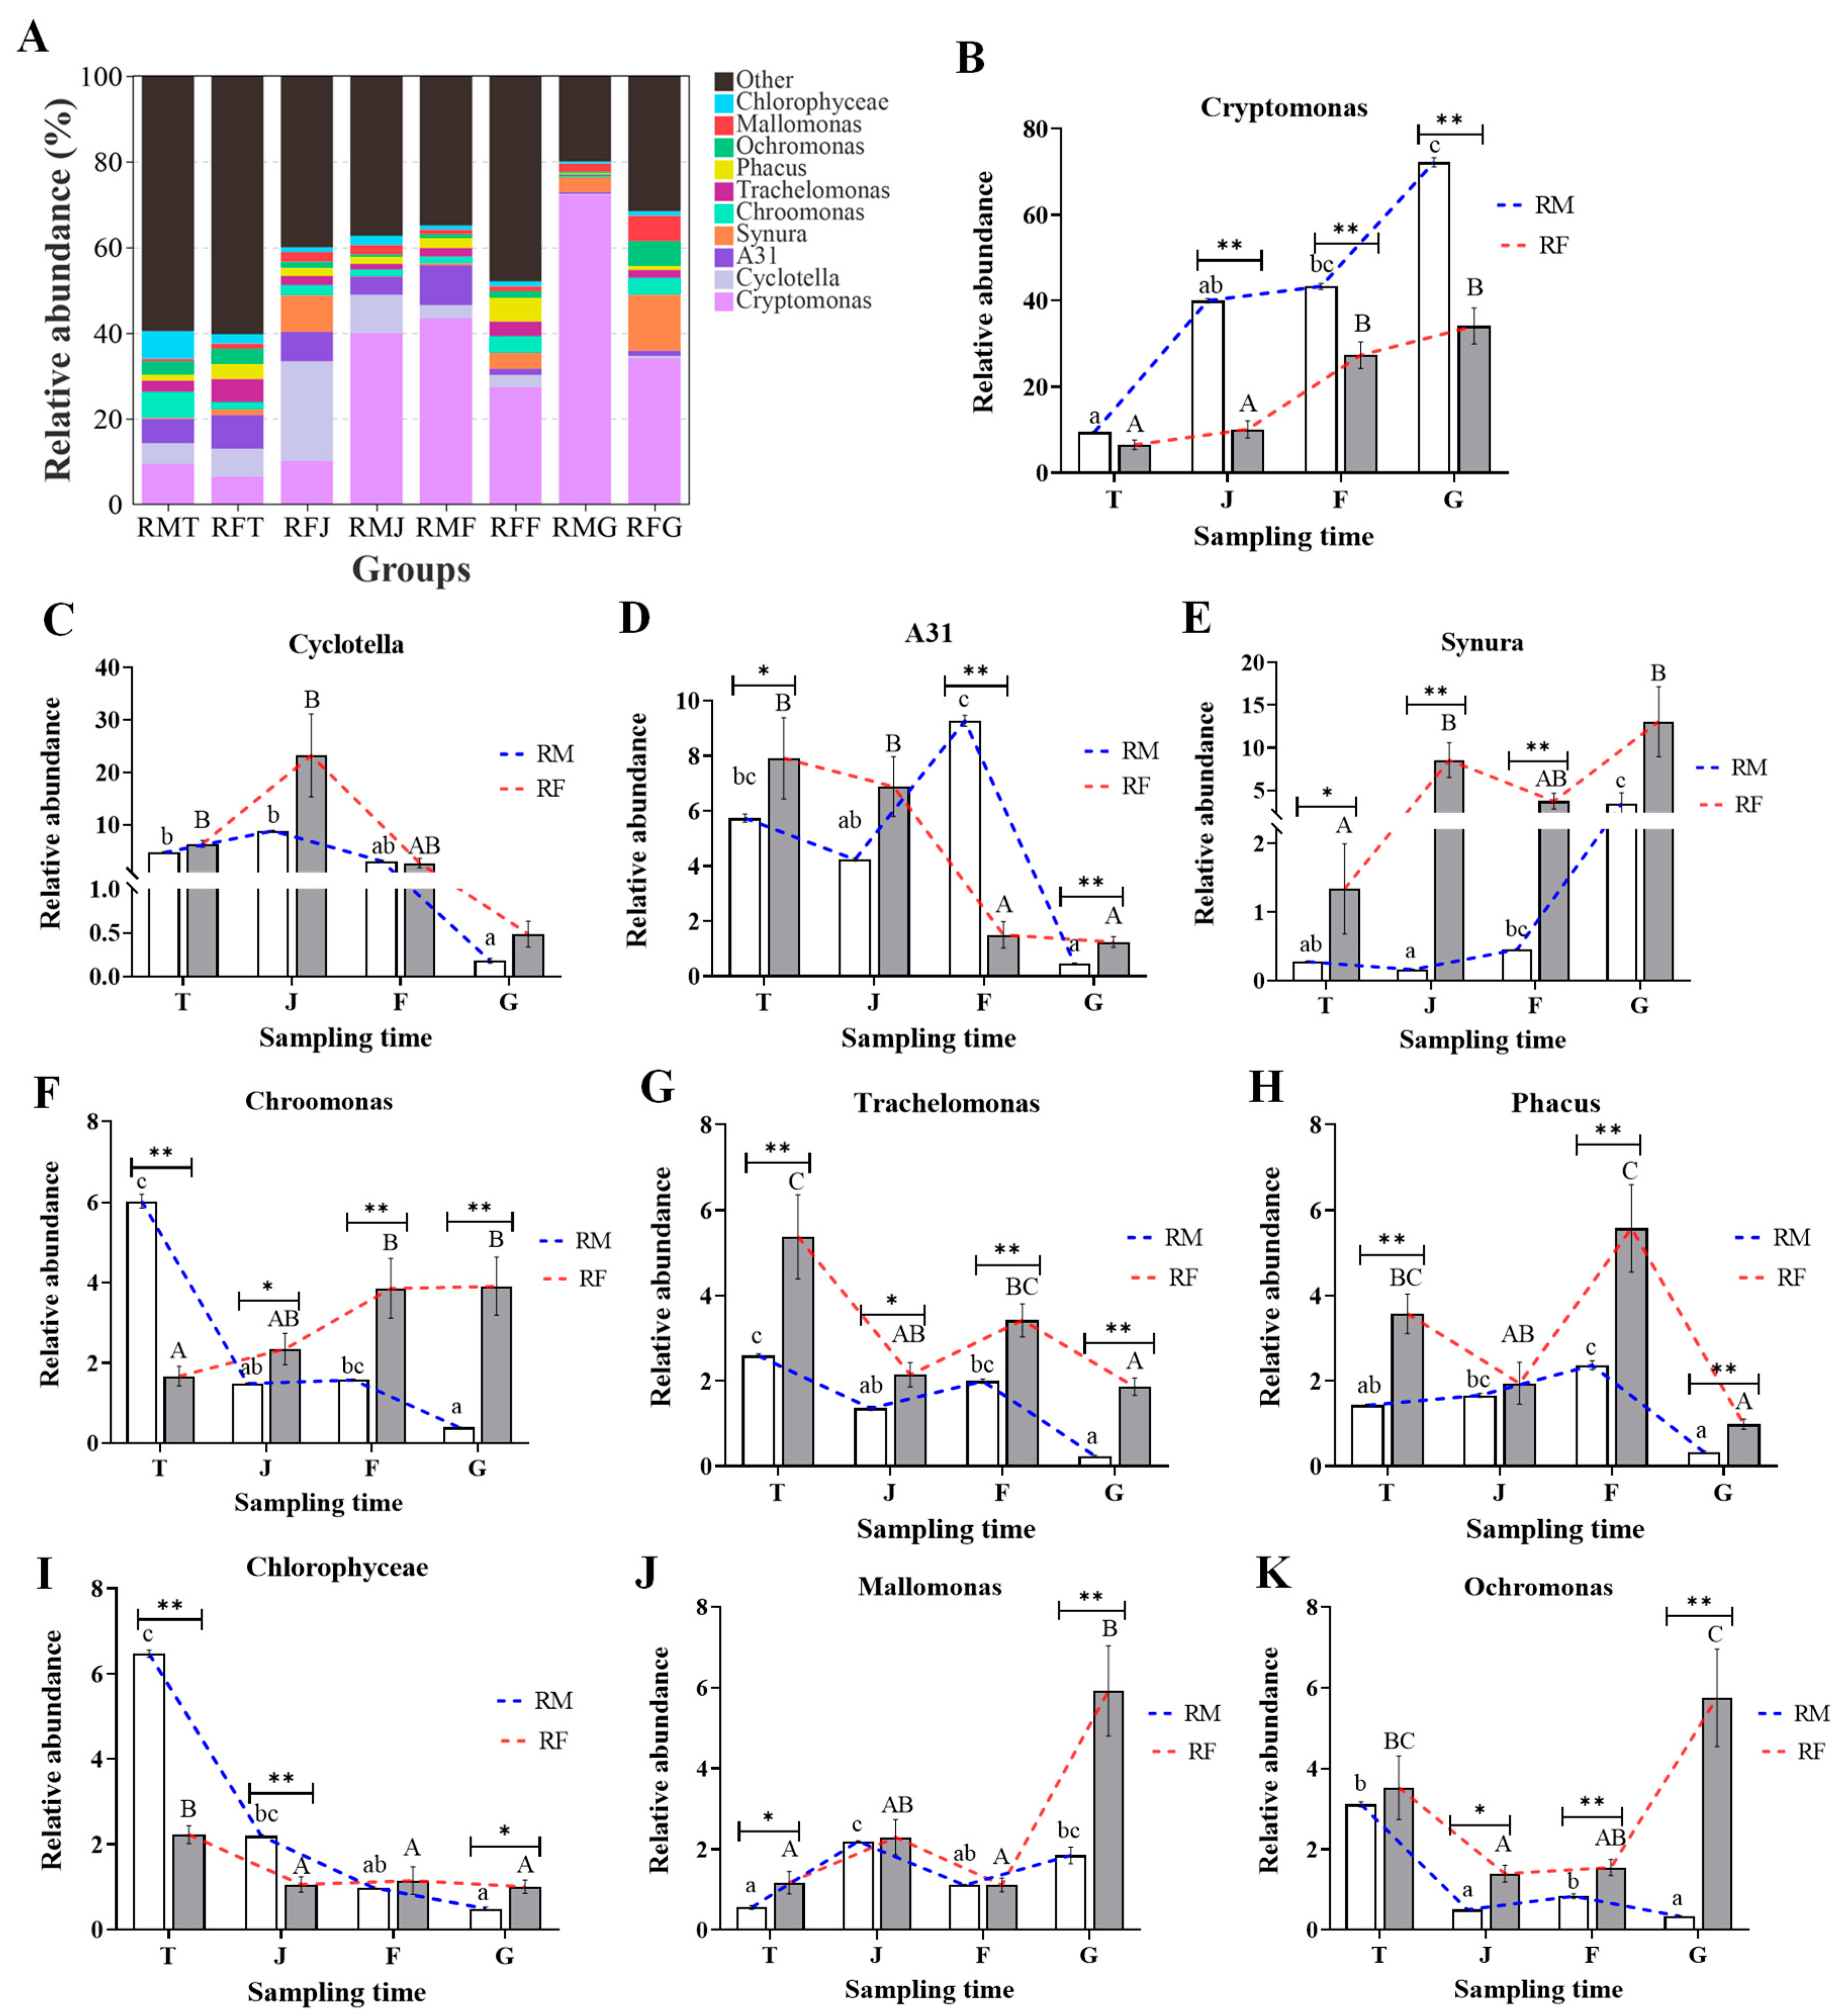
At the genus level, 275 phytoplankton were identified within the RM and RF groups. The top 10 genera consisted of Cryptomonas, Cyclotella, A31, Synura, Chroomonas, Trachelomonas, Phacus, Ochromonas, Mallomonas, and Chlorophyceae (Figure 5). The relative abundance of phytoplankton at the genus level was significantly affected by the farming modes and the developmental stages of rice (Figure 5A). The relative abundance of Cryptomonas showed an upward trend from the tillering to the grain-filling stages. Compared with the RM group, its abundance was significantly lower in the RF groups at the jointing, flowering, and grain-filling stages (Figure 5B; p < 0.05). The relative abundance of Synura, Chroomonas, Trachelomonanas, Phacus, and Ochromonas exhibited irregular variations from the tillering stage to the grain-filling stage. These phytoplankton had significantly higher abundances in the RF groups from the tillering stage (or jointing) to the grain-filling stage compared with the RM group (Figure 5E–H,K; p < 0.05). The relative abundance of Chlorophyceae was significantly lower in the RF group at the jointing and tillering stages but increased at the grain-filling stage relative to the RM group (Figure 5I; p < 0.05). The relative abundance of Mallomonas was also significantly higher in the RF groups at the jointing and grain-filling stages compared to the RM group (Figure 5J; p < 0.05).

3.5. Differences in Compositions of Microzooplankton

In the RM and RF groups, 20 microzooplankton phyla (or subphyla and classes) were identified (Table S6). The composition and abundance of this microzooplankton exhibited significant changes between the RF and RM groups across various rice growth stages (Figure 6). At the tillering stage, the predominant phyla (or subphyla) in both the RF and RM groups were Intramacronucleata (subphylum), Cercozoa, and Stramenopiles. The RF group exhibited a significantly higher abundance of Intramacronucleata and lower abundances of Cercozoa and Stramenopiles compared to the RM group (Figure 6B–D,F; p < 0.05). At the jointing stage, notable differences were observed in the phyla (or subphyla and classes) composition between the RF and RM groups. For the RF group, the predominant phyla (or subphyla and classes) were Intramacronucleata, Cercozoa, and Stramenopiles, while in the RM group, the dominant phyla (or subphyla and classes) included Intramacronucleata, Conoidasida (class), and Stramenopiles (Figure 6A). It is important to note that the RF group displayed a significantly higher abundance of Cercozoa and a lower abundance of Conoidasida compared to the RM group (Figure 6C, D; p < 0.05). During the flowering stage, the predominant phyla (or subphyla and classes) in both groups were consistent: Intramacronucleata, Conoidasida, and Stramenopiles (Figure 6A). However, the abundances showed significant differences; specifically, the RF group had significantly higher levels of Intramacronucleata, but lower levels of Conoidasida and Stramenopiles when compared with the RM group (Figure 6B,D,E; p < 0.05). At the grain-filling stage, the composition of the predominant phyla (or subphyla and classes) differed between the RF and RM groups. In the RM group, Conoidasida, Intramacronucleata, and Cercozoa were the principal phyla (class), while in the RF group, the dominant phyla (or subphyla and classes) comprised Intramacronucleata, Conoidasida, and Stramenopiles (Figure 6A). Notably, the RF group exhibited a significantly lower abundance of Conoidasida and higher abundances of Stramenopiles and Kinetoplastea (class) compared to the RM group (Figure 6D–F; p < 0.05).
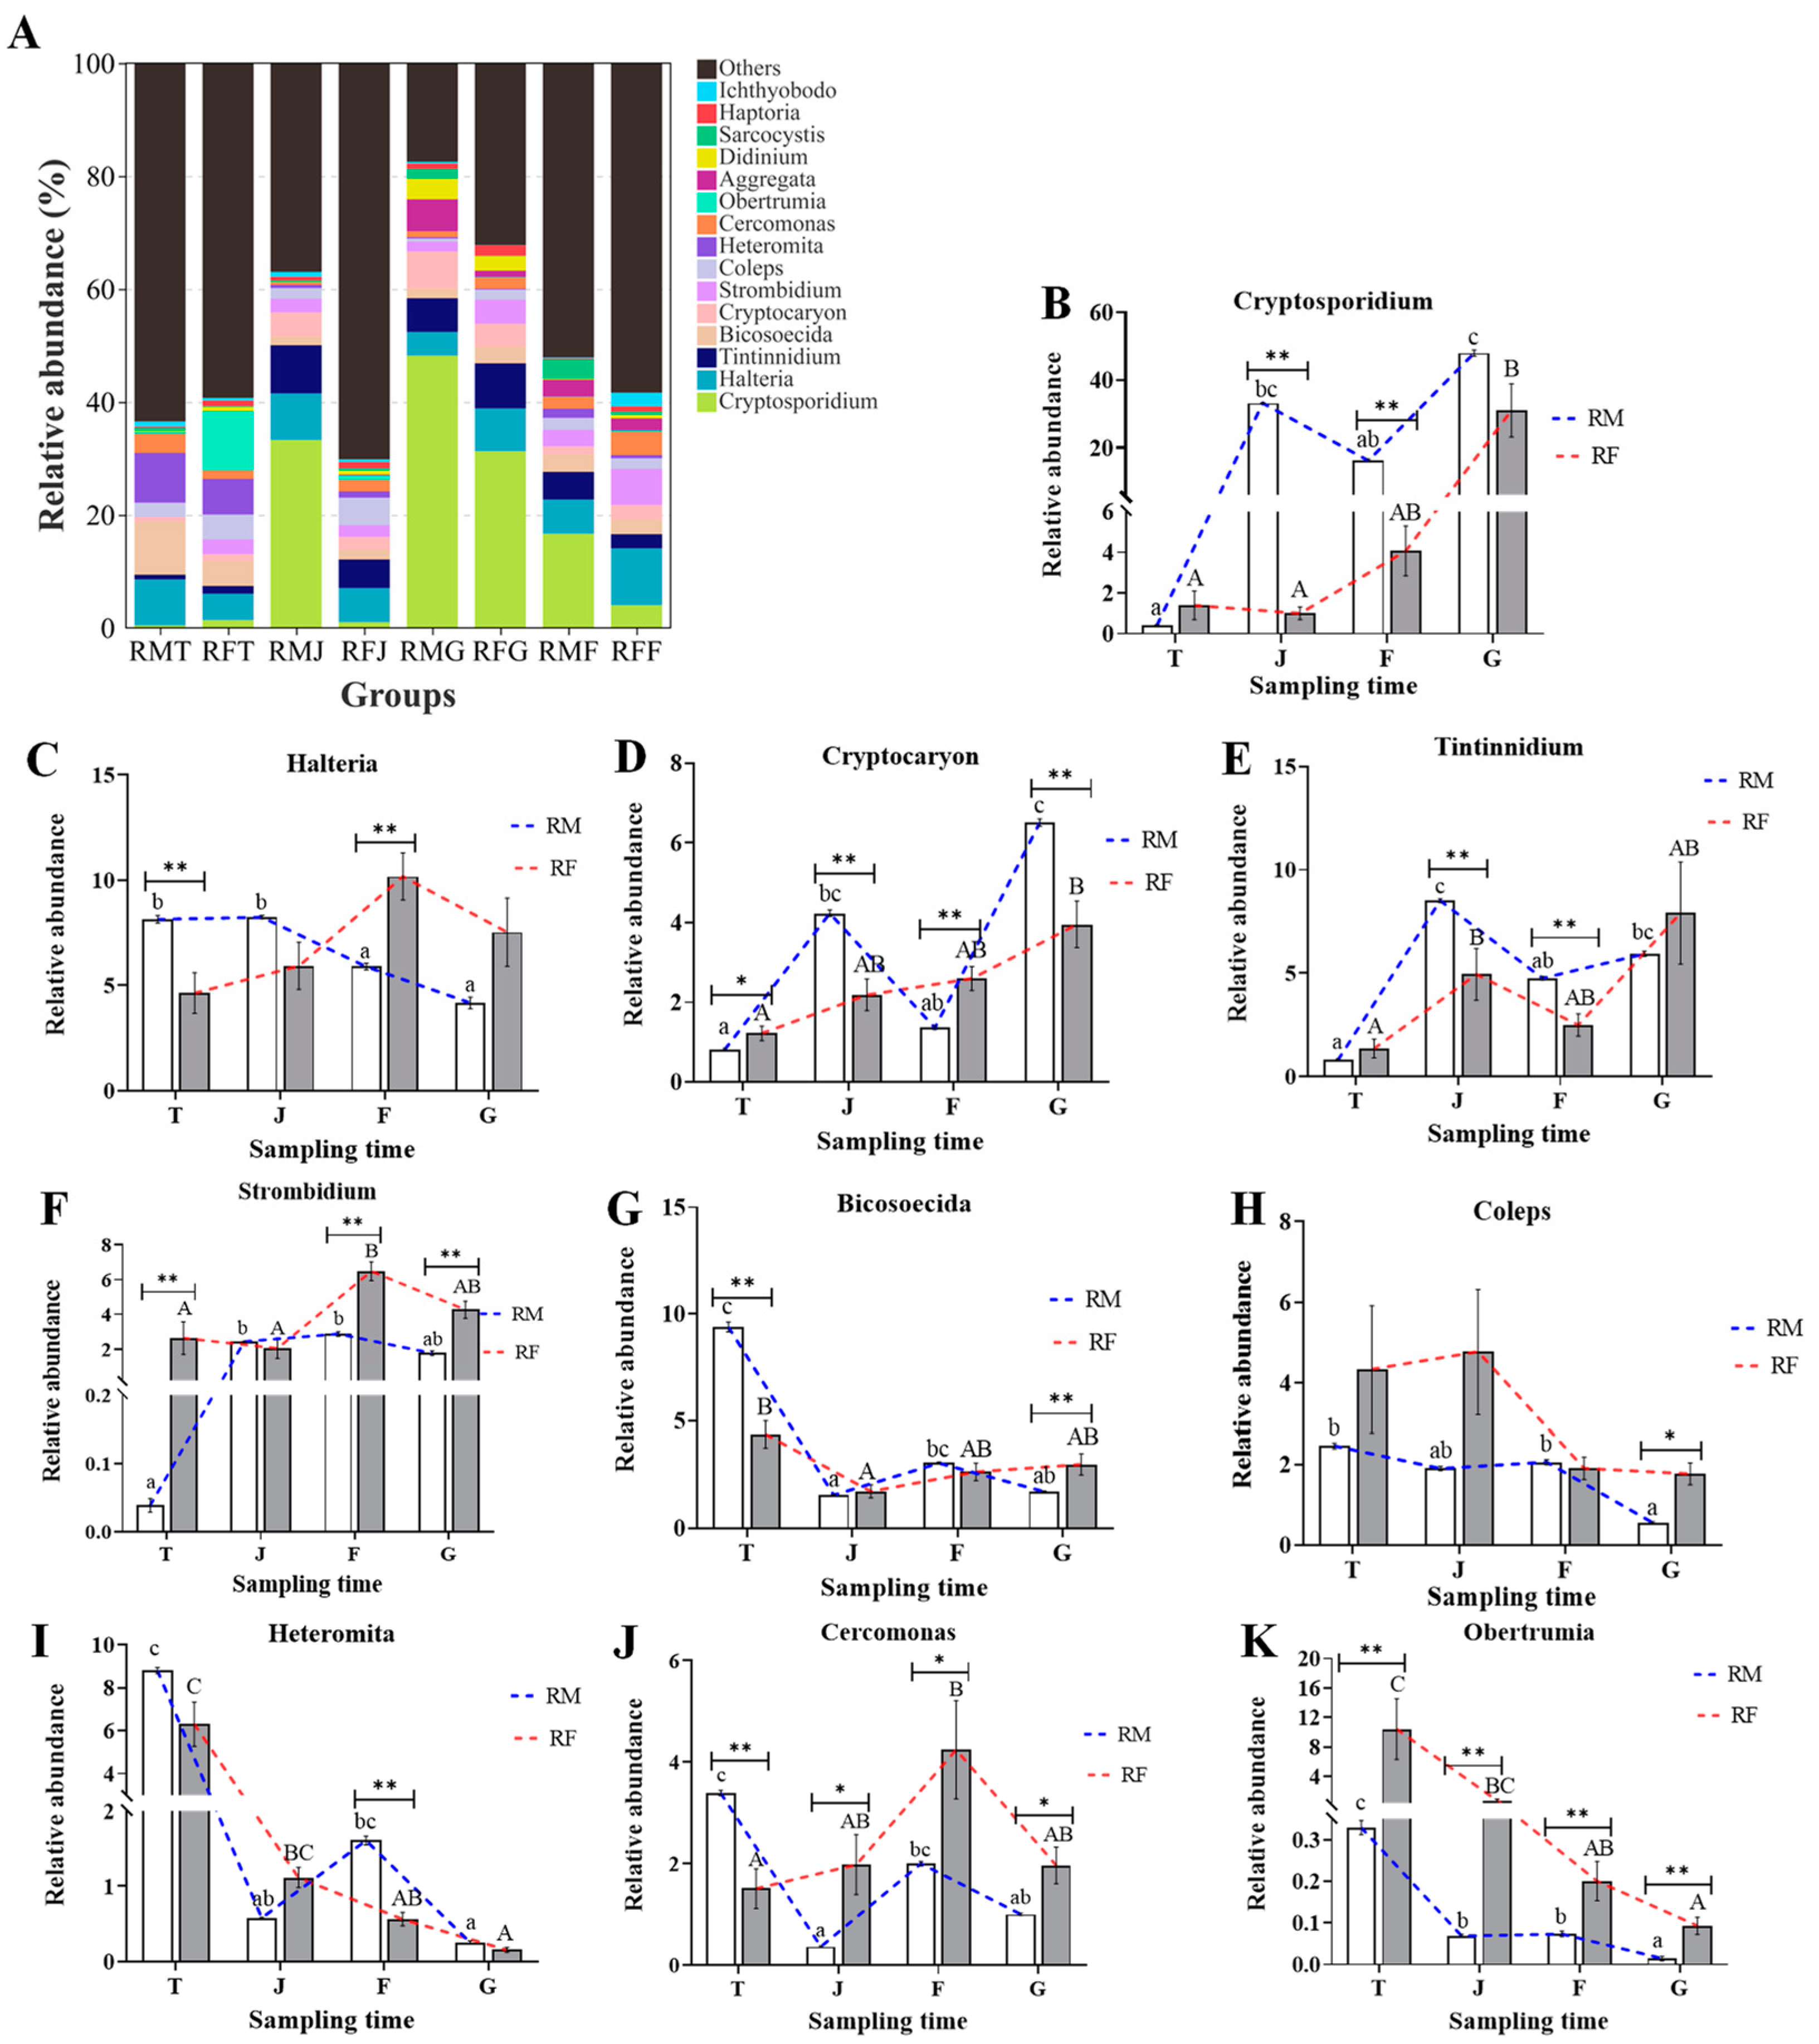
The community composition at the genus level showed significant differences between the RF and RM groups across various stages of rice growth (Figure 7A). At the tillering stage, the predominant genera composition differed between the RF and RM groups. The RM group was characterized by Bicosoecida, Halteria, Heteromita, Cercomonas, and Coleps, whereas the RF group featured Obertrumia, Heteromita, Halteria, Bicosoecida, and Coleps (Figure 7A). Notably, in the RF group, the relative abundance of Bicosoecida and Halteria decreased, whereas that of Obertrumia increased compared to the RM group (Figure 7C,G,K; p < 0.05). During the jointing stage, the leading genera in the RM group were Cryptosporidium, Tintinnidium, Halteria, Cryptocaryon, and Strombidium, while the RF group was dominated by Halteria, Tintinnidium, Coleps and Cryptocaryon. In comparison to the RM group, the RF group had less Cryptosporidium and Cryptocaryon, but higher abundance of Cercomonas and Obertrumia (Figure 7B,D,J,K; p < 0.05). At the flowering stage, major genera in the RM group included Cryptosporidium, Cryptocaryon, Tintinnidium, Aggregata, and Halteria, whereas the RF group was represented by Cryptosporidium, Tintinnidium, Halteria, Strombidium, and Cryptocaryon. The RF group exhibited a lower relative abundance of Cryptosporidium and Tintinnidium, but a higher prevalence of Halteria, Cryptocaryon, and Strombidium compared to the RM group (Figure 7B–F; p < 0.05). At the grain-filling stage, the RM group primarily consisted of Cryptosporidium, Halteria, Tintinnidium, Sarcocystis, and Bicosoecida, whereas the RF group was characterized by Halteria, Strombidium, Cercomonas, Cryptosporidium, and Bicosoecida. Notably, the RF group exhibited a higher relative abundance of Strombidium, Cercomonas, and Bicosoecida compared to the RM group (Figure 7F,G,J; p < 0.05).

3.6. Correlations of Environmental Factors with Water Plankton Communities

Results from the RDA indicate that the environmental factors identified in this study explained 95.41% of the variance observed in phytoplankton communities within paddy water. Significant correlations were observed between the phytoplankton communities and most environmental variables, with the exception of total phosphorus (TP) (Figure 8A, Table S5, p < 0.05). Similarly, environmental factors such as nitrite–nitrogen (NO2–N), ammonium–nitrogen (NH4–N), total nitrogen (TN), and TP showed significant correlations with the microzooplankton community structure (Figure 8B, Table S6, p < 0.05). Additionally, the plankton communities demonstrated notable variations across different farming models and culture stages.

4. Discussion

Phytoplankton and zooplankton are fundamental to aquatic ecosystems, playing crucial roles in energy transfer and biogeochemical cycling. The diversity and relative abundance of these organisms may vary across different aquatic ecosystems due to factors such as different sampling time in rice–fish systems [41]. In the study, the diversity indices (Chao1, PD_faith, Shannon, and Pielou’s evenness) exhibit distinct patterns for phytoplankton and microzooplankton communities during the crop growth stages, particularly at the grain-filling stage. Notably, the RF group shows higher diversity compared to the RM group at this stage, suggesting that fish inclusion in the rice cropping system enhances plankton diversity during the grain-filling period. In terms of phytoplankton, the Chao1 and PD_faith indices initially increase and then decrease, with the RF group surpassing the RM group during the grain-filling stage. This indicates that the coculture may promote phytoplankton richness and phylogenetic diversity during this critical crop development stage [42]. Similarly, Shannon and Pielou’s evenness indices for phytoplankton show notable increases in the RF group compared to the RM group at the grain-filling stage. A higher evenness suggests a more balanced distribution of species abundances, implying that the coculture system promotes a more diverse and evenly distributed phytoplankton community during this critical period of crop maturation [43]. Similar to the phytoplankton community, the RF group exhibits significantly higher Chao1 and PD_faith indices for microzooplankton during the flowering and grain-filling stages. This suggests that the coculture supports greater richness and phylogenetic diversity of microzooplankton during these later periods of crop maturation [44,45]. The Shannon and Pielou’s evenness indices are used to assess the diversity and distribution of microzooplankton communities [46]. In the RF group, these indices are lower during the tillering stage but increase as the crop progresses to the jointing and grain-filling stages. This pattern suggests that the coculture helps promote a more evenly distributed microzooplankton community as the crop matures. These results may imply that the diversity and relative abundance of different microzooplankton species become more balanced over the course of the crop’s development in the rice–fish coculture system.
The PCoA results indicated that phytoplankton and microzooplankton communities within identical groups exhibited pronounced clustering, signifying distinct compositional differences among the groups. These variations could be attributed to differing rice growth stages and farming modes. These results confirm previous studies showing how agriculture and aquaculture activities affect plankton communities [47]. The cocultivation of fish and rice creates a unique ecosystem that impacts nutrient availability and organic matter [23,48]. It is important to note that plankton dynamics can be influenced by multiple factors, such as water quality, temperature, and interactions with other organisms [49,50]. Moreover, the inclusion of fish in the rice–fish coculture system introduces additional nutrients and creates new ecological niches, which enriches the diversity of plankton species, particularly among zooplankton communities [19,51]. Additionally, changes in the composition of the phytoplankton community correspond closely with different rice growth stages, underscoring the strong interdependence between phytoplankton dynamics and the rice cultivation cycle [52,53].
In this study, 9 phytoplankton phyla and 275 genera were identified in both the RF and RM systems, revealing significant variations in species composition compared to previous research. For instance, a previous study identified 95 species across 5 phyla were reported in the rice–shrimp farming system in the coastal area of the Vietnamese Mekong Delta [54]. Palupi et al. (2023) identified 3 classes and 16 genera of phytoplankton in a rice–fish farming system using traditional observation methods [19]. These discrepancies in species composition may be attributed to the varying influence of factors such as temperature, pH, and nutrient availability in the paddy water, as well as differences in the methods of examination. It is worth noting that the abundance of these phyla and genus varied at different stages of rice growth and between the two farming modes. This underscores the significant impact of rice–carp coculture and rice growth stages on phytoplankton communities [52,55]. Previous studies have documented alterations in phytoplankton community composition in response to environmental variables within aquaculture settings, such as nutrient availability, the presence of cultivated species, and water quality [56,57,58]. The observed fluctuations in the relative abundance of specific phytoplankton groups align with their known ecological preferences and adaptations to different aquatic conditions [59,60].
Similarly, this study identified significant variations in the composition and abundance of microzooplankton communities between the RF and RM at different stages of rice growth. These findings emphasize how the presence of fish species and their interactions with the rice ecosystem affect the dynamics of zooplankton communities. At the phylum (subphylum or class) level, the RF group had higher abundances of certain phyla (subphyla or classes), such as Intramacronucleata, compared to the RM group during specific growth stages. In aquatic ecosystems, Intramacronucleata play a crucial role in controlling populations of bacteria and algae, thereby sustaining water quality and ecological balance. They are also a critical food source for aquatic animals, making them an indispensable link in aquatic food chains [61]. Likewise, at the genus level, the RF and RM groups exhibited different compositions and relative abundances of major genera throughout the rice growth stages. Specifically, the RF group had higher abundances of genera like Strombidium, Obertrumia and Cercomonas, while the RM group had higher abundances of genera such as Cryptosporidium and Tintinnidium. These microzooplankton are crucial in freshwater aquaculture environments, where they significantly contribute to maintaining water quality and ecological balance. For example, Cercomonas helps control bacterial levels by preying on bacteria in the water, which is crucial for preventing or reducing the spread of pathogens [62]. Cryptosporidium, a protozoan parasite commonly found in water and soil, can cause intestinal diseases in animals [63]. In the RF group, increased abundance of Cercomonas and reduced abundance of Cryptosporidium may be beneficial to fish health.
In this study, we evaluated the diversity and composition of phytoplankton and microzooplankton in paddy water, obtaining numerous useful data. However, the research also exhibited several limitations: (1) In this study, we employed a single pair of universal primers, whose specificity, sensitivity, and efficiency have been confirmed by previous research. However, it is possible that certain species may not be reliably identified. Additionally, primer bias may cause preferential amplification, favoring abundant sequences over rare ones, shorter fragments over longer ones, and nontarget organisms over target organisms. (2) In this study, we were limited to monitoring the diversity, composition, and relative abundance of plankton by eDNA sequencing. However, quantifying absolute abundance and biomass presented challenges. (3) Despite the widespread use of eDNA technology in plankton studies, the current incompleteness of reference sequence databases for many organisms remains a significant limitation for biodiversity assessments and the taxonomic identification of taxa. (4) The sampling for this study was conducted in a specific region, influenced by local aquaculture practices and climatic conditions. As a result, the diversity and composition of plankton varied according to these factors. Accordingly, the findings of this study are representative only of this distinct area.

5. Conclusions

Our study demonstrated the feasibility of using eDNA metabarcoding sequencing to analyze the diversity and composition of phytoplankton and microzooplankton in paddy water. Based on the alpha diversity analysis, plankton richness, diversity, and evenness were significantly higher in the RF group compared to the RM group at certain rice growth stages. Notable differences in phytoplankton and microzooplankton compositions between the RM and RF groups were observed at different rice growth stages. In the phytoplankton, rice–carp coculture increased the relative abundance of dominant phyla such as Bacillariophyta, Chrysophyta, Euglenophyta, and Pyrrophyta while decreasing that of Cryptophyta. In microzooplankton, rice–carp coculture led to an increased relative abundance of Intramacronucleata and reduced that of Conoidasida. Furthermore, the relative abundance of both phytoplankton and microzooplankton was significantly altered during different rice growth stages, although these changes did not follow a consistent pattern. These findings provide valuable data for understanding the extensive impact of integrated rice–carp farming on agricultural ecosystems, particularly in terms of the diversity and composition of phytoplankton. Our research has potential implications for regional policies, particularly those concerning integrated rice–fish farming systems. The findings demonstrate that this technology is beneficial for analyzing the interactions among plankton within the rice paddy ecosystem and their relationships with environmental factors. Additionally, it positively impacts the management of water quality in rice paddies, which further enhances the sustainable development of regional integrated rice–fish farming.

Supplementary Materials

The following supporting information can be downloaded at: https://www.mdpi.com/article/10.3390/w16192775/s1, Figure S1: Schematic diagram of the 5-point sampling method in the study; Figure S2: Ratios of successfully annotated ASVs at different taxonomic levels in phytoplankton and zooplankton; Table S1: Clean data statistics; Table S2: Statistics of taxonomy annotation of phytoplankton in rice–carp coculture and rice monoculture; Table S3: Statistics of taxonomy annotation of microzooplankton in rice–carp coculture and rice monoculture; Table S4: Significance tests of environmental factors in redundancy analysis (RDA) of phytoplankton; Table S5: Significance tests of environmental factors in redundancy analysis (RDA) of microzooplankton. Table S6. The composition of microzooplankton at phylum (or subphylum and class) level.

Author Contributions

Conceptualization, R.J. and J.Z.; methodology, G.T.W.; software, G.U.A.; validation, G.T.W., L.Z. and Y.H.; formal analysis, B.L.; investigation, G.T.W.; resources, B.L.; data curation, G.U.A.; writing—original draft preparation, G.T.W.; writing—review and editing, R.J.; visualization, R.J.; supervision, J.Z.; project administration, B.L.; funding acquisition, J.Z. All authors have read and agreed to the published version of the manuscript.

Funding

This research was funded by earmarked fund for CARS (CARS-45), Central Public-Interest Scientific Institution Basal Research Fund, CAFS (2023TD64), National Key R&D Program of China (2019YFD0900305).

Data Availability Statement

All data are contained within the main manuscript and Supplementary Material.

Conflicts of Interest

The authors declare no conflicts of interest.

References

  1. Ahmed, N.; Hornbuckle, J.; Turchini, G.M. Blue-green water utilization in rice-fish cultivation towards sustainable food production. Ambio 2022, 51, 1933–1948. [Google Scholar] [CrossRef] [PubMed]
  2. National Aquatic Technology Extension Station. Report on the Development of China’s Rice-Fishery Comprehensive Breeding Industry (2024); National Aquatic Technology Extension Station: Beijing, China, 2024. [Google Scholar]
  3. Xie, J.; Hu, L.; Tang, J.; Wu, X.; Li, N.; Yuan, Y.; Yang, H.; Zhang, J.; Luo, S.; Chen, X. Ecological mechanisms underlying the sustainability of the agricultural heritage rice-fish coculture system. Proc. Natl. Acad. Sci. USA 2011, 108, E1381–E1387. [Google Scholar] [CrossRef] [PubMed]
  4. Hu, L.; Ren, W.; Tang, J.; Li, N.; Zhang, J.; Chen, X. The productivity of traditional rice-fish co-culture can be increased without increasing nitrogen loss to the environment. Agric. Ecosyst. Environ. 2013, 177, 28–34. [Google Scholar] [CrossRef]
  5. Li, Y.; Phonexay, M.; Zhang, Z.; Li, C.; Li, J.; Zhang, W. Status of rice-fish farming and rice field fisheries in Northern Laos. Front. Sustain. Food Syst. 2023, 7, 1174172. [Google Scholar] [CrossRef]
  6. Wan, N.-F.; Li, S.-X.; Li, T.; Cavalieri, A.; Weiner, J.; Zheng, X.-Q.; Ji, X.-Y.; Zhang, J.-Q.; Zhang, H.-L.; Zhang, H. Ecological intensification of rice production through rice-fish co-culture. J. Clean. Prod. 2019, 234, 1002–1012. [Google Scholar] [CrossRef]
  7. Ahmed, N.; Turchini, G.M. The evolution of the blue-green revolution of rice-fish cultivation for sustainable food production. Sustain. Sci. 2021, 16, 1375–1390. [Google Scholar] [CrossRef]
  8. Rahman, M.A. Integration of aquaculture with rice farming: A way to increase farm productivity, food security, livelihood improvement and better environment. Agric. Syst. 2016, 8, 10. [Google Scholar]
  9. Liu, D.; Tang, R.; Xie, J.; Tian, J.; Shi, R.; Zhang, K. Valuation of ecosystem services of rice–fish coculture systems in Ruyuan County, China. Ecosyst. Serv. 2020, 41, 101054. [Google Scholar] [CrossRef]
  10. Bakhtiyar, Y.; Arafat, M.Y.; Andrabi, S.; Tak, H.I. Zooplankton: The significant ecosystem service provider in aquatic environment. In Bioremediation and Biotechnology, Vol 3: Persistent and Recalcitrant Toxic Substances; Springer: Berlin/Heidelberg, Germany, 2020; pp. 227–244. [Google Scholar]
  11. Lobus, N.V.; Kulikovskiy, M.S. The co-evolution aspects of the biogeochemical role of phytoplankton in aquatic ecosystems: A review. Biology 2023, 12, 92. [Google Scholar] [CrossRef]
  12. Pace, M.L.; Lovett, G.M.; Carey, C.C.; Thomas, R.Q. Primary production: The foundation of ecosystems. In Fundamentals of Ecosystem Science; Elsevier: Amsterdam, The Netherlands, 2021; pp. 29–53. [Google Scholar]
  13. Brierley, A.S. Plankton. Curr. Biol. 2017, 27, R478–R483. [Google Scholar] [CrossRef]
  14. Wurtsbaugh, W.A.; Paerl, H.W.; Dodds, W.K. Nutrients, eutrophication and harmful algal blooms along the freshwater to marine continuum. Wiley Interdiscip. Rev. Water 2019, 6, e1373. [Google Scholar] [CrossRef]
  15. Steinberg, D.K.; Landry, M.R. Zooplankton and the ocean carbon cycle. Annu. Rev. Mar. Sci. 2017, 9, 413–444. [Google Scholar] [CrossRef] [PubMed]
  16. Du, X.; Xiong, W.; Li, S.; Zhan, A. Conventional net tow versus environmental DNA for metabarcoding-based analysis of plankton-environment interactions in polluted aquatic ecosystems. Ecol. Indic. 2024, 158, 111356. [Google Scholar] [CrossRef]
  17. Xiong, W.; Ni, P.; Chen, Y.; Gao, Y.; Li, S.; Zhan, A. Biological consequences of environmental pollution in running water ecosystems: A case study in zooplankton. Environ. Pollut. 2019, 252, 1483–1490. [Google Scholar] [CrossRef]
  18. Vanni, M.J. Effects of food availability and fish predation on a zooplankton community. Ecol. Monogr. 1987, 57, 61–88. [Google Scholar] [CrossRef]
  19. Palupi, M.; Wijaya, R.; Chanda, R.A.; Azhari, R.F.; Fitriadi, R. Biodiversity and abundance of phytoplankton in rice-fish farming system. Iraqi J. Agric. Sci. 2023, 54, 1084–1093. [Google Scholar] [CrossRef]
  20. Vromant, N.; Chau, N.T.H.; Ollevier, F. The effect of rice seeding rate and fish stocking on the floodwater ecology of the rice field in direct-seeded, concurrent rice-fish systems. Hydrobiologia 2001, 445, 151–164. [Google Scholar] [CrossRef]
  21. Frei, M.; Razzak, M.A.; Hossain, M.M.; Oehme, M.; Dewan, S.; Becker, K. Performance of common carp, Cyprinus carpio L. and Nile tilapia, Oreochromis niloticus (L.) in integrated rice-fish culture in Bangladesh. Aquaculture 2007, 262, 250–259. [Google Scholar] [CrossRef]
  22. Mohanty, R.K.; Thakur, A.K.; Ghosh, S.; Patil, D.U. Impact of rice-fish-prawn culture on rice field ecology and productivity. Indian J. Agric. Sci. 2010, 80, 597–602. [Google Scholar]
  23. Nayak, P.K.; Nayak, A.K.; Panda, B.B.; Lal, B.; Gautam, P.; Poonam, A.; Shahid, M.; Tripathi, R.; Kumar, U.; Mohapatra, S.D.; et al. Ecological mechanism and diversity in rice based integrated farming system. Ecol. Indic. 2018, 91, 359–375. [Google Scholar] [CrossRef]
  24. Nørgaard, L.; Olesen, C.R.; Trøjelsgaard, K.; Pertoldi, C.; Nielsen, J.L.; Taberlet, P.; Ruiz-González, A.; De Barba, M.; Iacolina, L. eDNA metabarcoding for biodiversity assessment, generalist predators as sampling assistants. Sci. Rep. 2021, 11, 6820. [Google Scholar] [CrossRef] [PubMed]
  25. Sun, X.; Guo, N.; Gao, J.; Xiao, N. Using eDNA to survey amphibians: Methods, applications, and challenges. Biotechnol. Bioeng. 2024, 121, 456–471. [Google Scholar] [CrossRef] [PubMed]
  26. He, X.; Jeffery, N.; Stanley, R.; Hamilton, L.; Rubidge, E.; Abbott, C. eDNA metabarcoding enriches traditional trawl survey data for monitoring biodiversity in the marine environment. ICES J. Mar. Sci. 2023, 80, 1529–1538. [Google Scholar] [CrossRef]
  27. Lv, J.; Lin, Y.; Zhao, Z.; Zhou, X. eDNA metabarcoding revealed the seasonal and spatial variation of phytoplankton functional groups in the Chai river and their relationship with environmental factors. J. Freshw. Ecol. 2023, 38, 2176374. [Google Scholar] [CrossRef]
  28. Šimunović, M.; Kulaš, A.; Žutinić, P.; Gligora Udovič, M. Phytoplankton Diversity of a Natural Karst Lake Combining Morphological and Molecular Approaches. Water 2023, 15, 1379. [Google Scholar] [CrossRef]
  29. SC/T 1135.1-2017; Technical Specification for Integrated Farming of Rice and Aquaculture Animal Part 1: General Principle. Fisheries Administration of the People’s Republic of China: Beijing, China, 2017.
  30. Wang, Y.; Wu, F.; Li, X.; Li, C.; Zhao, Y.; Gao, Y.; Liu, J. Effects of plants and soil microorganisms on organic carbon and the relationship between carbon and nitrogen in constructed wetlands. Environ. Sci. Pollut. Res. 2023, 30, 62249–62261. [Google Scholar] [CrossRef]
  31. Zhu, S.; Feng, W. Improvement of the Ammonium Molybdate Spectrophotometry Method for Determining Total Phosphorus in Water. J. Henan Sci. Technol. 2013, 15, 212–213. [Google Scholar]
  32. Dai, X.; Zeng, Q. Alkaline potassium persulfate digestion UV spectrophotometric method forthe determination of total nitrogen. Environ. Dev. 2018, 30, 139–140. [Google Scholar] [CrossRef]
  33. Li-qiong, C.; Yong, H. Influencing factors on determination of ammonia nitrogen in water by nessler’s reagent spectrophotometry. In Proceedings of the 2011 International Symposium on Water Resource and Environmental Protection, Xi’an, China, 20–22 May 2011; pp. 1173–1176. [Google Scholar]
  34. Aydın, A.; Ercan, Ö.; Taşcıoğlu, S. A novel method for the spectrophotometric determination of nitrite in water. Talanta 2005, 66, 1181–1186. [Google Scholar] [CrossRef]
  35. Armstrong, F. Determination of Nitrate in Water Ultraviolet Spectrophotometry. Anal. Chem. 1963, 35, 1292–1294. [Google Scholar] [CrossRef]
  36. Guo, P.; Li, C.; Liu, J.; Chai, B. Predation has a significant impact on the complexity and stability of microbial food webs in subalpine lakes. Microbiol. Spectr. 2023, 11, e02411–e02423. [Google Scholar] [CrossRef] [PubMed]
  37. Fan, J.; Wang, S.; Li, H.; Yan, Z.; Zhang, Y.; Zheng, X.; Wang, P. Modeling the ecological status response of rivers to multiple stressors using machine learning: A comparison of environmental DNA metabarcoding and morphological data. Water Res. 2020, 183, 116004. [Google Scholar] [CrossRef] [PubMed]
  38. Bokulich, N.A.; Subramanian, S.; Faith, J.J.; Gevers, D.; Gordon, J.I.; Knight, R.; Mills, D.A.; Caporaso, J.G. Quality-filtering vastly improves diversity estimates from Illumina amplicon sequencing. Nat. Methods 2013, 10, 57–59. [Google Scholar] [CrossRef] [PubMed]
  39. Bokulich, N.A.; Kaehler, B.D.; Rideout, J.R.; Dillon, M.; Bolyen, E.; Knight, R.; Huttley, G.A.; Gregory Caporaso, J. Optimizing taxonomic classification of marker-gene amplicon sequences with QIIME 2’s q2-feature-classifier plugin. Microbiome 2018, 6, 90. [Google Scholar] [CrossRef] [PubMed]
  40. Yilmaz, P.; Parfrey, L.W.; Yarza, P.; Gerken, J.; Pruesse, E.; Quast, C.; Schweer, T.; Peplies, J.; Ludwig, W.; Glöckner, F.O. The SILVA and “all-species living tree project (LTP)” taxonomic frameworks. Nucleic Acids Res. 2014, 42, D643–D648. [Google Scholar] [CrossRef]
  41. Chavhan, A. Community structure and monthly dynamics of zooplankton in high altitude rice fish system in Eastern Himalayan region of India. Int. J. Life Sci. 2017, 5, 362–378. [Google Scholar]
  42. Sun, Y.; Li, H.; Wang, X.; Jin, Y.; Nagai, S.; Lin, S. Phytoplankton and Microzooplankton Community Structure and Assembly Mechanisms in Northwestern Pacific Ocean Estuaries with Environmental Heterogeneity and Geographic Segregation. Microbiol. Spectr. 2023, 11, e04926–e04922. [Google Scholar] [CrossRef]
  43. Stirling, G.; Wilsey, B. Empirical relationships between species richness, evenness, and proportional diversity. Am. Nat. 2001, 158, 286–299. [Google Scholar] [CrossRef]
  44. Faith, D.P. Phylogenetic diversity and conservation evaluation: Perspectives on multiple values, indices, and scales of application. In Phylogenetic Diversity: Applications and Challenges in Biodiversity Science; Springer: Berlin/Heidelberg, Germany, 2018; pp. 1–26. [Google Scholar]
  45. Xia, Y.; Sun, J. Alpha diversity. In Bioinformatic and Statistical Analysis of Microbiome Data: From Raw Sequences to Advanced Modeling with QIIME 2 and R; Springer: Berlin/Heidelberg, Germany, 2023; pp. 289–333. [Google Scholar]
  46. Zhai, J.; Sun, J. Diversity and community structure of microzooplankton in the eastern Indian Ocean during the inter-monsoon period. Front. Mar. Sci. 2023, 10, 1249281. [Google Scholar] [CrossRef]
  47. Fang, J.; Xu, Y.; Nie, Z.; Xu, G.; Jiang, Z.; Shao, N.; Xiao, Y.; Fang, J. Food sources of common carp in a Hani Terrace integrated rice-fish system (Yunnan Province, China). Aquac. Rep. 2022, 22, 100937. [Google Scholar] [CrossRef]
  48. Guan, W.; Li, K.; Li, K. Bacterial communities in co-cultured fish intestines and rice field soil irrigated with aquaculture wastewater. AMB Express 2022, 12, 132. [Google Scholar] [CrossRef] [PubMed]
  49. Arendt, K.E.; Nielsen, T.G.; Rysgaard, S.; Tönnesson, K. Differences in plankton community structure along the Godthåbsfjord, from the Greenland Ice Sheet to offshore waters. Mar. Ecol. Prog. Ser. 2010, 401, 49–62. [Google Scholar] [CrossRef]
  50. Chen, B.; Laws, E.A. Is there a difference of temperature sensitivity between marine phytoplankton and heterotrophs? Limnol. Oceanogr. 2017, 62, 806–817. [Google Scholar] [CrossRef]
  51. Rodrigues, L.H.R.; Canterle, E.B.; Becker, V.; Gazulha, V.; Hamester, A.; Motta Marques, D. Dynamics of plankton and fish in a subtropical temporary wetland: Rice fields. Sci. Res. Essays 2011, 6, 2069–2077. [Google Scholar]
  52. Liu, Y.; Zou, G.; Yuan, Q.; Huang, W.; Zhou, W. Phytoplankton community characteristics in rice paddy fields under different nitrogen fertiliser applications. Acta Physiol. Plant. 2020, 42, 33. [Google Scholar] [CrossRef]
  53. Iwai, N.; Koyama, N.; Tsuji, S.; Maruyama, A. Functions of indigenous animals in paddy fields: An in situ experiment on their effects on water quality, phytoplankton, weeds, soil structure, and rice growth. Paddy Water Environ. 2018, 16, 89–98. [Google Scholar] [CrossRef]
  54. Nam, N.D.G.; Giao, N.T.; Nguyen, M.N.; Downes, N.K.; Ngan, N.V.C.; Anh, L.H.H.; Trung, N.H. The Diversity of Phytoplankton in a Combined Rice-Shrimp Farming System in the Coastal Area of the Vietnamese Mekong Delta. Water 2022, 14, 487. [Google Scholar] [CrossRef]
  55. Das, D.; Haque, M.; Choudury, B.; Haque, M.; Alam, M. Study on monthly variations of plankton in relation to the physico-chemical condition of rice-fish fields in boro season. Int. J. Sustain. Crop Prod. 2011, 6, 43–49. [Google Scholar]
  56. Fan, T.; Amzil, H.; Fang, W.; Xu, L.; Lu, A.; Wang, S.; Wang, X.; Chen, Y.; Pan, J.; Wei, X. Phytoplankton-Zooplankton Community Structure in Coal Mining Subsidence Lake. Int. J. Environ. Res. Public Health 2022, 20, 484. [Google Scholar] [CrossRef]
  57. Zhang, M.; Dong, J.; Gao, Y.; Liu, Y.; Zhou, C.; Meng, X.; Li, X.; Li, M.; Wang, Y.; Dai, D.; et al. Patterns of phytoplankton community structure and diversity in aquaculture ponds, Henan, China. Aquaculture 2021, 544, 737078. [Google Scholar] [CrossRef]
  58. Kopp, R.; Řezníčková, P.; Hadašová, L.; Petrek, R.; Brabec, T. Water quality and phytoplankton communities in newly created fishponds. Acta Univ. Agric. Et Silvic. Mendel. Brun. 2016, 64, 71–80. [Google Scholar] [CrossRef]
  59. Gao, W.; Xiong, F.; Lu, Y.; Xin, W.; Wang, H.; Feng, G.; Kong, C.; Fang, L.; Gao, X.; Chen, Y. Water quality and habitat drive phytoplankton taxonomic and functional group patterns in the Yangtze River. Ecol. Process. 2024, 13, 11. [Google Scholar] [CrossRef]
  60. Jakhar, P. Role of phytoplankton and zooplankton as health indicators of aquatic ecosystem: A review. Int. J. Innov. Res. Study 2013, 2, 489–500. [Google Scholar]
  61. Randall, S.; Cartozzo, C.; Simmons, T.; Swall, J.L.; Singh, B. Prediction of minimum postmortem submersion interval (PMSImin) based on eukaryotic community succession on skeletal remains recovered from a lentic environment. Forensic Sci. Int. 2021, 323, 110784. [Google Scholar] [CrossRef]
  62. Venter, P.C.; Nitsche, F.; Arndt, H. The Hidden Diversity of Flagellated Protists in Soil. Protist 2018, 169, 432–449. [Google Scholar] [CrossRef]
  63. Fayer, R.; Xiao, L. Cryptosporidium and Cryptosporidiosis; CRC Press: Boca Raton, FL, USA, 2007. [Google Scholar]
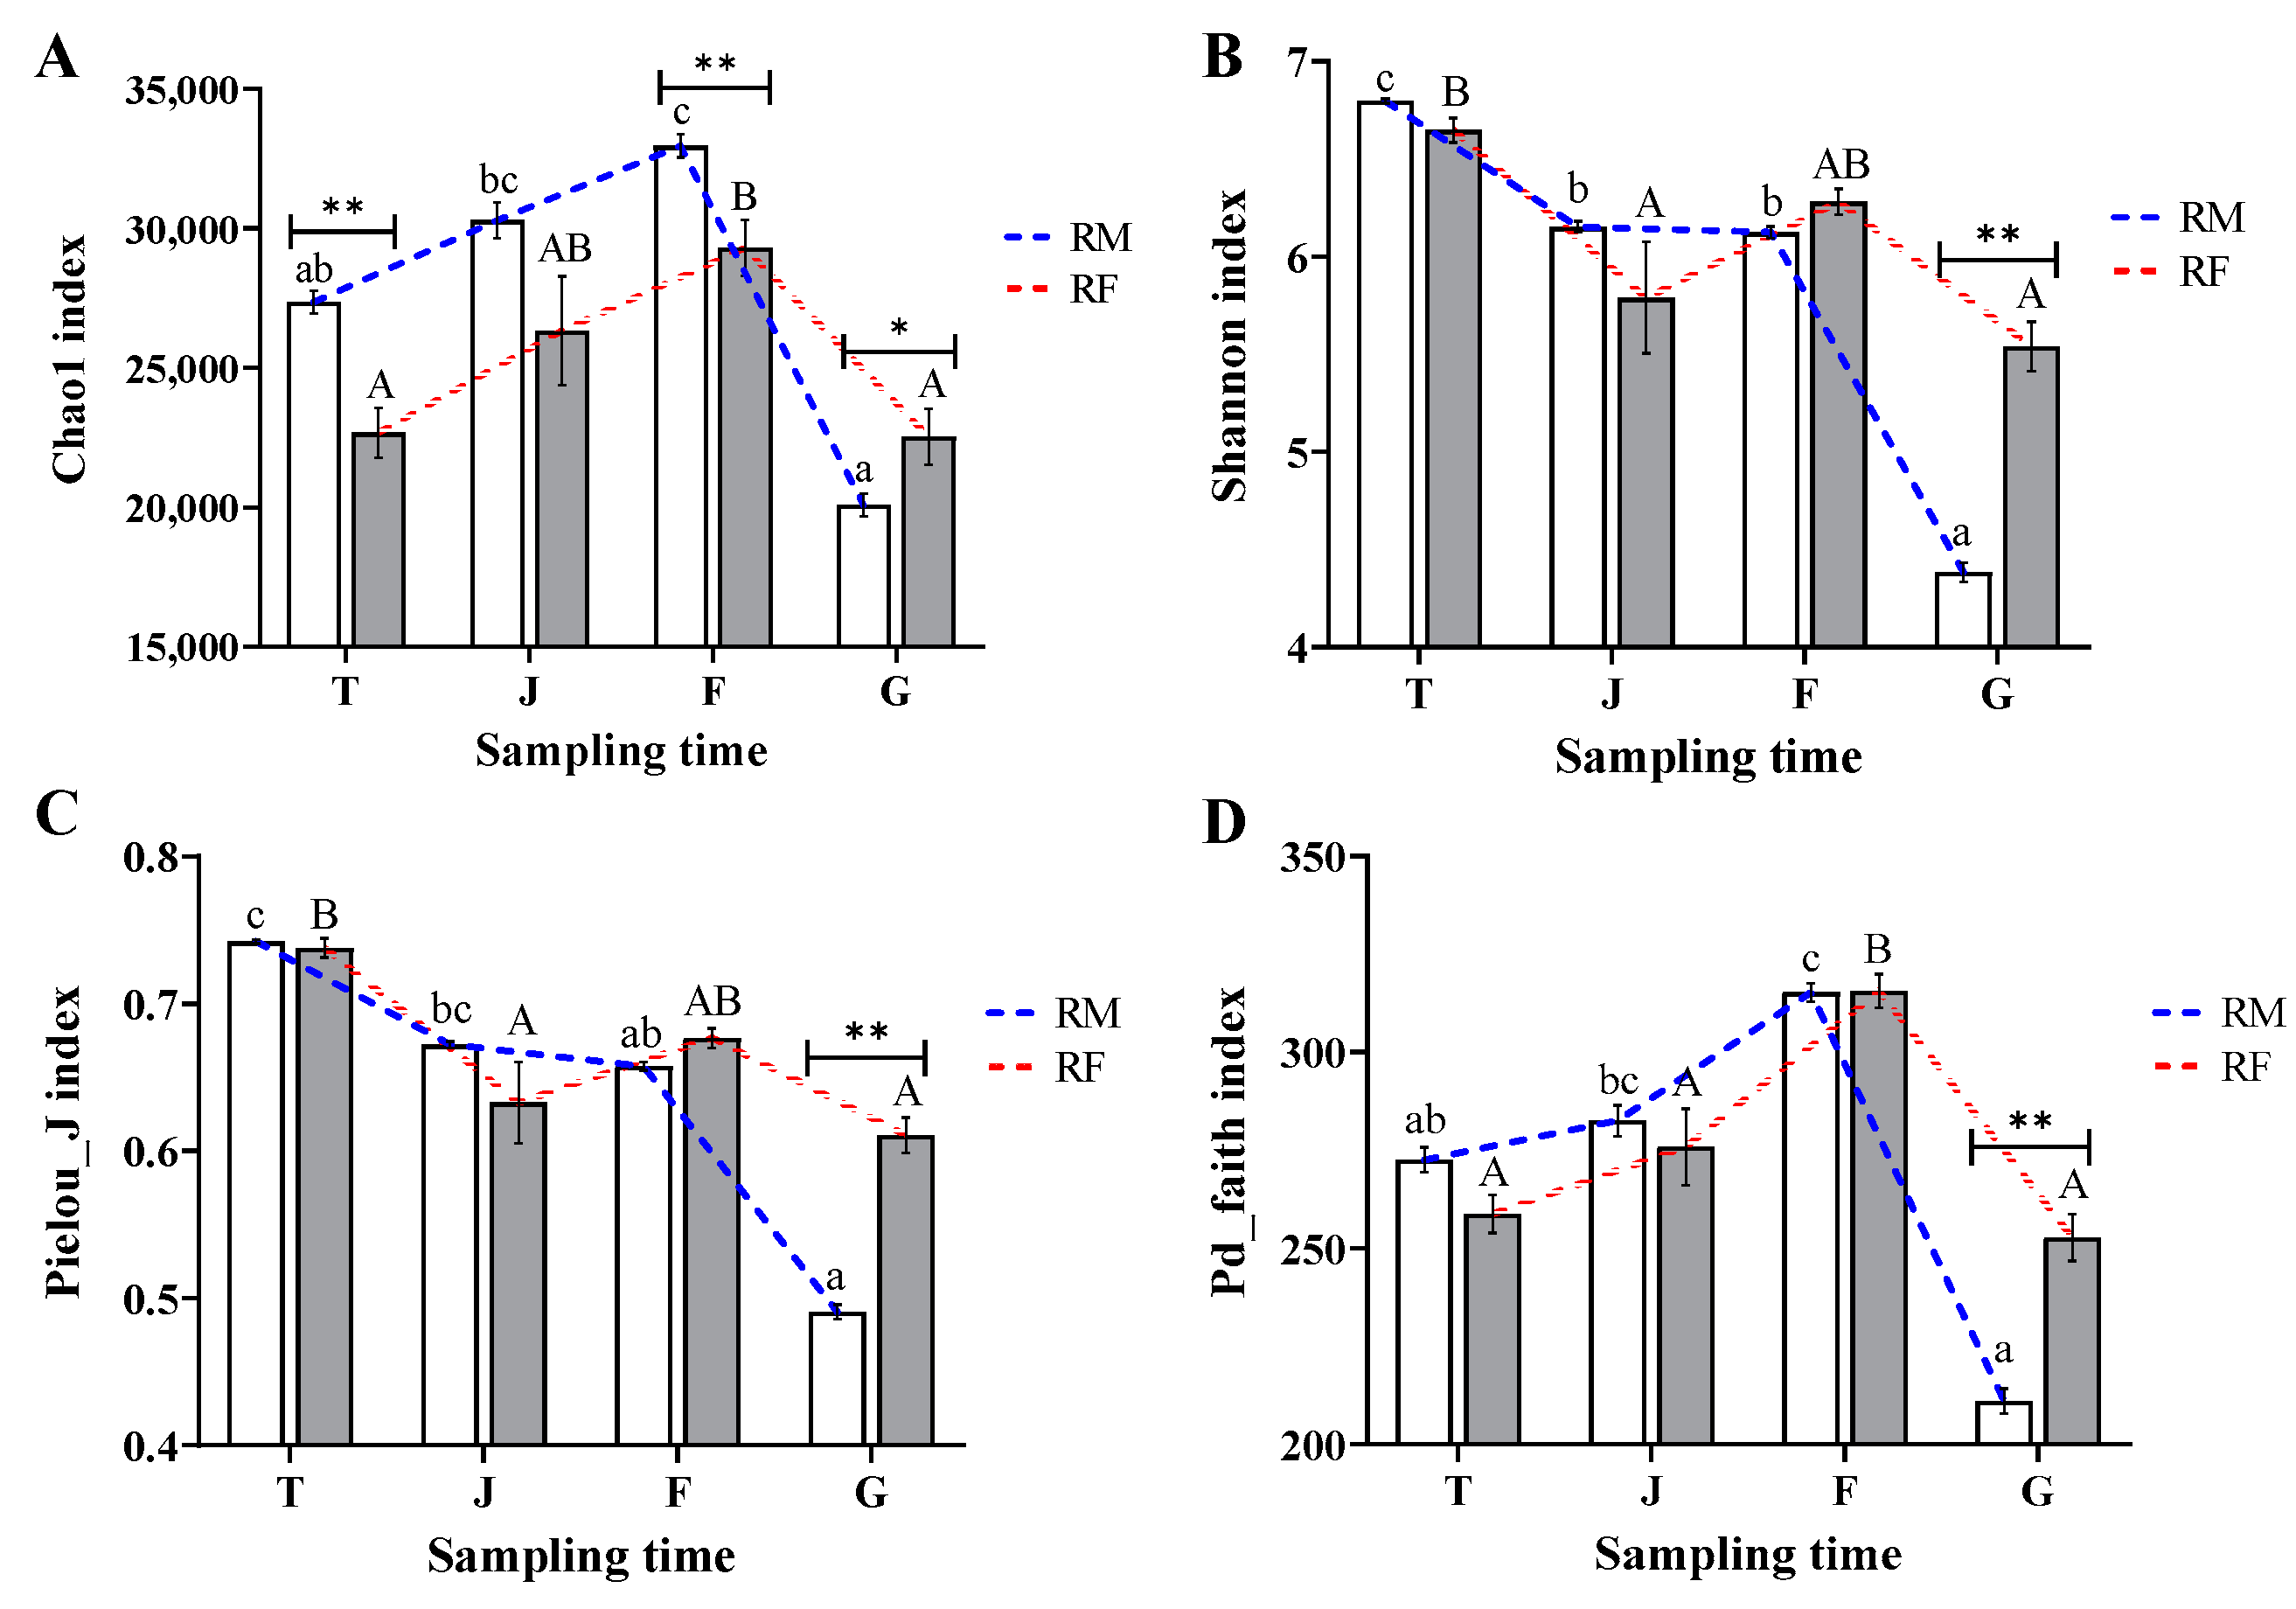
Figure 1. Differences in the alpha diversity indices of phytoplankton between RM and RF groups during different rice growth stage. (A) Chao1 index; (B) Shannon index; (C) Pielou_J index; (D) PD_faith index. Different uppercase letters indicate differences within the RF group among different rice growth stage; different lowercase letters denote differences within the RM group among different rice growth stage. The asterisks (*, **) indicate a difference between the RM and RF groups at the same sampling time. Results are expressed as mean ± SE (standard error). T, tillering stage; J, jointing stage; F, flowering stage; G, grain-filling stage.
Water 16 02775 g001
Figure 2. Differences in the alpha diversity indices of microzooplankton between RM and RF groups during different rice growth stage. (A) Chao1 index; (B) Shannon index; (C) Pielou_J index; (D) PD_faith index. Different uppercase letters indicate differences within the RF group among different rice growth stage; different lowercase letters denote differences within the RM group among different rice growth stage. The asterisks (**) indicate a difference between the RM and RF groups at the same sampling time. Results are expressed as mean ± SE (n = 10). T, tillering stage; J, jointing stage; F, flowering stage; G, grain-filling stage.
Water 16 02775 g002
Figure 3. Differences in the beta diversity indices of phytoplankton and microzooplankton between the RM and RF groups during different rice growth stages. (A) PCoA and ANOSIM tests of phytoplankton communities. (B) Group distance of phytoplankton communities among different groups. (C) PCoA and ANOSIM tests of microzooplankton communities. (D) Group distance zooplankton communities among different groups. The bars with different letters indicates significant difference (p < 0.05).
Water 16 02775 g003
Figure 4. The effect of rice–carp coculture on the composition and abundance of phytoplankton at the phylum level during various rice growth stages. (A) Composition of phytoplankton at the phylum. (B) Bacillariophyta. (C) Chlorophyta. (D) Chrysophyta. (E) Cryptophyta. (F) Euglenophyta. (G) Pyrrophyta. Different uppercase letters indicate differences in the RF group among different rice growth stages; different lowercase letters denote differences in the RM group among different rice growth stages. The asterisks (*, **) indicatea difference between the RM and RF groups at the same sampling time. Results are expressed as mean ± SE (n = 10). T, tillering stage; J, jointing stage; F, flowering stage; G, grain-filling stage.
Water 16 02775 g004
Figure 5. The effect of rice–carp coculture on composition and abundance of phytoplankton at the genus level during various rice growth stages. (A) Composition of phytoplankton at the genus. (B) Cryptomonas. (C) Cyclotella. (D) A31. (E) Synura. (F) Charoomonas. (G) Trachelomonas. (H) Phacus. (I) Chlorophyceae. (J) Mallomonas. (K) Ochromonas. Different uppercase letters indicate differences in the RF group among different rice growth stages; different lowercase letters denote differences in the RM group among different rice growth stages. The asterisks (*, **) indicate a difference between the RM and RF groups at the same sampling time. Results are expressed as mean ± SE (n = 10). T, tillering stage; J, jointing stage; F, flowering stage; G, grain-filling stage.
Water 16 02775 g005
Figure 6. The effect of rice–carp coculture on the composition and relative abundance of microzooplankton at the phylum (or subphylum and class) level during various rice growth stages. (A) Top 10 microzooplankton at the phylum (or subphylum and class). (B) Intramacronucleata. (C) Cercozoa. (D) Conoidasida. (E) Stramenopiles. (F) Kinetoplastea. Different uppercase letters indicate differences in the RF group among different rice growth stages; different lowercase letters denote differences in the RM group among different rice growth stages. The asterisks (**) indicate a difference between the RM and RF groups at the same sampling time. Results are expressed as mean ± SE (n = 10). T, tillering stage; J, jointing stage; F, flowering stage; G, grain-filling stage. Here, species in the classes Imbricata (class) and Thecofilosea (class) were classified separately from those in the Cercozoa phylum, with the data for Imbricata and Thecofilosea being distinct from those of Cercozoa; species in the Intramacronucleata (subphylum) and Postciliodesmatophora (subphylum) were independently analyzed from those in the Ciliophora phylum, with the data for Intramacronucleata and Postciliodesmatophora being distinct from those of Ciliophora; species in the Kinetoplastea (class) were analyzed independently from the Euglenozoa phylum; species in Conoidasida (class) were independently analyzed from those in the Apicomplexa phylum, with the data for Conoidasida being distinct from those of Apicomplexa.
Water 16 02775 g006
Figure 7. The effect of rice–carp coculture on the composition and relative abundance of microzooplankton at the genus level during various rice growth stages. (A) Top 15 microzooplankton at the genus level. (B) Cryptosporidium. (C) Halteria. (D) Cryptocaryon. (E) Tintinnidium. (F) Strombidium. (G) Bicosoecida. (H) Coleps. (I) Heteromita. (J) Cercomonas. (K) Obertrumia. Different uppercase letters indicate differences in the RF group among different rice growth stages; different lowercase letters denote differences in the RM group among different rice growth stages. The asterisks (*, **) indicate a difference between the RM and RF groups at the same sampling time. Results are expressed as mean ± SE (n = 10). T, tillering stage; J, jointing stage; F, flowering stage; G, grain-filling stage.
Water 16 02775 g007
Figure 8. RDA analysis of the relationship between microbial abundance and environmental factors (genus level). (A) Phytoplankton. (B) Microzooplankton.
Water 16 02775 g008
Disclaimer/Publisher’s Note: The statements, opinions and data contained in all publications are solely those of the individual author(s) and contributor(s) and not of MDPI and/or the editor(s). MDPI and/or the editor(s) disclaim responsibility for any injury to people or property resulting from any ideas, methods, instructions or products referred to in the content.