Article

Causes and Effects of Scale Deposition in Water Supply Pipelines in Surakarta City, Indonesia

1
Department of Urban Engineering, Graduate School of Engineering, The University of Tokyo, Bunkyo-ku, Tokyo 113-8654, Japan
2
Department of Socio-Cultural Environmental Studies, Graduate School of Frontier Sciences, The University of Tokyo, 5-1-5 Kashiwanoha, Kashiwa 277-8563, Japan
*
Author to whom correspondence should be addressed.
Water 2024, 16(16), 2275; https://doi.org/10.3390/w16162275
Submission received: 15 July 2024 / Revised: 8 August 2024 / Accepted: 10 August 2024 / Published: 12 August 2024

Abstract

:
Globally, scale deposition in water supply pipelines is one of the major problems faced by water utilities. This research aimed to determine the causes and effects of scale deposition in the water supply pipelines in Surakarta City, Indonesia. The total dissolved solids (TDS), hardness, manganese, and alkalinity in groundwater were higher than those in the surface water and spring water; thus, the supply areas from groundwater were identified using TDS at the taps. The three scaling indicators, i.e., the Langelier saturation index (LSI), the Ryznar stability index (RSI), and the Puckorius scaling index (PSI), indicated moderate calcium carbonate scaling. However, elemental analysis of eight scale samples using X-ray fluorescence (XRF) revealed that the major components of scale were either manganese (50.1–80.8%) or iron (45.6–63.8%), whereas calcium (3.0–7.8%) was a minor component. Because only five of twenty groundwater sources were chlorinated before distribution, it is estimated that dissolved manganese is oxidized by manganese-oxidizing bacteria. The manganese deposition rate in the networks was estimated to be 1660 kg/year using the manganese concentration at groundwater sources and in customers’ taps. These results suggest the importance of the elemental analysis of scale and avoidance of overreliance on scale indicators.

1. Introduction

Although access to clean water is a basic human need, maintaining a clean water supply has always been a major challenge in many countries [1]. Groundwater often contains high concentrations of iron and manganese; however, it is not easy to reduce their concentration to a sufficiently low level to prevent scale deposition in distribution pipelines. Therefore, many water utilities face scale deposition problems in water mains, leading to lower operating efficiency and degrading the quality of supplied water [2,3,4]. Scale deposition causes many other operational problems, including increased hydraulic resistance and decreased water pressure in networks, increased operational failures, and reduced energy efficiency [5]. Although old pipes are replaced every 30–50 years depending on their condition [6,7], scaling reduces the operational life of the water mains, leading to additional expenditure for water utilities when replacing pipes [8]. Some water utilities implement physical and/or chemical descaling using hydrochloric and polyacrylic acids [9]. However, this process incurs the high costs of using heavy machinery and water flushing for pipe cleaning [5]. In addition, the use of acidic chemicals for pipe cleaning poses a water safety risk [10]. Therefore, the precise forecasting and mitigation of pipe scaling is pivotal in reducing pipe maintenance costs and maintaining the quality of supplied water [5].
The accumulation of scale deposits also provides habitats for microorganisms. Actinomycetes, fungi, and pathogenic bacteria, such as coliforms, were identified in scale deposits [11,12], posing risks relating to the microbial contamination of drinking water. Although an enhanced chlorine (Cl2) dosage can suppress microbial growth in pipelines, it is necessary to maintain a high chlorine concentration of over 1.8 mg/L for 24 h to achieve this [13]. Furthermore, this method is sometimes ineffective because loose scale deposits protect microbes from contact with chlorine. However, high dosages of chlorine lead to customer complaints due to the distinct smell and formation of disinfection byproducts.
Therefore, scale deposition in water mains is a common problem for many water utilities, including those in Mexico [8], China [14], Morocco [15,16], Tunisia [17], and Iran [18]. Previous studies have suggested that scale deposits in water mains are caused by the precipitation of poorly soluble salts, slowly attaching to the pipes over time and reacting with ions, especially iron and manganese, in water [19,20]. Predicting scale deposition in water mains is difficult because it is a slow process involving complex reactions of trace elements. The water quality influences the elemental composition of scale deposits in water mains; common elements found in scale deposits are calcium (Ca), manganese (Mn), iron (Fe), aluminum (Al), silica (Si), and magnesium (Mg) [4,5,21,22,23]. Hafid et al. [15] and Belattar et al. [16] studied scale deposition in downtown Taliouine and Agadir City, Morocco. They found that the main cause of scale deposition in those cities was the precipitation of calcium carbonate (CaCO3). The scale samples consisted of 53% calcium oxide in Taliouine and 85.5% calcium carbonate in Agadir. This problem occurs mainly in summer when the water temperature rises, lowering the solubility of calcium carbonate [16]. Studies conducted in Mexico, Tunisia, and Iran obtained similar findings concerning the causes of scaling, including water flow reductions in distribution pipes, the scaling of cooling towers, and the scaling of sand filters in water treatment plants [8,17,18].
In water distribution systems with high concentrations of manganese in the distributed water, manganese scale deposition is prevalent [2,4,24]. Most of the manganese present in the distributed water comes from the source water [25]. Manganese is an abundant element in the Earth’s crust, with levels of between 950 and 1000 mg/kg [26]. Manganese oxides are reduced to Mn(II) under anaerobic conditions and dissolve into groundwater, as documented in numerous aquifers worldwide [26]. High manganese concentrations were found to be 6.56 mg/L in Finland [27], 3.60 mg/L in Indramayu, Indonesia [28], 3.41 mg/L in southern China [29], 1.60 mg/L in Costa Rica [30], 3.44 mg/L in Bangladesh [31], >0.3 mg/L in the alluvial region of the upper Yamuna basin, India [32], and 4.00 mg/L in North Carolina, the United States of America [33]. Soluble manganese (Mn(II)) can be oxidized to insoluble Mn(III) and Mn(IV) via chlorination or manganese-oxidizing bacteria (MOB) [34,35]. After a certain period, a deposit layer forms in the water mains, which grows further through the adsorption and oxidation of manganese and other metal cations [11,36]. Some of the metals and metalloids in scale deposits, such as arsenic (As), lead (Pb), and cadmium (Cd), pose health risks to customers [3,37]. Manganese deposition can form at a low manganese concentration of 0.01 mg/L [34] and cause changes in color, odor, and/or taste at 0.05 mg/L [2].
The water resources in Indonesia are principally managed by municipally owned corporations known as Perusahaan Daerah Air Minums (PDAMs). There are currently 393 PDAMs in the country [38]. References on scale deposition in the water mains in Indonesia are very limited because, in most cases, scale depositions are not prioritized by PDAMs, as their main objective is to provide sufficient water to their customers 24/7 [39,40]. This is evident in the annual evaluation of operational management performed by the Directorate of Drinking Water, which only uses the parameters of production efficiency, non-revenue water, operating hours, water pressure, and water meter replacement [41]. Furthermore, scale deposition is a slow process; therefore, it takes time to affect water quality and the operation of water distribution networks, which is one of the reasons why many drinking water companies neglect this issue [42]. Scale accumulation, if not addressed properly, is a ticking time bomb, slowly clogging and reducing the effective diameter of distribution pipes [24]. Furthermore, most PDAMs in Indonesia fail to provide potable water to their customers [43]. The release of loose scale deposits makes it difficult for PDAMs to win customers’ trust in their piped water as a reliable source of drinking water because of problems concerning color and taste [13].
Therefore, this study aimed to make water utility providers and consumers more aware of the problems of pipe scaling by elucidating the current state and issues relating to distribution pipes supplying water containing high concentrations of iron and manganese. The objective of this study is to find the main causes and effects of scale deposition in the water supply pipelines in PDAM Surakarta via water quality analyses of the pipelines and customers’ taps, as well as via the elemental analysis of scale samples. We took water samples from different water sources and customers’ taps to find the relationship between them. Three saturation indexes were applied to evaluate the tendency of calcium carbonate scaling, which were compared with the elemental analysis results of ten cut-out pipe samples taken from different locations of the water supply network.

2. Materials and Methods
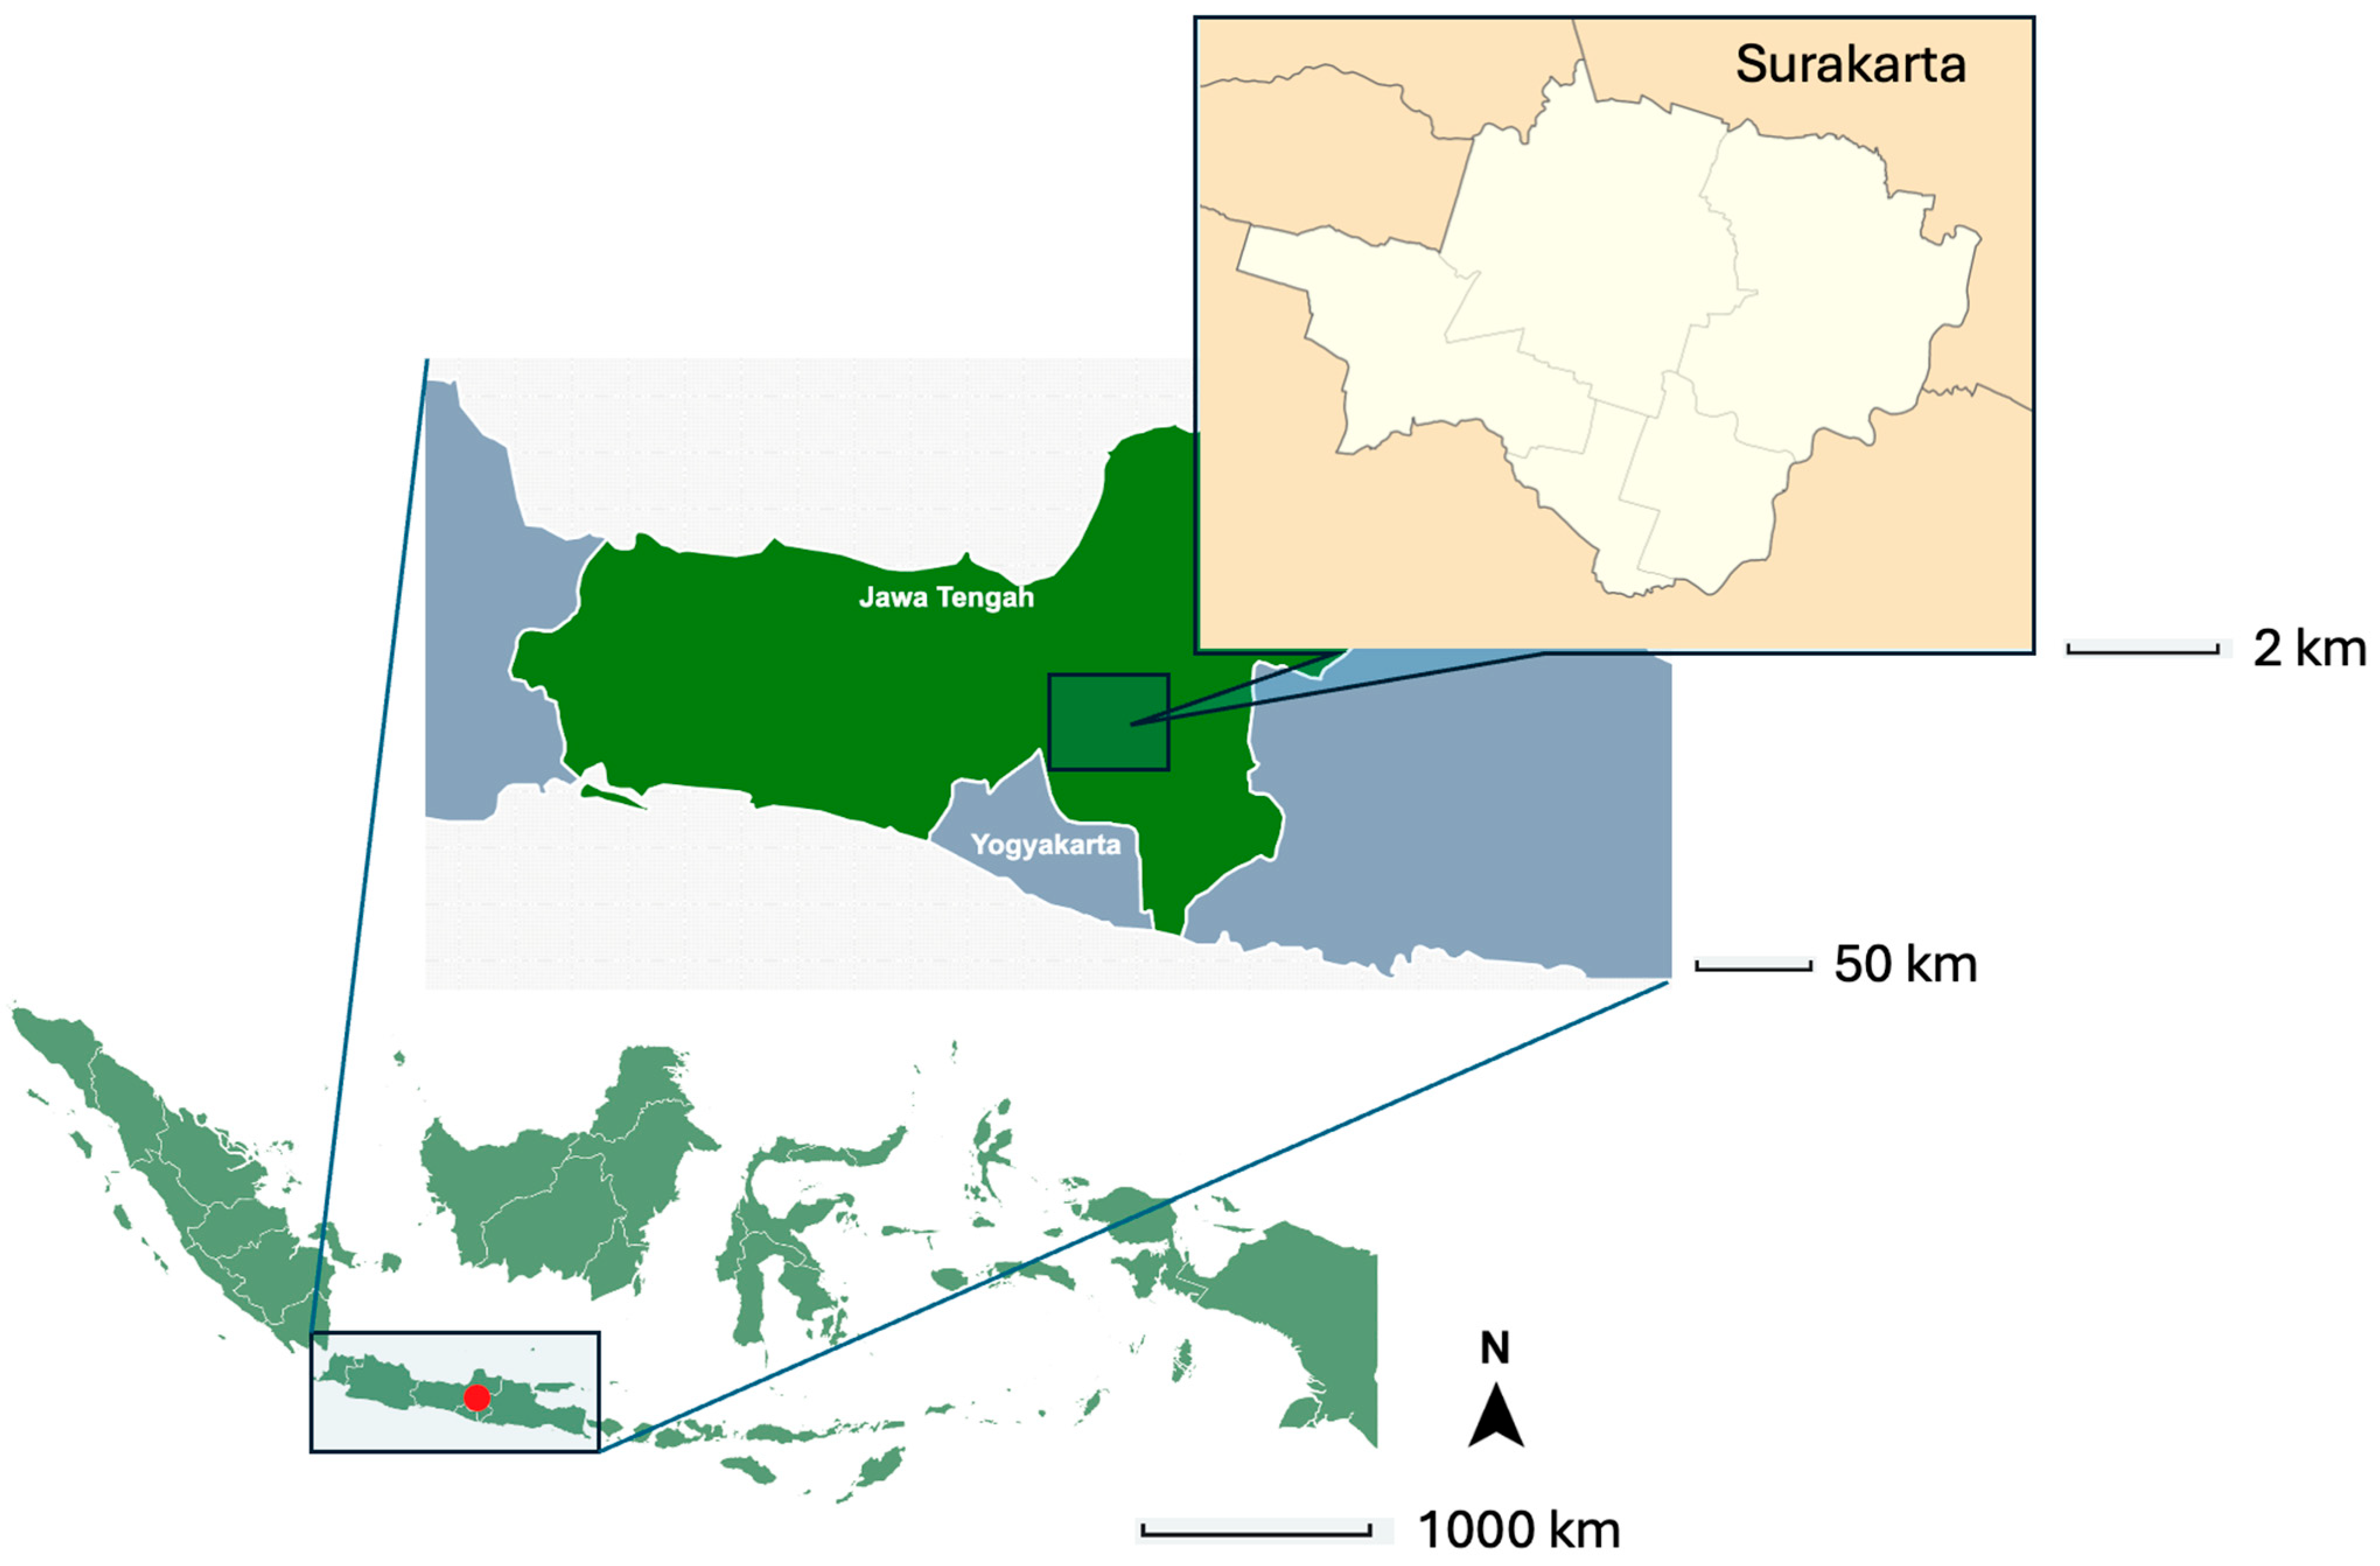
2.1. Study Area

Surakarta is a city in Central Java and has an area of 46.72 km2 (Figure 1). Surakarta has a tropical monsoon climate, with a wet season from October to May, and a relatively short dry season from June to September [44]. The average temperature in Surakarta is 26.85 °C [44], and the average annual precipitation is 2200 mm, with the most rainy months being December to February. Geologically, the main rock formation in Surakarta is alluvium consisting of clay, mud, sand, gravel, pebbles, and cobbles [45]. This rock formation is composed of the sediment of the Bengawan Solo River [46].
Surakarta has a population of 523,000, with an average growth rate of 0.33% over the past 5 years [44]. The government of Surakarta established PDAM Surakarta to provide drinking water to its citizens. Currently, the PDAM covers 58.77% of the population, with an average water supply of 67,333 m3/d and 57,772 house connections (HCs) [47]. On average, one HC serves 5.3 people.
PDAM Surakarta uses three water sources: groundwater, surface water from the Bengawan Solo River, and spring water from Cokro Tulung. Based on historical data obtained from PDAM Surakarta, scale deposition is prone to occur in pipelines carrying water from groundwater sources. Water treatment plants are installed only for the treatment of surface water and not for groundwater. The treatment process consists of pre-sedimentation, coagulation, flocculation, sedimentation, filtration, and chlorination. The groundwater and spring water are assumed to be clean and, thus, are directly supplied to customers after chlorination, although chlorination is installed only in five out of twenty groundwater sources. The largest water source is spring water, followed by groundwater and surface water. The average monthly water production is 2.02 million m3/month, consisting of 0.78 million m3/month of spring water, 0.67 million m3/month of groundwater, and 0.57 million m3/month of surface water [47]. Meanwhile, only 56.4% of produced water was billed every month; thus, non-revenue water arising from unbilled authorized consumption, apparent losses, and real losses are high at 43.6% in PDAM Surakarta.
Table 1 shows the materials, diameters, and lengths of the transmission and distribution mains. The transmission mains have a total length of 98.08 km, consisting of cast iron (CI), ductile cast iron (DCI), polyvinyl chloride (PVC), and asbestos cement (AC) pipes. The diameter of the transmission mains varies from 200 to 600 mm, with the majority of the pipes being CI with a total length of 45.67 km, while the diameter and the total length of the distribution mains are 40–150 mm and 724.16 km, respectively, for PVC and CI pipes. The distribution system consists of a reservoir and direct pumping to customers.

2.2. Data Acquisition and Analyses

2.2.1. Water Sampling and Water Quality Analyses

Field surveys were carried out three times in February 2023 (rainy season), August–September 2023 (dry season), and February 2024 to assess the water quality and to obtain cut-out samples of the water supply pipes. Figure 2 shows the sampling points. Water samples were collected from 27 sampling points consisting of 20 deep wells (groundwater sources), 3 water treatment plant (WTP) inlets and outlets (surface water sources), and 1 source of spring water in February 2023 and August–September 2023. The samples were also collected from customers’ taps. During the sampling in February 2023, eight customers’ tap samples were collected, and in August–September 2023, fourteen customers’ tap samples were collected (eight samples from the same customer taps as the sampling in February 2023 and six new customers’ taps). At every sampling point, two to four replicate samples were taken for analysis. Table 2 presents the water quality parameters and their analysis methods.
Further samples were taken from customers’ taps in February 2024. The sampling points were divided into three categories: (1) random sampling of customers supplied with groundwater sources (40 sampling points), (2) longitudinal sampling from the north to the south at approximately every 700 m (10 sampling points), and (3) isolated pipes from a single groundwater source (nine sampling points from two different groundwater sources). (1) The areas supplied with groundwater were the main target of our study. Thus, we selected the sampling points randomly in the areas supplied with groundwater (random sampling points: red circles in Figure 2). (2) The longitudinal sampling points were selected from the north to the south to show how tap water quality changes from the areas supplied with groundwater and surface/spring water (longitudinal sampling: orange circles). (3) The isolated sampling points were also supplied with groundwater; however, because the water source and supply areas were isolated from the rest of the supply areas, we used these samples to analyze the influences of pipe diameter and the distance between groundwater and tap water on iron and manganese concentration reduction (isolated pipe sampling: pink circles). Furthermore, a survey was conducted regarding black water, taste, water pressure, and water flow at 57 customers’ taps. At every sampling point, two to four replicate samples were taken for analysis. The parameters measured in the field survey were pH, total dissolved solids (TDS), electric conductivity (EC), temperature, total iron, and manganese.

2.2.2. Sampling and Analysis of Scale Deposits

To observe and analyze the elements in the scale deposits, 10 cut-out samples of pipe sections were obtained from the pipelines receiving water from different water sources (Figure 2). The pipe samples were collected randomly during the routine maintenance undertaken by PDAM Surakarta. The elemental compositions of the scale samples collected from the pipes were analyzed using the X-ray fluorescence (XRF) method (EA1400; Hitachi, Tokyo, Japan). Before the measurement, the scale samples were dried in an oven for 24 h at 105 °C. The samples were then ground using an alumina mortar and pestle to obtain a uniform sample size. The measurement used four different filters, lead (Pb), chlorine (Cl), cadmium (Cd), and chromium (Cr), to measure the different elements.

2.2.3. Saturation Indexes

Using the average water quality data of each sampling point, the Langelier saturation index (LSI), Ryznar saturation index (RSI), and Puckorius scaling index (PSI) were calculated to find the saturation and precipitation of calcium carbonate (CaCO3). Table 3 presents the definition equations of the indexes and saturation categories. The LSI determines the potential of the water to precipitate calcium carbonate by calculating the difference between the pH of water samples and the saturation pH (pHs). Water is considered in equilibrium when the value of the LSI is equal to 0. When the LSI value is positive, water is supersaturated and tends to precipitate calcium carbonate; at a negative value of the LSI, the water is undersaturated and tends to dissolve calcium carbonate [48]. The RSI resembles the LSI and uses the water saturation level to determine the tendencies to precipitate calcium carbonates. Meanwhile, the PSI considers the water’s ability to act as a buffer and the maximum amount of precipitation required to restore the water to equilibrium [49].

3. Results

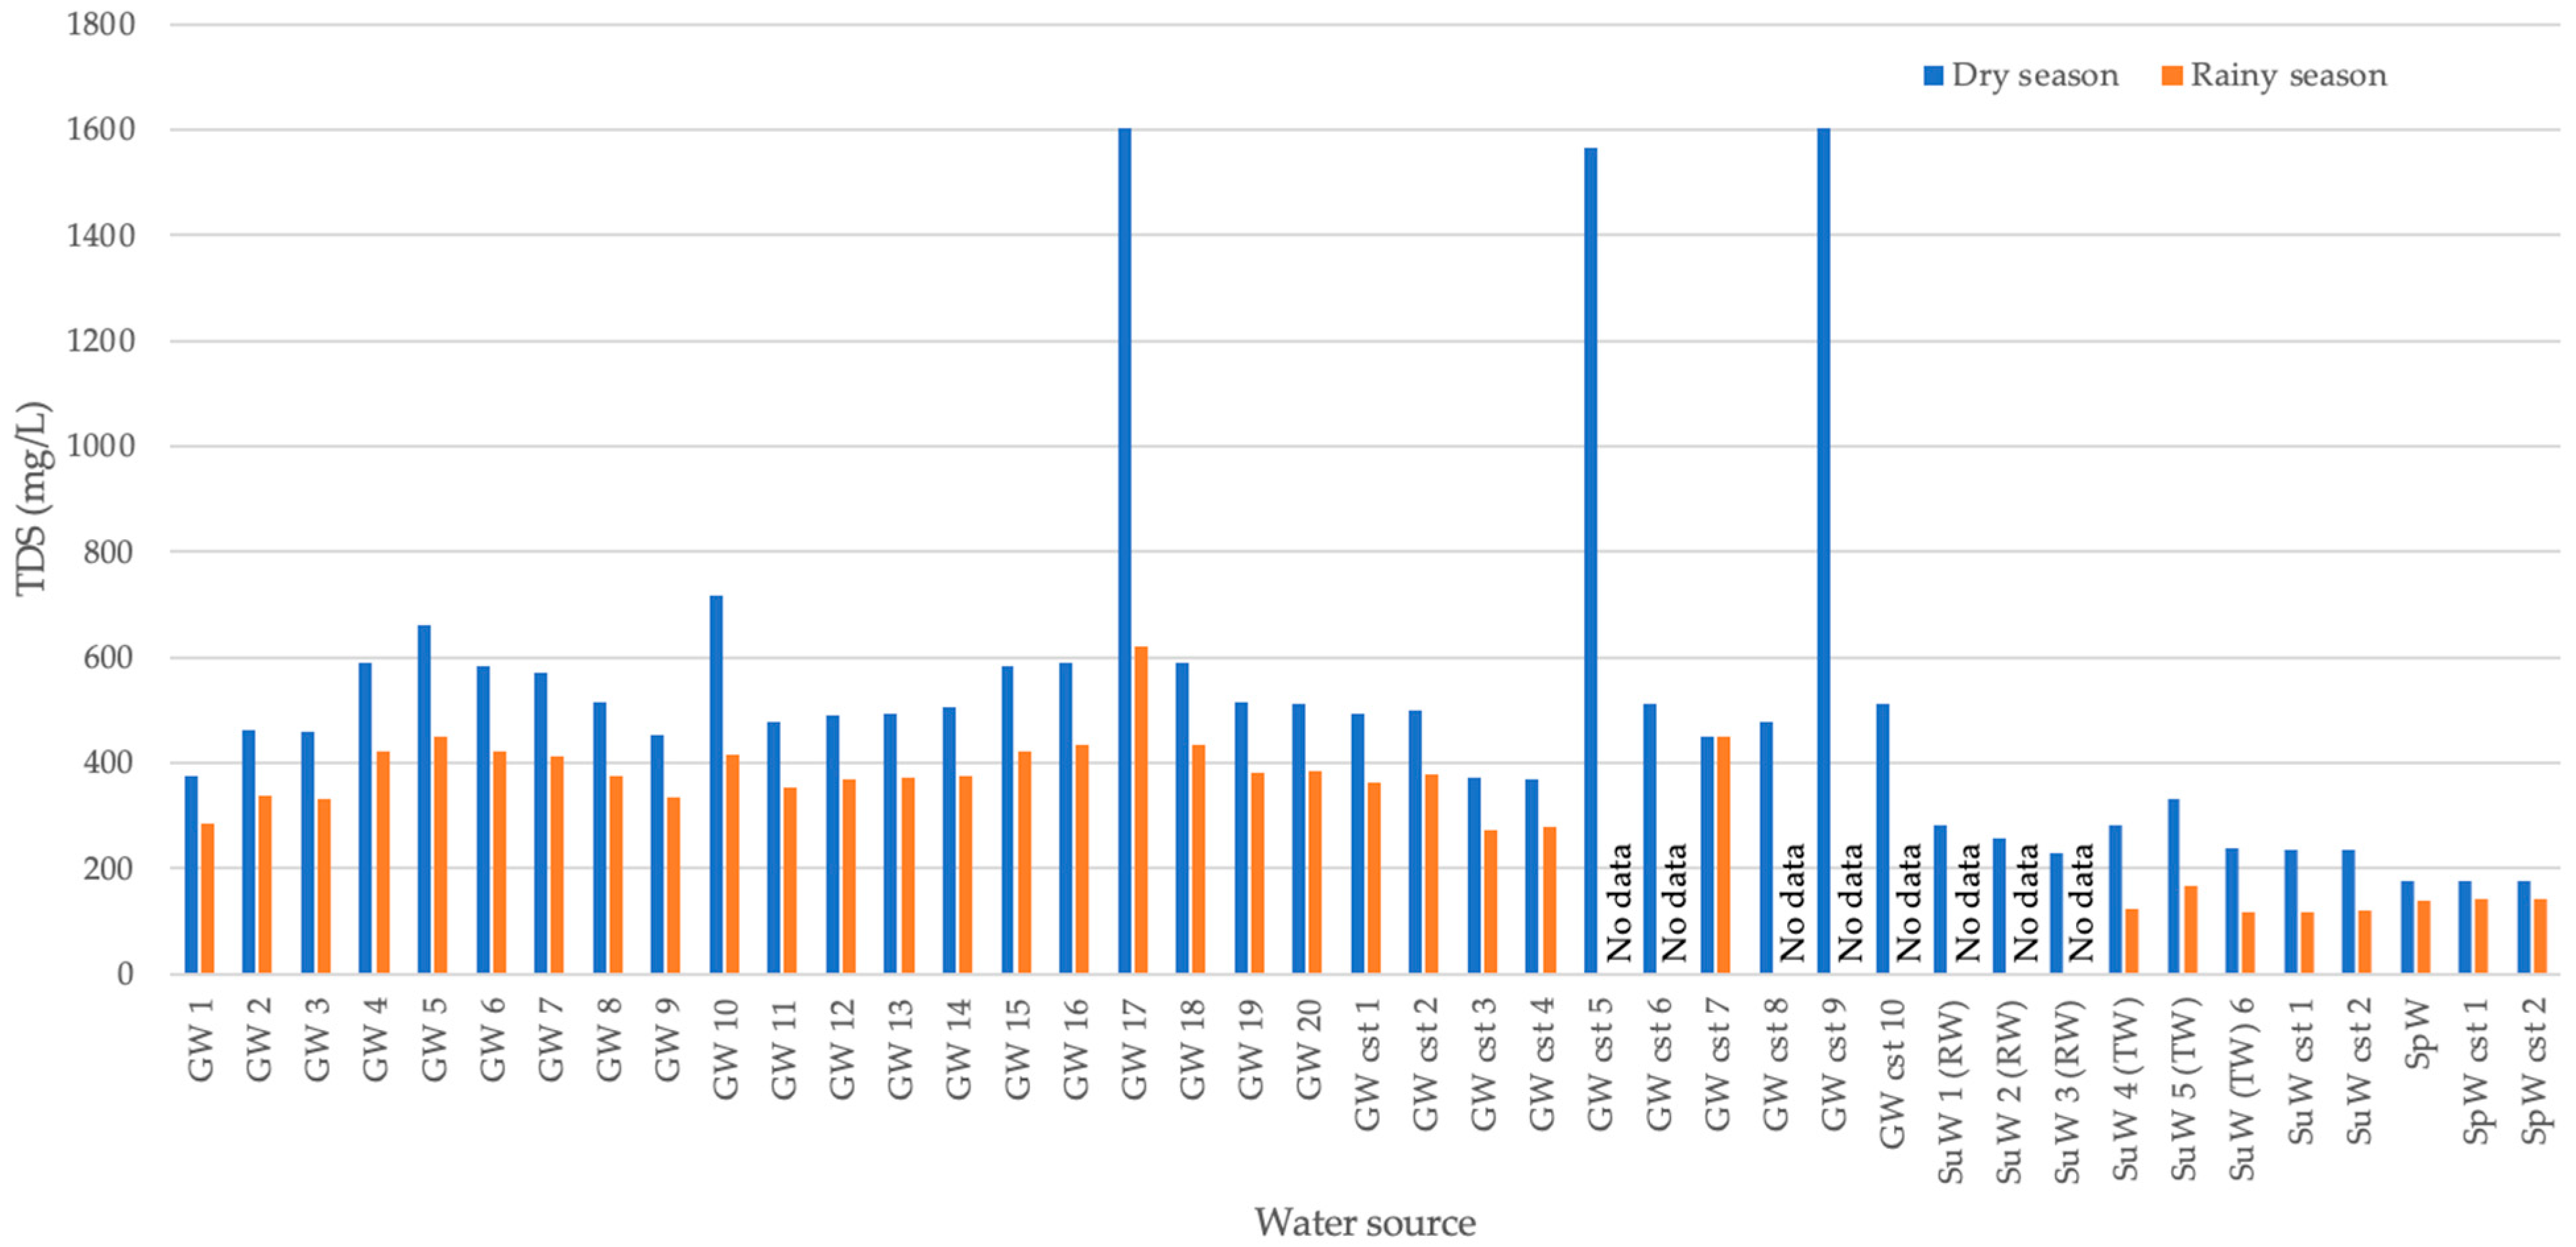
3.1. Water Quality in Source Waters and at Customer Taps

Figure 3 shows the TDS, hardness, total iron, and manganese concentrations in different water sources and at customers’ taps in the supply area of PDAM Surakarta. The red lines are the water quality standards stipulated in the Ministry of Health decree No. 2 Year 2023 [50]. The groundwater contains higher levels of TDS than the surface and spring water sources; additionally, all samples from the groundwater sources and customers’ taps supplied with groundwater contained higher amounts TDS than the water quality standards of 300 mg/L because no treatment was completed for the groundwater (Figure 3a). There were water samples containing extremely high levels of TDS above 1500 mg/L: four samples from one groundwater source and six samples from two groundwater taps (indicated in Figure 2 with a T symbol). The TDS in the customers’ taps were lower than the TDS in groundwater, indicating that the level of TDS was reduced in the distribution networks owing to the precipitation of insoluble salts, adsorption to pipe walls, or the mixing of water distributed from other sources.
Figure 3b shows the degree of hardness in water samples taken from different water sources. Based on the WHO guidelines for hardness in drinking water [51], the spring water and surface water sources are moderately hard, while groundwater is very hard, which indicates a high potential for calcium carbonate precipitation in the water supply pipes. Other parameters, such as pH, temperature, and alkalinity, also influence precipitation [51]. The hardness in customers’ taps should be noted as being higher than in groundwater, indicating that calcium and magnesium were dissolved into water in the distribution networks. Thus, calcium scaling in the water mains is not likely to occur.
Figure 3c shows the total iron concentration in the samples from different water sources. A total of 13 samples from groundwater sources and one tap water sample out of 106 groundwater samples contained higher iron levels than the threshold stipulated in the water quality standards of 0.2 mg/L. All spring water samples and customer tap samples using spring water contained a low concentration of iron below 0.2 mg/L. However, the surface water contained a high concentration of total iron above 0.2 mg/L, which was reduced below 0.2 mg/L in the water treatment processes. In all of the samples taken from different sources, the iron concentration decreased from the water sources to the customers’ taps, indicating iron removal via deposition in the distribution pipes and scale formation.
Figure 3d shows that the manganese concentration was higher in the order of groundwater (average concentration 0.26 mg/L), surface water (0.025 mg/L), and spring water (0.0045 mg/L). Twenty-eight out of thirty-six samples exceeded the water quality standards of 0.1 mg/L. The manganese concentrations were lower in the customers’ taps than in the groundwater, indicating that manganese oxidation and deposition occurred in the distribution pipes before reaching customers’ taps. Because only five out of twenty groundwater sources had chlorination facilities, the process of manganese oxidation was facilitated not only by chlorine but also possibly by MOB. Meanwhile, in the raw water of the surface water sources, high manganese potentially originates from textile wastewater discharge, decreasing surface water quality [52]. Furthermore, high manganese concentrations were recorded in the treated surface water due to mixing with untreated groundwater sources in the clear water tanks in two water treatment plants.
We measured the general water quality parameters, such as the pH, temperature, alkalinity, and sulfate concentration, because these could influence manganese release from loose scale deposits in the pipelines; low pH, low alkalinity, high temperatures, and high sulfate concentrations promote manganese release from deposits [53]. Table 4 shows the results of the water quality analyses. The pH level was between 7.13 and 7.45, while the temperatures ranged from 24.70 to 29.47 °C. Meanwhile, the average alkalinity in the groundwater samples was high at 375.2 mg/L, reducing to 297.0 mg/L at customers’ taps. Scale deposits detach from the pipes as the temperature rises. Zhang et al. [53] observed that manganese was released into a solution over time at different water temperatures. The time needed for the solution to exceed 100 μg/L of manganese was twice as fast when the temperature rose from 15 °C to 25 °C (4 h at 15 °C compared to 2 h at 25 °C). The high temperatures in the study area suggest that the scale deposits in Surakarta are prone to detaching, causing discoloration and other problems.
The total chlorine concentrations were below the national standards for drinking water of 0.2 mg/L in all customer tap samples despite the fact that surface water and spring water sources, as well as five out of twenty groundwater sources, pass through a chlorination facility. The decreasing chlorine concentrations found in customers’ taps fed by groundwater were significant compared to spring water and surface water customers’ taps. We selected water sources and nearby customers’ taps for the analyses of residual chlorine. The total chlorine was 0.46 mg/L in a groundwater source and 0.12 mg/L in a customer’s tap supplied by groundwater from a deep well in Plesungan. The total chlorine was 0.17 mg/L in surface water sources (WTP Semanggi) and 0.14 mg/L and 0.16 mg/L in customers’ taps supplied by surface water. Meanwhile, in spring water, it was recorded as being 0.14 mg/L at the source and 0.12 mg/L and 0.09 mg/L at customers’ taps. Chlorine was rapidly consumed in the pipeline from groundwater sources before reaching customers’ taps. Scale deposition is one of the main causes of lower chlorine concentrations in distribution pipes due to reactions with chlorine [24].
The silica in groundwater and spring water was higher than in surface water due to silica dissolution from rocks and soils in the aquifer [54]. Meanwhile, the DO in the groundwater sources was lower due to the limitation of contact with the air in the atmosphere.
Furthermore, major cations found in the water samples were Na+, Ca2+, K+, Mg2+, and NH4+, and major anions were Cl, SO42–, HCO3, NO3, and PO43–. The results of the analyses are shown in Table A1 of Appendix A, including evidence that the very high TDS concentration in samples from customers’ taps was caused by high Na+ and Cl concentrations in groundwater sources. As shown in Figure A1, the concentration of TDS in some wells becomes extremely high in the dry season because the wells dry up.
The water quality in customers’ taps in the service area supplied from groundwater sources is shown in Figure 4, Figure 5, Figure 6 and Figure 7. Figure 4 shows the results of isolated sampling points in two groundwater sources across different pipe diameters. In water supply systems, we use large-diameter pipes in areas closer to water sources, such as groundwater, and the diameters of pipes gradually decrease as we move away from water sources because water flow gradually decreases. Thus, small-diameter pipes are located in areas further away from water sources, whereas large-diameter pipes are installed in areas closer to water sources. Therefore, water in small-diameter pipes is likely to have a longer hydraulic retention time than water in large-diameter pipes as they are further away from the water sources. Thus, we compared iron and manganese concentrations in small- and large-diameter pipes to see how hydraulic retention times influence iron concentrations in water supply pipes. Figure 4a,b shows the sampling locations, and Figure 4c–e shows the TDS, total iron, and manganese, respectively. The TDS in Banyuanyar were stable from the source across different pipe diameters, indicating that the water in the pipes came from the same source. Meanwhile, in Karangasem, TDS were lower in pipes with 100 and 75 mm diameters, possibly because the pipes were located further away and were reduced in the distribution networks owing to the precipitation of insoluble salts and/or adsorption to pipe walls.
The iron concentration decreased from water sources along with decreasing pipe diameters in both Banyuanyar and Karangasem (Figure 4d). These results indicate that iron was gradually removed along the pipelines owing to scale deposition. Ferrous iron can be readily oxidized by dissolved oxygen in supplied water and removed by adsorption onto the deposits on the pipe walls. In addition, iron-oxidizing bacteria attached to the pipe walls might have contributed to iron oxidation to some extent, according to references [11,36].
Figure 4e shows that the manganese concentration also decreased from the source along with decreasing pipe diameter, which is more obvious in Karangasem than in Banyuanyar. As an exception, manganese concentrations in 50 mm pipes were higher than in pipes with larger diameters because the sampling points were located closer to the water source compared to the 75 and 100 mm pipes.
Meanwhile, the pH and temperature in both Karangasem and Banyuanyar were stable. The pH ranged from 6.96 to 7.61 in Karangasem, with an average value of 7.32, and from 7.53 to 7.96 in Banyuanyar, with an average value of 7.57. The temperature ranged from 27.0 to 29.7 °C in Karangasem, with an average value of 28.64 °C, and from 27.1 to 31.1 °C in Banyuanyar, with an average value of 29.17 °C.
Figure 5 shows the iron and manganese concentrations along with the distance from the water source. It must be noted that the distance does not necessarily indicate the hydraulic retention time, and it could be possible that the water is mixed with water coming from a different pipeline route. Nevertheless, these results clearly indicate that iron and manganese decreased along with the distance from the water sources, which provides evidence of iron and manganese scale deposition in the pipelines.
Figure 6 shows the water quality of groundwater sources and 40 customers’ taps selected randomly from the areas supplied by groundwater sources (see Figure 2 for sampling locations). Figure 6a shows that the TDS values in customers’ taps were not significantly different from the water sources (Wilcoxon rank-sum test, p > 0.05), excluding the outliers and the sampling points influenced by surface water sources. Meanwhile, a seasonal variation in TDS is shown in Figure A1. The higher TDS levels at every groundwater source in the dry season compared to the rainy season indicate the reduced infiltration of rainwater in the dry season in the study area. The three extremely high levels of TDS of approximately 1600 mg/L were only found in the dry season.
Figure 6b,c show the total iron and manganese in groundwater sources and customers’ taps. The iron concentration in customer taps was significantly lower than the iron concentration in the source water (Wilcoxon rank-sum test, p < 0.05), providing evidence of iron deposition in the pipelines (Figure 6b). The manganese concentration in taps was also lower than the manganese concentration in the source water (Figure 6c), providing evidence of manganese deposition within the pipelines. As a result, the pipelines de facto remove iron and manganese from the source water. All the tap water samples contained iron lower than water quality standards, except for two samples, while sixteen out of twenty-two tap water samples contained manganese lower than the water quality standards.
Figure 7a shows the variation in TDS along with the longitudinal sampling points (see Figure 2). The north area (Sampling Points #1–3) is supplied by groundwater sources; thus, the level of TDS was high. At Sampling Point #4, the lower level of TDS is due to proximity to a surface water treatment plant and a pipeline from spring water sources. Meanwhile, the high level of TDS in Sampling Points #5 and #6 is due to a groundwater source located in proximity to the sampling points. TDS were lower at the southern Sampling Points #7–10 than in the north, indicating that the water in this area came from either surface water or spring water. The dashed line shown in Figure 2 between Sampling Points #6 and #7 indicates the boundary between an area supplied with groundwater in the north and an area supplied with surface or spring water in the south.
Figure 7b shows the total iron levels from north to south, taken approximately every 700 m. All of the samples were below the water quality standards. The groundwater customers have a concentration of total iron slightly higher than the surface water and spring water customers because the iron concentration in the source water is high. The low concentration in all customers’ taps is further proof that iron was oxidized in the distribution pipelines. Figure 7c shows the manganese concentration along with the longitudinal sampling points. In the north part, the manganese concentrations were below 0.05 mg/L, indicating that these sampling points are further away from groundwater sources and manganese was removed in the pipelines. Meanwhile, in the middle section, Sampling Points #4–6 are mostly sourced from the nearby Banjarsari deep well, which has a high manganese concentration of 0.60 mg/L. Because Sampling Point #5 is the closest to the water source, the manganese concentration was the highest at 0.25 mg/L. The manganese concentration decreased rapidly in the pipelines from the sources and then gradually with distance from the water source (Figure 5). In the southern part, the water is sourced from either surface water or spring water; hence, the manganese concentrations were low.

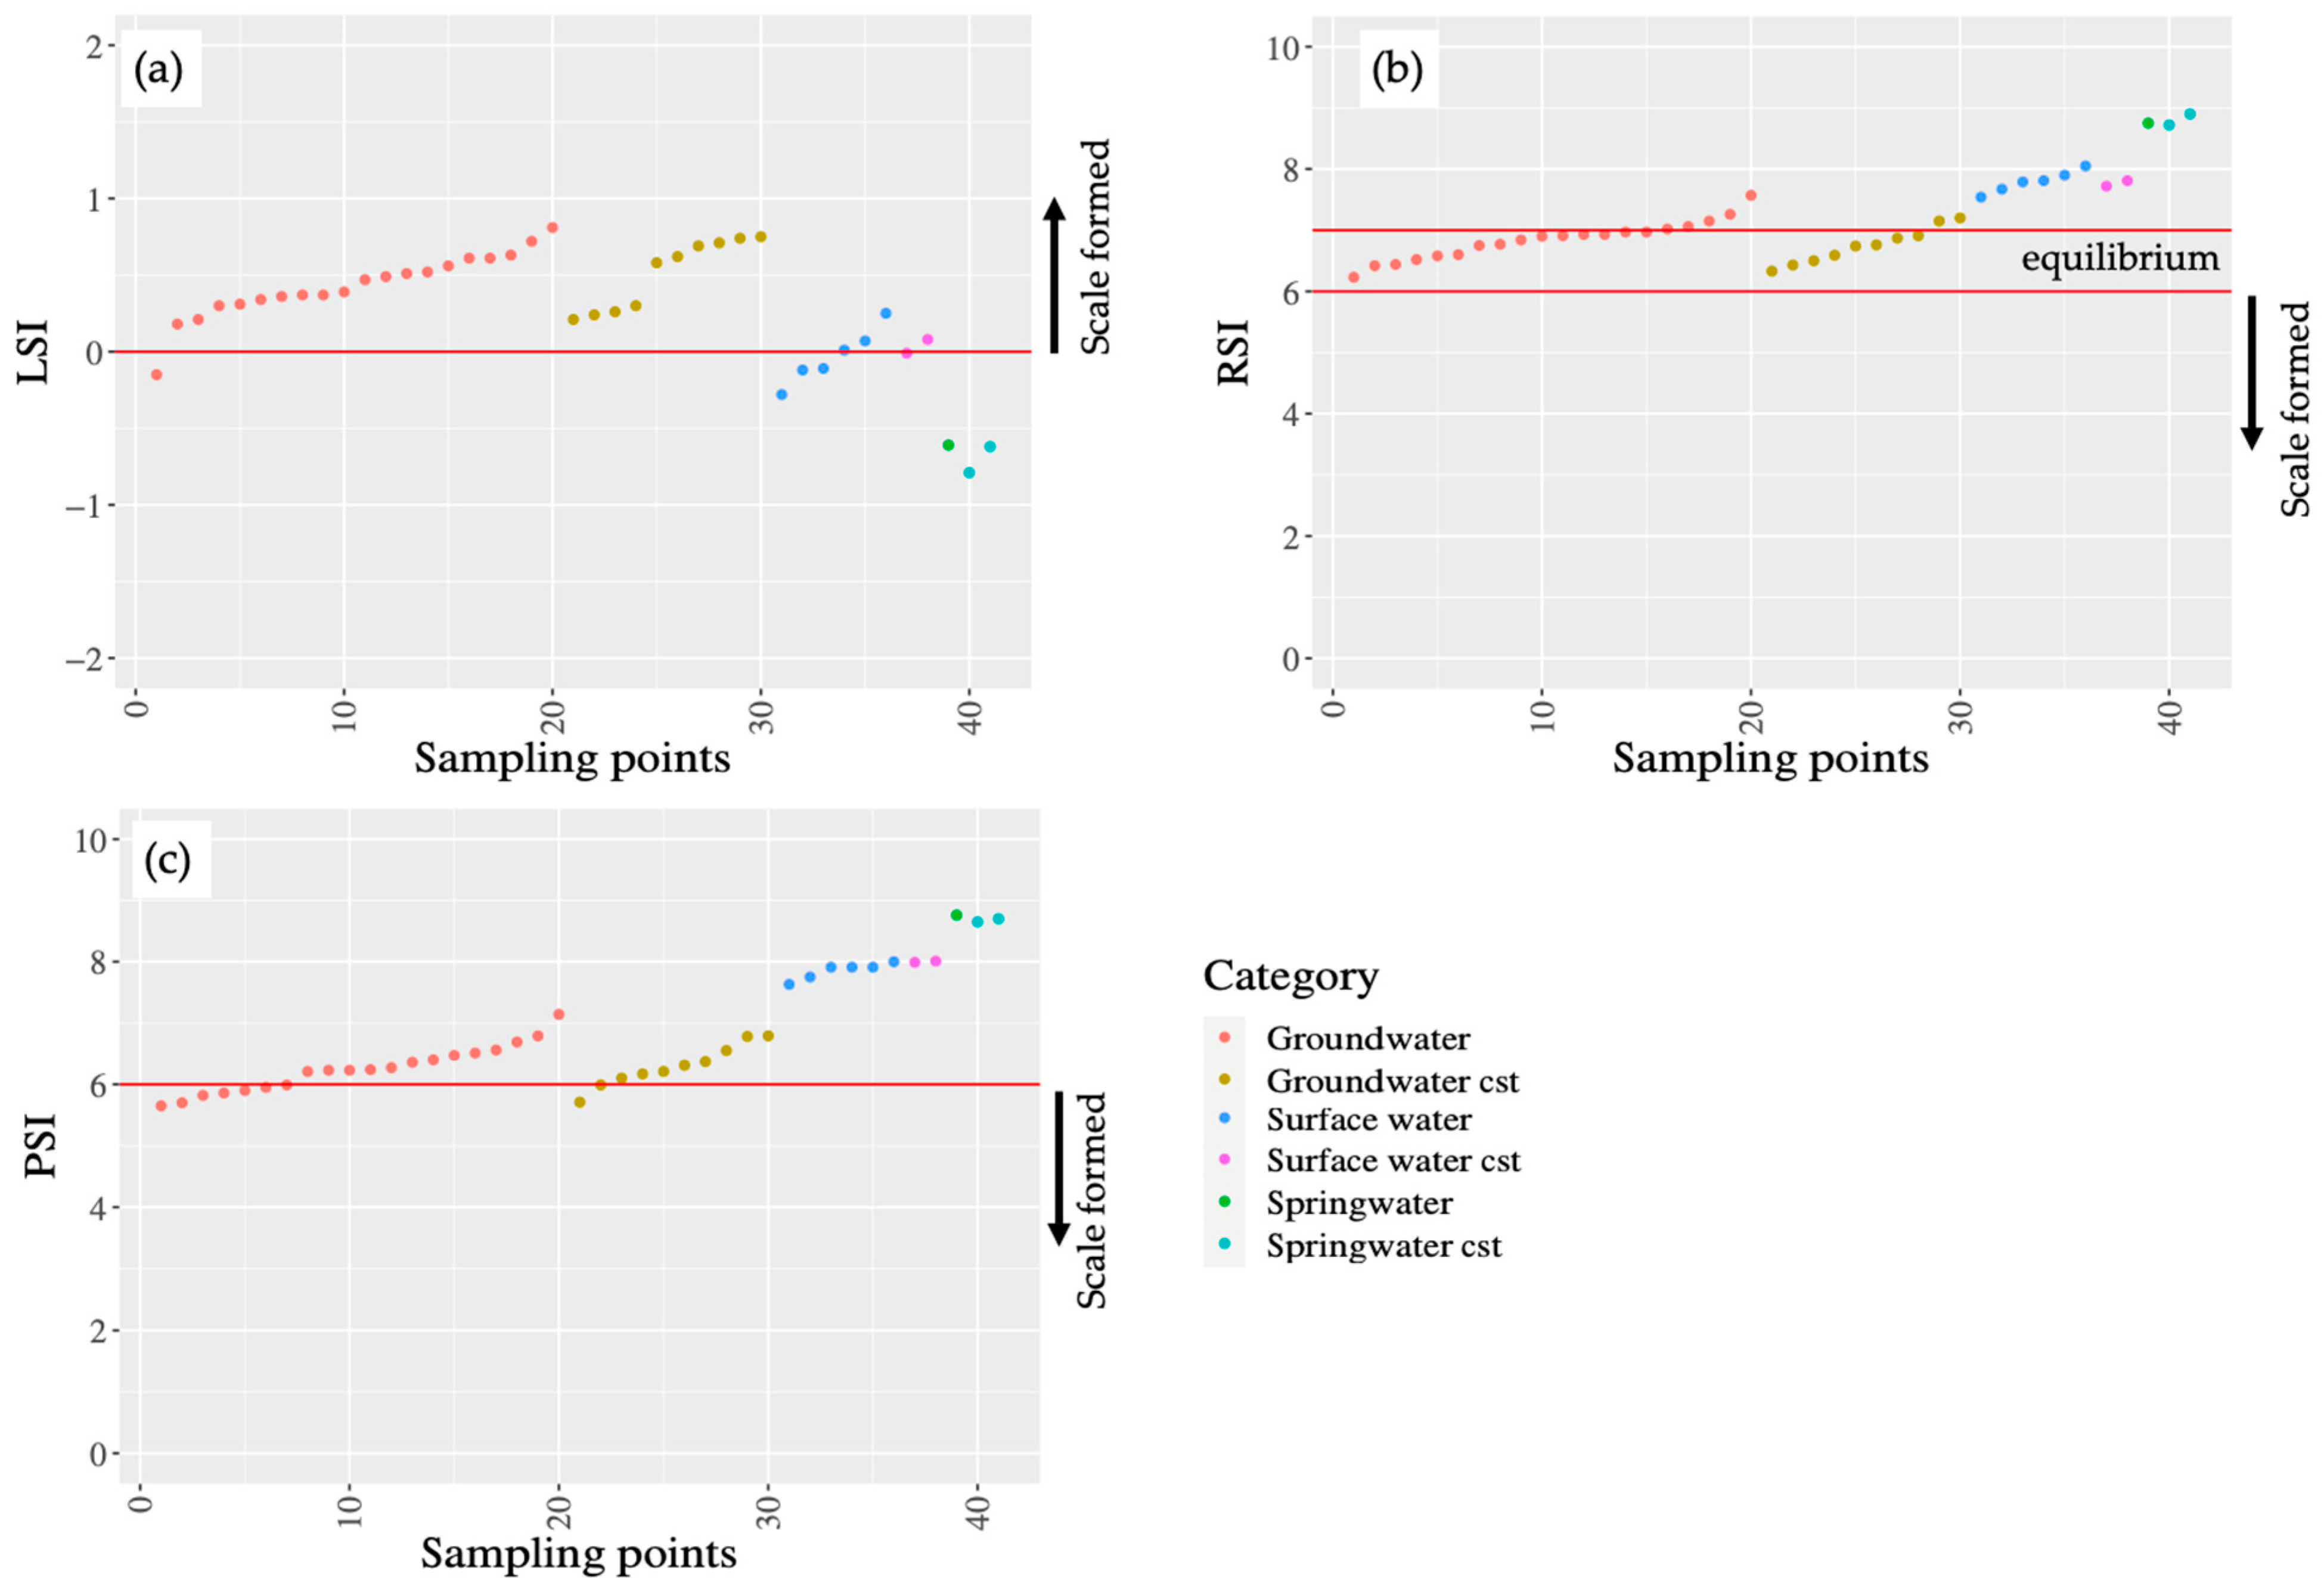
3.2. Saturation Indexes

The LSI, RSI, and PSI were calculated for different water sources and customers’ taps to estimate the saturation levels of calcium carbonate (Figure 8). The LSI of groundwater and its customer samples produced an LSI > 0, which indicates that the water samples were supersaturated. Meanwhile, other water sources were below saturation with an LSI < 0. Undersaturated water tends to dissolve calcium carbonate, while supersaturated water tends to form calcium carbonate scale deposits in the pipeline. Even though the values were positive, the LSI values were below 1, indicating that a change in temperature or another ambient factor could shift the LSI value.
Meanwhile, most of the RSI values, especially from groundwater sources, were between 6 and 7, indicating that the water samples were in equilibrium. All the RSI values from the surface water and spring water samples were above 7, indicating that water tends to dissolve calcium carbonate and has a corrosive property. On the contrary, six groundwater samples had PSI values <6, indicating the possibility of calcium carbonate precipitation. Other samples had PSI values >6, indicating that most samples were likely to dissolve calcium carbonate. Furthermore, surface water and spring water samples had corrosive tendencies based on the PSI values. These three saturation indices are not in clear agreement because most of the data were close to equilibrium; namely, the LSI indicated that groundwater samples had a weak tendency to form a calcium carbonate scale, while the RSI and PSI indicate equilibrium and undersaturation, respectively. However, we should note that the degree of hardness at customers’ taps was higher than in water sources (Figure 3b), indicating the dissolution of calcium and magnesium in the pipelines.

3.3. Elemental Composition of Scale Samples

Figure 9 shows the scale in the cut-out pipe samples. Samples #1–7 were collected from pipelines supplying groundwater from different groundwater sources. Meanwhile, Sample #8 was collected from a pipeline transporting a mixture of surface water and groundwater. Scale deposits were observed in Samples #1–#8.
Sample #9 was obtained from a pipeline supplying spring water, and Sample #10 from a pipeline supplying spring water and surface water. The average manganese and iron concentrations were 0.0045 mg/L and 0.025 mg/L in spring water and 0.06 mg/L and 0.08 mg/L in treated surface water located in the southern part (no mixing with groundwater). Therefore, we did not find any scale deposits in Samples #9 and #10.
Table 5 shows the XRF measurement results. In Sample #7, XRF analysis of the surface layer (Sample #7a) and the inner layer (Sample #7b) was performed because of the thick layer of scale. The predominant elements in the scale samples were Mn (Samples #1–#6, 50.15–80.82%) or Fe (Samples #7a, #7b, and #8, 45.60–63.82%), and Ca was a minor component (2.98–7.83%) despite the results relating to calcium scaling indicators.
In Samples #7a, #7b, and #8, the iron composition was higher than that found in other samples. The water sources of these pipes contained high iron concentrations of 0.18 and 0.21 mg/L for #7 and #8, respectively, and the Fe/Mn ratios were much higher at 10.3 and 1.7 for #7 and #8, respectively, than those found in other water sources. A total of 15 water sources out of 20 had Fe/Mn ratios of less than 1.0. Thus, a high iron concentration and high Fe/Mn ratios might be the cause of high iron contents in the scale of Samples #7 and #8. The manganese content was lower in the surface section (#7a) than in the inner section (#7b). This suggests that the manganese scale formed initially, and then iron was adsorbed onto the manganese deposits, forming a composite scale. Furthermore, two customers’ tap samples taken near scale Sample #7 showed an iron concentration of 0.02 mg/L and BDL. This finding suggests that iron was fully oxidized in the pipelines.
Furthermore, the scale samples contain small amounts of heavy metals. Samples #1, #2 #3, #5, and #8 contain 0.26%, 0.14%, 0.15%, 0.11%, and 0.07% of lead (Pb), respectively. The release of scale deposits can cause lead (Pb) to enter the distribution system. Lead (Pb) poisoning can result in neurodevelopmental, cardiovascular, renal, and reproductive health effects [55,56]. These health effects are thought to occur at blood lead levels as low as 1–2 μg/dL [55].

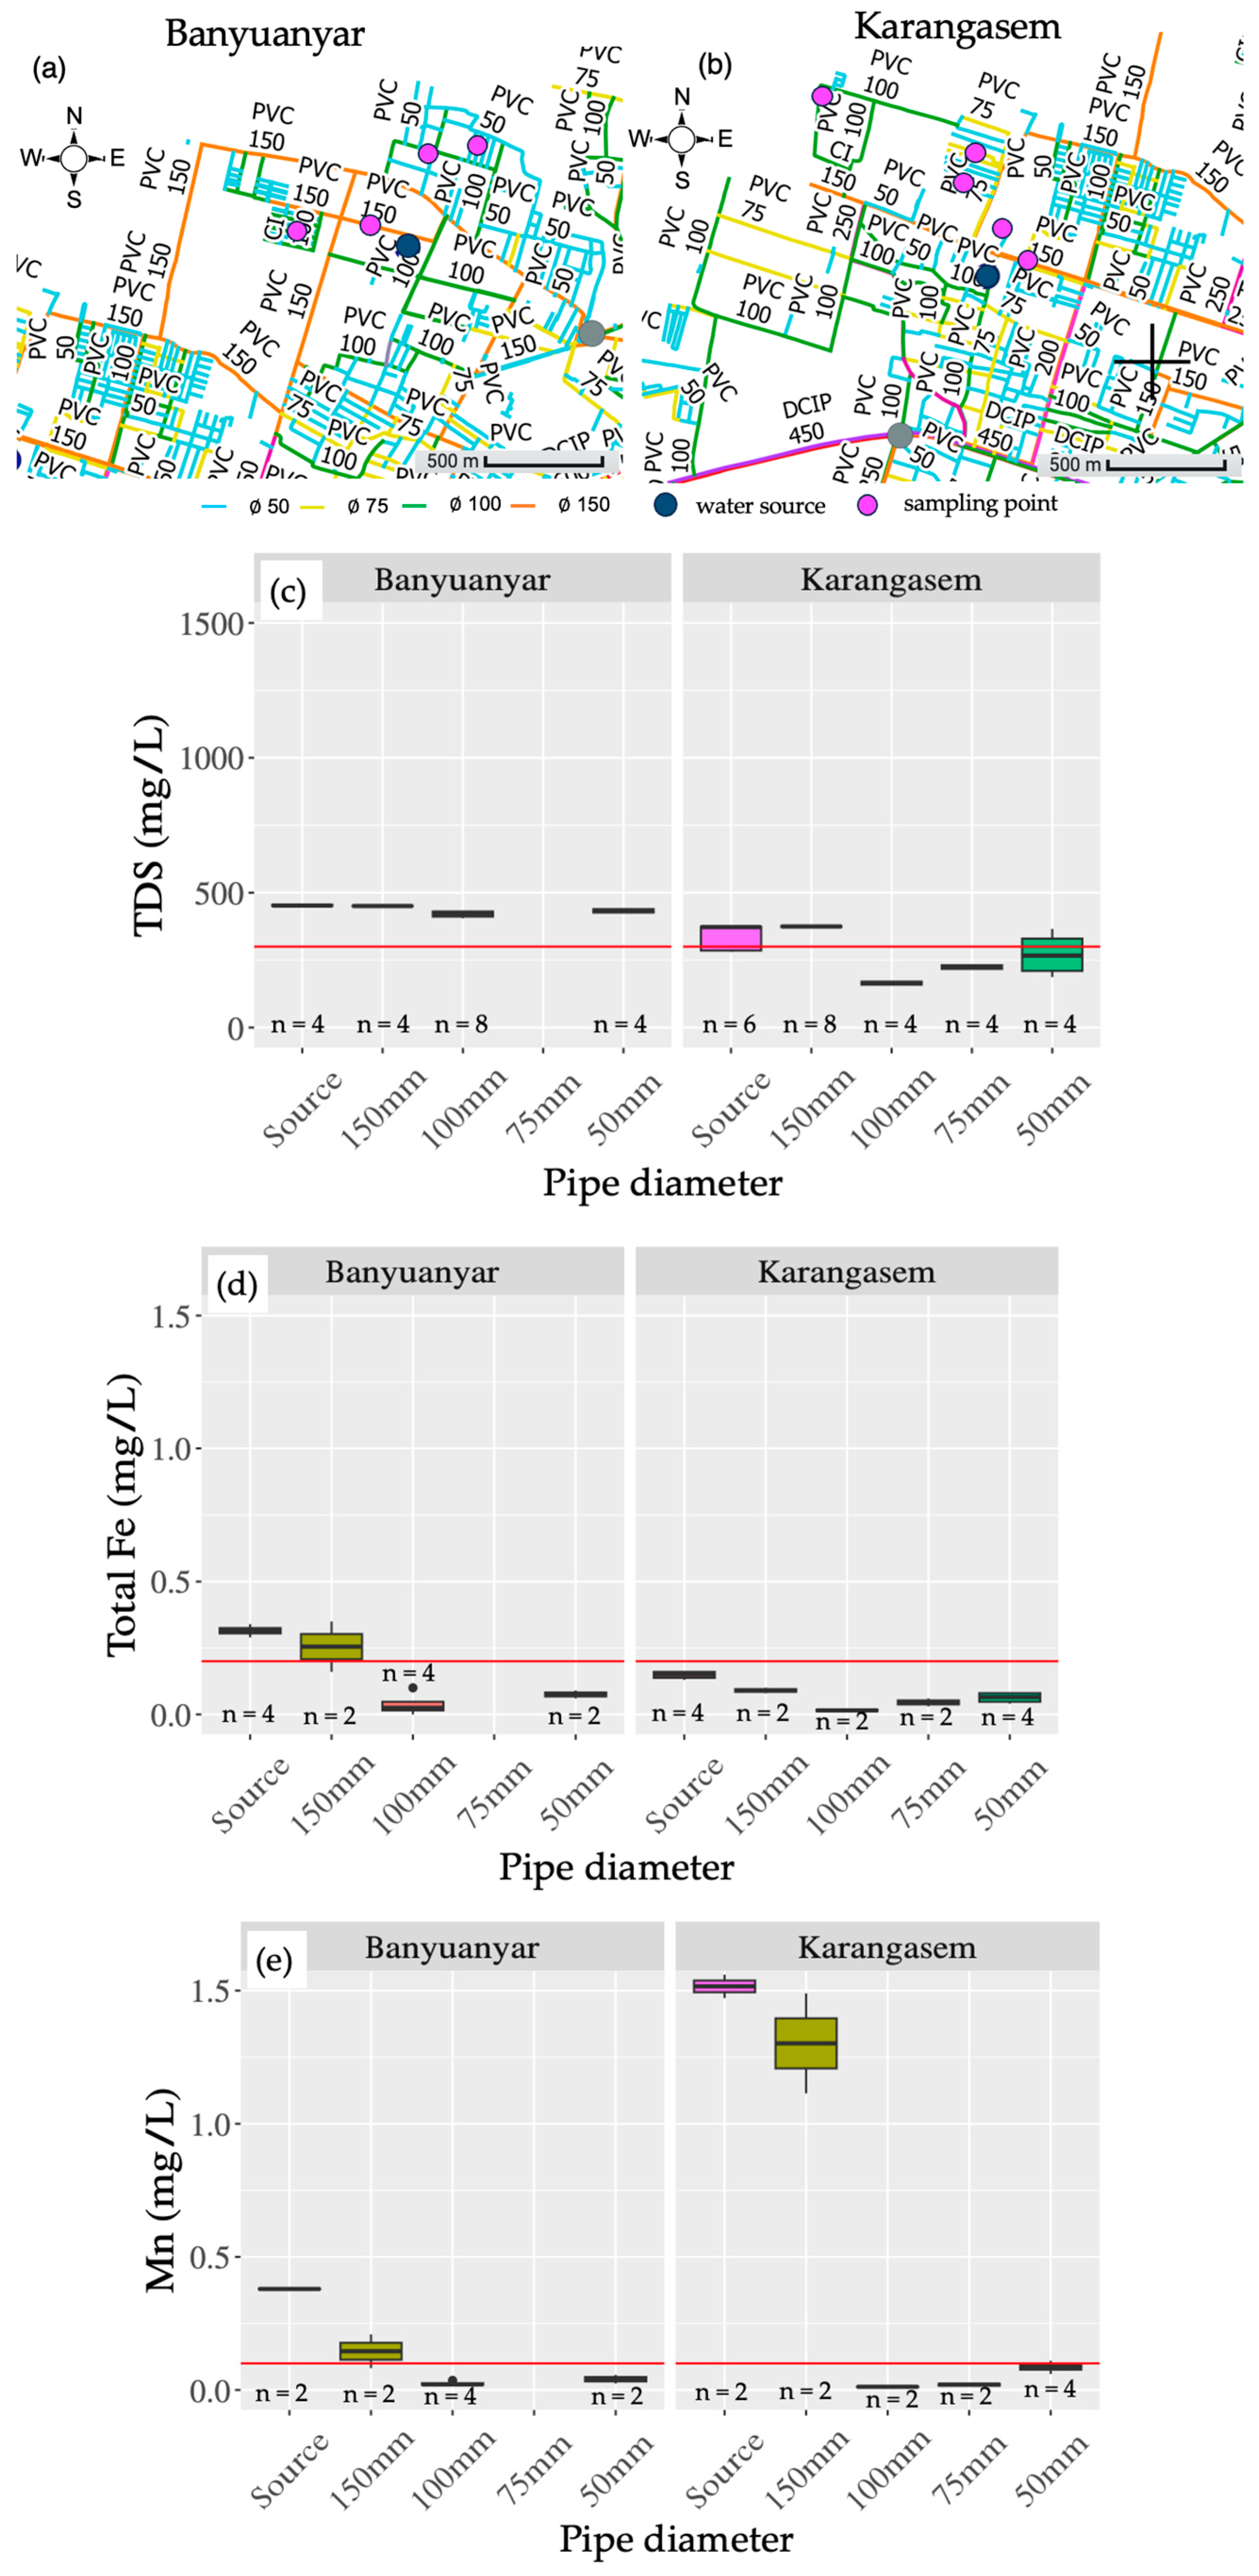
3.4. Effects of Iron and Manganese Scale in PDAM Surakarta

Other than the effect of reducing the effective diameter of the pipelines, the release of loose deposits causes problems such as high turbidity, color changes, taste changes, odor, and microbial contamination. Out of 57 customers’ taps, black water was found in 41 taps (71.9%), with seven taps more frequently affected. The black water is caused by changes in water velocity during maintenance processes; the loose deposits have porous structures and can be easily detached at a velocity of 0.5–0.8 m/s [13]. While the majority of the respondents were satisfied with their water, in seven out of fifty-seven of the sampling taps, the water pressure was not high enough because the water flow was possibly being impeded through pipes that were clogged by scaling. Therefore, it is important to remove iron and manganese from groundwater, using similar methods as used in surface water treatments, not only to avoid scale deposition and the clogging of pipes but also to win the confidence of customers.

4. Discussion

4.1. Scale Deposition and Saturation Indexes in PDAM Surakarta

Manganese and iron were found to be the major components of scale deposits via elemental analysis using XRF. Because manganese is released into groundwater in a soluble form, namely Mn(II), in the aquifer, it needs to be oxidized to Mn(III) or Mn(IV) to become insoluble in water and form scale. Although the oxidation and deposition reactions are slow and invisible, it is very important to monitor pipelines to avoid the multiple problems that arise from scale deposition. The oxidation of Mn(II) by dissolved oxygen is thermodynamically favorable; however, the reaction rate is considerably slow at a near-neutral pH of (<8.5) [57]. Because PDAM Surakarta only chlorinates five out of twenty groundwater sources, manganese oxidation is likely to be facilitated by MOB. Once a manganese film forms on the inner surface of a pipeline, the oxidation rate is dramatically increased due to the propagation of the MOB population and the high absorption capacity of biogenic MnOx [11]. These biogenic MnOx also exhibit high adsorption capacities for other metal cations such as Al, Fe, and Ca, which, over time, form scale in pipelines [24,58]. The adsorption of metal cations, especially Al, is high at pH levels of 7.7–9 [58]. Non-chlorinated conditions are more favorable for the adsorption of particulate Al deposition [58]. Meanwhile, chlorinated conditions are more favorable for the adsorption of Cr(IV) deposition [59]. The pipe material used also affects scale formation. In PDAM Surakarta, 92.54% of the distribution pipes are PVC pipes. This material has a high affinity to manganese deposits [24,35]; therefore, the distribution pipelines in Surakarta are rendered prone to manganese oxide scale formation. However, there was a limitation in this study in that it was not possible to evaluate the contribution of multiple factors that influenced scale deposition in water supply pipes in Surakarta via our survey of the distribution networks because these factors have varied hourly depending on water consumption for more than ten years.
The three saturation indexes indicated different results concerning calcium carbonate saturation in groundwater, namely, supersaturation (LSI), equilibrium (RSI), and undersaturation (PSI) for CaCO3. The LSI was proposed first as a simple comparison between water pH and the saturation pH levels of calcium carbonate. Then, the RSI and PSI were proposed to take saturation in various water matrices into consideration. Scaling indexes, such as the LSI, PSI, and RSI, have limitations; most importantly, water flowing in pipes is in a dynamic state and could be different from the equilibrium state of static water. Therefore, they should be combined with the elemental analysis of scale deposits. CaCO3 scaling is a complex process, and many aspects need to be considered. These limitations arise from the complex nature of the system, which involves multiple equilibrium interactions at the interfaces between solid/liquid and liquid/gas phases [60]. Dependable thermodynamic equilibrium data are scarce for these interactions. The major weakness of saturation indexes is that the crystalline form of CaCO3 only considers calcite [61] and the presence of other forms of CaCO3(s) are neglected. Calcium carbonate has six allotropic forms, consisting of three anhydrous forms (calcite, aragonite, and vaterite) and three hydrated forms (amorphous calcium carbonate, monohydrate calcium carbonate (CaCO3.H2O), and hexahydrate calcium carbonate (CaCO3.6H2O)) [62]. Amorphous calcium carbonate has been demonstrated to be a precursor for rapid CaCO3 nucleation under conditions of high supersaturation, whereas monohydrate calcium carbonate has been identified as a precursor for CaCO3 nucleation under low supersaturation [62]. Another limitation is that Ca2+ and HCO3¯ complexation is not considered. When polyphosphates are present, the equations relating to pH levels tend to overstate CaCO3 saturation unless adjustment factors are incorporated to accommodate for the complexation [61]. Despite the limitations of saturation indices mentioned above, the results in this study show that the elemental composition of calcium in the scale samples was much lower than the manganese and iron contents (Table 5) and that the degree of hardness in customers’ taps was increased when coming from groundwater sources (Figure 3b). Thus, it can be concluded that the PSI represents the saturation condition of water sources and supplied water in Surakarta the best among the three saturation indices.

4.2. Analyses of Water Sources and Scale Deposition in the Distribution Network Using Water Quality Data

TDS measurements at customers’ taps are useful for examining possible scaling in pipelines. TDS data at customers’ taps provide useful information to delineate the supply areas of different water sources, such as groundwater and surface water (Figure 2, Figure 3, Figure 4, Figure 5, Figure 6 and Figure 7). The groundwater sources contain higher TDS than surface water and spring water; thus, we can use TDS data to identify the water supply areas requiring more detailed monitoring of scale deposition.
The decreasing trends in iron and manganese concentrations along the pipeline distance from water sources to customers’ taps provide evidence of iron and manganese deposition in the pipelines. Furthermore, we can estimate the amounts of iron and manganese scale deposition in the pipelines using these water quality monitoring data. Using the average manganese and iron concentrations at the water source and customers’ taps and the average water production, the rate of scale deposition was calculated. Among the 20 groundwater sources, iron and manganese deposition from one source was calculated separately from others owing to the high iron and manganese concentrations. As a result, an average of 1660.1 kg/year of manganese and 559.5 kg/year of iron are estimated to be deposited in the pipelines supplying groundwater. These deposits continually accumulate for years and reduce the effective diameter. In other cases, these deposits can become detached from the pipelines, causing problems such as black water, turbidity, color changes, taste changes, odor, and microbial contamination.

4.3. Prevention of Manganese Scale Deposition in PDAM Surakarta

Controlling manganese concentrations before the start of the distribution pipeline is the most important factor in preventing manganese scale deposition. If the treated water contains manganese, manganese precipitation is unavoidable, especially in Surakarta, where manganese deposits have accumulated in the pipes for a long time. The removal of other metal cations, such as iron and aluminum, is also crucial because these cations can be absorbed by the current scale layer deposited in the pipes.
PDAM Surakarta needs to consider installing a manganese removal facility and prioritize this installation, even under budget limitations. Among 20 groundwater sources, 14 had manganese concentrations above 0.1 mg/L, and one was exceptionally high, with an average manganese concentration of 1.47 mg/L. One feasible manganese removal method can be achieved via adsorption. This method is widely used because it is highly efficient, simple to operate, and cost-effective. Mn(II) can be removed by sorption to a solid surface, commonly using manganese oxide in a pH range of 6–9. Some of the common materials used for this method are glauconite (greensand), pyrolusite (a natural mineral containing MnO2(s)), ceramic materials coated with a MnOx surface, and anthracite coal or silica sand coated with MnOx [63]. When the adsorption capacity of the MnOx-coated media is exhausted, a breakthrough of dissolved Mn(II) occurs. This problem can be solved by adding oxidants, commonly permanganate (MnO4¯), to the backwash water.

5. Conclusions

The elemental analysis of scale deposits combined with the analysis of iron and manganese at water sources and customers’ taps provided evidence that manganese and iron are the main causes of scale deposition in the PDAM Surakarta network. Iron and manganese concentrations gradually decreased in the pipelines with distance from the water sources, providing evidence of the causes of scale deposition in pipelines. Manganese and iron are mainly sourced from groundwater; in addition, other metal cations are incorporated into the scale due to the high adsorption capacity of MnOx. The fact that PDAM Surakarta directly distributed groundwater to the customers without any treatment exacerbated the problem of scale deposition, and further provides evidence that iron and manganese can be oxidized and deposited in pipelines in the absence of chlorine. Concerning current pipe conditions, where scale deposits have already developed, the continuous precipitation of manganese and iron is unavoidable. Manganese removal to as low as 0.05 mg/L is pivotal for avoiding manganese precipitation in the pipes.
Measuring iron and manganese at customers’ taps and comparing them with water sources is an easy and rapid method of verifying scale deposition in pipelines. This method can also help identify the water distribution pipelines that are accumulating more iron and manganese scale deposition and provide data for estimating the rate of scale deposition in the whole distribution network. TDS data at taps can be used to delineate the water supply areas receiving water from different sources.
Although the saturation indexes showed the potential for calcium carbonate precipitation to occur in pipelines conveying groundwater sources, less than 8% of calcium carbonate was detected in the scale sample. In addition, the degree of hardness at customers’ taps was higher than in groundwater. These results show the limitation of saturation indexes, such as the LSI, RSI, and PSI, in predicting and finding the causes of scale deposition. The elemental analysis of scale samples provides direct evidence that can be used to identify the causes of scale deposition.

Author Contributions

Conceptualization, S.T. and S.K.; methodology, S.A. and S.T.; formal analysis, S.A.; investigation, S.A.; data curation, S.A.; writing—original draft preparation, S.A.; writing—review and editing, S.K., B.S. and S.T.; supervision, S.K., B.S. and S.T.; project administration, S.T.; funding acquisition, S.T. All authors have read and agreed to the published version of the manuscript.

Funding

This research was supported by the Japan International Cooperation Agency (JICA) through the collaborative program with the University of Tokyo and the scholarship provided to Saiful Amin for his graduate studies. This study was also supported by a Grant-in-Aid for Scientific Research (No. 22H01621) provided by the Japan Society for the Promotion of Sciences (JSPS).

Data Availability Statement

The data are available upon request.

Acknowledgments

The authors extend their gratitude to the Ministry of Public Works and Housing of the Republic of Indonesia, Perusahaan Daerah Air Minum (PDAM) Surakarta, Fujimura Kazuyoshi from the Department of Urban Engineering, the University of Tokyo, and Yamagishi Takayuki from the Department of Applied Chemistry, the University of Tokyo.

Conflicts of Interest

The authors declare no conflicts of interest.

Appendix A

Table A1. The cations and anions in different water sources (ND; not detected).
Parameter GwGw cstSpwSpw cstSwSw cst
UnitMeanMeanMeanMeanMeanMean
Min–MaxMin–MaxMin–MaxMin–MaxMin–MaxMin–Max
Cation
Na+mg/L110.86
25.78–350.58
128.29
26.85–360.28
15.3915.43
15.42–15.44
29.43
20.58–50.01
21.55
21.52–21.58
Ca2+mg/L48.46
13.85–75.09
52.92
32.53–70.60
20.7820.75
20.73–20.78
37.06
35.99–38.38
37.29
37.25–37.32
Mg2+mg/L16.45
7.02–29.99
17.31
8.68–24.01
10.0810.13
10.13–10.14
8.99
8.39–10.04
8.56
8.56–8.57
K+mg/L8.38
4.19–12.52
7.61
3.12–9.89
4.694.6
4.54–4.66
4.24
3.48–5.33
3.42
3.40–3.45
NH4+mg/L0.23
ND–1.54
0.67
ND–1.44
ND0.01
ND–0.02
0.36
ND–0.99
ND
Anion
HCO3mg/L451.89
305.0–561.81
403.15
297.98–492.88
130.54133.89
132.37–135.42
170.66
151.89–193.57
149.24
146.4–152.93
Clmg/L55.19
9.49–511.94
116.86
8.55–507.61
8.959.01
8.99–9.03
32.93
21.70–51.86
32.91
32.78–33.06
SO42–mg/L7.74
1.47–16.42
7.94
1.51–15.98
5.675.79
5.79–5.80
16.10
14.53–17.56
14.64
14.56–14.72
PO43–mg/L0.68
ND–2.16
0.31
ND–1.56
NDND0.5
0.00– 1.51
ND
NO3mg/L2.05
0.69–9.68
2.00
0.69–8.87
10.2710.45
10.45–10.45
5.24
3.24–7.38
3.84
3.81–3.86
Figure A1. The level of TDS in the dry and rainy seasons. Some data are unavailable because of limitations during the field survey.
Water 16 02275 g0a1

References

  1. Zhang, H.; Liu, D.; Zhao, L.; Wang, J.; Xie, S.; Liu, S.; Lin, P.; Zhang, X.; Chen, C. Review on Corrosion and Corrosion Scale Formation upon Unlined Cast Iron Pipes in Drinking Water Distribution Systems. J. Environ. Sci. 2022, 117, 173–189. [Google Scholar] [CrossRef]
  2. Gerke, T.L.; Little, B.J.; Barry Maynard, J. Manganese Deposition in Drinking Water Distribution Systems. Sci. Total Environ. 2016, 541, 184–193. [Google Scholar] [CrossRef] [PubMed]
  3. Pan, L.; Li, G.; Li, J.; Gao, J.; Liu, Q.; Shi, B. Heavy Metal Enrichment in Drinking Water Pipe Scales and Speciation Change with Water Parameters. Sci. Total Environ. 2022, 806, 150549. [Google Scholar] [CrossRef] [PubMed]
  4. Li, G.; Ma, X.; Chen, R.; Yu, Y.; Tao, H.; Shi, B. Field Studies of Manganese Deposition and Release in Drinking Water Distribution Systems: Insight into Deposit Control. Water Res. 2019, 163, 114897. [Google Scholar] [CrossRef] [PubMed]
  5. Li, C.; Liu, C.; Xu, W.H.; Shan, M.G.; Wu, H.X. Formation Mechanisms and Supervisory Prediction of Scaling in Water Supply Pipelines: A Review. Water Res. 2022, 222, 118922. [Google Scholar] [CrossRef] [PubMed]
  6. Ghobadi, F.; Jeong, G.; Kang, D. Water Pipe Replacement Scheduling Based on Life Cycle Cost Assessment and Optimization Algorithm. Water 2021, 13, 605. [Google Scholar] [CrossRef]
  7. Malm, A.; Ljunggren, O.; Bergstedt, O.; Pettersson, T.J.R.; Morrison, G.M. Replacement Predictions for Drinking Water Networks through Historical Data. Water Res. 2012, 46, 2149–2158. [Google Scholar] [CrossRef] [PubMed]
  8. González, P.P.; Bautista-Capetillo, C.; Ruiz-Canales, A.; González-Trinidad, J.; Júnez-Ferreira, H.E.; Rodríguez, A.R.C.; Rovelo, C.O.R. Characterization of Scale Deposits in a Drinking Water Network in a Semi-Arid Region. Int. J. Environ. Res. Public Health 2022, 19, 3257. [Google Scholar] [CrossRef]
  9. Tut Haklidir, F.; Haklidir, M. Fuzzy Control of Calcium Carbonate and Silica Scales in Geothermal Systems. Geothermics 2017, 70, 230–238. [Google Scholar] [CrossRef]
  10. Alahmad, M. Factors Affecting Scale Formation in Sea Water Environments—An Experimental Approach. Chem. Eng. Technol. 2008, 31, 149–156. [Google Scholar] [CrossRef]
  11. Li, G.; Su, Y.; Wu, B.; Han, G.; Yu, J.; Yang, M.; Shi, B. Initial Formation and Accumulation of Manganese Deposits in Drinking Water Pipes: Investigating the Role of Microbial-Mediated Processes. Environ. Sci. Technol. 2022, 56, 5497–5507. [Google Scholar] [CrossRef] [PubMed]
  12. Torvinen, E.; Suomalainen, S.; Lehtola, M.J.; Miettinen, I.T.; Zacheus, O.; Paulin, L.; Katila, M.-L.; Martikainen, P.J. Mycobacteria in Water and Loose Deposits of Drinking Water Distribution Systems in Finland. Appl. Environ. Microbiol. 2004, 70, 1973–1981. [Google Scholar] [CrossRef] [PubMed]
  13. Zhang, Y.; Hou, H.; Qiu, M.; Zhou, L. Control of Loose Deposits in a Simulated Drinking Water Distribution System Using Ultrafiltration. Water 2023, 15, 2210. [Google Scholar] [CrossRef]
  14. Ma, X.; Li, G.; Yu, Y.; Chen, R.; Zhang, Y.; Tao, H.; Zhang, G.; Shi, B. Spatial Variation of Loose Deposit Characteristics in a 40 Km Long Operational Drinking Water Distribution System. Environ. Sci. Water Res. Technol. 2019, 5, 1689–1698. [Google Scholar] [CrossRef]
  15. Hafid, N.; Ben-Aazza, S.; Hadfi, A.; Ezahri, M.; Driouiche, A. Characterization of Scale Formed in Drinking Water and Hot Water Pipes in the Taliouine Downtown—Morocco. Am. J. Anal. Chem. 2015, 6, 677–686. [Google Scholar] [CrossRef]
  16. Belattar, M.; Hadfi, A.; Said, B.; Mohareb, S.; Hafid, N. Characterization of Scale Deposits Formed in Sanitary Hot Water Pipelines in the Northern Tourist Zone of Agadir City. Mediterr. J. Chem. 2018, 7, 86–92. [Google Scholar] [CrossRef]
  17. Touati, K.; Alia, E.; Zendah, H.; Elfil, H.; Hannachi, A. Sand Filters Scaling by Calcium Carbonate Precipitation during Groundwater Reverse Osmosis Desalination. Desalination 2018, 430, 24–32. [Google Scholar] [CrossRef]
  18. Tavanpour, N.; Noshadi, M.; Tavanpour, N. Scale Formation and Corrosion of Drinking Water Pipes: A Case Study of Drinking Water Distribution System of Shiraz City. Mod. Appl. Sci. 2016, 10, 166–177. [Google Scholar] [CrossRef]
  19. Mahmoud, B.; Yosra, M.; Nadia, A. Effects of Magnetic Treatment on Scaling Power of Hard Waters. Sep. Purif. Technol. 2016, 171, 88–92. [Google Scholar] [CrossRef]
  20. Dobersek, D.; Goricanec, D. An Experimentally Evaluated Magnetic Device’s Efficiency for Water-Scale Reduction on Electric Heaters. Energy 2014, 77, 271–278. [Google Scholar] [CrossRef]
  21. Belattar, M.; Hadfi, A.; Ben-Aazza, S.; Mohareb, S.; Karmal, I.; Hafid, N.; Driouiche, A. Kinetic Study of the Scaling Power of Sanitary Water in the Tourist Area of Agadir. Mater. Today Proc. 2020, 22, 61–63. [Google Scholar] [CrossRef]
  22. Yanagisawa, N. Case Study of Calcium Carbonate Scale at EGS and Hot Spring Binary System. In Proceedings of the World Geothermal Congress, Melbourne, Australia, 19–25 April 2015; pp. 1–5. [Google Scholar]
  23. Peng, C.-Y.; Korshin, G. V Speciation of Trace Inorganic Contaminants in Corrosion Scales and Deposits Formed in Drinking Water Distribution Systems. Water Res. 2011, 45, 5553–5563. [Google Scholar] [CrossRef] [PubMed]
  24. Zhou, X.; Kosaka, K.; Nakanishi, T.; Welfringer, T.; Itoh, S. Manganese Accumulation on Pipe Surface in Chlorinated Drinking Water Distribution System: Contributions of Physical and Chemical Pathways. Water Res. 2020, 184, 116201. [Google Scholar] [CrossRef] [PubMed]
  25. Dickinson, W.H.; Wiatr, C. Manganese-Related Corrosion and Fouling in Water Systems. Analyst 2013, 20, 20–35. [Google Scholar]
  26. Gerke, T.L.; Little, B.J. Manganese. In Encyclopedia of Geochemistry: A Comprehensive Reference Source on the Chemistry of the Earth; White, W.M., Ed.; Springer International Publishing: Cham, Switzerland, 2018; pp. 864–867. ISBN 978-3-319-39312-4. [Google Scholar]
  27. Kousa, A.; Komulainen, H.; Hatakka, T.; Backman, B.; Hartikainen, S. Variation in Groundwater Manganese in Finland. Environ. Geochem. Health 2021, 43, 1193–1211. [Google Scholar] [CrossRef] [PubMed]
  28. Rusydi, A.; Onodera, S.-I.; Saito, M.; Ioka, S.; Maria, R.; Ridwansyah, I.; Delinom, R. Vulnerability of Groundwater to Iron and Manganese Contamination in the Coastal Alluvial Plain of a Developing Indonesian City. SN Appl. Sci. 2021, 3, 1–12. [Google Scholar] [CrossRef]
  29. Hou, Q.; Zhang, Q.; Huang, G.; Liu, C.; Zhang, Y. Elevated Manganese Concentrations in Shallow Groundwater of Various Aquifers in a Rapidly Urbanized Delta, South China. Sci. Total Environ. 2020, 701, 134777. [Google Scholar] [CrossRef] [PubMed]
  30. De Joode, B.V.W.; Barbeau, B.; Bouchard, M.F.; Mora, A.M.; Skytt, Å.; Córdoba, L.; Quesada, R.; Lundh, T.; Lindh, C.H.; Mergler, D. Manganese Concentrations in Drinking Water from Villages near Banana Plantations with Aerial Mancozeb Spraying in Costa Rica: Results from the Infants’ Environmental Health Study (ISA). Environ. Pollut. 2016, 215, 247–257. [Google Scholar] [CrossRef] [PubMed]
  31. Khan, K.; Factor-Litvak, P.; Wasserman, G.A.; Liu, X.; Ahmed, E.; Parvez, F.; Slavkovich, V.; Levy, D.; Mey, J.; van Geen, A. Manganese Exposure from Drinking Water and Children’s Classroom Behavior in Bangladesh. Environ. Health Perspect. 2011, 119, 1501–1506. [Google Scholar] [CrossRef]
  32. Thakur, D.; Sharma, A.; Goel, P.; Thakur, A.; Raturi, M. Groundwater Quality Assessment in the Alluvial Region of Upper Yamuna Basin, India. Groundw. Sustain. Dev. 2023, 22, 100969. [Google Scholar] [CrossRef]
  33. Gillispie, E.C.; Austin, R.E.; Rivera, N.A.; Bolich, R.; Duckworth, O.W.; Bradley, P.; Amoozegar, A.; Hesterberg, D.; Polizzotto, M.L. Soil Weathering as an Engine for Manganese Contamination of Well Water. Environ. Sci. Technol. 2016, 50, 9963–9971. [Google Scholar] [CrossRef] [PubMed]
  34. Sly, L.I.; Hodgkinson, M.C.; Arunpairojana, V. Deposition of Manganese in a Drinking Water Distribution System. Appl. Environ. Microbiol. 1990, 56, 628–639. [Google Scholar] [CrossRef] [PubMed]
  35. Cerrato, J.M.; Reyes, L.P.; Alvarado, C.N.; Dietrich, A.M. Effect of PVC and Iron Materials on Mn(II) Deposition in Drinking Water Distribution Systems. Water Res. 2006, 40, 2720–2726. [Google Scholar] [CrossRef] [PubMed]
  36. Spiro, T.G.; Bargar, J.R.; Sposito, G.; Tebo, B.M. Bacteriogenic Manganese Oxides. Acc. Chem. Res. 2010, 43, 2–9. [Google Scholar] [CrossRef] [PubMed]
  37. Watanabe, J.; Tani, Y.; Miyata, N.; Seyama, H.; Mitsunobu, S.; Naitou, H. Concurrent Sorption of As(V) and Mn(II) during Biogenic Manganese Oxide Formation. Chem. Geol. 2012, 306–307, 123–128. [Google Scholar] [CrossRef]
  38. Center of Data and Information Technology Kinerja BUMD Air Minum (Regional Drinking Water Enterprise Performance) (In Indonesian Language). Available online: https://data.pu.go.id/visualisasi/kinerja-bumd-air-minum (accessed on 30 June 2024).
  39. Intani, D.; Suripin; Suharyanto; Soetrisno, Y.A.A. Multi Criteria Decision Making for Integrated Assessment of Indonesian Water Company. J. Adv. Res. Dyn. Control Syst. 2020, 12, 1050–1060. [Google Scholar] [CrossRef] [PubMed]
  40. Sutrisno, E. Air Sebagai Prioritas Utama Pembangunan Di Indonesia (Water Is the Main Development Priority in Indonesia) (In Bahasa Indonesia). Available online: https://indonesia.go.id/kategori/editorial/7000/air-sebagai-prioritas-utama-pembangunan-di-indonesia?lang=1 (accessed on 28 April 2024).
  41. Directorate of Drinking Water Kinerja BUMD Air Minum 2022 (Regional Drinking Water Enterprise Performance 2022) (In Bahasa Indonesia); Jakarta. 2023. Available online: https://www.perpamsi.or.id/publikasi/buku (accessed on 30 June 2024).
  42. Liu, G.; Zhang, Y.; Knibbe, W.-J.; Feng, C.; Liu, W.; Medema, G.; van der Meer, W. Potential Impacts of Changing Supply-Water Quality on Drinking Water Distribution: A Review. Water Res. 2017, 116, 135–148. [Google Scholar] [CrossRef]
  43. Prasetiawan, T.; Nastiti, A.; Muntalif, B.S. ‘Bad’ Piped Water and Other Perceptual Drivers of Bottled Water Consumption in Indonesia. WIREs Water 2017, 4, e1219. [Google Scholar] [CrossRef]
  44. Statistics of Surakarta Municipality Kota Surakarta Dalam Angka (Surakarta Municipality in Figure) 2023 (In Bahasa Indonesia); Surakarta. 2023. Available online: https://surakartakota.bps.go.id/publication/2023/02/28/8da64ce70793fbb9886e147f/kota-surakarta-dalam-angka-2023.html (accessed on 30 June 2024).
  45. Puslitbang Geologi Peta Geologi Lembar Surakarta—Giritontro, Jawa. Available online: https://geologi.esdm.go.id/geomap/pages/preview/peta-geologi-lembar-yogyakarta-jawa (accessed on 11 May 2023).
  46. Patriadi, A.; Soemitro, R.A.A.; Warnana, D.D. Preliminary Assessment to Sediment Evaluation On The Estuary of Bengawan Solo River. In Proceedings of the International Conference on Problematic Soils and Ground Improvement (Soft Soils 2016), Bandung, Indonesia, 27–28 September 2016; pp. X1-1–X1-4. [Google Scholar]
  47. PDAM Surakarta Rencana Bisnis 2020–2024 Perumda Air Minum Kora Surakarta (Business Plan 2020–2024 of Surakarta Municipal Water Supply) (In Bahasa Indonesia); Surakarta, 2020.
  48. Gholizadeh, A.; Mokhtari, M.; Naimi, N.; Shiravand, B.; Ehrampoush, M.; Miri, M.; Ebrahimi, A. Assessment of Corrosion and Scaling Potential in Groundwater Resources; a Case Study of Yazd-Ardakan Plain, Iran. Groundw. Sustain. Dev. 2017, 5, 59–65. [Google Scholar] [CrossRef]
  49. El Baroudi, H.; Ouazzani, C.; Moustaghfir, A.; Er-ramly, A.; El Baroudi, Y.; Dami, A.; Balouch, L. Assessing the Corrosion and Scaling Potential of Drinking Water in Morocco Using Water Stability Indices. Ecol. Eng. Environ. Technol. 2024, 25, 130–139. [Google Scholar] [CrossRef]
  50. Ministry of Health Ministry of Health Decree Number 2 Regarding Regulations on Implementing Government Regulation Number 66 of 2014 Concerning Environmental Health; Indonesia. 2023. Available online: https://peraturan.bpk.go.id/Details/245563/permenkes-no-2-tahun-2023 (accessed on 30 June 2024).
  51. World Health Organization. Hardness in Drinking-Water: Background Document for Development of WHO Guidelines for Drinking-Water Quality. Available online: https://iris.who.int/bitstream/handle/10665/70168/WHO_HSE_WSH_10.01_10_Rev1_eng.pdf (accessed on 23 May 2024).
  52. Mulato. After Being Shut Down Twice Due to Waste Exposure, the Semanggi Water Treatment Plant (IPA Semanggi) Has Been Reoperated. (In Bahasa Indonesia). Radio Republik Indonesia. 2024. Available online: https://www.rri.co.id/daerah/707415/sempat-2-kali-off-terpapar-limbah-ipa-semanggi-dioperasikan-kembali (accessed on 30 June 2024).
  53. Zhang, S.; Tian, Y.; Guo, Y.; Shan, J.; Liu, R. Manganese Release from Corrosion Products of Cast Iron Pipes in Drinking Water Distribution Systems: Effect of Water Temperature, PH, Alkalinity, SO42− Concentration and Disinfectants. Chemosphere 2021, 262, 127904. [Google Scholar] [CrossRef]
  54. Khan, M.; Fadzil, F.; Eva, H.; Nazaruddin, D.; Shah, Z. Significance of Silica Analysis in Groundwater Studies of Domestic Shallow Wells in Parts of Jeli District, Kelantan, Malaysia. In Water Resources in Arid Areas: The Way Forward; Springer: Berlin/Heidelberg, Germany, 2017; pp. 103–114. ISBN 978-3-319-51856-5. [Google Scholar]
  55. World Health Organization. Lead in Drinking Water: Background Document for Development of WHO Guidelines for Drinking-Water Quality. Available online: https://cdn.who.int/media/docs/default-source/wash-documents/wash-chemicals/lead-background-feb17.pdf?sfvrsn=fc50727b_4 (accessed on 23 May 2024).
  56. Levallois, P.; Barn, P.; Valcke, M.; Gauvin, D.; Kosatsky, T. Public Health Consequences of Lead in Drinking Water. Curr. Environ. Health Rep. 2018, 5, 255–262. [Google Scholar] [CrossRef] [PubMed]
  57. Zhou, H.; Fu, C. Manganese-Oxidizing Microbes and Biogenic Manganese Oxides: Characterization, Mn(II) Oxidation Mechanism and Environmental Relevance. Rev. Environ. Sci. Bio/Technol. 2020, 19, 489–507. [Google Scholar] [CrossRef]
  58. Li, G.; Chen, Q.; Zhou, Y.; Su, Y.; Wu, B.; Yu, J.; Yang, M.; Shi, B. Manganese and Iron Oxides on Pipe Surface Promote Dissolved Aluminum Accumulation in Drinking Water Distribution Systems. Sci. Total Environ. 2024, 924, 171606. [Google Scholar] [CrossRef] [PubMed]
  59. Tian, Y.; Wei, L.; Yu, T.; Shen, H.; Zhao, W.; Chu, X. Adsorption of Cr(VI) and Cr(III) on Layered Pipe Scales and the Effects of Disinfectants in Drinking Water Distribution Systems. J. Hazard. Mater. 2024, 474, 134745. [Google Scholar] [CrossRef]
  60. Ferguson, R.J. Chapter 30—Scaling Indices: Types and Applications. In Mineral Scales and Deposits; Amjad, Z., Demadis, K.D., Eds.; Elsevier: Amsterdam, The Netherlands, 2015; pp. 721–735. ISBN 978-0-444-63228-9. [Google Scholar]
  61. Ozair, G. An Overview of Calcium Carbonate Saturation Indices as a Criterion to Protect Desalinated Water Transmission Lines from Deterioration. Nat. Environ. Pollut. Technol. 2012, 11, 203–212. [Google Scholar]
  62. Hannachi, A.; Naimi, I.; Zinoubi, R.; Elfil, H. A New Index for Scaling Assessment. In Proceedings of the IDA World Congress, Gran Canaria, Spain, 21–26 October 2007. [Google Scholar]
  63. Tobiason, J.E.; Bazilio, A.; Goodwill, J.; Mai, X.; Nguyen, C. Manganese Removal from Drinking Water Sources. Curr. Pollut. Rep. 2016, 2, 168–177. [Google Scholar] [CrossRef]
Figure 1. Maps of Surakarta.
Water 16 02275 g001
Figure 2. The sampling points across the PDAM Surakarta service area. The numbers inside the brackets indicate the number of samples. The red dashed line indicates the approximate border line between the areas supplied with groundwater (above) and river water (below) (the map was obtained from PDAM Surakarta and edited by the author).
Water 16 02275 g002
Figure 3. The water quality of different water sources: (a) TDS; (b) hardness; (c) total iron; (d) manganese. The red lines are the water quality standards in the Ministry of Health decree No. 2 Year 2023. Note: Gw: groundwater; Spw: spring water; Sw: surface water; RW: raw water; TW: treated water; cst: customers’ taps.
Water 16 02275 g003
Figure 4. The water quality changes in distribution pipes with different diameters and distances: (a) sampling points in the Banyuanyar deep well; (b) sampling points in the Karangasem deep well; (c) TDS; (d) total iron; and (e) manganese. The red lines indicate the water quality standard.
Water 16 02275 g004
Figure 5. Manganese and iron concentrations along the pipeline from water sources.
Water 16 02275 g005
Figure 6. The water quality in groundwater sources and customers’ taps: (a); TDS; (b) total iron; (c) manganese.
Water 16 02275 g006
Figure 7. The longitudinal sampling results of customers’ taps: (a) TDS; (b) total iron; (c) manganese.
Water 16 02275 g007
Figure 8. The saturation indexes: (a) LSI; (b) RSI; (c) PSI. The red lines indicate equilibrium.
Water 16 02275 g008
Figure 9. The scale samples collected from the distribution pipelines (map obtained from PDAM Surakarta and edited by the author). The numbers in the photos are sample numbers.
Water 16 02275 g009
Table 1. The transmission and distribution pipes in PDAM Surakarta.
UsagePipe TypeDiameter (mm)Length (km)
TransmissionPVC20014.50
PVC2505.25
AC30012.17
CI45029.42
CI50016.25
DCI60020.49
Sub-total98.08
DistributionPVC400.07
PVC50283.60
PVC75107.82
CI8033.29
PVC100188.53
CI12520.70
PVC15090.15
Sub-total724.16
Total822.24
Table 2. The water quality parameters and analysis methods.
ParameterUnitMethod/Analytical Device
pH-MP-6 Portable Meter; Hach Company, Loveland, CO, USA
TDSmg/L
ECµS/cm
Temperature°C
Hardnessmg/LCalmagite colorimetric methodDR900 Multiparameter Portable Colorimeter; Hach Company, Loveland, CO, USA
Total ironmg/LFerroVer® Method
Ferrous ironmg/L1,10-Phenanthroline method
Total chlorinemg/LUSEPA DPT method
Manganesemg/LPAN method (LR Mn)
Silicamg/LHeteropoly blue method
Alkalinitymg/L as
CaCO3
Digital titrationDigital Titration Kit; Hach Company, Loveland, CO, USA
Dissolved oxygen (DO)%DO Meter DO-30N; Kasahara Chemical Instruments Corp., Saitama, Japan
Ion concentrationmg/L861 Advanced Compact IC; Metrohm, Herisau, Switzerland
Table 3. The saturation indexes, equations, and the implications of the saturation indexes.
IndexEquationIndex ValueWater Condition
LSILSI = pHpHs
 If pH ≤ 9.3, use
  pHs = A + B − log[Ca2+] − log[alk]
 Else (pH > 9.3), use
  pHs = (9.3 + A + B) − (C + D)
   A = log T D S 1 10
   B = −1.12[log(°C + 273)] + 34.55
   C = log[Ca2+ + CaCO3] − 0.4
   D = log[alk as CaCO3]
LSI > 0
LSI = 0
LSI < 0
CaCO3 scale likely to be formed
CaCO3 in equilibrium
CaCO3 tends to be dissolved
RSIRSI = 2(pHs) – pHRSI < 6
6 < RSI < 7
RSI > 7
CaCO3 scale likely to be formed
CaCO3 in equilibrium
CaCO3 tends to be dissolved, corrosive
PSIPSI = 2(pHs) − pHeq
pHeq = 1.465log[alk] + 4.54
PSI < 6
PSI > 6
PSI > 8
CaCO3 scale likely to be formed
CaCO3 tends to be dissolved, corrosive
Significantly corrosive
Table 4. Water quality of different water sources.
Parameter GwGw cstSpwSpw cstSwSw cst
UnitAve.Ave.Ave.Ave.Ave.Ave.
Min–Max Min–Max Min–Max Min–Max Min–Max Min–Max
pH-7.45
7.0–8.07
7.38
7.31–7.50
7.19
7.15–7.26
7.14
7.10–7.18
7.13
6.93–7.23
7.39
7.36–7.42
Temp.°C28.25
24.70–29.30
28.51
27.30–29.47
28.51
27.30–29.47
26.93
26.80–27.10
26.90
26.40–27.53
29.01
29.00–29.03
ECµS/cm806.3
567.7–2241.0
658.9
571.9–2240.0
276.2
275.5–276.7
276.3
276–277.1
416.7
340.8–542.1
379.8
374.6–384.7
Total Cl2mg/L0.08
NA–0.50
0.02
NA–0.12
0.14
0.11–0.16
0.12
0.08–0.12
0.57
0.08–1.41
0.15
0.14–0.16
Alkalinitymg/L375.2
226.7–533.3
297.0
250.7–382.0
103.0
102.0–104.0
115.0
113.7–116.3
87.9
73.3–102.7
82.3
80.0–85.3
Silicamg/L66.0
44.0–84.0
68.0
52.0–90.0
74.0
74.0–74.0
73.0
72.0–74.0
27.0
18.0–44.0
18.5
18.0–19.0
Ferrous ironmg/L0.03
BDL–0.32
0.01
BDL–0.03
0.04
BDL–0.09
0.02
BDL–0.02
0.03
BDL–0.11
0.01
BDL–0.03
DOmg/L1.76
0.50–2.70
2.34
0.80–3.70
3.12
2.80–3.50
3.10
2.60–3.60
2.50
0.40–4.00
3.50
2.90–4.60
Note: Gw: groundwater; Spw: spring water; Sw: surface water; cst: customers’ taps; BDL: below detection limit, NA: not applicable.
Table 5. The major elements found in scale samples.
Sample Composition (%wt.)Water Source
MnFeAlSiCaZnOthers
155.2415.5113.628.172.982.442.04Gw
252.467.0416.6914.726.411.740.95Gw
350.159.5412.4917.526.571.452.27Gw
459.1511.006.6613.066.350.982.80Gw
564.574.3111.1810.207.661.330.75Gw
680.824.92ND0.777.830.065.59Gw
7a3.2963.823.1019.255.36ND5.18Gw
7b11.2158.661.7917.254.680.056.37Gw
831.2245.604.8812.093.530.192.50Gw + Sw
Note: Gw: groundwater; Sw: surface water; ND: not detected; bold letters: the highest composition.
Disclaimer/Publisher’s Note: The statements, opinions and data contained in all publications are solely those of the individual author(s) and contributor(s) and not of MDPI and/or the editor(s). MDPI and/or the editor(s) disclaim responsibility for any injury to people or property resulting from any ideas, methods, instructions or products referred to in the content.

