
The Variability of Maximum Daily Precipitation and the Underlying Circulation Conditions in Kraków, Southern Poland


Abstract
:
1. Introduction
2. Study Area and Method
3. Discussion and Results
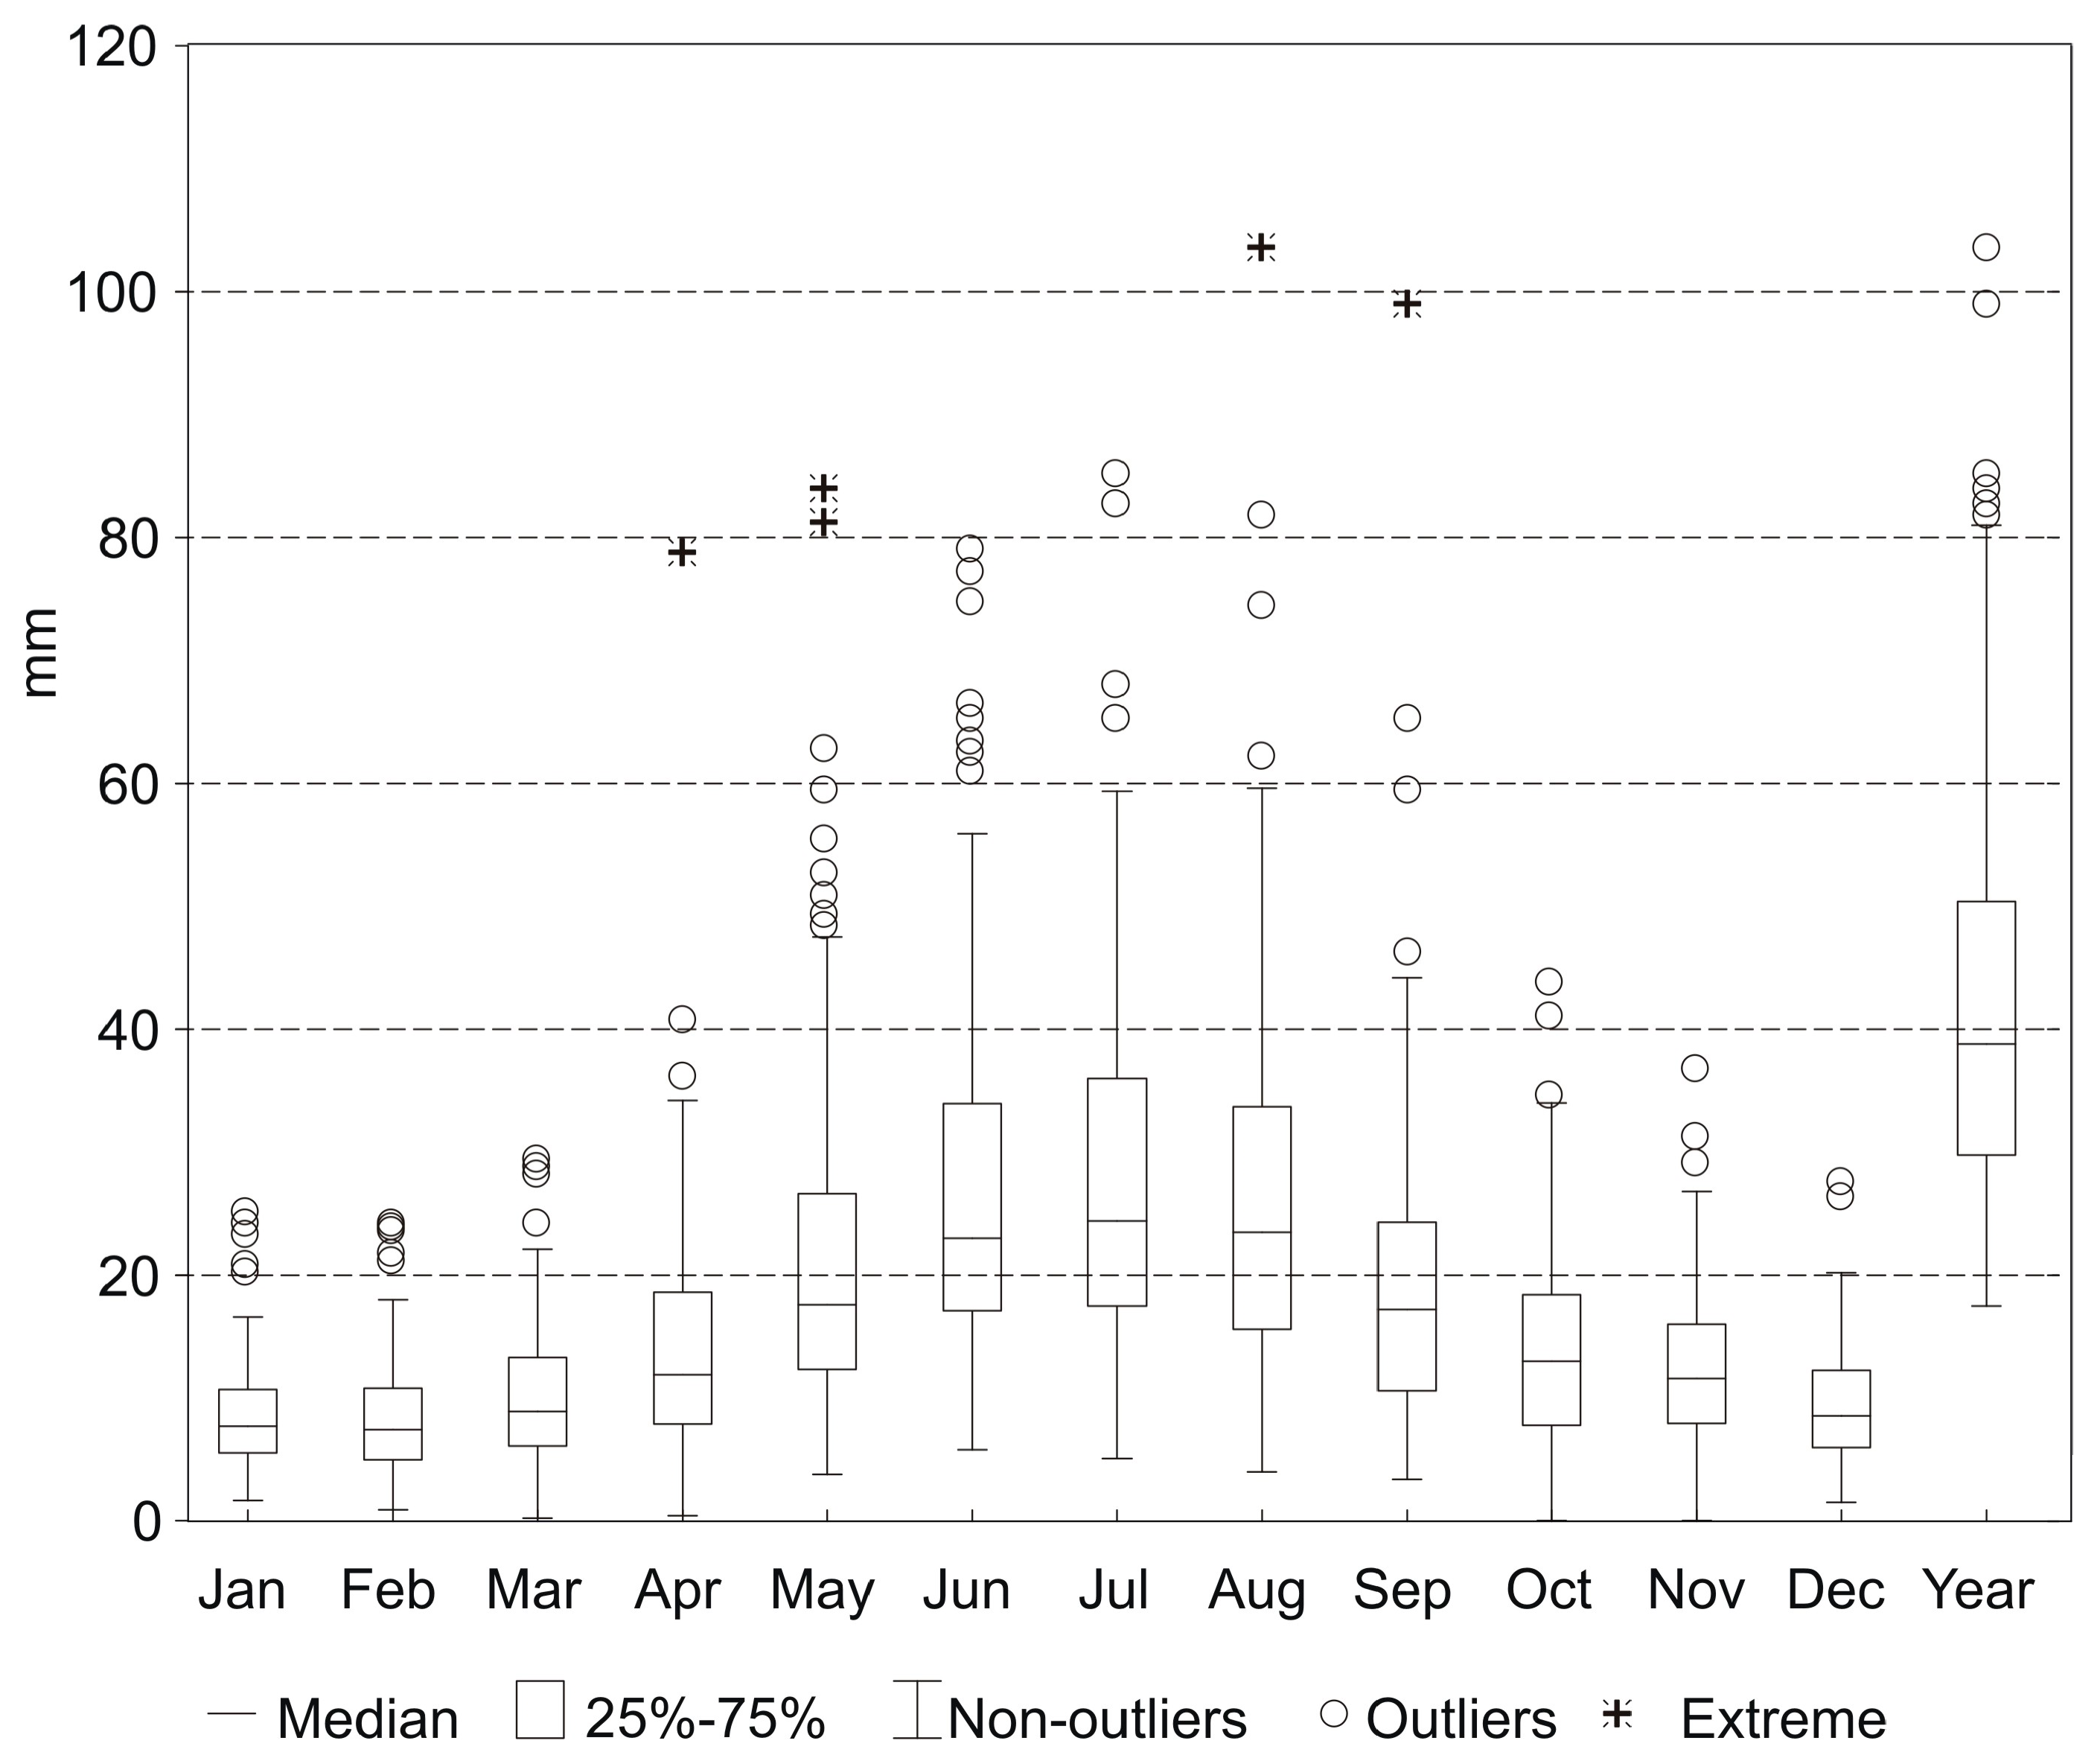
3.1. Annual and Long-Term Maxima of MMDP and AMDP
3.2. Effect of Atmospheric Circulation on the Occurrence of Precipitation Maxima (AMDP)
4. Conclusions
Author Contributions
Funding
Data Availability Statement
Acknowledgments
Conflicts of Interest
References
- Mishra, V.; Ganguly, A.R.; Nijssen, B.; Lettenmaier, D.P. Changes in observed climate extremes in global urban areas. Environ. Res. Lett. 2015, 10, 024005. [Google Scholar] [CrossRef]
- Koutsoyiannis, D. Statistics of extremes and estimation of extreme rainfall: II. Empirical investigation of long rainfall. Hydrol. Sci. J. 2004, 49, 591–610. [Google Scholar] [CrossRef]
- Twardosz, R.; Cebulska, M. Temporal variability of the highest and the lowest monthly precipitation totals in the in the Polish Carpathian Mountains (1881–2018). Theor. Appl. Climatol. 2020, 140, 327–341. [Google Scholar] [CrossRef]
- Coronado-Hernández, O.E.; Merlano-Sabalza, E.; Díaz-Vergara, Z.; Coronado-Hernández, J.R. Selection of hydrological probability distributions for extreme rainfall events in the regions of Colombia. Water 2020, 12, 1397. [Google Scholar] [CrossRef]
- Croce, P.; Formichi, P.; Landi, F. Evaluation of current trends of climatic actions in Europe based on observations and regional reanalysis. Remote Sens. 2021, 13, 2025. [Google Scholar] [CrossRef]
- Marra, F.; Levizzani, V.; Cattani, E. Changes in extreme daily precipitation over Africa: Insights from a non-asymptotic statistical approach. J. Hydrol. X 2022, 16, 100130. [Google Scholar] [CrossRef]
- Walanus, A.; Cebulska, M.; Twardosz, R. Long-term variability pattern of monthly and annual atmospheric precipitation in the Polish Carpathian Mountains and their foreland (1881–2018). Pure Appl. Geophys. 2021, 178, 633–650. [Google Scholar] [CrossRef]
- Walanus, A.; Twardosz, R.; Cebulska, M.; Płachta, A. In Search of Periodicity in the Annual Precipitation in Europe (1881–2020). Water 2022, 14, 2026. [Google Scholar] [CrossRef]
- Al-Qudah, K.A.; Smadi, A.A. Trends in maximum daily rainfall in marginal desert environment: Signs of climate change. Am. J. Environ. Sci. 2011, 7, 331–337. [Google Scholar] [CrossRef]
- Niedźwiedź, T. Heavy rainfalls in Cracow. Pr. Geogr. 1989, 75, 11–22. [Google Scholar]
- Westra, S.; Alexander, L.V.; Zwiers, F.W. Global increasing trends in annual maximum daily precipitation. J. Clim. 2013, 26, 3904–3918. [Google Scholar] [CrossRef]
- Morales, J.; García-Barrón, L.; Aguilar-Alba, M.; Sousa, A. Hazard Characterization of the Annual Maximum Daily Precipitation in the Southwestern Iberian Peninsula (1851–2021). Water 2022, 14, 1504. [Google Scholar] [CrossRef]
- Młyński, D.; Cebulska, M.; Wałęga, A. Trends, Variability, and Seasonality of Maximum Annual Daily Precipitation in the Upper Vistula Basin, Poland. Atmosphere 2018, 9, 313. [Google Scholar] [CrossRef]
- Cebulak, E. Maksymalne opady atmosferyczne w dorzeczu górnej Wisły, Zeszyty Naukowe UJ. Pr. Geogr. 1992, 90, 79–96. (In Polish) [Google Scholar]
- Stach, A. Spatial structure of maximum daily precipitation in Poland. Quaest. Geogr. 2007, 26A, 53–59. [Google Scholar]
- Halmstad, A.; Najafi, M.R.; Moradkhani, H. Analysis of precipitation extremes with the assessment of regional climate models over the Willamette River Basin-U.S. Hydrol. Process. 2012, 27, 2579–2590. [Google Scholar] [CrossRef]
- Donat, M.; Alexander, L.; Yang, H.; Durre, I.; Vose, R.; Dunn, R.; Willett, K.; Aguilar, E.; Brunet, M.; Caesar, J.; et al. Updated analyses of temperature and precipitation extreme indices since the beginning of the twentieth century: The HadEX2 dataset. J. Geophys. Res. 2013, 118, 2098–2118. [Google Scholar] [CrossRef]
- Greve, P.; Orlowsky, B.; Mueller, B.; Sheffield, J.; Reichstein, M.; Seneviratne, S.I. Global assessment of trends in wetting and drying over land. Nat. Geosci. 2014, 7, 716–721. [Google Scholar] [CrossRef]
- Fischer, E.M.; Knutti, R. Anthropogenic contribution to global occurrence of heavy-precipitation and high-temperature extremes. Nat. Clim. Chang. 2015, 5, 560–564. [Google Scholar] [CrossRef]
- Zahiri, E.P.; Bamba, I.; Famien, A.M.; Koffi, A.K.; Ochou, A.D. Mesoscale extreme rainfall events in West Africa. The cases of Niamey (Niger) and the Upper Ouémé Valley (Benin). Weather Clim. Extrem. 2016, 13, 15–34. [Google Scholar] [CrossRef]
- Irannezhad, M.; Martilla, H.; Chen, D.; Kløve, B. Century-long variability and trends in daily precipitation characteristics at three Finnish stations. Adv. Clim. Chang. Res. 2016, 7, 54–69. [Google Scholar] [CrossRef]
- Madsen, H.; Lawrance, D.; Lang, M.; Martinkova, M.; Kjeldsen, T.R. Review of trend analysis and climate change projections of extreme precipitation and floods in Europe. J. Hydrol. 2014, 519, 3634–3650. [Google Scholar] [CrossRef]
- Niedźwiedź, T. Calendar of Circulation Types for Southern Poland; Uniwersytet Śląski, Katedra Klimatologii: Sosnowiec, Poland, 2021; Available online: https://klimatologia.us.edu.pl/kalendarz-typow-cyrkulacji-calendar-of-circulation-types/ (accessed on 15 May 2021). (In Polish)
- Bokwa, A. Effects of air pollution on precipitation in Kraków (Cracow), Poland in the years 1971–2005. Theor. Appl. Climatol. 2010, 101, 289–302. [Google Scholar] [CrossRef]
- Twardosz, R.; Cebulska, M. Observations and Measurements of Precipitation in the Polish Province of Galicia in the Nineteenth Century. In The Polish Climate in the European Context: An Historical Overview; Przybylak, R., Ed.; Springer: Berlin/Heidelberg, Germany, 2010; Chapter 23; pp. 457–471. [Google Scholar]
- Twardosz, R.; Niedźwiedź, T.; Łupikasza, E. The influence of atmospheric circulation on the type of precipitation (Kraków, southern Poland). Theor. Appl. Climatol. 2011, 104, 233–250. [Google Scholar] [CrossRef]
- Piotrowicz, K.; Bielec-Bąkowska, Z.; Krzyworzeka, K. Groźne Zjawiska Meteorologiczne w Krakowie i Powiecie Krakowskim w Świetle Interwencji Straży Pożarnej i Policji; Instytut Geografii i Gospodarki Przestrzennej UJ: Kraków, Poland, 2020. (In Polish) [Google Scholar]
- Matuszko, A.; Mikołajczyk, D.; Matuszko, D. Climate change in Krakow and adaptation to it in the context of urban planning. Pr. Geogr. 2023, 170, 99–118. (In Polish) [Google Scholar] [CrossRef]
- Matuszko, D.; Piotrowicz, K. Characteristics of urban climate and the climate of Krakow. In Miasto w Badaniach Geografów; Trzepacz, P., Więcław-Michniewska, J., Brzosko-Sermak, A., Kołoś, A., Eds.; Uniwersytet Jagielloński. Instytut Geografii i Gospodarki Przestrzennej: Kraków, Poland, 2015; Volume 1, pp. 221–241. Available online: http://denali.geo.uj.edu.pl/publikacje.php?pdf=000209_t1_13¬ka= (accessed on 8 May 2023). (In Polish)
- Lorenc, H. (Ed.) Klęski Żywiołowe a Bezpieczeństwo Wewnętrzne Kraju; IMGW-PIB: Warszawa, Poland, 2012; p. 39. (In Polish) [Google Scholar]
- Available online: www.wetter3.de (accessed on 8 May 2023).
- Ulewa o nie spotykanej sile przeciągnęła nad Krakowem. Echo Krakowa, 10 September 1963; nr 212, p. 5643. (In Polish)
- Oberwanie chmury nad Krakowem. Przez całą noc straż pożarna likwidowała skutki ulewy. Gazeta Krakowska, 10 September 1963; nr 214, p. 4744. (In Polish)
- Lewińska, J. Wyjątkowy przypadek opadu burzowego na obszarze Krakowa. Gaz. Obs. PIHM Warszawa 1964, 3, 10–12. (In Polish) [Google Scholar]
- Niedźwiedź, T. Synoptic situations and their impact on the spatial diversity of selected climate elements in the Upper Vistula basin. Rozpr. Habilitacyjne UJ 1981, 58, 1–165. (In Polish) [Google Scholar]
- Niedźwiedź, T.; Łupikasza, E.; Pińskwar, I.; Kundzewicz, Z.W.; Stoffel, M.; Małarzewski, Ł. Variability of high rainfalls and related synoptic situations causing heavy floods at the northern foothills of the Tatra Mountains. Theor. Appl. Climatol. 2015, 11, 273–284. [Google Scholar] [CrossRef]
- Cebulak, E.; Limanówka, D.; Pyrc, R.; Gębica, P.; Starkel, L. Influence of selected mountain barrier for the distribution of precipitation in the Polish Carpathians. Prz. Geofiz. 2018, 1–2, 123–133. (In Polish) [Google Scholar]
- Nachlik, E.; Kundzewicz, Z.W. History of Floods on the Upper Vistula. In Flood Risk in the Upper Vistula Basin; Kundzewicz, Z., Stoffel, M., Niedźwiedź, T., Wyżga, B., Eds.; GeoPlanet: Earth and Planetary Sciences; Springer: Cham, Switzerland, 2016; pp. 279–292. [Google Scholar] [CrossRef]
- Bissolli, P.; Friedrich, K.; Rapp, J.; Ziese, M. Flooding in eastern central Europe in May 2010—Reasons, evolution and climatological assessment. Weather 2011, 66, 147–153. [Google Scholar] [CrossRef]
- Woźniak, A. Opady w 2010 roku w Karpatach Polskich na tle wielolecia 1881–2010. Pr. Geogr. 2013, 133, 35–48. (In Polish) [Google Scholar] [CrossRef]
- Woźniak, A. Precipitation in 2010 in Cracow on the background of multi-year 1863–2010. Prz. Geofiz. 2012, 3–4, 406–419. (In Polish) [Google Scholar]


| I | II | III | IV | V | VI | VII | VIII | IX | X | XI | XII | |
|---|---|---|---|---|---|---|---|---|---|---|---|---|
| Pmin | 1.6 | 0.9 | 0.2 | 0.4 | 3.8 | 5.8 | 5.1 | 4.0 | 3.4 | 0.0 | 0.0 | 1.5 |
| Year | 1894 | 1901 | 1904 | 2009 | 1930 | 1930 | 1965 | 1911 | 1941 | 1951 | 2011 | 1972 |
| Pavg | 8.6 | 8.3 | 10.2 | 14.0 | 21.5 | 26.5 | 28.0 | 26.2 | 19.1 | 14.3 | 12.1 | 9.3 |
| Pmed | 7.7 | 7.4 | 8.9 | 11.9 | 17.6 | 23.0 | 24.4 | 23.5 | 17.2 | 13.0 | 11.6 | 8.2 |
| Pmax | 25.0 | 24.0 | 29.5 | 78.8 | 83.9 | 79.0 | 85.2 | 103.4 | 99.0 | 43.8 | 36.8 | 27.4 |
| Year | 1970 | 1966 | 2004 | 1916 | 1912 | 1989 | 1970 | 2021 | 1963 | 1939 | 2009 | 1961 |
| Pmax/ΣPm | 45.5 | 30.8 | 45.7 | 53.0 | 36.4 | 31.5 | 44.6 | 43.2 | 58.7 | 34.1 | 47.5 | 40.5 |
| Pmax/ΣPy | 3.1 | 2.4 | 4.4 | 10.1 | 8.4 | 11.6 | 10.4 | 11.0 | 12.7 | 6.0 | 5.0 | 4.3 |
| Type of Circulation | Spring (N = 25) | Summer (N = 103) | Autumn (N = 20) | Year (N = 148) | |
|---|---|---|---|---|---|
| 1 | Na | 4.0 | - | - | 0.7 |
| 2 | NEa | 8.0 | - | - | 1.3 |
| 3 | Ea | - | 1.9 | - | 1.3 |
| 4 | SEa | - | - | 5.0 | 0.7 |
| 5 | Sa | - | 1.9 | - | 1.3 |
| 6 | SWa | - | - | - | - |
| 7 | Wa | - | 1.9 | - | 1.3 |
| 8 | NWa | - | 1.0 | - | 0.7 |
| 9 | Ca | - | - | - | - |
| 10 | Ka | - | 3.8 | - | 2.7 |
| 11 | Nc | 32.0 | 12.3 | 10.0 | 15.0 |
| 12 | NEc | 12.0 | 9.5 | 10.0 | 10.2 |
| 13 | Ec | 4.0 | 9.5 | 20.0 | 10.2 |
| 14 | SEc | 4.0 | 5.7 | 5.0 | 4.8 |
| 15 | Sc | 4.0 | 1.9 | - | 2.0 |
| 16 | SWc | - | 4.8 | - | 3.4 |
| 17 | Wc | 4.0 | 3.8 | 5.0 | 4.1 |
| 18 | NWc | - | 3.8 | - | 2.7 |
| 19 | Cc | - | 5.7 | 5.0 | 4.8 |
| 20 | Bc | 28.0 | 30.5 | 40.0 | 31.3 |
| 21 | X | - | 1.9 | - | 1.5 |
| 1–21 | Sum | 100 | 100 | 100 | 100 |
| 1–10 | a | 12.0 | 10.6 | 5.0 | 10.1 |
| 11–20 | c | 88.0 | 87.6 | 95.0 | 88.4 |
| Precipitation (mm) | Date of Occuration | Type of Circulation | Type of Precipitation |
|---|---|---|---|
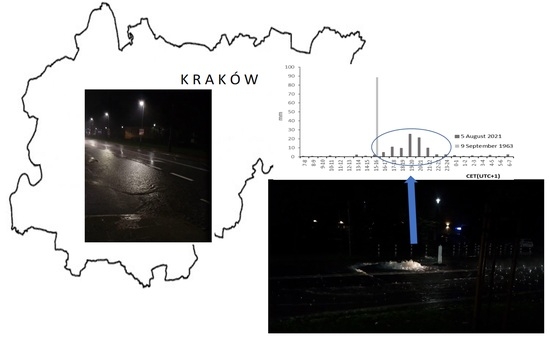
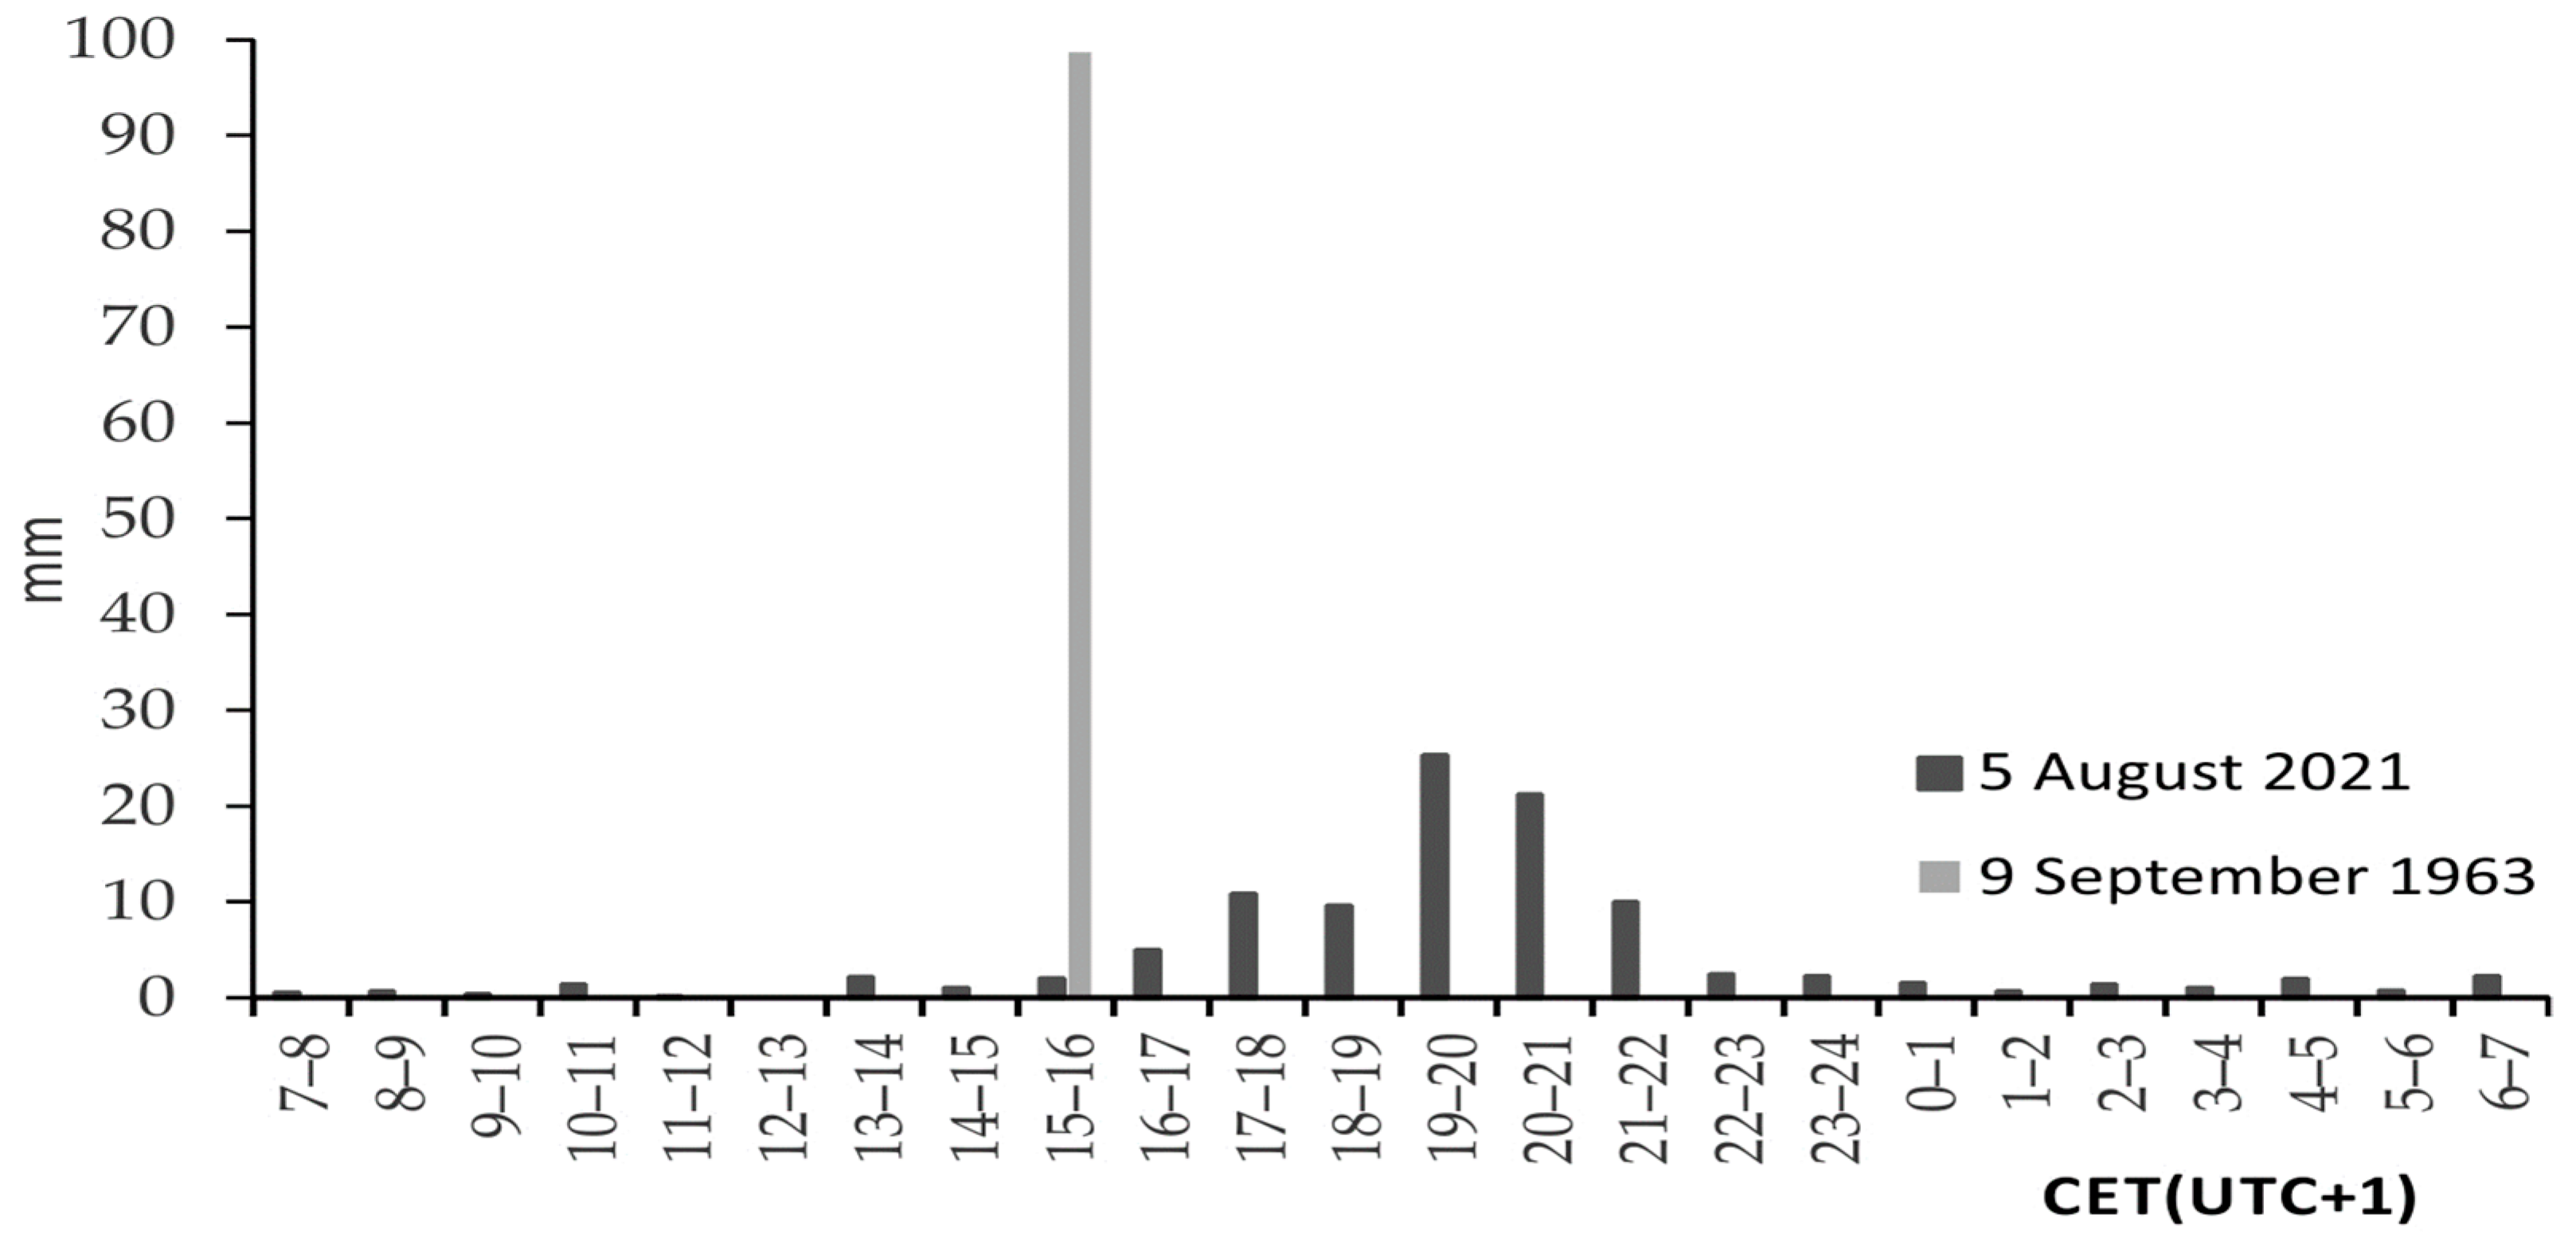
| 103.4 | 5 August 2021 | Cc | Rain |
| 99.0 | 9 September 1963 | Ec | Thunderstorm with hail (hailstorm) |
| 85.2 | 18 July 1970 | Nc | Rain |
| 83.9 | 25 May 1912 | NEc | Thunderstorm with hail (hailstorm) |
| 82.6 | 8 July 1946 | Ec | Thunderstorm with rain |
| 81.8 | 25 August 1895 | X | Thunderstorm with rain |
| 81.0 | 29 May 1966 | Nc | Rain |
| 79.0 | 24 June 1989 | Bc | Thunderstorm with hail (hailstorm) |
| 78.8 | 16 April 1916 | Nc | Rain with snow (mixed precipitation) |
| 77.1 | 23 June 1946 | Bc | Thunderstorm with rain |
| 74.8 | 19 June 1902 | Nc | Rain |
| 74.4 | 16 August 2015 | SEc | Thunderstorm with rain |
Disclaimer/Publisher’s Note: The statements, opinions and data contained in all publications are solely those of the individual author(s) and contributor(s) and not of MDPI and/or the editor(s). MDPI and/or the editor(s) disclaim responsibility for any injury to people or property resulting from any ideas, methods, instructions or products referred to in the content. |
© 2023 by the authors. Licensee MDPI, Basel, Switzerland. This article is an open access article distributed under the terms and conditions of the Creative Commons Attribution (CC BY) license (https://creativecommons.org/licenses/by/4.0/).
Share and Cite
Twardosz, R.; Cebulska, M.; Guzik, I. The Variability of Maximum Daily Precipitation and the Underlying Circulation Conditions in Kraków, Southern Poland. Water 2023, 15, 3772. https://doi.org/10.3390/w15213772
Twardosz R, Cebulska M, Guzik I. The Variability of Maximum Daily Precipitation and the Underlying Circulation Conditions in Kraków, Southern Poland. Water. 2023; 15(21):3772. https://doi.org/10.3390/w15213772
Chicago/Turabian StyleTwardosz, Robert, Marta Cebulska, and Izabela Guzik. 2023. "The Variability of Maximum Daily Precipitation and the Underlying Circulation Conditions in Kraków, Southern Poland" Water 15, no. 21: 3772. https://doi.org/10.3390/w15213772
APA StyleTwardosz, R., Cebulska, M., & Guzik, I. (2023). The Variability of Maximum Daily Precipitation and the Underlying Circulation Conditions in Kraków, Southern Poland. Water, 15(21), 3772. https://doi.org/10.3390/w15213772