Article

Water Quality Index (WQI) Analysis as an Indicator of Ecosystem Health in an Urban River Basin on Borneo Island

1
Faculty of Social Sciences and Humanities, Universiti Malaysia Sabah, Kota Kinabalu 88400, Sabah, Malaysia
2
Centre for the Promotion of Knowledge and Language Learning, Universiti Malaysia Sabah, Kota Kinabalu 88400, Sabah, Malaysia
3
Centre for Research in Development, Social and Environment (SEEDS), Faculty of Social Sciences and Humanities, Universiti Kebangsaan Malaysia, Bangi 43600, Selangor, Malaysia
*
Author to whom correspondence should be addressed.
Water 2023, 15(15), 2717; https://doi.org/10.3390/w15152717
Submission received: 14 June 2023 / Revised: 5 July 2023 / Accepted: 12 July 2023 / Published: 27 July 2023

Abstract

:
The health of the river basin is characterised by its ecosystem health to provide significant and valuable resources and services for human use and the basin itself. However, the development of urban space and the intensification of human activities surrounding the river ecosystem have greatly disturbed the river’s health, thereby impacting human and environment. Therefore, this paper seeks to assess the degree of quality and cleanliness of river water, which is one of the river basin’s health indicators. To identify the issues that affect the river’s health, water quality indicators are used. The Inanam–Likas River Basin has been chosen due to its location within an urban area. Water quality data from 2014 to 2018 were analysed using the Water Quality Index (WQI) developed by the DOE. In addition, the Mann–Kendall test is also used to observe the trend and direction of the river’s health using WQI data from 1999 to 2019. Based on the analysis, the health of the river basin is moderately polluted due to land clearing and domestic sewage activities. This is shown by the relatively high percentage frequency of contaminated levels of WQI SS and NH3-N. The health level of the river in the upper course is better than in the lower course. This is because development and human activities are more concentrated in the lower course area compared to the upper course. Although the river’s health is currently at a moderate level, the trend indicates that its health is improving.

1. Introduction

Urban rivers play an important role in maintaining the health of urban ecosystems. River basins provide significant resources [1] and are of great value to humans [2]. Urban river basins provide valuable ecosystem services, including heat reduction, flood control, recreational areas [3,4,5], small-scale or recreational fishing, sources of building materials (e.g., sand, gravel), and water for irrigation and household uses [6,7,8]. They also exhibit clear heat mitigation and cooling effects [9] and have the potential to serve as an important alternative water source [10]. Therefore, many cities worldwide are located in close proximity to or alongside rivers due to the abundance of water and the various resources they offer, such as transportation, food, and electricity [11]. The valuable ecosystem services provided by urban rivers, particularly the provision of clean water, contribute to creating liveable urban spaces and promising better lives for people. Currently, approximately 56% of the world’s population, totalling 4.4 billion inhabitants, resides in cities. This trend is projected to persist, with the urban population anticipated to more than double its current size by 2050. By that time, nearly 7 out of 10 people will be living in urban areas. Water quality poses as one of the primary challenges societies will encounter in the 21st century. It poses threats to human health, restricts food production, diminishes ecosystem functions, and hampers economic growth. The degradation of water quality directly translates into environmental, social, and economic problems [12,13,14].
Urbanisation was the main factor contributing to water quality deterioration in the urban rivers [15,16,17] making it a key contributor to what is commonly known as the “urban stream syndrome” [18]. Several studies have been conducted to assess the water quality of rivers in various cities [19]. The population growth, industrialisation, and rapid economic development in urban areas have led to major changes of natural landscapes, land use, land cover, and ecosystems [20,21,22]. Previous research demonstrated how landscape changes caused by human activities have a significant impact on rivers, particularly the alterations to water chemistry and sediment concentration [23]. Simultaneously, the expansion of urban areas leads to a rise in impervious surfaces [24,25]. The extensive and continuous process of urbanisation has altered the surface characteristics of water catchment areas, resulting in notable impacts on water quality due to heightened runoff and threats to river ecosystems [26,27]. Large quantities of pollutants are carried by storm runoff during rainfall and directly enter receiving waters [26,28]. Urban storm runoff is considered as a significant contributor to water quality impairments in the United States, affecting approximately 13% of rivers [29]. For instance, inorganic pollutants, particularly heavy metals, pose a significant threat and are projected to increase by 90% due to global warming [30,31]. Additionally, the balance of nitrogen and phosphorus has been disrupted by runoff [32]. Previous studies have highlighted the risks of runoff pollution on aquatic ecosystems [33].
Besides urban runoff, residential, industrial, and commercial, as well as recreational activities are also the main sources of water quality degradation in urban areas [34]. Urbanisation and density of settlements on the riverbank contributed to the water pollution [35]. The lack of infrastructure and the high concentration of large populations, coupled with the direct discharge of domestic pollutants into rivers, have caused a degradation of water quality in urban river sections [36,37,38]. In residential areas, the morning period exhibits the lowest dissolved oxygen (DO) concentrations and the highest values of total solids (TS), turbidity, biochemical oxygen demand (BOD), total phosphorus (TP), total nitrogen (TN), and E. coli. This pattern may reflect population habits, as the greatest generation of pollutants occurs overnight and in the early morning due to clandestine inputs of domestic wastewater into the stream [39]. The sewage treatment facilities in mega cities are seriously insufficient and too old, resulting in the untreated direct discharge of a large amount of sewage [19]. In Sub-Saharan African (SSA) cities, sewage discharges resulted in high residual nutrient levels at a concentration of 13.5 ± 2.0 mg/L in a total of 1842 kg/d for N and a concentration of 2.6 ± 0.6 mg/L in a total of 408 kg/d for P [40]. Domestic sewage and industrial wastewater are recognised as contributing factors to the deterioration of water quality in urban areas [36]. However, future projections indicate significant increases in industrial and sewage pollution in many watersheds [6], posing a threat to the long-term sustainability of services provided by urban streams [41]. The pollution of freshwater resources caused by the discharge of inadequately treated or untreated wastewater into rivers is exacerbating the limited availability of the world’s scarce water resources [13,42]. Furthermore, urbanised catchments often experience higher levels of nitrate, phosphate, sulphate, carbon, and heavy metal pollution in waterways compared to undeveloped catchments [43]. In China, land surface pollution has emerged as the primary source of river pollution after industrial pollution was brought under control [44]. Consequently, runoff, streams, and waterways frequently face pollution challenges.
In Malaysia, numerous researchers have examined the influence of urban land use on water quality in the past decade. The findings from the papers analysed in this study reveal that the primary contributors to water quality degradation in urban areas encompass a range of activities, including residential, industrial, commercial, and recreational activities. Camara et al. [34] and Sham Sani [45] found that most of the pollution in Malaysia is caused by economic development, population growth, and rapid urban development. Jamaluddin Jahi [46] also proved that the urbanisation process in Klang Valley, Malaysia, has caused severe pollution to the Klang River. River pollution occurs from waste disposal activities as well as sand and gravel extraction activities for construction purposes [47,48]. Ng et al. [49] investigated the sources of heavy metal pollution in the Langat River, which flows through the highly urbanised Klang Valley. The study found that the main sources of heavy metal pollution were industrial effluents and domestic sewage, which had been discharged into the river without proper treatment. Zakaria et al. [50] were analyzed for PAHs of twenty-nine Malaysian riverine and coastal sediments and found that Malaysian urban sediments are heavily impacted by petrogenic PAHs. The main sources of PAHs were vehicular emissions, urban runoff, and the discharge of untreated industrial and domestic effluents. Azyana and Na [51] concluded, following their study on water quality degradation in the Kinta River, that developed lands were the most reliable indicator for predicting water quality deterioration.
The high population density and increased human activities within river basins have posed significant challenges to the health of river ecosystems, particularly in terms of water quality degradation. The study of ecosystem health, especially river basins as human habitats, is always extremely relevant. The necessity to comprehend urban water quality has emerged as a crucial field of research and management within the aquatic sciences [52]. The river water quality indicator is one method used to describe the level of river basin ecosystem health [53]. It partly explains the health level of the ecosystem, according to O’Brien et al. [54] and Maliki Abdullah et al. [55]. Kruse [56] stated that the ecosystem health indicators consist of six categories: based on the abundance of selected species, based on the concentration of selected elements, based on ratios between different classes of organisms or elements, based on ecological strategies or processes, based on ecosystem composition and structure, and the system’s theoretical holistic indicators. Water quality indicators assess the concentration of selected elements. The evaluation of this indicator is based on the measurement or observation of the concentration or density of selected elements that can be related to the changes of the system.
In Malaysia, the Malaysian Department of Environment-Water Quality Index (DoE-WQI) is a water quality indicator that has been widely used by numerous researchers to describe the cleanliness and health level of rivers [57,58,59]. Although several suggestions have been made to modify this water quality indicator [60], the existing DoE-WQI model remains in use until now. Therefore, this paper applies the DoE-WQI to investigate the level of river health in the Inanam–Likas River Basin, which is located near Kota Kinabalu City, Sabah, Malaysia. The DoE-WQI results will help identify the sources of pollution and can therefore be used to facilitate the process of river conservation and preservation. Additionally, this research aims to comprehend the trends and forecast future conditions, particularly in the management of river water quality. The Inanam–Likas River was chosen as the study area due to its rapidly developing human habitat and significant impact from urban expansion, developments, and human activities.

2. Materials and Methods

2.1. Study Area

The Inanam–Likas River is in the southern part of the Kota Kinabalu district, Sabah, at the geographical position of 116°05′8″–116°13′33″ E and 5°54′53″–6°02′39″ N [61,62]. The study area experiences a hot and humid equatorial climate throughout the year with an average annual temperature of over 26 °C throughout the year. It receives an average annual rainfall of 2500 mm. The original topography of the basin varies from tidal swamps around Likas Bay, Kolombong, Inanam, and Yayasan Sabah area in the west, freshwater peat swamps and floodplains in the interior, some moderate to high hills in Telipok, and the coastal areas of Sepanggar Bay, Signal Hills, and the Bukit Likas. Mountain ranges up to 720 m run parallel along the coast that forms the background for the basin, located on the eastern side. The Inanam–Likas River Basin has 3 main river systems and flows from the eastern part of the basin to the sea near the Sabah State Government Administration Building (PKNS) located in the western part of the basin. These three river systems are the Darau River, the Inanam River, and the Likas River. It is estimated that the area of this basin is around 95,899 square kilometres [47]. It begins at the Kionsom River in Kobuni Village, which is the upper course of the river basin. The Likas River system is an almost saturated area with various developments, manufacturing, and housing areas. For the Inanam and Likas River systems, development activities are only concentrated in the lower course area. There are several towns or cities in this area: the town of Inanam, Menggatal, the newly developed Alam Mesra, and 1Borneo (Figure 1). The placement of the river basin is attractive to city planners, developers, and property owners because of its proximity to many educational institutions, residences, and companies [63]. The selection of this river basin as a study area was driven by rapid development, particularly urbanisation, and the expansion of commercial areas, industries, and residential growth in the western part of Sabah.

2.2. Sampling and Data

There are 6 stations included in the study: D1—Darau Station 1 and D2—Darau Station 2 in the sub-basin of the Darau River. I1—Inanam Station 1 and I2—Inanam Station 2 are located in the sub-basin of the Inanam River. The other two are located in the sub-basin of the Likas River: L1—Likas Station 1 and L2—Likas Station 2 (Figure 2). Raw river water quality data from 2014 to 2018 was obtained from the Malaysian Department of Environment (DoE) except D1 from 2017 to 2018. In each station, the sampling frequency was gathered five times annually between 2014 and 2017. However, it increased to six times in 2018. A total of 139 observations were made during this period (Table 1). Besides the raw water quality data, the yearly DoE-WQI data for the Likas sub-basin and Inanam sub-basin were also obtained from the Malaysia Environmental Quality Report that was published by the Department of Environment. The DoE-WQI data covered almost 20 years from 1999 to 2019.

2.3. Water Quality Index Calculation

In Malaysia, the Department of Environment (DoE) employs the DoE-Water Quality Index (DoE-WQI) and National Water Quality Standards (NWQS) to evaluate the quality status of rivers. To assess the health level of the Inanam–Likas River Basin, the WQI technique has been utilised, incorporating a combination of six parameters that the Department of Environment (DOE) uses to classify the cleanliness level of rivers. These six parameters include biochemical oxygen demand (BOD), chemical oxygen demand (COD), dissolved oxygen (DO), ammoniacal nitrogen (NH3-N), suspended solids (SS), and pH. The DoE-WQI is an official water quality index in Malaysia. It is an opinion-poll formula where a panel of experts are consulted on the choice of parameters and the weightage assigned to each parameter. Based on twenty-one different WQI models reviewed by Uddin et al. [53], the DoE-WQI is recognized as one of the eight major WQI models worldwide.
The DoE-WQI consists of three main steps. The first step involves determining the weight for each parameter by experts. The second step entails establishing the quality function through a sub-index rating curve. Lastly, the average of all calculated sub-indices is computed to obtain the final value of the DoE-WQI. The final DoE-WQI value represents the water quality and is classified based on its healthiness [68]. A total of 138 water quality readings for each parameter were examined [69,70]. The formula to acquire the DoE-WQI value (Equation (1)) and sub-index (Equation (2)), as implemented by the DOE Malaysia [71], is illustrated below:
DOE_WQI_ = 0.22 × SIDO + 0.19 × SIBOD + 0.16 × SICOD + 0.15 × SIAN +
0.16 × SISS + 0.12 × SIpH
where SIDO = sub-index for dissolved oxygen (% saturation), SIBOD = sub-index for biological oxygen demand, SICOD = sub-index for chemical oxygen demand, SIAN = sub-index for ammoniacal nitrogen, SISS = sub-index for suspended solid, and SIPH = sub-index for pH.
The best fit equations used for the estimation of the six sub-indices are shown in Equation (2):
WQI ParameterThresholds ValueBest Fitted Sub-Index Equation(2)
DO (in % saturation)for x ≤ 8
for 8 < x < 92
for x ≥ 92
SIDO = 0
SIDO = −0.395 + 0.030x2 − 0.00020x2
SIDO = 100
BODfor x ≤ 5
for x > 5
SIBOD = 100.4 − 4.23x
SIBOD = 108 × exp(−0.055x) − 0.1x
CODfor x ≤ 20
for x > 20
SICOD = −1.33x + 99.1
SICOD = 103 × exp(−0.0157x) − 0.04x
NH3-Nfor x ≤ 0.3
for 0.3 < x < 4
for x ≥ 4
SIAN = 1005 − 105x
SIAN = 94 × exp(−0.573x) − 5 × |x − 2|
SIAN = 0
SSfor x ≤ 100
for 100 < x < 1000
for x ≥ 1000
SISS = 97.5 × exp(−0.00676x) + 0.05x
SISS = 71 × exp(−0.0016x) − 0.015x
SISS = 0
pHfor x < 5.5
for 5.5 ≤ x < 7
for 7 ≤ x < 8.75
for x ≥ 8.75
SIpH = 17.2 − 17.2x + 5.02x2
SIpH = −242 + 95.5x − 6.67x2
SIpH = −181 + 82.4x − 6.05x2
SIpH = 536 − 77.0x + 2.76x2
where x is the concentration in mg/L for all parameters except pH. Source: Uddin et al. [53]; DoE [71].
The results of these six parameters produce a value between 0 and 100 that will then be used to identify the health level of the basin’s ecosystem. The water quality for each parameter (i) is given in the form of a sub-index value that implies the importance of the parameter. The parameters are selected based on their importance and assigned weightings through opinion polls conducted among a panel of consulted experts [71]. The value of this sub-index is also given a value between 0 to 100 where a value of 0 is considered the most polluted river water quality level, while a value of 100 is considered the cleanest water quality level. The sub-index value is given a weighting value according to the importance and then combined with other parameters [72,73]. The designated weight represents the importance of a water quality indicator for a certain application and has a significant effect on the overall water quality index (WQI) for a specific river [74]. Typically, water quality specialists employ these weights in public opinion surveys [75]. The resulting index value will determine the level of cleanliness of the river. If the index shows a value between 81 and 100, the river’s health level is very good and is categorised as clean. If the value is between 60 and 80, the level is moderate and is categorised as slightly polluted. If the value is less than 60, then the level is unhealthy and is categorised as highly polluted. The classification of the river cleanliness level is presented in Table 2. Each observation is converted to WQI value and sub-index.

2.4. Analysis

Two analytical methods were employed: frequency analysis and trend analysis. The frequency analysis was used to analyse the pattern of Water Quality Index (WQI) across different stations. The sub-indices for BOD, NH3-N, and SS, along with the corresponding WQI values, were classified based on the WQI and sub-index classification presented in Table 1. The calculation and classification of WQI were conducted using Microsoft Excel software. The WQI frequencies were transformed into percentages and visualised using a bar chart. For trend analysis, the Mann–Kendall test and Sen’s estimator of slope techniques were employed. The MAKESENS 1.0 software, developed by the Finnish Meteorological Institute, Finland [76], was utilised to perform this analysis. Several researchers, including Hashim et al. [77], Sakke et al. [78], Ahmadi et al. [79], Mustapha [80], and Tabari et al. [81], have utilised this software in hydrological studies.
The Mann–Kendall test is a non-parametric test used to analyse trends in time series data [79]. This test utilises a Z-test statistic to identify trends. A positive Z value indicates an increasing trend, whereas a negative Z value signifies a decreasing trend. The formula for the Z-test statistic used in this article is presented in Equation (3):
Z = S 1 V A R S                             i f   S > 0 Z = 0                                                               i f   S = 0 Z = S + 1 V A R ( S )                             i f   S < 0
where VAR(S) is a variance of the Mann–Kendall test statistic S. The S variance can be calculated using Equation (4):
V A R = 1 18 n n 1 2 n + 5 p = 1 q t p ( t p 1 ) ( 2 t p + 5 )
where q is the number of tied groups and tp is the number of data values in the pth group.
Furthermore, the magnitude of the increase or decrease in the water quality trend is determined using Sen’s estimator of slope [82]. The formula for Sen’s estimator of slope, as applied in this article, is presented in Equation (5) by calculating the slope of all pairs of data values [76]:
Q = x j x k j k
where j > k.
If there are n values xj in the time series, we get as many as N = n(n − 1)/2 slope estimates Qi. The Sen’s estimator of slope is the median of these N values of Qi. The N values of Q are ranked from the smallest to the largest and the Sen’s estimator is:
Q = Q [ ( N + 1 ) / 2 ]           i f   N   i s   o d d
or
Q = 1 2 ( Q [ N / 2 ] + Q [ ( N + 2 ) / 2 ] )           i f   N   i s   e v e n

3. Results

3.1. Pattern of the DoE-WQI

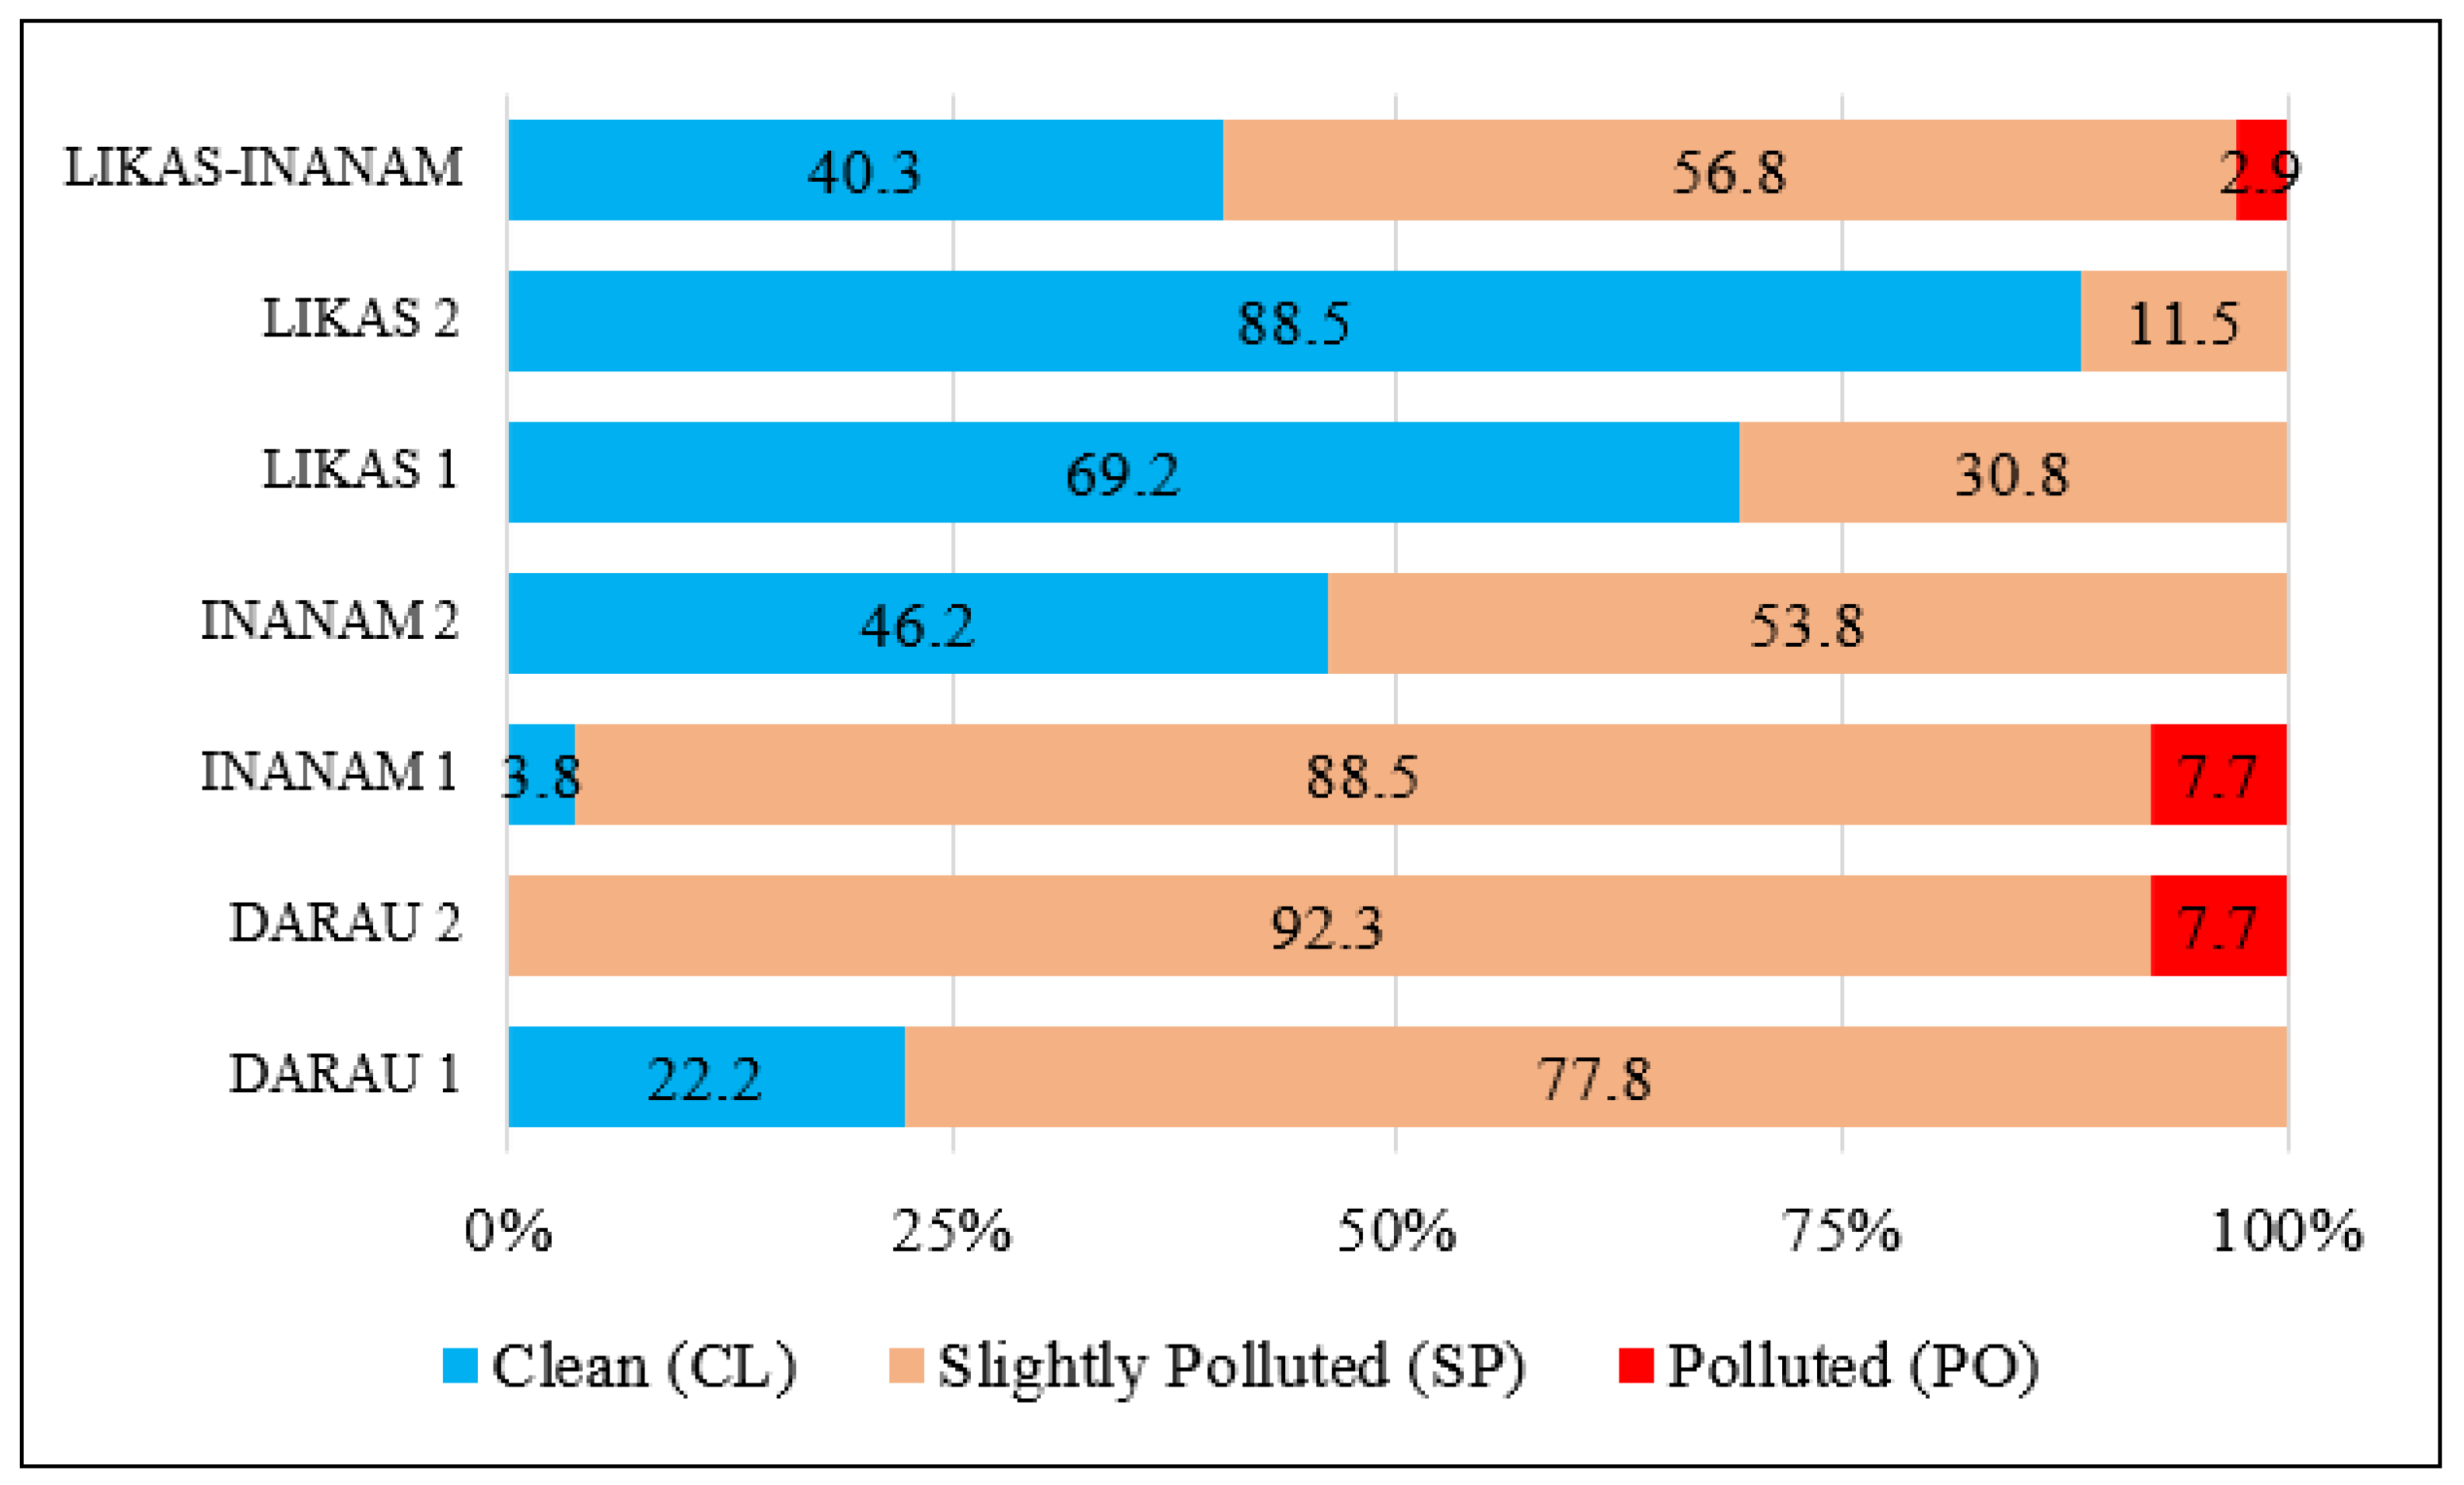
Based on the data pattern, the recorded DoE-WQI values ranged from 52.3 to 94.5 with a standard deviation value of around 9.6, while the average (median) recorded is around 77.9 (77.3). This value shows that the overall water quality status is at a slightly polluted level (Table 3). The analysis outcomes of DoE-WQI revealed that more than half of the total number of observations in the Inanam–Likas River Basin show that the river’s cleanliness status is at a contaminated level. The pollution level revealed that 56.8 percent is categorised as slightly polluted (SP), while 2.9 percent is categorised as polluted (PO). The rest, which is 40.3 percent, is at the clean level (CL). More specifically, based on the sub-basins, Likas Station 2 exhibits the best WQI status (CL = 88.5%, SP = 11.5%). This is followed by Likas Station 1 (CL = 69.2%, SP = 30.8%) and Inanam Station 2 (CL = 46.2%, SP = 53.8%). Darau Station 2 shows the worst WQI status among all observation stations in the study area (SP = 92.3%, PO = 7.7%), as illustrated in Figure 3. This frequency pattern parallels to the average (median) value which was recorded. Darau 2 was the lowest DoE-WQI 69.2 (69.1) and Likas Station 2 was the highest DoE-WQI 87.0 (89.4).
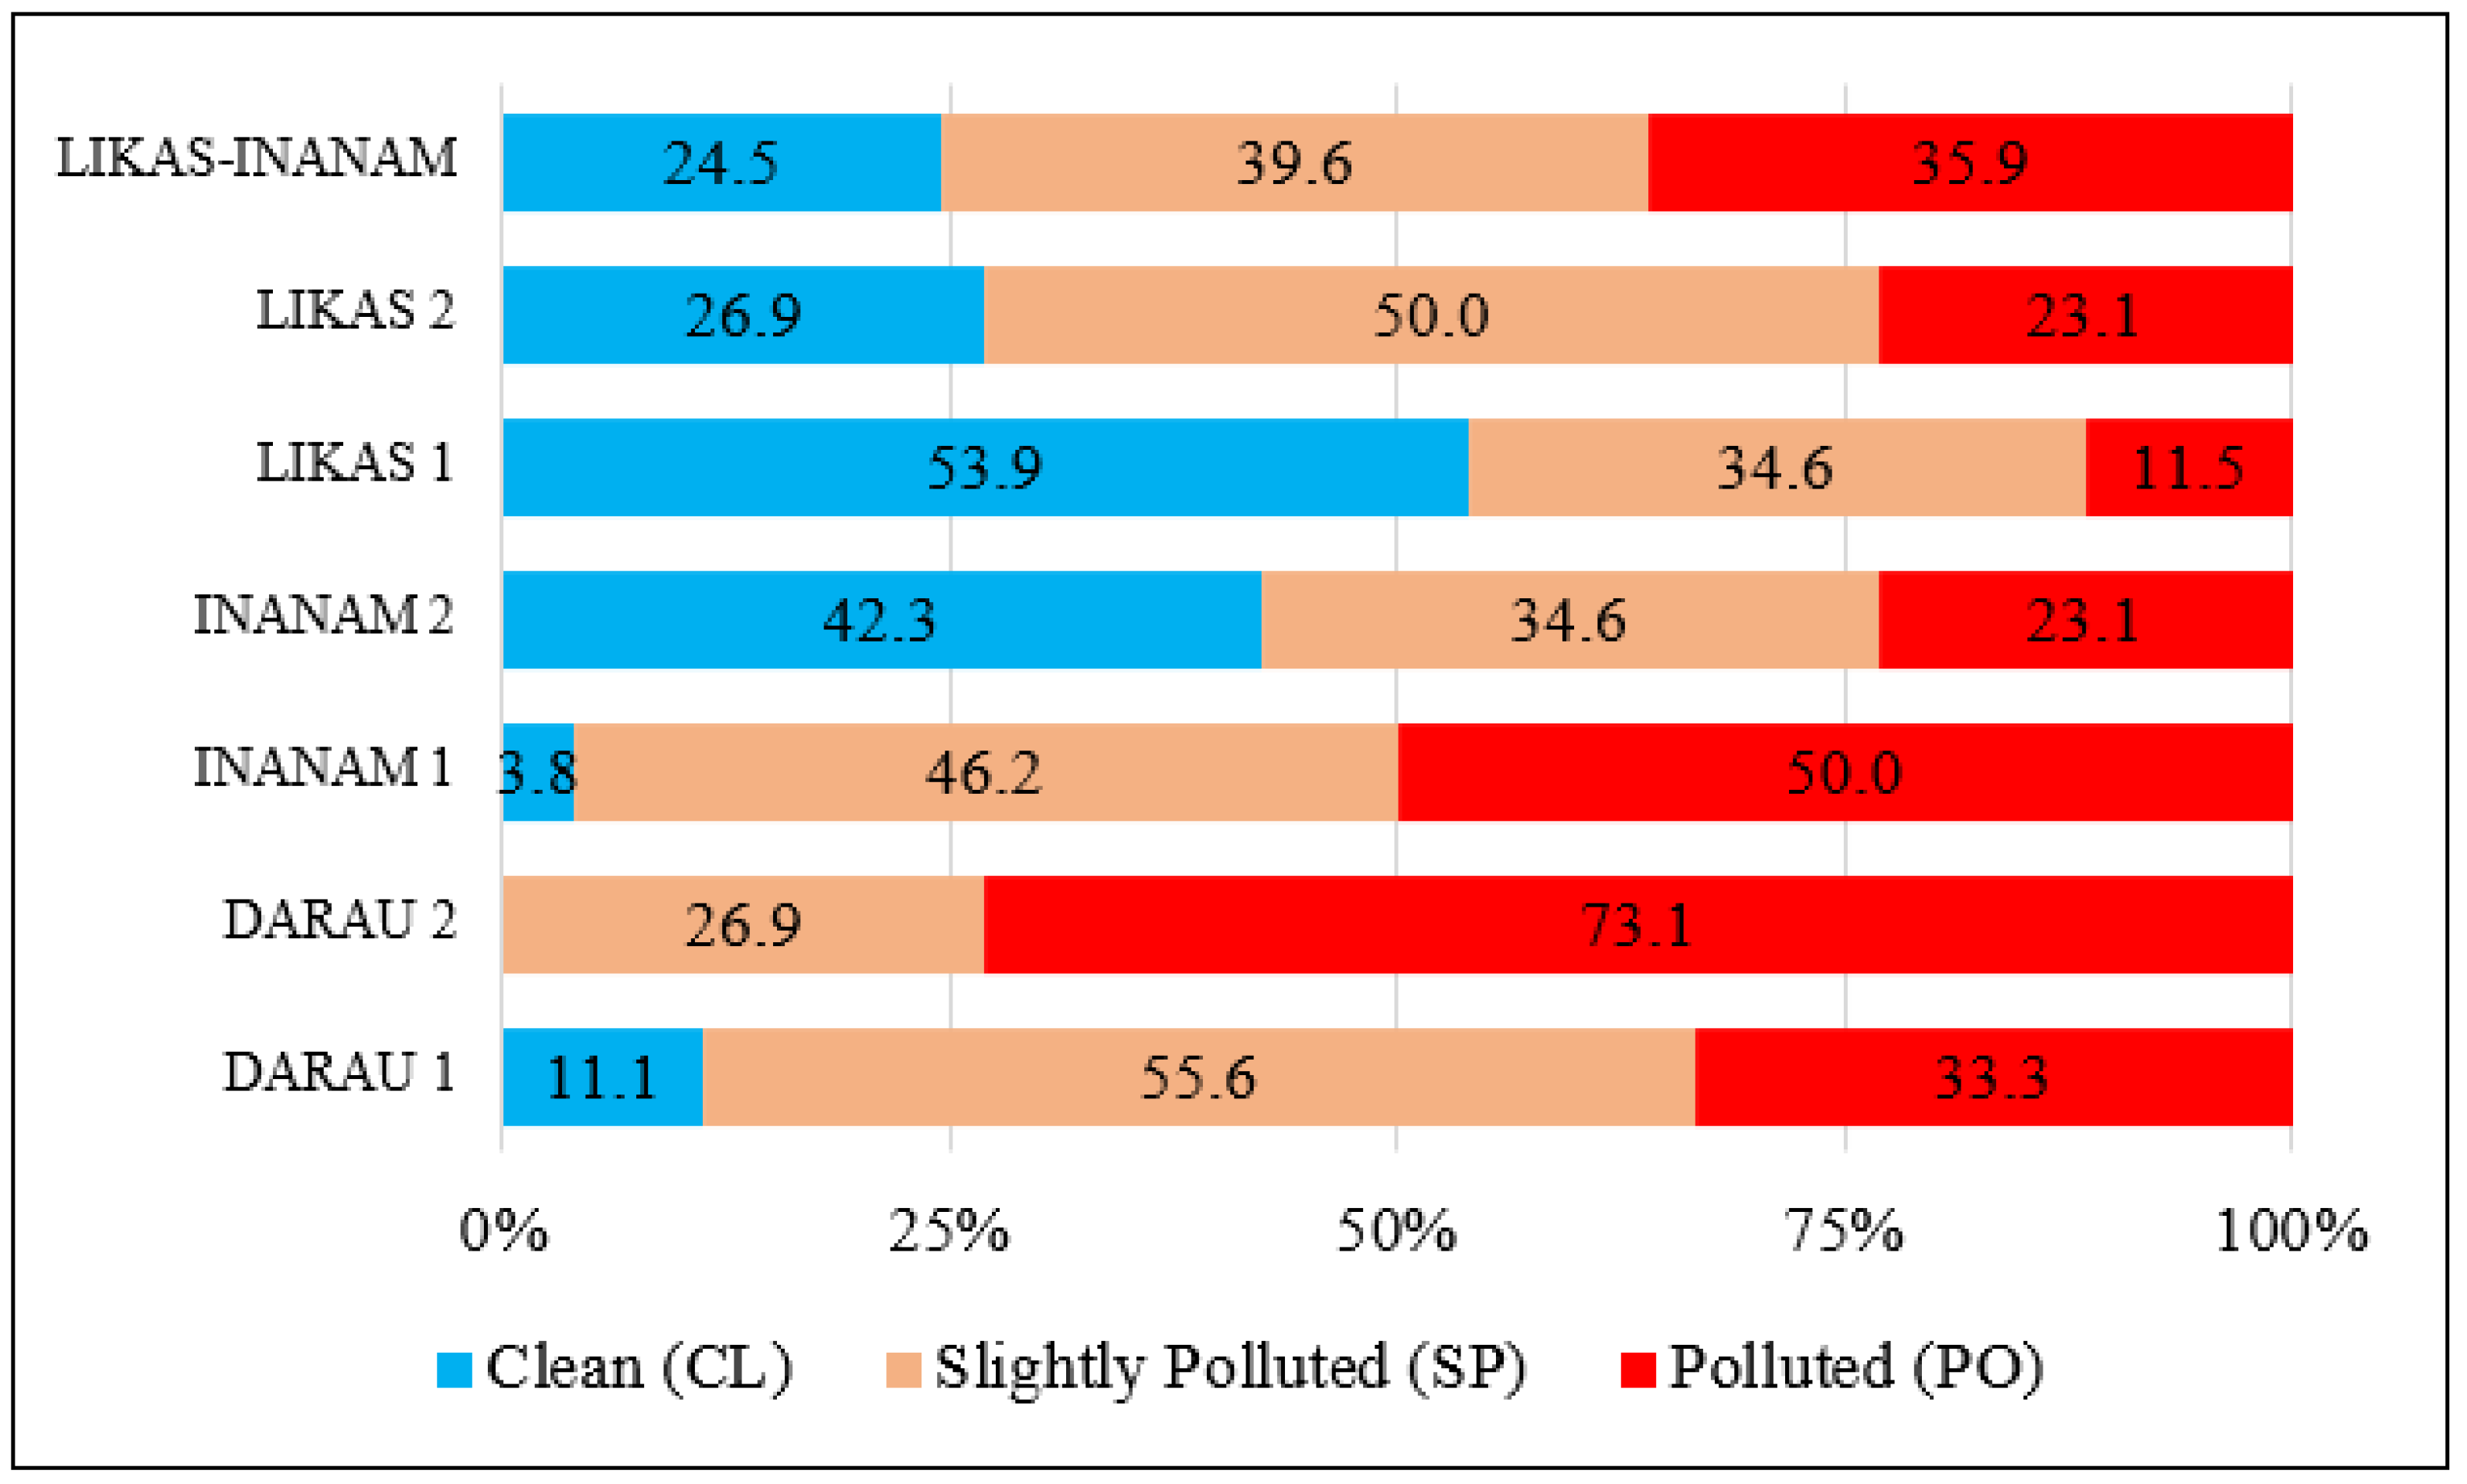
BOD measures the amount of oxygen required by aerobic bacteria and microorganisms to oxidise organic matter to stable inorganic forms in a body of water. Based on the DOE-WQI, the range of BOD values recorded in the study is between 34.0 and 96.6. The highest reading values are recorded at Likas Station 1 and Likas Station 2, while the lowest are at Inanam 1, with the average of around 77.0 (Table 4). It shows that the level of pollution in the Inanam–Likas River Basin is high. Around 75.5 percent of the total number of observations are contaminated, as shown in Figure 4. From this total percentage, 39.6 percent is slightly polluted while the rest (35.9%) is polluted. Only 24.5 percent of the river is considered clean. Based on the sub-basin, Darau Station 2 has the worst river cleanliness level (SP = 26.9%, PO = 73.1%) as compared to the other stations. Inanam Station 1 has the second worst river status (CL = 3.8%, SP = 46.2%, PO = 50.0%). Among all stations, Likas Station 1 has the best river cleanliness status in terms of BOD parameters (CL = 53.9%, SP = 34.6%, PO = 11.5%). This is followed by Inanam Station 2 (CL = 42.3%, SP = 34.6%, PO = 23.1%) and Likas Station 2 (CL = 26.9%, SP = 50.0%, PO = 23.1%).
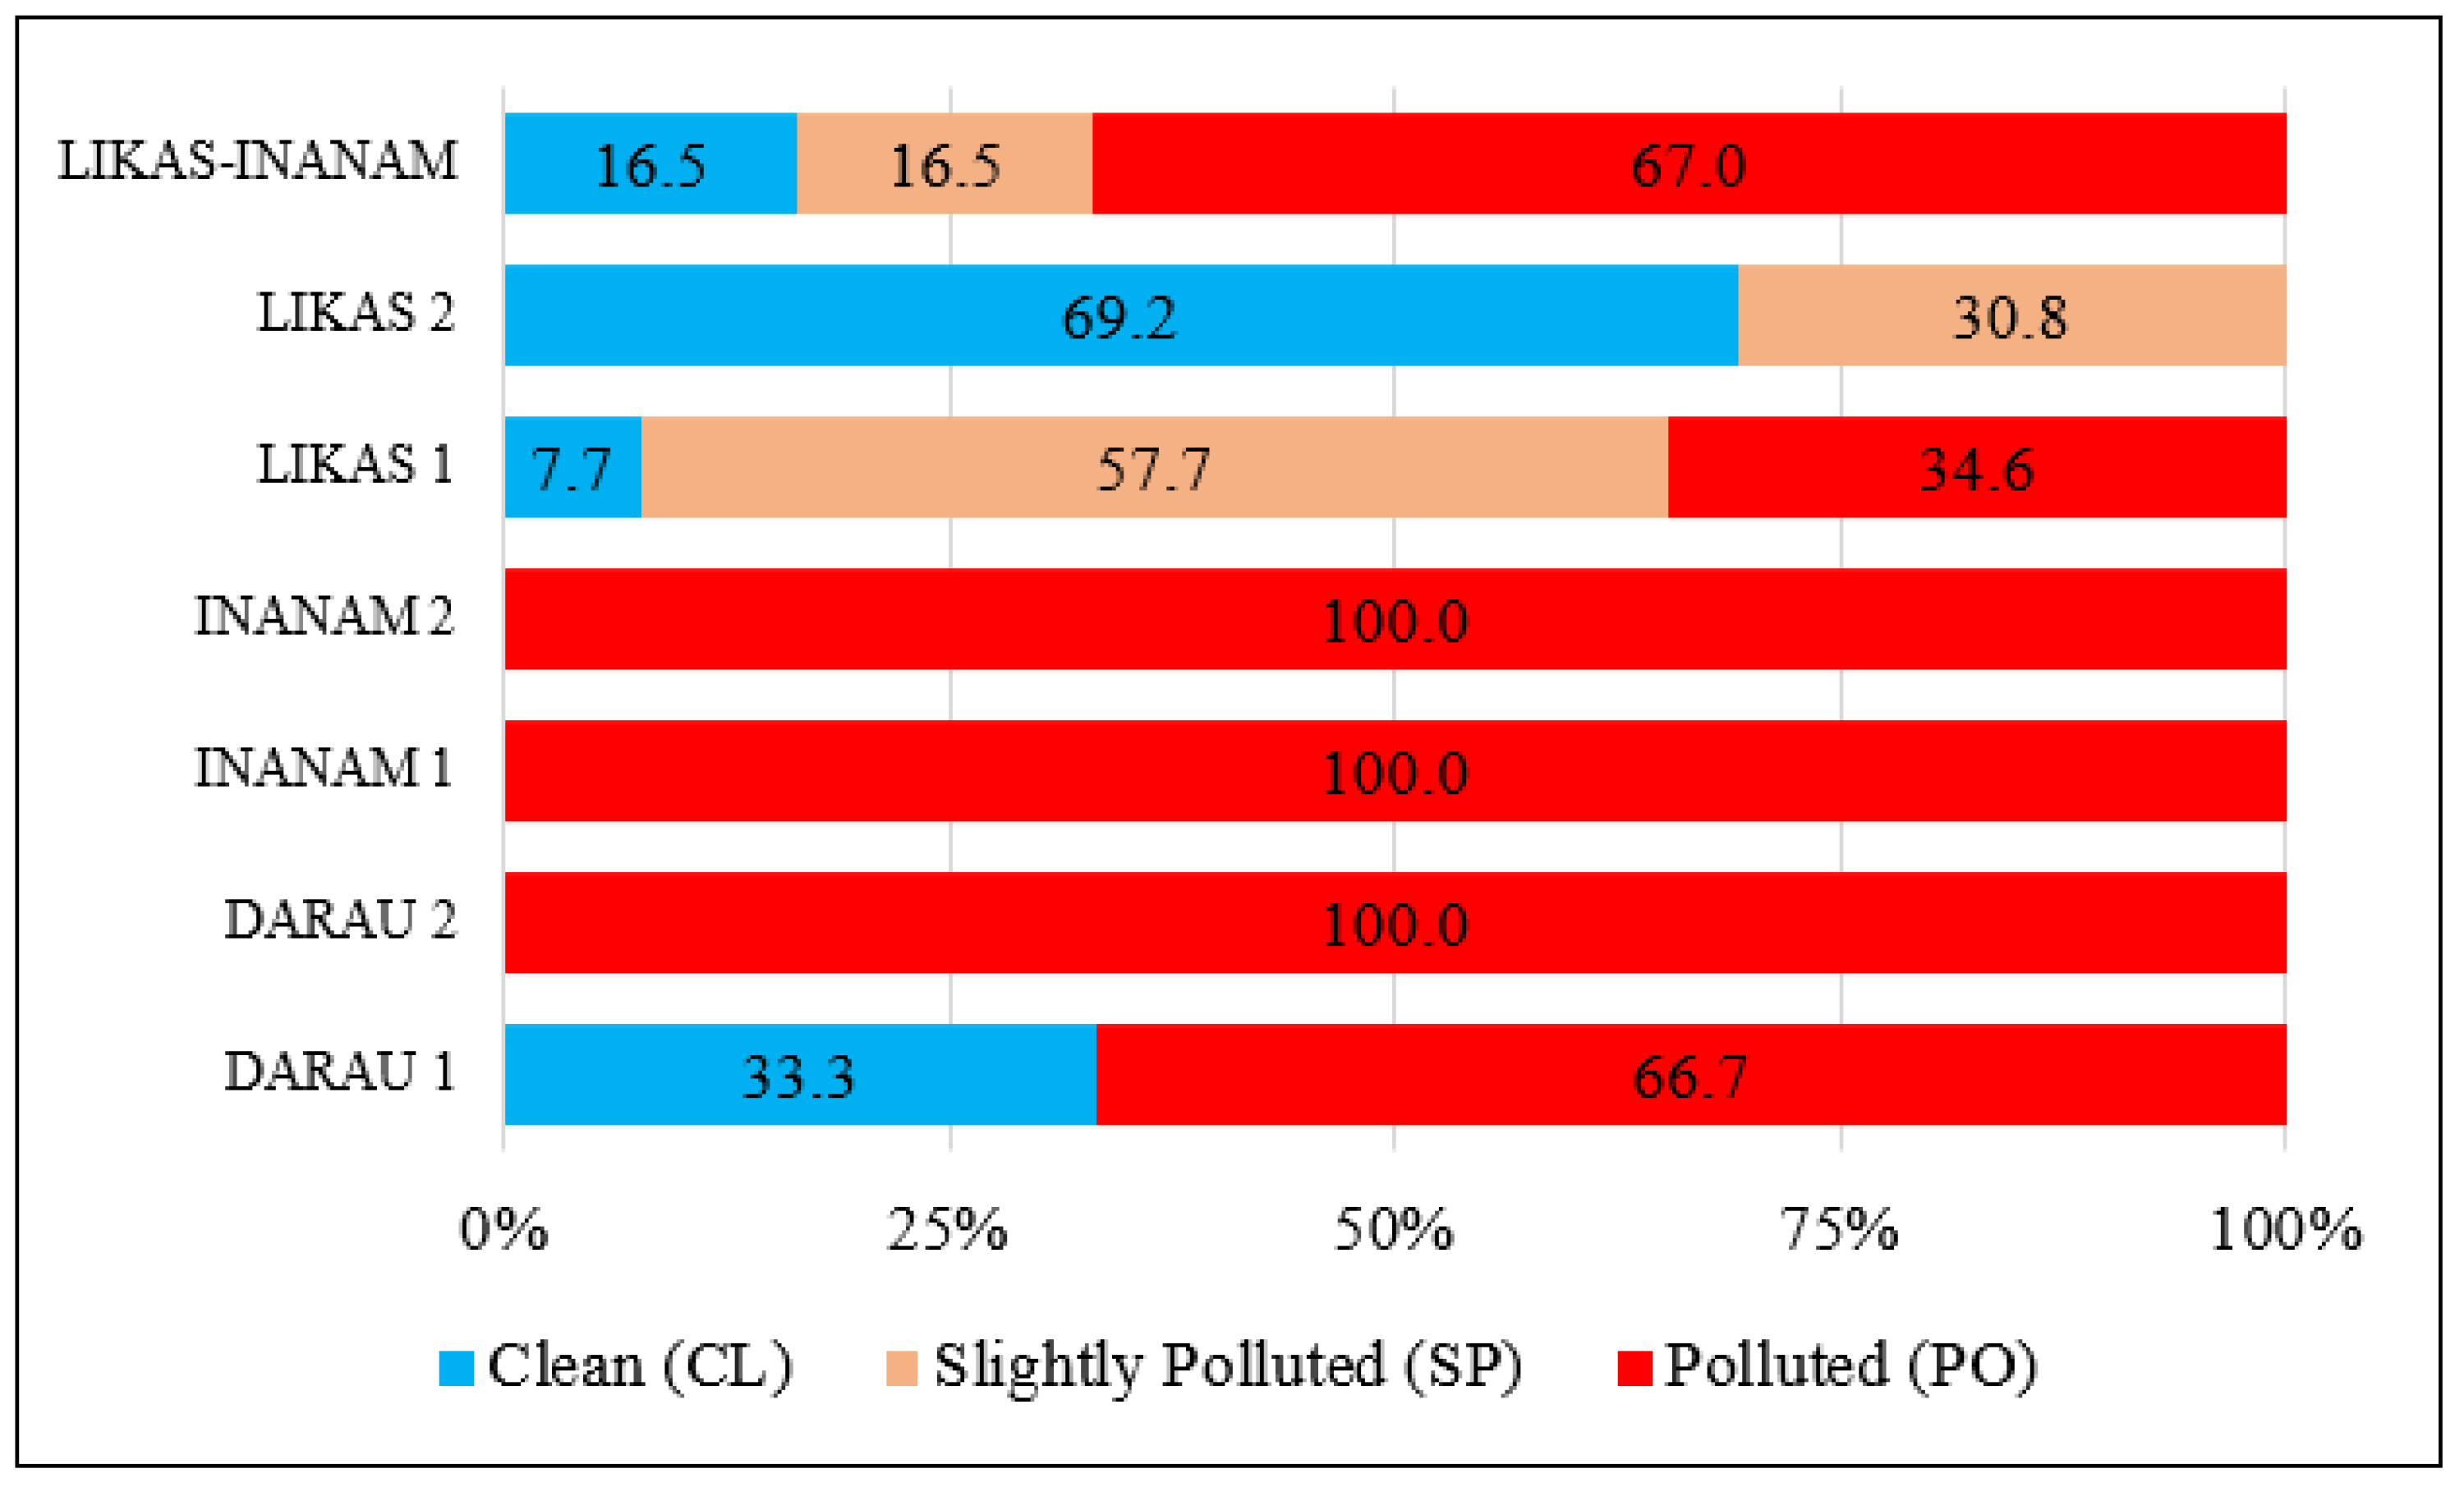
Ammoniacal nitrogen (NH3-N) is another important indicator for analysing disturbances that affect the health level of the river basin. This parameter is used as the main indicator to measure the presence of sewage, especially sewage from animals such as pigs. Overall, NH3-N-based pollution sources are very high in the Inanam–Likas River Basin. Based on the data analysed, the DOE-WQI range for NH3-N was recorded between 6.4 and 99.6. The highest and lowest readings were recorded at Darau 1. The average value was recorded around 56.2, which is in the category of polluted (Table 5). Around 83.5 percent of the total number of observations were at the contaminated level. The polluted category level (67.0%) was the highest compared to slightly polluted (16.5%) and clean (17.5%) levels, as shown in Figure 5. Inanam Station 1, Inanam Station 2, and Darau Station 2 had the highest NH3-N (PO = 100.0%), followed by Darau Station 2 (CL = 33.3%, PO = 66.7%) and Likas Station 1 (CL = 7.7%, SP = 57.7%, PO = 34.6%). Among all observation stations, Inanam Station 2 showed the lowest total NH3-H concentration (CL = 69.2%, SP = 30.8%).
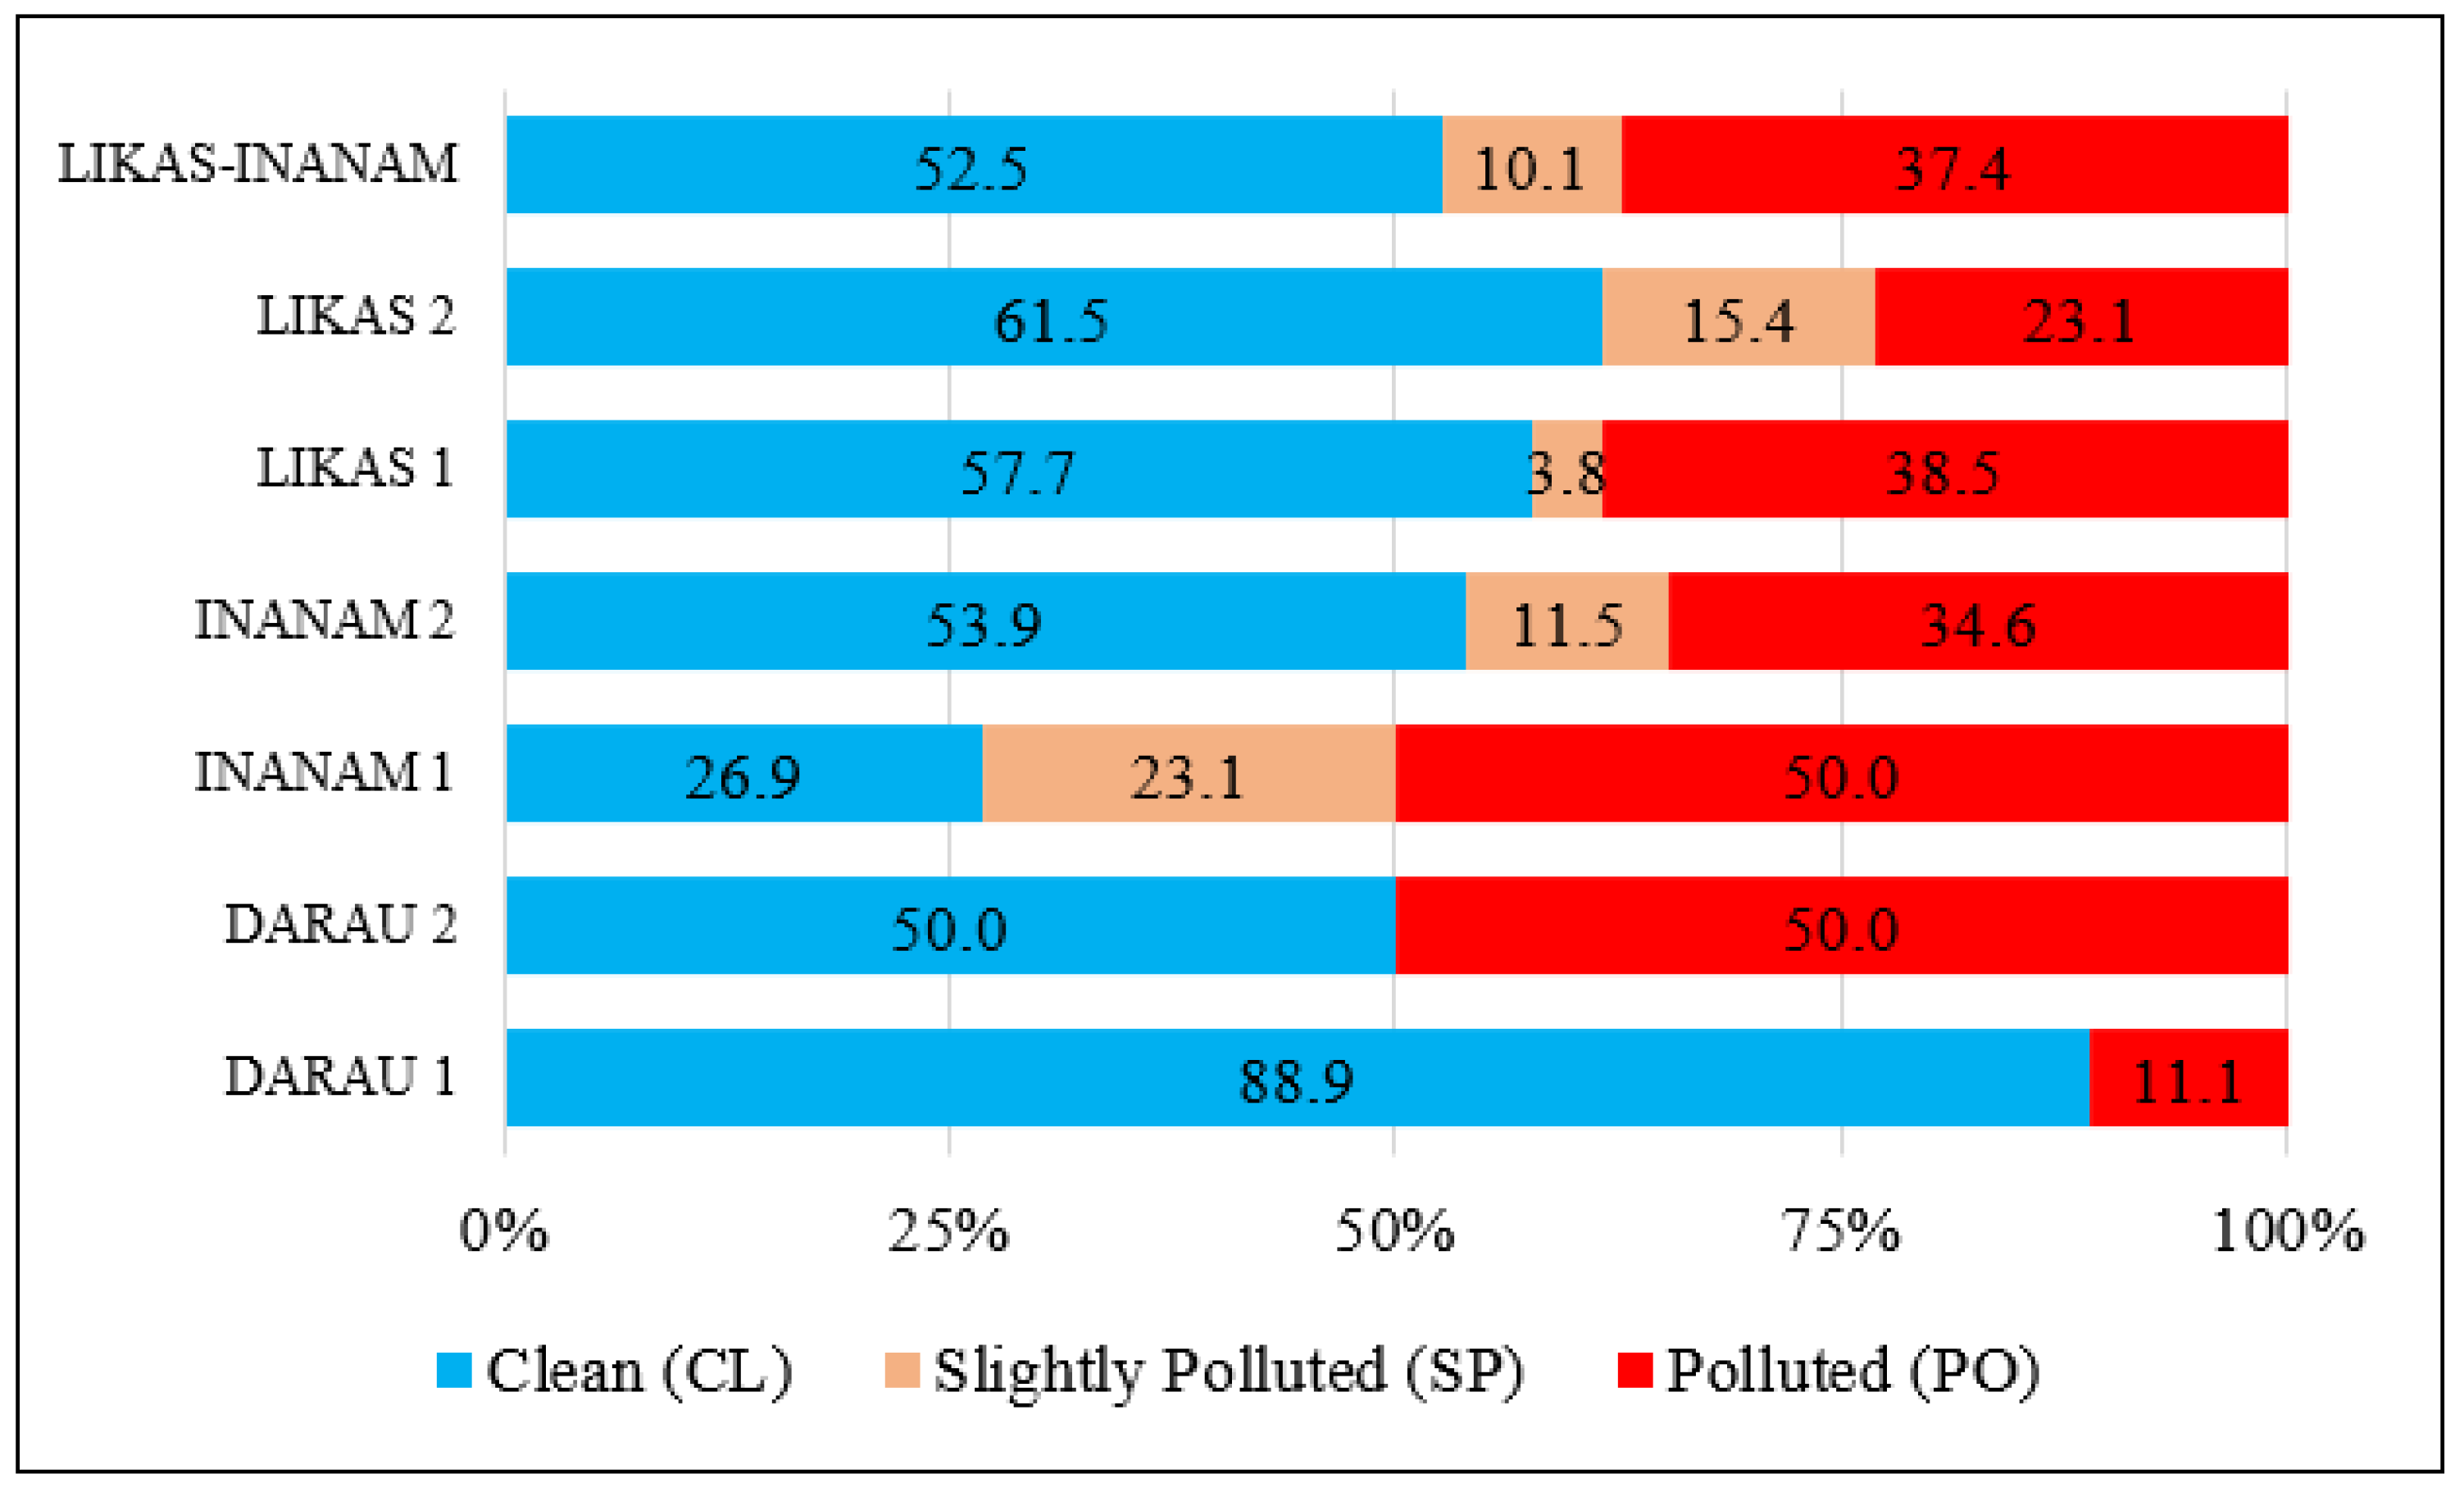
Other than BOD and NH3-N, suspended solids (SS) are another key indicator for measuring the healthy level of the river basin. SS is an indicator of sediment-based pollution resulting from land clearing, natural processes, and sewage. It usually consists of mud, fine mineral waste, fine sand particles, silt and clay, organic matter particles, plankton, and microscopic organisms. Based on the data analysed, the DOE-WQI values range for SS between 8.0 and 96.9. The highest readings were at Likas Station 1, 2, and Darau Station 2, while the lowest was recorded at Inanam 2. The overall average of around 73.5 puts it in the slightly polluted level (Table 6). Based on the total values observed, more than half (52.5%) in the Inanam–Likas Basin have shown a clean status. The rest are polluted (37.4%) and slightly polluted (10.1%). From the sub-basins, the highest SS concentration is found at Inanam Station 1 (CL = 26.9%, SP = 23.1%, PO = 50.0%), followed by Darau Station 2 (CL = 50.0%, PO = 50.0%), Likas Station 1 (CL = 57.7%, SP = 3.8%, PO = 38.5%), and Inanam Station 2 (CL = 53.9%, SP = 11.5%, PO = 34.6%). The analysis results also found that Darau Station 1 contained the lowest amount of SS concentration (CL = 88.9%, PO = 11.1%) and Likas Station 2 contained the second lowest (CL = 61.5%, SP = 15.4%, PO = 23.1%), as shown in Figure 6.

3.2. Trend of DoE-WQI

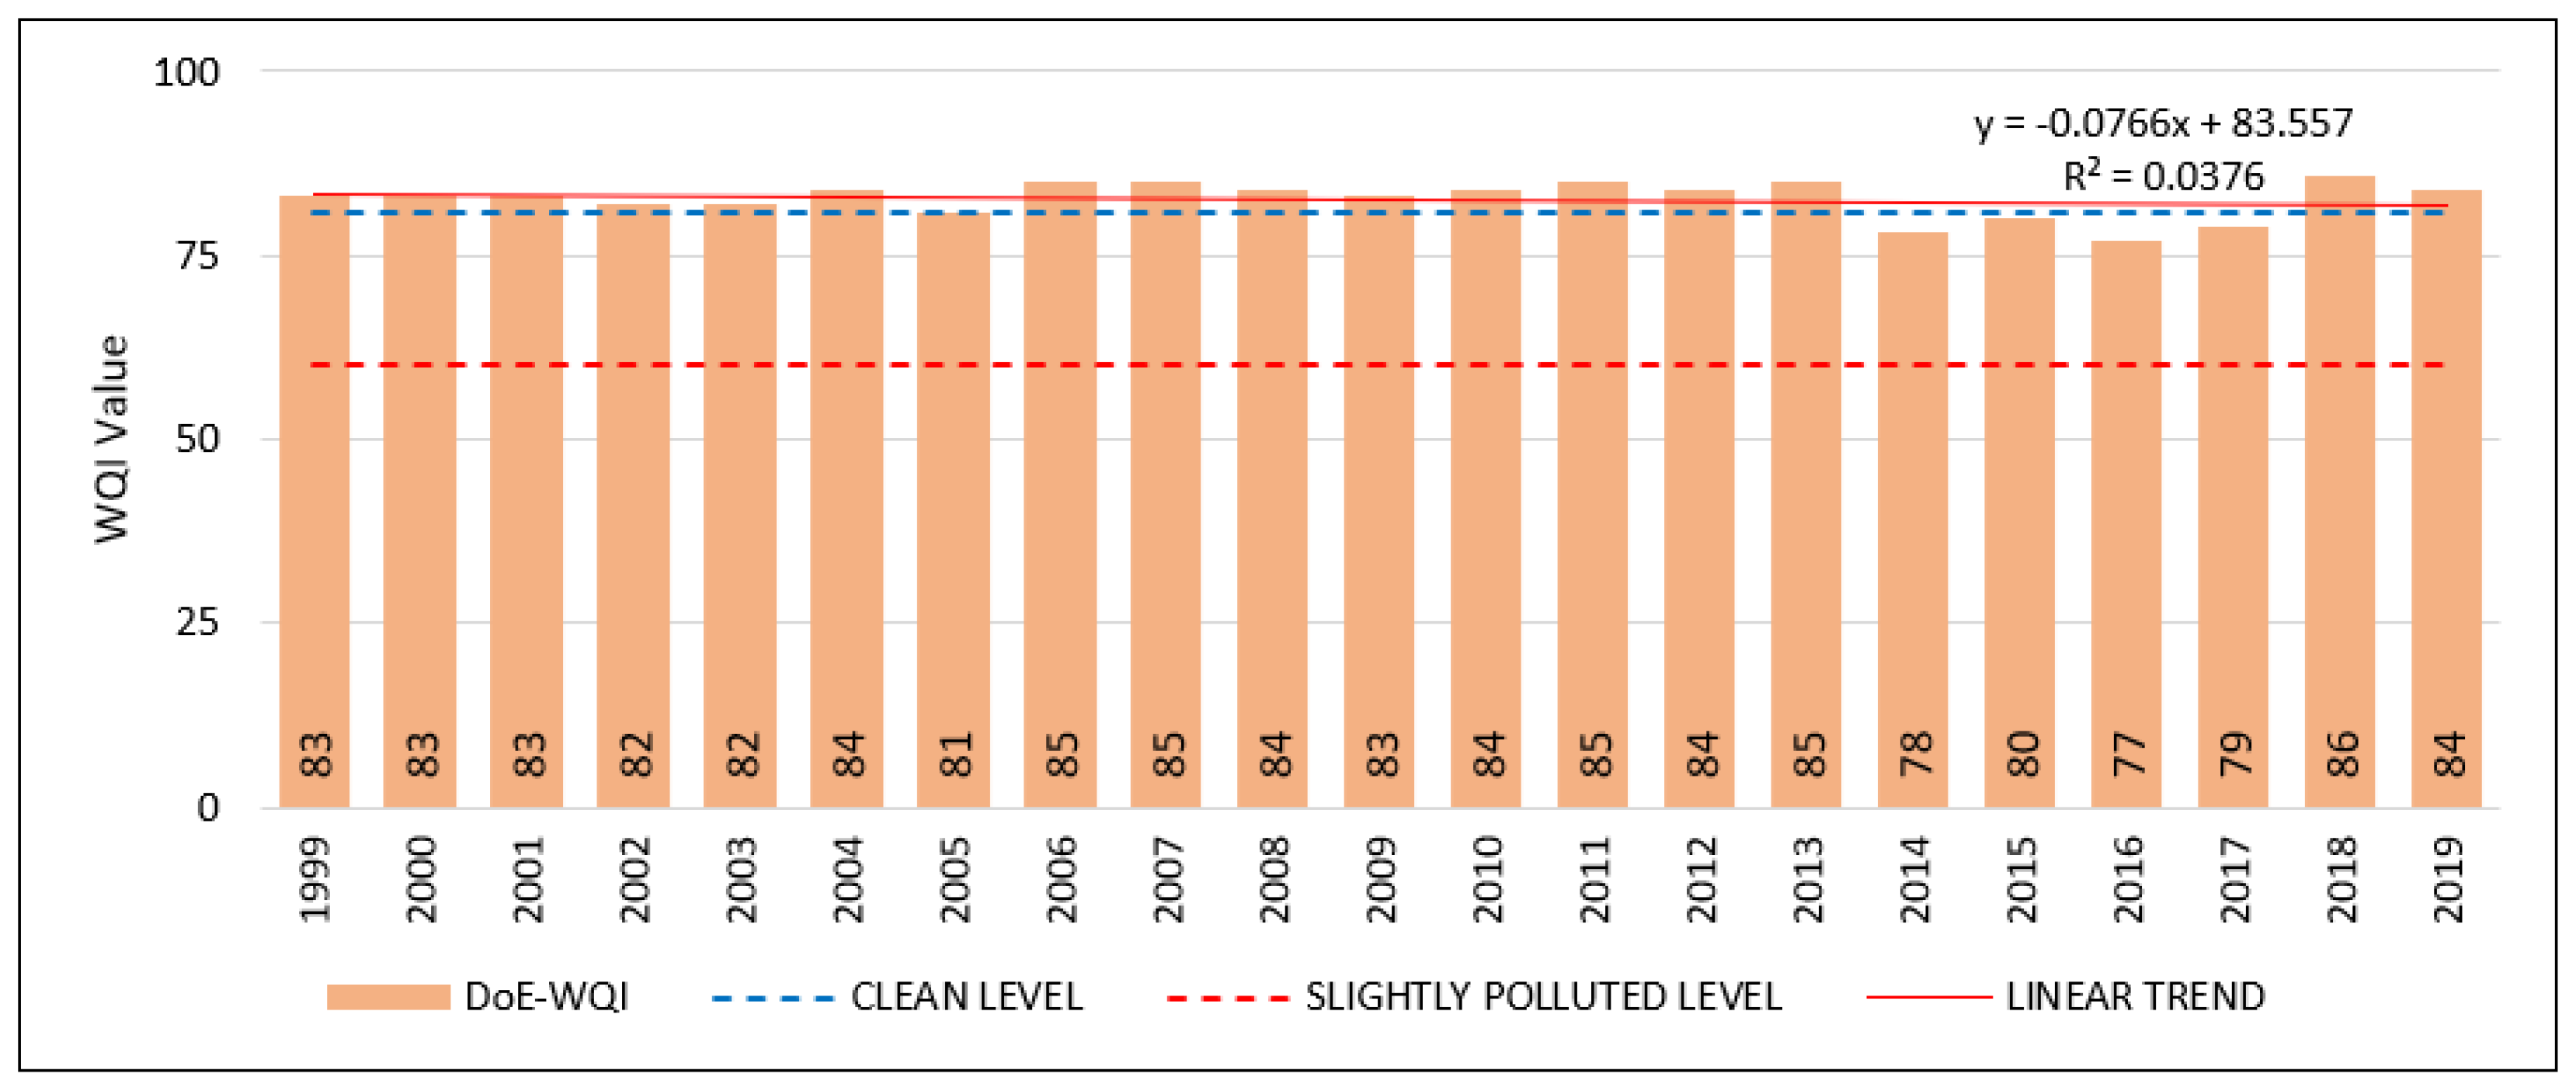
During the 21-year period (1999–2019), the status and trend of water quality between the Inanam and Likas Rivers were different. During this period, 81.0% of the DoE-WQI values in the Inanam River were classified as clean, while the remaining 19% were categorised as slightly polluted, as illustrated in Figure 7. The Mann–Kendall trend analysis results of DoE-WQI indicate a decreasing trend pattern. It is based on the negative value of Sen’s slope (−0.235) and the value of linear regression coefficient (b = −0.0766). The decline in this trend signifies a deterioration in the water quality of the Inanam River. If this trend continues without mitigation efforts, the quality status may change to slightly polluted. Despite the decline, this trend is seen as insignificant based on the p-value (0.9), which is higher than the alpha value (0.05). The Sen’s slope value (S) is very low, at 5, as shown in Table 7. This insignificant value is supported by Kendall’s tau value at 0.03, which is relatively low, and R2 linear regression at 0.03. This means the strength of the decreasing trend is only around 3 percent.
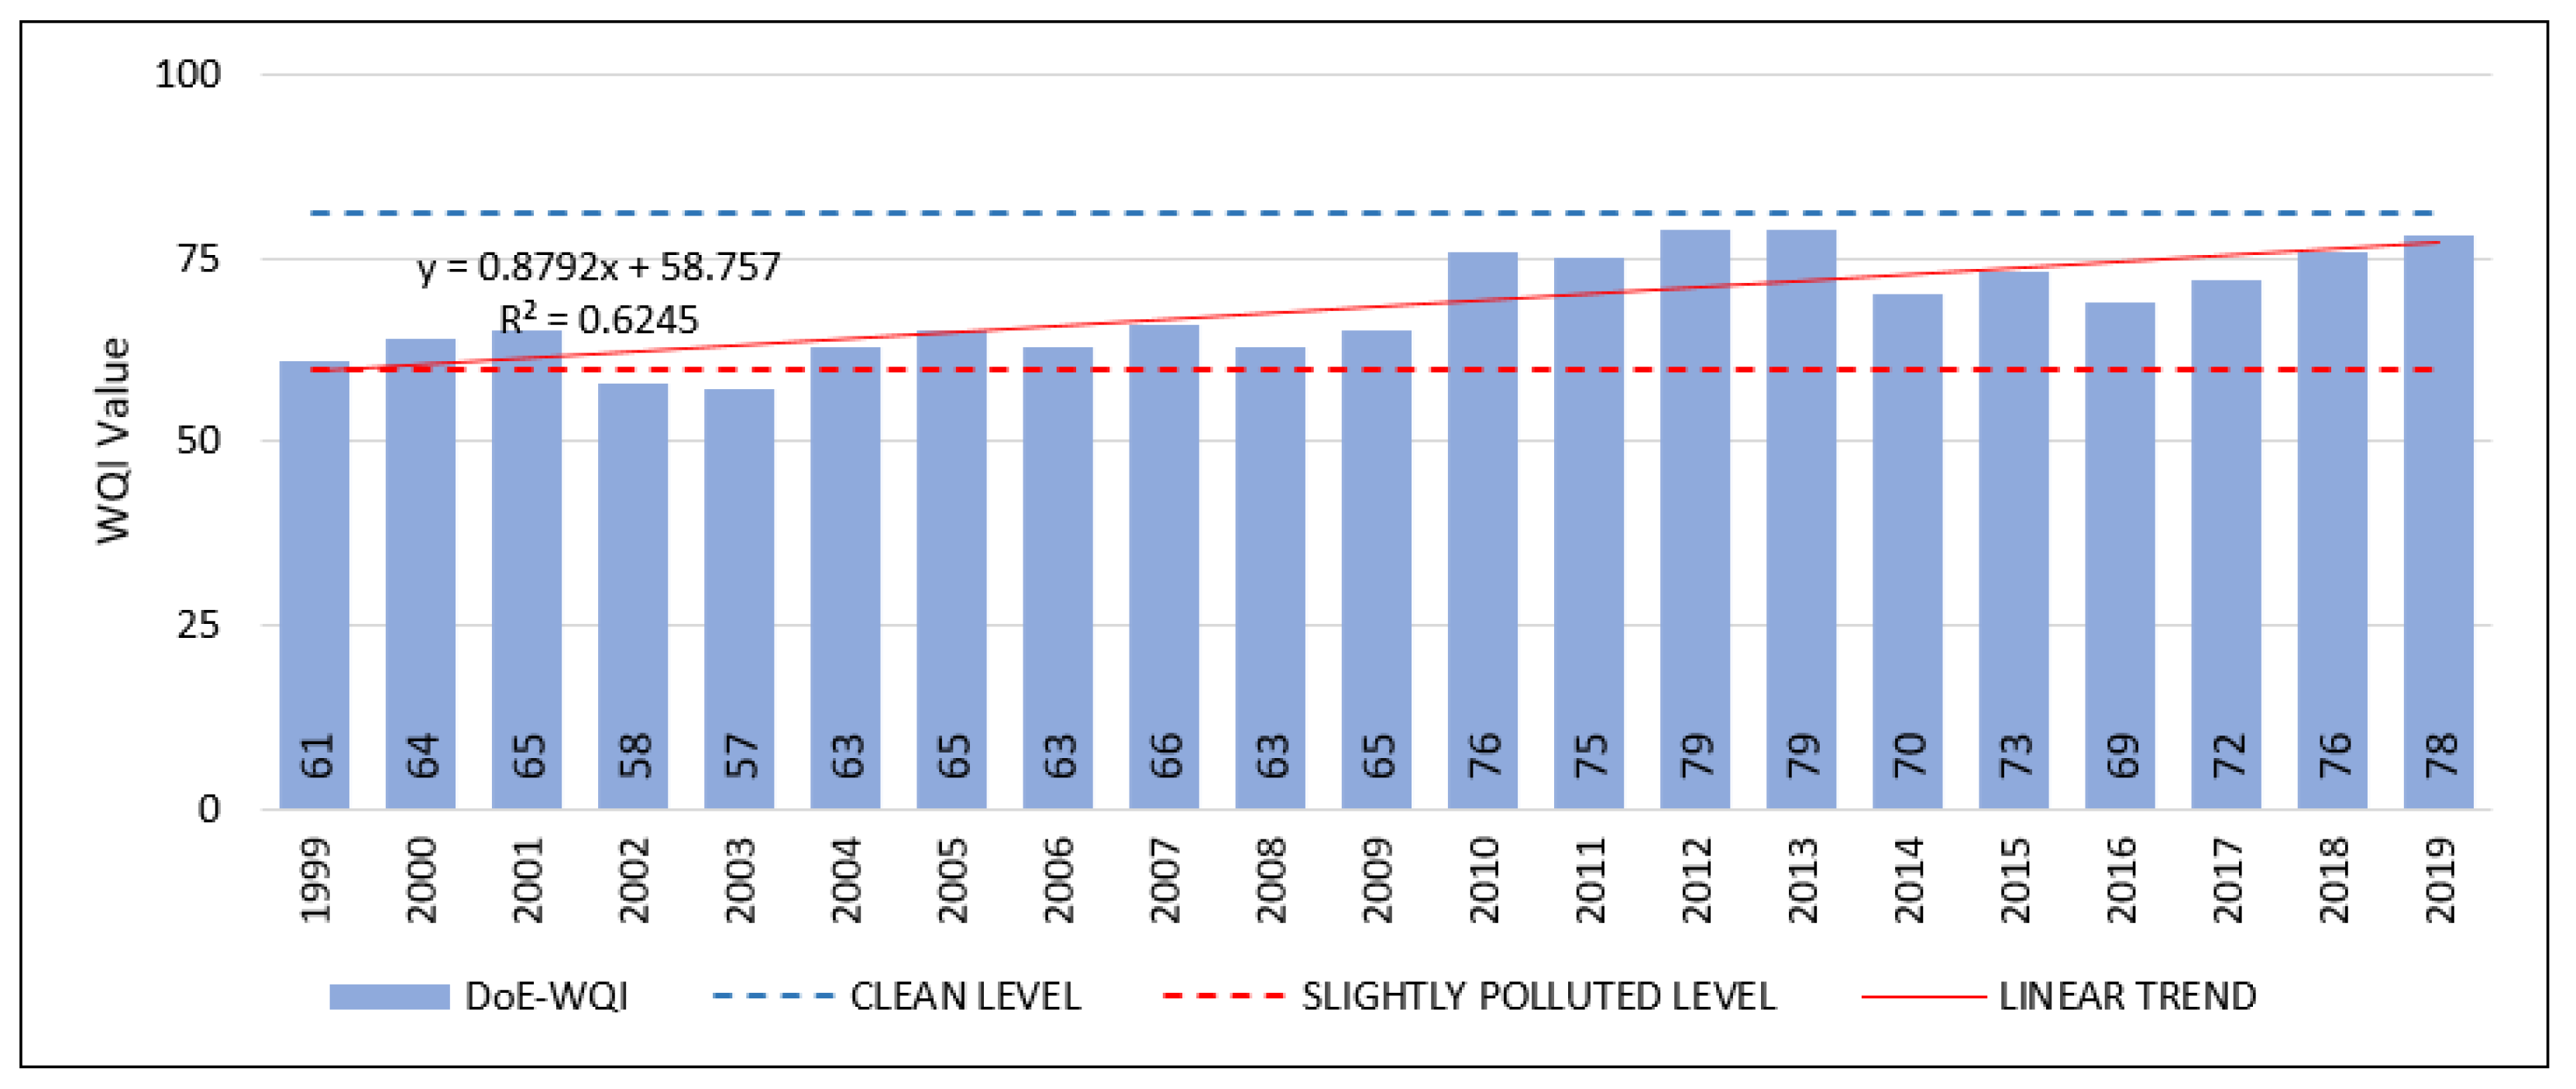
For the Likas River, almost the entirety (90.5%) of the DoE-WQI values were categorised as slightly polluted, while the remaining 9.5% were classified as polluted, as illustrated in Figure 8. There is an increasing trend based on the Sen’s slope parameter which shows a positive value (0.556) as well as the linear regression coefficient b value of 0.8792. This illustrates that there is an increase in the water quality level, signifying that the condition of water quality is improving. This increasing trend is significant at the 95% confidence level based on the lower p-value (0.0003) compared to the alpha value (0.05), as shown in Table 7. This is supported by the large slope (S) value that is approximately 120 away from the 0 value. The significance of this trend is supported by a relatively high Kendall’s tau value of 0.58 and R2 linear regression of around 0.62. This means that the strength of the increment trend is more than 50 percent.

4. Discussion

Water pollution is one of the major and serious issues faced by urban areas in developing countries [83,84] including Malaysia. As development rapidly progresses, maintaining water quality standards will undoubtedly become more challenging. This is due to the fact that development will inevitably transform many natural landscapes into man-made landscapes, which can affect water quality health. The Inanam–Likas River Basin is an area of rapid development due to its location in the city area. The construction of commercial areas, industries, and settlements around the basin has affected the river’s health, causing the deterioration of the water quality level. This analysis is based on 139 WQI results obtained between the years 2014 and 2018 whereas more than 50 percent of the data observed indicate that the river water has been polluted, either slightly polluted or classified as polluted. The Inanam and Darau catchment areas are major contributors to the deterioration of water quality compared to the Likas catchment area. The main factor behind this issue is the urbanisation of the area, particularly in the industrial, commercial, and residential sectors [63,85]. As a result, the river receives substantial amounts of urban and industrial domestic waste discharges, along with surface runoff [68]. This is consistent with the study of Camara et al. [34] who stated that 87% of scientific studies show that urban land use is the main cause of water pollution.
Among the urban land uses that contribute to the deterioration of water quality in the study area are sewage plants and slums [63]. Sewage plants and slums are contributors to the deterioration of the ammonic nitrogen index in the study area. This is proven by the study results where all observation stations in the area are affected by the presence of ammonia. The percentage of NH3-N observations in the polluted category is around 83.5 percent. The Inanam and Darau sub-basins are the most affected areas because they received sewage direct from sewage ponds as well as untreated sewage from villages. For example, Inanam 2 Station, located far upstream, experiences high levels of NH3-N pollution due to receiving untreated sewage from the Kobuni village. Luo et al. [86] stated that population density and the wastewater treatment rate are the main factors affecting river ecosystems. An increase in population level and density results in an increase in total waste. The sewage treatment facilities in cities are severely insufficient and outdated [19], leading to a situation where the sewerage infrastructure does not effectively reduce the discharge of untreated sewage into urban watersheds. Urban streams receive significant amounts of wastewater intentionally or unintentionally discharged directly into rivers without proper treatment [87]. The practice of dumping untreated wastewater into rivers and oceans remains prevalent [63]. Additionally, there are several slums located along the Inanam River downstream, near Inanam Station 1 and Darau Station 1. Slums are a particular concern in cities as they often lack adequate access to sewerage systems, as infrastructure development tends to lag behind urban expansion [6]. Lower-income areas frequently lack appropriate infrastructure for sewage conveyance [88], and sewerage systems are not always connected to wastewater treatment facilities [6]. Consequently, pollution loads from slums contribute to the degradation of urban streams [89].
The degree of organic pollution, resulting from an excessive amount of organic matter, is commonly assessed by measuring the biochemical oxygen demand (BOD) in rivers. In the study area, the presence of industrial and domestic waste contributes to a high level of pollution, as indicated by over 75.5 percent of WQI readings. Industrial effluents and domestic waste significantly impact the BOD levels in the rivers [39,90]. The degradation of river water quality occurs when there is a high level of BOD, which leads to the rapid decomposition of biodegradable organic matter and subsequent depletion of dissolved oxygen [91,92,93]. Land use conversion activities also contribute to the decline of the suspended solids index [94,95]. This is shown by the high percentage of SS presence by the stations located in the development area’s lower course of the river (Darau 2 and Inanam 1). Land clearing for the development of commercial centres and housing areas allows soil erosion to occur which then causes sediment to be carried into the river during the rainy season. This is in line with research by Wan Ruslan [96] who examined the causes of geological erosion and acceleration. Different land uses have varying impacts on the volume, dimensions, and characteristics of urban sediment. The sediments found in the river primarily come from urban sources [97]. Street residue, in particular, accounts for an average of 13% of the total suspended sediment and contains higher concentrations of anthropogenically enriched elements [98]. Industrial and domestic activities contribute the highest pollution load of total suspended solids (TSS) [99].

5. Conclusions

Various methods have been employed to assess the health of the basin’s ecosystem. This study used the Water Quality Index (WQI) with the six parameters that have been generally applied in Malaysia. This approach demonstrates the river’s health level according to the three levels of cleanliness classification. The WQI classification level revealed that the Inanam River Basin is in a moderately healthy condition. Due to the decline in water quality, the level remains somewhat polluted. The trend also suggests that the river’s health level is improving. The identified causes that contribute to the deterioration of water quality are the presence of domestic sewage plants and slums along the river. The unsystematic sewage system and the unorganised waste maintenance in slums have deteriorated the river water’s quality level. Hence, it is advisable to prohibit the direct disposal of domestic waste, regardless of whether the value is lower than the permitted limit in certain cases. The continuous discharge of effluent into the river has led to a significant accumulation of pollutants. Therefore, stakeholders (such as the local authorities) play a significant role in addressing such issues in order to maintain the health of the river basin. Likewise, land clearing should also be continuously monitored to ensure that the construction of sediment ponds is accomplished within the development area to prevent sediment from directly flowing into the river. Controlling these two main factors is important to ensure that the beach of Teluk Likas (the lower course area of the Inanam–Likas River Basin) continues to be preserved since it is an important landmark for the local authority (DBKK).

Author Contributions

Conceptualisation, N.S. and A.J. methodology, N.S., M.T.M. and A.H.B.A.; software, N.S. and A.J. validation, A.A., A.J. and R.D.; formal analysis, R.D. and A.A.; investigation, N.S., A.J. and A.H.B.A.; resources, A.H.B.A. and M.T.M.; data curation, N.S., A.J. and M.T.M.; writing—original draft preparation, N.S.; writing—review and editing, R.D., M.T.M. and A.A.; visualisation, A.H.B.A. and M.T.M.; supervision, A.J., R.D. and M.T.M.; project administration, M.T.M. and R.D.; funding acquisition, A.A. All authors have read and agreed to the published version of the manuscript.

Funding

This research was funded by Universiti Malaysia Sabah (UMS) and Kota Kinabalu City Hall (DBKK), grant number GKP0029-2019. The APC was funded by Universiti Kebangsaan Malaysia (UKM) through research grant SK-2022-15.

Data Availability Statement

All data generated or analysed during this study are included in this published article.

Acknowledgments

The authors would like to thank all parties who contributed to the success of this research. Special thanks to the Department of Environment (DOE) Malaysia for providing river water quality data.

Conflicts of Interest

The authors declare no conflict of interest. The funders had no role in the design of the study; in the collection, analyses, or interpretation of data; in the writing of the manuscript, or in the decision to publish the results.

References

  1. Postel, S.; Richter, B. Rivers for Life; Island Press: Washington, DC, USA, 2003. [Google Scholar]
  2. Costanza, R.; D’Arge, R.; de Groot, R.; Farber, S.; Grasso, M.; Hannon, B.; Limburg, K.; Naeem, S.; O’Neill, R.V.; Paruelo, J.; et al. The value of the world’s ecosystem services and natural capital. Nature 1997, 387, 253–260. [Google Scholar] [CrossRef]
  3. Meyer, J.L.; Paul, M.J.; Taulbee, W.K. Stream ecosystem function in urbanizing landscapes. J. N. Am. Benthol. Soc. 2005, 24, 602–612. [Google Scholar] [CrossRef]
  4. Millennium Ecosystem Assessment. Ecosystems and Human Well-Being: Synthesis. In ZooKeys; Island Press: Singapore, 2005; p. 715. [Google Scholar] [CrossRef] [Green Version]
  5. Smith, R.V. Nutrient Budget of the River Maine, Co. Antrim. Agric. Water Qual. Tech. Bull. Lond. 1976, 32, 315–339. [Google Scholar]
  6. Corcoran, E.; Nellemann, C.; Baker, E.; Bos, R.; Osborn, D.; Savelli, H. Sick Water? The Central Role of Wastewater Management in Sustainable Development. A Rapid Response Assessment; UNEP Publication: Nairobi, Kenya, 2010; Available online: https://wedocs.unep.org/20.500.11822/9156 (accessed on 17 April 2020).
  7. Rashleigh, B.; Lagutov, V.; Salathe, T. Ecosystem Services of Rivers: The Don River (Russian Federation) and Roanoke River (USA). In Environmental Security in Watersheds: The Sea of Azov; Lagutov, V., Ed.; Springer: Dordrecht, The Netherlands, 2012; pp. 63–77. [Google Scholar]
  8. Twort, A.C.; Law, F.M.; Crowley, F.W. Bekalan Air; Dewan Bahasa dan Pustaka: Kuala Lumpur, Malaysia, 1994.
  9. Hongyu, D.; Xuejun, S.; Hong, J.; Zenghui, K.; Zhibao, W.; Yongli, C. Research on the cooling island effects of water body: A case study of Shanghai, China. Ecol. Indic. 2016, 67, 31–38. [Google Scholar]
  10. Niemczynowicz, J. Urban hydrology and water management–present and future challenges. Urban Water 1999, 1, 1–14. [Google Scholar] [CrossRef]
  11. Habersack, H.; Hein, T.; Stanica, A.; Liska, I.; Mair, R.; Jäger, E.; Hauer, C.; Bradley, C. Challenges of river basin management: Current status of, and prospects for, the River Danube from a river engineering perspective. Sci. Total Environ. 2016, 543, 828–845. [Google Scholar] [CrossRef] [Green Version]
  12. N-Water. In Tackling a Global Crisis: International Year of Sanitation 2008; United Nations: New York, NY, USA, 2008; Available online: http://esa.un.org/iys/docs/IYS_flagship_web_small.pdf (accessed on 12 January 2020).
  13. UNESCO. The Global Water Quality Challenge & SDGs. 2021. Available online: https://en.unesco.org/waterquality-iiwq/wq-challenge (accessed on 27 January 2023).
  14. USDA. What Is a Watershed? Natural Resources Conservation Service: Washington, DC, USA, 2016. Available online: https://www.nrcs.usda.gov/wps/portal/nrcs/detail/pa/water/watersheds/?cid=nrcs142p2_018202 (accessed on 13 September 2021).
  15. Gurnell, A.; Lee, M.; Souch, C. Urban rivers: Hydrology, geomorphology, ecology and opportunities for change. Geogr. Compass 2007, 1, 1118–1137. [Google Scholar] [CrossRef]
  16. Nasir, N.; Mohmadisa, H.; Mohd Hairy, I.; Mohamad Suhaily Yusri, C.N. Land Use Change and River Water Quality Level in Ipoh City, Perak. Malays. J. Environ. Manag. 2009, 10, 115–134. [Google Scholar]
  17. Zhang, Y. Spatial and temporal variation in water quality of the Huangpu River in Shanghai, China. Environ. Monit. Assess. 2018, 190, 475. [Google Scholar] [CrossRef]
  18. Walsh, C.J.; Roy, A.H.; Feminella, J.W.; Cottingham, P.D.; Groffman, P.M.; Morgan, R.P. The urban stream syndrome: Current knowledge and the search for a cure. J. N. Am. Benthol. Soc. 2015, 24, 706–723. [Google Scholar] [CrossRef]
  19. Chen, S.S.; Kimirei, I.A.; Yu, C.; Shen, Q.; Gao, Q. Assessment of urban river water pollution with urbanization in East Africa. Environ. Sci. Pollut. Res. 2022, 29, 40812–40825. [Google Scholar] [CrossRef] [PubMed]
  20. Jafar, A.; Dollah, R.; Sakke, N.; Mapa, M.T.; Joko, E.P.; Radzi, M.M.; Imang, U.; Ahmad, S.A.; Wahab, A.A.; Sipatau, J.A. Tourism and natural hazards: River landform changes due to geohazards and its influence on ecotourism economy development in Sabah, Malaysia. Sustainability 2022, 14, 15832. [Google Scholar] [CrossRef]
  21. Jafar, A.; Sakke, N.; Mapa, M.T.; Dollah, R.; George, F. The Adaptive Capacity in Flood Hazards and Enhancement of Local Knowledge among Floodplain Community in Beaufort District, Sabah, Malaysia. Int. J. Clim. Chang. Impacts Responses 2022, 14, 35–47. [Google Scholar] [CrossRef]
  22. Jafar, A.; Sakke, N.; Mapa, M.T.; Dollah, R.; Joko, E.P. Assessing flood risks and the coping strategy: A community adaptation in floodplain areas at Beaufort district in east Malaysia. Disaster Adv. 2022, 15, 1–11. [Google Scholar] [CrossRef]
  23. Zhou, T.; Wu, J.; Peng, S. Assessing the effects of landscape pattern on river water quality at multiple scales: A case study of the Dongjiang River watershed, China. Ecol. Indic. 2012, 23, 166–175. [Google Scholar] [CrossRef]
  24. Dams, J.; Dujardin, J.; Reggers, R.; Bashir, I.; Canters, F.; Batelaan, O. Mapping impervious surface change from remote sensing for hydrological modeling. J. Hydrol. 2013, 485, 84–95. [Google Scholar] [CrossRef]
  25. Qin, H.P.; Khu, S.T.; Yu, X.Y. Spatial variations of storm runoff pollution and their correlation with land-use in a rapidly urbanizing catchment in China. Sci. Total Environ. 2010, 408, 4613–4623. [Google Scholar] [CrossRef]
  26. Chow, M.I.; Lundin, J.I.; Mitchell, C.J.; Davis, J.W.; Young, G.; Scholz, N.L.; McIntyre, J.K. An urban stormwater runoff mortality syndrome in juvenile coho salmon. Aquat. Toxicol. 2019, 214, 105231. [Google Scholar] [CrossRef]
  27. Park, C.Y.; Lee, D.K.; Asawa, T.; Murakami, A.; Kim, H.G.; Lee, M.K.; Lee, H.S. Influence of urban form on the cooling effect of a small urban river. Landsc. Urban Plan. 2019, 183, 26–35. [Google Scholar] [CrossRef]
  28. Muller, A.; Osterlund, H.; Marsalek, J.; Viklander, M. The pollution conveyed by urban runoff: A review of sources. Sci. Total Environ. 2020, 709, 136125. [Google Scholar] [CrossRef]
  29. NRC (National Research Council). Urban Stormwater Management in the United States; National Research Council: Washington, DC, USA, 2008.
  30. Sanchez, E.; Colmenarejo, M.E.; Vicente, J.; Rubio, A.; Garcia., M.G.; Travieso., L.; Borja., R. Use of the water quality index and dissolved oxygen deficit as simple indicators of watersheds pollution. Ecol. Indic. 2007, 7, 315–328. [Google Scholar] [CrossRef]
  31. Wijesiri, B.; Liu, A.; Goonetilleke, A. Impact of global warming on urban stormwater quality: From the perspective of an alternative water resource. J. Clean. Prod. 2020, 262, 121330. [Google Scholar] [CrossRef]
  32. Jiang, N.; Shang, R.; Heijman, S.G.J.; Rietveld, L.C. High-silica zeolites for adsorption of organic micro-pollutants in water treatment: A review. Water Res. 2018, 144, 145–161. [Google Scholar] [CrossRef] [PubMed]
  33. Gaafar, A.A.; Ali, S.I.; El-Shawadfy, M.A.; Salama, Z.A.; Sękara, A.; Ulrichs, C.; Abdelhamid, M.T. Ascorbic Acid Induces the Increase of Secondary Metabolites, Antioxidant Activity, Growth, and Productivity of the Common Bean under Water Stress Conditions. Plants 2020, 9, 627. [Google Scholar] [CrossRef]
  34. Camara, M.; Jamil, N.R.; Abdullah, A.F.B. Impact of land uses on water quality in Malaysia: A review. Ecol. Process. 2019, 8, 10. [Google Scholar] [CrossRef]
  35. Kalavaty, S.; Sharma, T.R.; Sureshkumar, P. Water quality index of river Cauvery in Tiruchirappalli district, Tamilnadu. Arch. Environ. Sci. 2011, 5, 55–61. [Google Scholar]
  36. Haddis, A.; Getahun, T.; Mengistie, E.; Jemal, A.; Smets, I.; van der Bruggen, B. Challenges to surface water quality in mid-sized African cities: Conclusions from Awetu-Kito Rivers in Jimma, south-west Ethiopia. Water Environ. J. 2014, 28, 173–182. [Google Scholar] [CrossRef]
  37. Vesilind, P.A.; Peirce, J.J.; Weiner, R. Kejuruteraan Alam Sekitar, 2nd ed.; UTM Publisher: Skudai, Malaysia, 1994. [Google Scholar]
  38. Yu, F.; Zhou, H.; Huang, Y.; Sun, J.; Qin, F.; Bao, J.; Goddard III, W.A.; Chen, S.; Ren, Z. High-performance bifunctional porous non-noble metal phosphide catalyst for overall water splitting. Nat. Commun. 2018, 9, 2551. [Google Scholar] [CrossRef] [Green Version]
  39. Bega, J.M.M.; Albertin, L.L.; de Oliveira, J.N. Development of water quality index as a tool for urban water resources management. Environ. Sci. Pollut. Res. 2023, 30, 18588–18600. [Google Scholar] [CrossRef]
  40. Nhapi, I.; Tirivarombo, S. Sewage discharges and nutrient levels in Marimba River, Zimbabwe. Water SA 2004, 30, 107–113. [Google Scholar] [CrossRef] [Green Version]
  41. Capps, K.A.; Bentsen, C.N.; Ramírez, A. Poverty, urbanization, and environmental degradation: Urban streams in the developing world. Freshw. Sci. 2016, 35, 429–435. [Google Scholar] [CrossRef]
  42. Poonam, T.; Tanushree, B.; Sukalyan, C. Water quality indices-important tools for water quality assessment: A review. Int. J. Adv. Chem. 2013, 1, 15–29. [Google Scholar]
  43. Kaushal, S.S.; Belt, K.T. The urban watershed continuum: Evolving spatial and temporal dimensions. Urban Ecosyst. 2012, 15, 409–435. [Google Scholar] [CrossRef]
  44. Yang, L.; Li, J.; Zhou, K.; Feng, P.; Dong, L. The effects of surface pollution on urban river water quality under rainfall events in Wuqing district, Tianjin, China. J. Clean. Prod. 2021, 293, 126136. [Google Scholar] [CrossRef]
  45. Sani, S. Perbandaran, Iklim Bandar & Pencemaran Udara; Dewan Bahasa & Pustaka: Kuala Lumpur, Malaysia, 1982.
  46. Jahi, J.M. Impak Pembangunan Terhadap Alam Sekitar; UKM Publisher: Bangi, Malaysia, 1996. [Google Scholar]
  47. JPS Selangor. Pengurusan Sungai. 2019. Available online: http://water.selangor.gov.my/index.php/ms/maklumat-jabatan/fungsi-jabatan/pengurusan-sungai (accessed on 23 January 2022).
  48. JPS. Kompendium Data Dan Maklumat Asas JPS. 2018. Available online: https://www.water.gov.my/jps/resources/Compendium/kompendium2018.pdf (accessed on 23 January 2023).
  49. Ng, K.C. Sources and spatial distribution of heavy metal pollution in the Langat River Basin, Malaysia. Environ. Earth Sci. 2015, 74, 7457–7469. [Google Scholar]
  50. Zakaria, M.P.; Takada, H.; Tsutsumi, S.; Ohno, K.; Yamada, J.; Kouno, E.; Kumata, H. Distribution of polycyclic aromatic hydrocarbons (PAHs) in rivers and estuaries in Malaysia: A widespread input of petrogenic PAHs. Environ. Sci. Technol. 2002, 36, 1907–1918. [Google Scholar] [CrossRef]
  51. Azyana, Y.; Na, N.N. Land use and catchment size/scale on the water quality deterioration of Kinta River, Perak, Malaysia. Malays. J. Sci. 2012, 31, 121–131. [Google Scholar] [CrossRef] [Green Version]
  52. Shahady, T.D. Degradation and Improvement of Urban River Water Quality. In Water Quality-Factors and Impacts; IntechOpen: London, UK, 2021. [Google Scholar] [CrossRef]
  53. Uddin, M.G.; Nash, S.; Olbert, A.I. A review of water quality index models and their use for assessing surface water quality. Ecol. Indic. 2021, 122, 107218. [Google Scholar] [CrossRef]
  54. O’Brien, A.; Townsend, K.; Hale, R.; Sharley, D.; Pettigrove, V. How is ecosystem health defined and measured? A critical review of freshwater and estuarine studies. Ecol. Indic. 2016, 69, 722–729. [Google Scholar] [CrossRef]
  55. Maliki Abdullah, M.S.; Hapani, M.; Muhamad Salleh, N.F.; Wan Alias, W.M.S. Ecosystem health assessment of sungai Pengkalan Chepa basin: Water quality and heavy metal analysis. Sains Malays. 2020, 49, 1787–1798. [Google Scholar] [CrossRef]
  56. Kruse, M. Ecosystem health indicators. In Encyclopaedia of Ecology, 2nd ed.; Issue April; Elsevier Inc.: Amsterdam, The Netherlands, 2018. [Google Scholar] [CrossRef]
  57. Fitri, A.; Abdul Maulud, K.N.; Pratiwi, D.; Phelia, A.; Rossi, F.; Zuhairi, N.Z. Trend of Water Quality Status in Kelantan River Downstream, Peninsular Malaysia. J. Rekayasa Sipil 2020, 16, 178. [Google Scholar] [CrossRef]
  58. Ithnin, I.; Sakke, N. Influence of land use on water quality: A study on the Linggi River Basin, Negeri Sembilan, Malaysia. Indones. J. Geogr. 2004, 36, 39–59. [Google Scholar]
  59. Ma’arof, N.; Hua, A.K. Kualiti air Sungai UTM: Satu penilaian awal berpandukan enam parameter Indeks Kualiti Air. Geogr. Malays. J. Soc. Space 2015, 1, 107–115. [Google Scholar]
  60. Mamun, A.; Idris, A.; Sulaiman, W.N.A.; Muiby, S.A. A Revised Water Quality Index Proposed for the assessment of surface water quality in Malaysia. Pollut. Res. 2003, 26, 523–529. [Google Scholar]
  61. Dollah, R.; Jafar, R.; Joko, E.P.; Sakke, N.; Mapa, M.T.; Atang, C.; Hung, C.V.; George, F. Perception of youth in East Malaysia (Sabah) towards the Malaysia National COVID-19 Immunisation Programme (PICK). J. Public Health Dev. 2022, 20, 203–217. [Google Scholar] [CrossRef]
  62. Idris, A.; Mohamad, S. Kelangsungan dominasi Barisan Nasional di Sabah dalam Pilihan Raya Umum ke-13. Kaji. Malays. 2014, 32, 171–206. [Google Scholar]
  63. Hafizy, A.M. The Sources of Pollution in the Likas and Inanam River Basin in Kota Kinabalu, Sabah, Malaysia. Sosiohumanika 2009, 2, 89–106. [Google Scholar]
  64. Google Earth Pro 7.3. Inanam-Likas Basin Landuse 5°58′54.59″ N, 116°9′13.24″ E, Elevation 0M. Eye Alt 21.34 km. 2013. Available online: http://www.google.com/earth/index.html (accessed on 4 July 2023).
  65. JUPEM. Malaysia: Kota Kinabalu (Peta Topografi); No Siri 5/116/1; Pengarah Pemetaan: Negara, Malaysia, 1984.
  66. JUPEM. Malaysia: Telipok (Peta Topografi); No Siri 6/116/13; Pengarah Pemetaan: Negara, Malaysia, 1982.
  67. DOE (Department of Environment Malaysia). Environmental Quality Report 2018; Department of Environment Malaysia: Putrajaya, Malaysia, 2019.
  68. Herman, U.L.; Zamali, T.; Ajimi, J. Fuzzy Assessment for Water Quality in Inanam Likas River Basin, Sabah, East of Malaysia. Int. J. Dev. Res. 2016, 6, 8013–8019. [Google Scholar]
  69. JAS. Data Kualiti Air Lembangan Likas 2014–2018; Department of Environment: Putrajaya, Malaysia, 2019.
  70. JAS. Environmental Quality Report 2019; Department of Environment: Putrajaya, Malaysia, 2019.
  71. DOE (Department of Environment Malaysia). Development of Water Quality Criteria and Standards for Malaysia; Department of Environment: Kuala Lumpur, Malaysia, 1985.
  72. Anhar, S. Kualiti dan Pencemaran Air di Malaysia. In Alam Sekitar dan Pengurusannya di Malaysia; Sham, S., Samad, H.A., Jamaluddin, M.J., Eds.; Working Group on Urban Ecosystems Malaysian National MAB Committee—UNESCO: Kuala Lumpur, Malaysia, 1993; pp. 61–88. [Google Scholar]
  73. Institute of Advanced Studies. Water Quality Criteria and Standards for Malaysia; Consultant Group on Water Quality, Institute of Advance Study, Universiti Malaya: Kuala Lumpur, Malaysia, 1986; Volume 1–4. [Google Scholar]
  74. Tyagi, S.; Sharma, B.; Singh, P.; Dobhal, R. Water quality assessment in terms of water quality index. Am. J. Water Resour. 2013, 1, 34–38. [Google Scholar] [CrossRef]
  75. Naubi, I.; Zardari, N.H.; Shirazi, S.M.; Ibrahim, N.F.B.; Baloo, L. Effectiveness of water quality index for monitoring Malaysian river water quality. Pol. J. Environ. Stud. 2016, 25, 231–239. [Google Scholar] [CrossRef]
  76. Salmi, T.; Määttä, A.; Anttila, P.; Ruoho-Airola, T.; Amnell, T. Detecting Trends of Annual Values of Atmospheric Pollutants by the Mann-Kendall Test and Sen’s Slope Estimates—The Excel Template Application Makesens; Finnish Meteorological Institute: Helsinki, Finland, 2002.
  77. Hashim, M.; Nayan, N.; Setyowati, D.L.; Said, Z.M.; Mahat, H.; Saleh, Y. Analysis of Water Quality Trends Using the Mann-Kendall Test and Sen’s Estimator of Slope in a Tropical River Basin. Pollution 2021, 7, 933–942. [Google Scholar] [CrossRef]
  78. Sakke, N.; Mapa, M.T.; Saudi, A. Analysis of several hydrological-drought duration parameters in Mengalong River Basin, Sipitang, Sabah. Malays. J. Geosci. 2018, 2, 22–25. [Google Scholar] [CrossRef]
  79. Ahmadi, M.; Ravanbakhsh, M.; Ahmadi, K.; Ramavandi, B. Trend analysis of long-term water quality for Zohre River water, Iran. Pollut. Res. 2015, 34, 489–496. [Google Scholar]
  80. Mustapha, A. Detecting surface water quality trends using Mann-Kendall tests and Sen’s slope estimates. Int. J. Agric. Innov. Res. 2013, 1, 108–114. [Google Scholar]
  81. Tabari, H.; Marofi, S.; Ahmadi, M. Long-term variations of water quality parameters in the Maroon River, Iran. Environ. Monit. Assess. 2011, 177, 273–287. [Google Scholar] [CrossRef] [PubMed]
  82. Lento, J.; Dillon, P.J.; Somers, K.M. Evaluating long-term trends in littoral benthicmacroinvertebrate communities of lakes recovering from acid deposition. Environ. Monit. Assess. 2011, 184, 7175–7187. [Google Scholar] [CrossRef]
  83. Chaudhry, F.N.; Malik, M.F. Factors affecting water pollution: A review. J. Ecosyst. Ecography 2017, 7, 225–231. [Google Scholar]
  84. Xu, Z.; Xu, J.; Yin, H.; Jin, W.; Li, H.; He, Z. Urban river pollution control in developing countries Nat. Sustainability 2019, 2, 158–160. [Google Scholar]
  85. Haryati, S.; Nurasyikin, M.; Azlina, M.Y.; Sharifah Meryam, S.M. Status kualiti air sungai di beberapa kawasan luar bandar, di negeri Johor dan kesannya kepada kehidupan. Asian J. Environ. Hist. Herit. 2018, 2, 29–42. [Google Scholar]
  86. Luo, Z.; Zuo, Q.; Shao, Q.; Ding, X. The impact of socioeconomic system on the river system in a heavily disturbed basin. Sci. Total Environ. 2019, 660, 851–864. [Google Scholar] [CrossRef]
  87. Srinivasan, J.T.; Reddy, V.R. Impact of irrigation water quality on human health: A case study in India. Ecol. Econ. 2009, 68, 2800–2807. [Google Scholar] [CrossRef]
  88. McMichael, A.J. The urban environment and health in a world of increasing globalization: Issues for developing countries. Bull. World Health Organ. 2000, 78, 1117–1126. [Google Scholar] [PubMed]
  89. Nyenje, P.M.; Havik, J.C.N.; Foppen, J.W.; Muwanga, A.; Kulabako, R. Understanding the fate of sanitation-related nutrients in a shallow sandy aquifer below an urban slum area. J. Contam. Hydrol. 2014, 164, 259–274. [Google Scholar] [CrossRef] [PubMed]
  90. Phiri, O.; Mumba, P.; Moyo, B.H.Z.; Kadewa, W. Assessment of the impact of industrial effluents on water quality of receiving rivers in urban areas of Malawi. Int. J. Environ. Sci. Technol. 2005, 2, 237–244. [Google Scholar] [CrossRef] [Green Version]
  91. Deaton, M.L.; Winebrake, J.J. Dynamic Modeling of Environmental Systems; Springer: New York, NY, USA, 2000. [Google Scholar]
  92. Environment Canada. Water Quality Source Book—A Guide to Water Quality Parameter; Inland Waters Directorate Water Quality Branch Ottawa: Ottawa, ON, Canada, 1979.
  93. Hur, J.; Cho, J. Prediction of BOD, COD, and total nitrogen concentrations in a typical urban river using a fluorescence excitation-emission matrix with PARAFAC and UV absorption indices. Sensors 2012, 12, 972–986. [Google Scholar] [CrossRef] [PubMed]
  94. Douglas, I. Sediment: A major river management issue. In Rivers: Towards Sustainable Development; Chan, N.W., Ed.; USM Publisher: Penang, Malaysia, 2000; pp. 15–22. [Google Scholar]
  95. Goher, M.E.; Hassan, A.M.; Abdel-Monien, I.A.; Fahmy, A.H.; El-Sayed, S.M. Evaluation of Surface Water Quality and Heavy metal indices of Ismailia Canal, Nile River, Egypt. Egypt. J. Aquat. Res. 2014, 40, 225–233. [Google Scholar] [CrossRef] [Green Version]
  96. Wan Ruslan, I. Hakisan tanih dan kemerosotan tanah: Beberapa kes di Malaysia. In Alam Sekitar dan Kesejahteraan Masyarakat Malaysia; Jamaluddin, M.J., Ed.; Pusat Pengajian Siswazah UKM: Bangi, Malaysia, 2004; pp. 155–166. [Google Scholar]
  97. Franz, C.; Makeschin, M.; Weiß, H.; Lorz, C. Sediments in urban river basins: Identification of sediment sources within the Lago Paranoá catchment, Brasilia DF, Brazil–using the fingerprint approach. Sci. Total Environ. 2014, 466–467, 513–523. [Google Scholar] [CrossRef]
  98. Devereux, O.H.; Prestegaard, K.L.; Needelman, B.A.; Gellis, A.C. Suspended-sediment source in an urban watershed, Northeast Banch Anacostia River, Maryland. Hydrol. Process. 2010, 24, 1391–1403. [Google Scholar] [CrossRef]
  99. Pramaningsih, V.; Suprayogi, S.; Suprayogi, S. Pollution load capacity analysis of BOD, COD, and TSS in Karang Mumus River, Samarinda. Indones. J. Chem. 2020, 20, 626. [Google Scholar] [CrossRef]
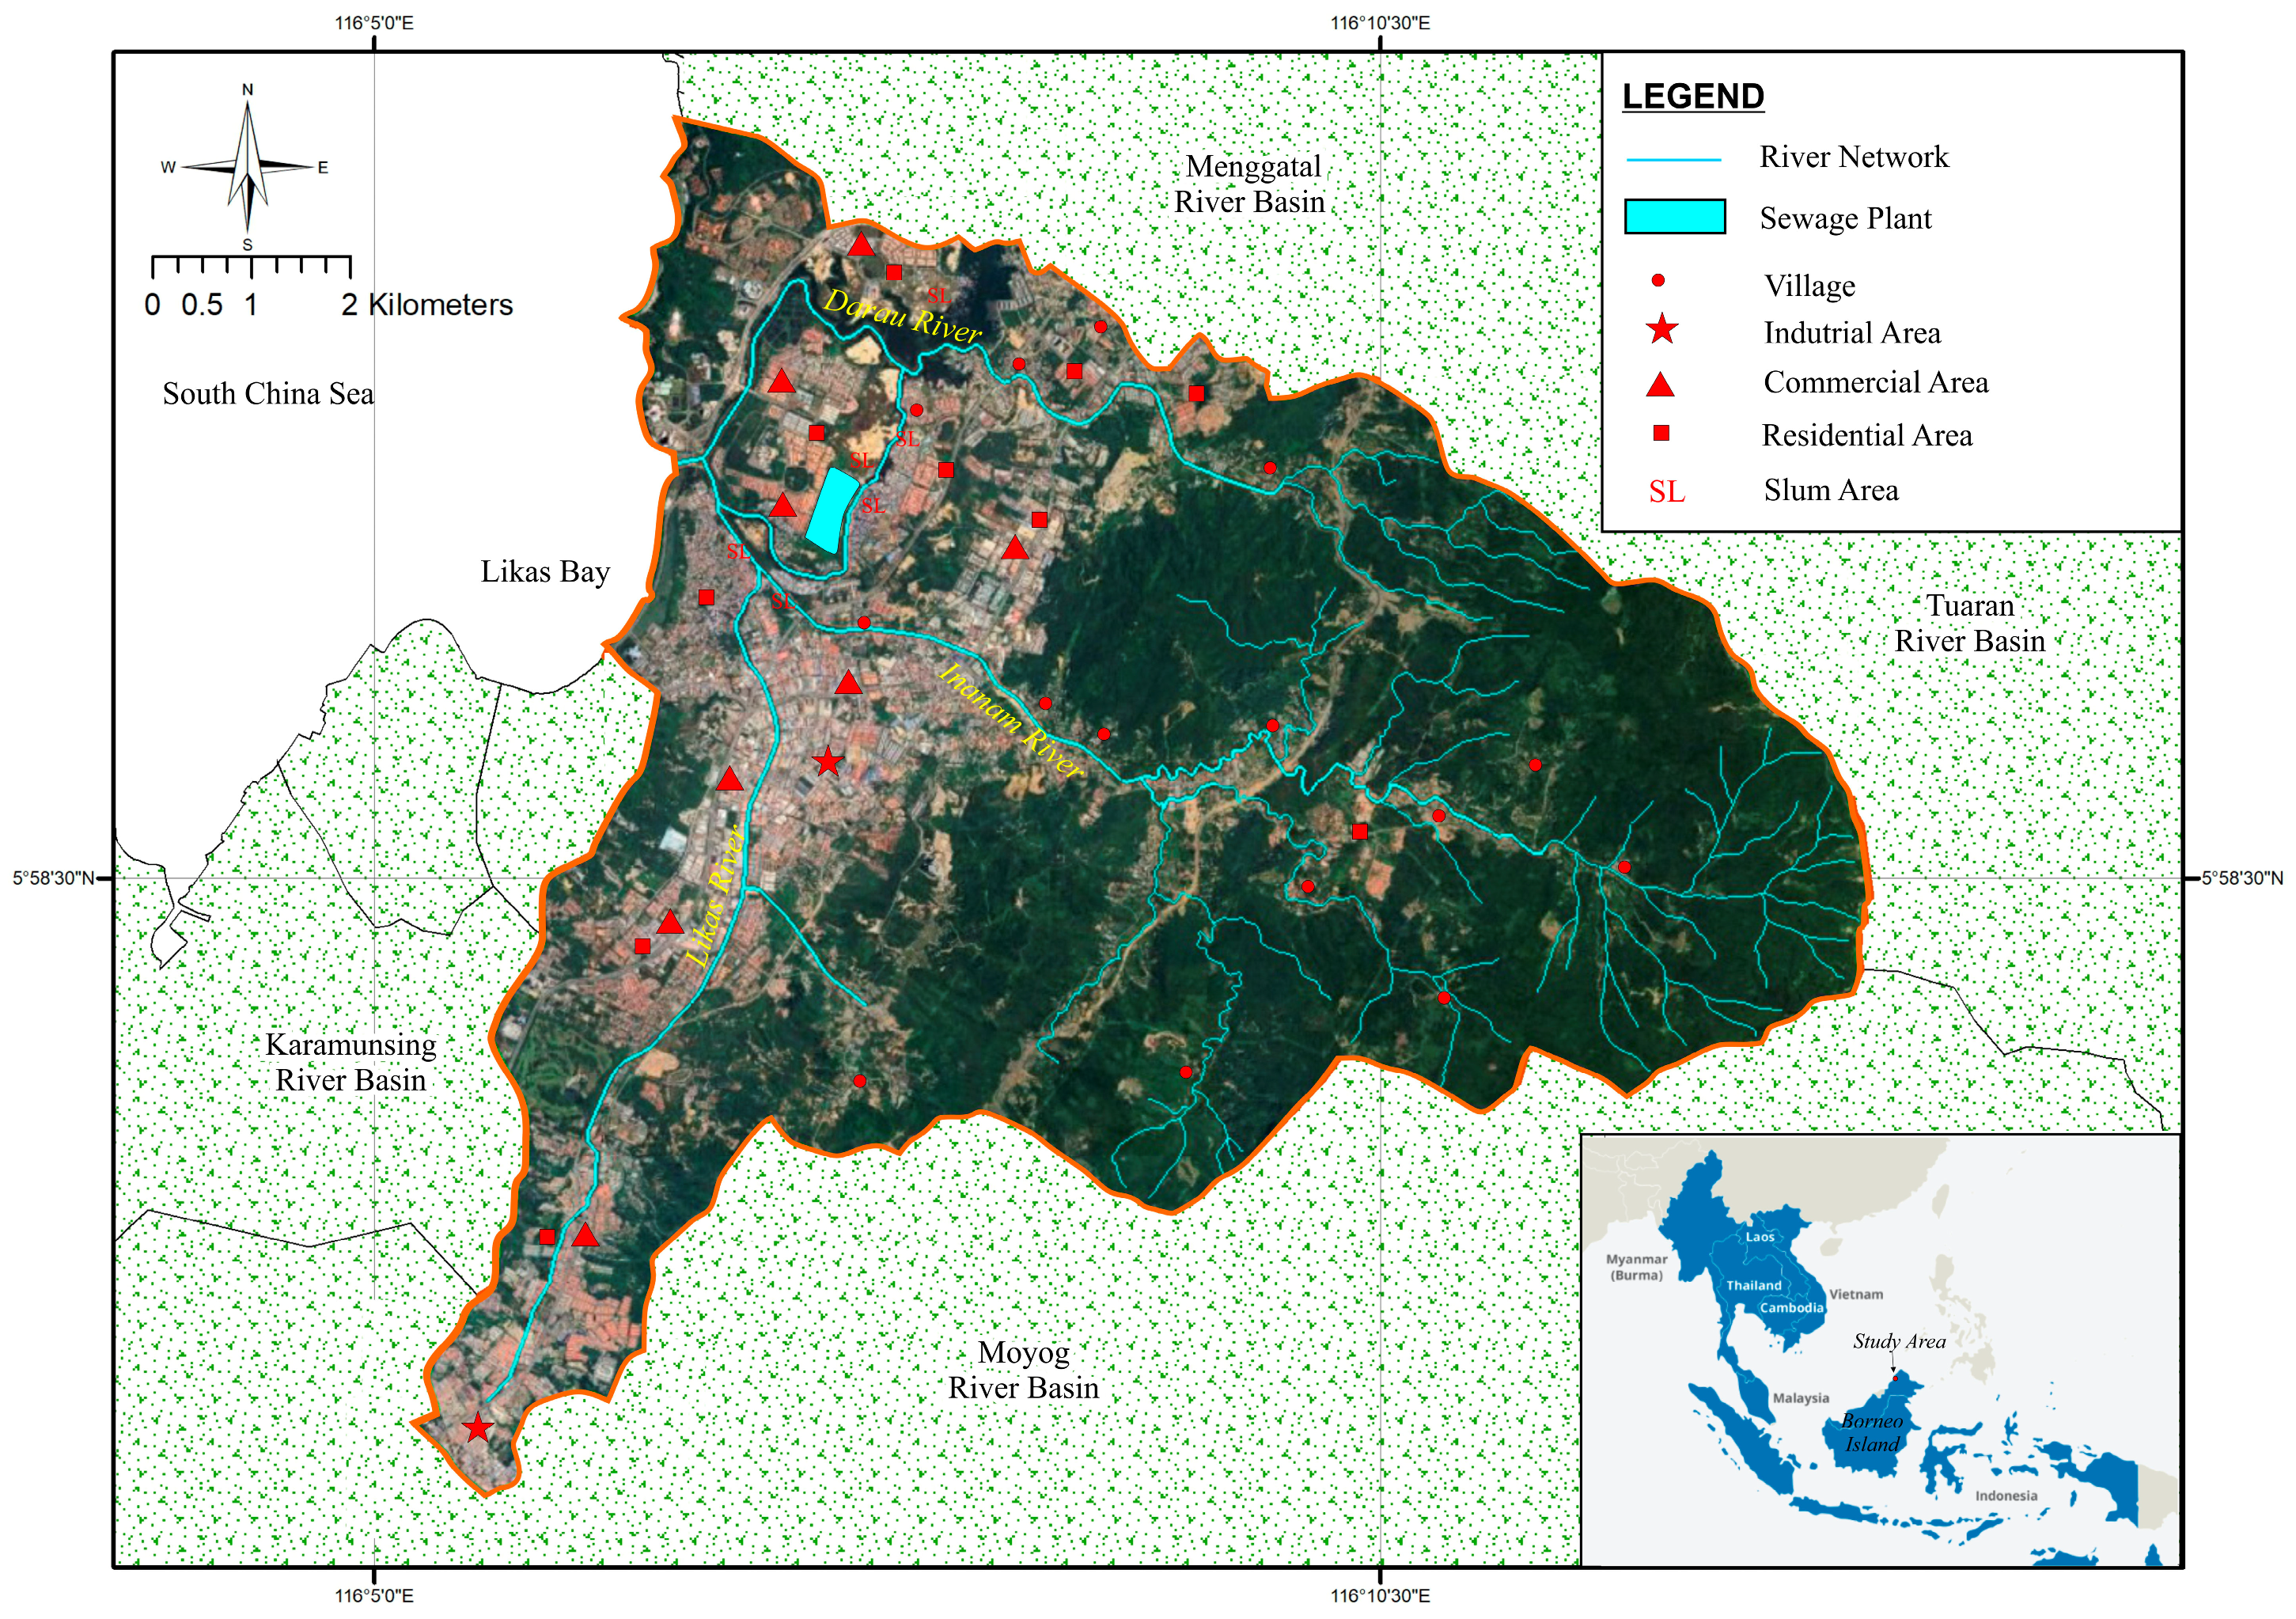
Figure 1. Land use pattern in the Inanam–Likas–Darau Basin. Source: Modified from Google Earth [64].
Water 15 02717 g001
Figure 2. Location of water quality monitoring stations in the Inanam–Likas–Darau Basin. Source: Modified from JUPEM [65,66]; DOE [67].
Water 15 02717 g002
Figure 3. WQI status of Inanam–Likas River Basin.
Water 15 02717 g003
Figure 4. BOD sub-index status of Inanam–Likas River Basin.
Water 15 02717 g004
Figure 5. NH3-N status of Inanam–Likas River Basin.
Water 15 02717 g005
Figure 6. SS status of Inanam–Likas River Basin.
Water 15 02717 g006
Figure 7. WQI trend for Inanam River from the years 1999–2019.
Water 15 02717 g007
Figure 8. WQI trends for the Likas River from the years 1999–2019.
Water 15 02717 g008
Table 1. Sampling station location and frequency.
StationGeographical CoordinatesFrequency of Sampling/YearNumber of Sampling
D1—DARAU 1116°8′38.46″ E 6°1′10.57″ N2017 (3) and 2018 (6)9
D2—DARAU 2116°7′4.97″ E 6°1′10.17″ N2014–2017 (5) and 2018 (6)26
I1—INANAM 1116°8′18.94″ E 5°59′43.18″ N2014–2017 (5) and 2018 (6)26
I2—INANAM 2116°11′48.53″ E 5°58′32.64″ N2014–2017 (5) and 2018 (6)26
L1—LIKAS 1116°7′8.82″ E 5°59′2.45″ N2014–2017 (5) and 2018 (6)26
L2—LIKAS 2116°7′8.66″ E 5°59′36.70″ N2014–2017 (5) and 2018 (6)26
Table 2. DoE-WQI and sub-index classification.
Sub-Index and Water Quality IndexIndex Range
CleanSlightly PollutedPolluted
Biochemical Oxygen Demand (BOD)91–10080–900–79
Ammoniacal Nitrogen (NH3-N)92–10071–910–70
Suspended Solids (SS)76–10070–750–69
Water Quality Index (DoE-WQI)81–10060–800–59
Source: DoE [67].
Table 3. DoE-WQI min, max, mean (median), and standard deviation for Inanam–Likas River Station.
StationMinMaxMean (Median)Standard Deviation
DARAU 1 60.493.673.9 (72.8)11.8
DARAU 257.27869.2 (69.1)5.8
INANAM 152.382.571.9 (73.7)7
INANAM 269.586.879.1 (80.1)5.7
LIKAS 173.792.283.6 (84.8)5.7
LIKAS 259.894.587.0 (89.4)8.5
LIKAS-INANAM52.394.577.9 (77.3)9.6
Note: Clean (81–100); slightly polluted (60–80); polluted (0–59).
Table 4. BOD DoE-WQI sub-index min, max, mean (median), and standard deviation for Inanam–Likas River station.
StationMinMaxMean (Median)Standard Deviation
DARAU 1 43.291.974.4 (79.3)14.6
DARAU 238.383.566.9 (68.8)13.6
INANAM 134.091.970.7 (78.1)16.0
INANAM 248.696.282.3 (96.5)13.9
LIKAS 151.596.685.5 (91.9)14.0
LIKAS 236.196.680.5 (83.5)17.5
LIKAS-INANAM34.096.677.0 (79.3)16.3
Note: Clean (91–100); slightly polluted (80–90); polluted (0–79).
Table 5. NH3-H DoE-WQI sub-index min, max, mean, (median), and standard deviation for Inanam–Likas River Station.
StationMinMaxMean (Median)Standard Deviation
DARAU 1 6.499.638.8 (10.7)45.6
DARAU 212.532.422.6 (20.2)6.7
INANAM 132.748.039.1 (38.6)5.4
INANAM 248.866.457.7 (57.7)4.8
LIKAS 167.183.773.9 (72.2)5.5
LIKAS 284.899.593.7 (93.2)4.0
LIKAS-INANAM6.499.656.2 (56.8)27.5
Note: Clean (92–100); slightly polluted (71–91); polluted (0–70).
Table 6. SS DoE-WQI sub-index min, max, mean (median), and standard deviation for Inanam–Likas River Station.
StationMinMaxMean (Median)Standard Deviation
DARAU 1 66.592.280.3 (79.7)7.1
DARAU 25096.972.4 (71.7)15.5
INANAM 110.990.569.7 (69.6)15.3
INANAM 2893.969.9 (77.1)21.7
LIKAS 125.696.973.5 (80.6)19.1
LIKAS 216.596.979.7 (87.2)19.6
LIKAS-INANAM896.973.5 (77.3)18.1
Note: Clean (76–100); slightly polluted (70–75); polluted (0–69).
Table 7. Mann–Kendall for Inanam–Likas River from the years 1999–2019.
InanamLikas
Kendall’s tau0.030.58
S5120
Var(S) 1061.671087.33
p-value0.9020.0003
alpha0.050.05
Sen’s Slope (Q) −0.2350.556
Disclaimer/Publisher’s Note: The statements, opinions and data contained in all publications are solely those of the individual author(s) and contributor(s) and not of MDPI and/or the editor(s). MDPI and/or the editor(s) disclaim responsibility for any injury to people or property resulting from any ideas, methods, instructions or products referred to in the content.