Article

The Impact of Land—Use Composition and Landscape Pattern on Water Quality at Different Spatial Scales in the Dan River Basin, Qin Ling Mountains

1
State Key Laboratory of Loess and Quaternary Geology, Institute of Earth Environment, Chinese Academy of Sciences, Xi’an 710061, China
2
University of Chinese Academy of Sciences, Beijing 100049, China
3
Shaanxi Key Laboratory of Qin ling Ecological Security, Shaanxi Academy of Sciences, Xi’an 710043, China
4
School of Environmental and Chemical Engineering, Xi’an Polytechnic University, Xi’an 710048, China
*
Author to whom correspondence should be addressed.
Water 2023, 15(18), 3276; https://doi.org/10.3390/w15183276
Submission received: 18 June 2023 / Revised: 10 July 2023 / Accepted: 14 September 2023 / Published: 16 September 2023
(This article belongs to the Special Issue Studies on Water Resource and Environmental Policies)

Abstract

:
To study the impact of land—use structure and landscape pattern on water quality at different spatial scales in the Dan River Basin (Qin Ling Mountains, China), water samples from 21 sites along the Dan River were collected in 2022 during the dry and wet seasons, and nine water quality indices were tested. Land—use composition and landscape pattern indices at riverine reach, riparian, and sub—basin were obtained, and correlation analysis and redundancy analysis (RDA) were used to determine the relationship with water quality. The results are as follows. (1) Water quality in the Dan River is better in the wet season than in the dry season; the main pollutants are total nitrogen (TN) and total phosphorus (TP). (2) The impact of land—use composition and landscape pattern on water quality has a scale effect; riverine reach can best explain the water quality. (3) Agricultural land and forest have the greatest impacts on water quality; agricultural land and construction land aggravate the deterioration of water quality, while forest, grassland, and water area have positive effects on water quality. The largest patch index (LPI) and contagion index (CONTAG) were positively correlated with pollutants, while Patch richness density (PRD), Patch shape (PD), Shannon’s diversity index (SHDI), and landscape shape index (LSI) were negatively correlated with pollutants, indicating that with an increase in the impact of human activities on landscapes, the degree of fragmentation decreases patch richness, landscape shape tends to be simplified, and water pollution is eventually aggravated. Land planners should focus on optimizing the land—use structure and landscape pattern to increase the diversity of the landscape. Therefore, strict environmental regulations must be established.

1. Introduction

Water quality safety is important for the survival of human society. With the rapid development of China’s economy and society, water pollution, and the uneven distribution of resources have been exposed, affecting human health and hindering the sustainable development of the economy and society. Water quality and conservation improvements have attracted widespread attention. Water resource pollution is divided into point and nonpoint source pollution [1,2,3,4]. The area affected by nonpoint source pollution is large and difficult to control, and the pollution mechanisms and influencing factors are more complex than those of point source pollution; therefore, scholars have conducted extensive research on nonpoint source pollution [5,6]. There is a close relationship between land—use structure, landscape pattern, and nonpoint source pollution [7,8,9]. Land—use structure and landscape pattern are strongly affected by human activities and affect river water quality by changing ecological processes, surface runoff, and the hydrological cycle at the basin scale [5,10,11]. Therefore, it is of great significance to study the relationship between land—use structure, landscape pattern, and water quality at the basin scale to improve river water quality, scientifically manage water resources, and optimize land—use structure.
Scholars have studied the relationship between land—use structure, landscape pattern, and river water quality at different spatial scales, such as riverine reach [12,13], riparian [14,15,16], and sub—basin [17,18] using methods such as correlation analysis and redundancy analysis [19,20]. However, owing to the influence of soil texture, hydrological processes, climate, and so on, conclusions are often inconsistent in different research areas [19]. Some studies have shown that construction and agricultural land have a significant negative impact on river water quality [21,22] and that forests and grasslands have active effects in improving water quality [23,24]. However, other researchers believe that the effects of agricultural land and grassland on water quality are more complicated [25]. Additionally, there are uncertainties in the study of spatial scales. Sliva et al. found that the impact of the sub—basin scale is greater than the buffer zone on water quality [26]. Johnson et al. concluded that the correlation between land—use composition and river water quality is highest at the riverine reach scale, while Collins et al. believed that the riparian scale can best explain water quality compared with other spatial scales [27].
The Dan River Basin in the Qin Ling Mountains of China is an important water conservation and quality assurance area of the South—to—North Water Transfer Project, which primarily supplies water to Beijing and Tianjin. The water quality safety and supply in this basin are closely related to people’s physical health and the sustainable development of the social economy. It is necessary to strengthen the protection of water resources in the Dan River Basin to ensure the safety of the water supply. This study collected water samples from the Dan River Basin in the dry and wet seasons of 2022 for testing, and calculated the landscape pattern indices and proportion of land—use types at different spatial scales. We applied correlation and redundancy analyses to explore the relationship between land—use composition and landscape pattern indices on water quality and identified the spatial scale with the greatest impact on water quality. This research is expected to find methods to reconcile economic development with water management in the Dan River Basin.

2. Materials and Methods

2.1. Study Area and Data Preparation

As the longest tributary of the Han River, the Dan River originates at the southern foot of the Feng Huang Mountains in the eastern Qin Ling Mountains of Shaanxi Province [28]. The overall length of the Dan River is 443 km, 244 km of which is in the range of, with a catchment area of 6995.9 km2 (Figure 1). The annual average temperature in the river basin is 12~14.5 °C, and the annual average precipitation is 613.1~866 mm.
Data from a 30 m precision digital elevation model (DEM) (http://www.gscloud.cn/, accessed on 20 October 2021) were used, and land—use types of the Dan River were obtained from Landsat satellite data by ERDAS and divided into six categories: agricultural land, forest, construction land, grassland, water area, and unused land (Figure 1). Based on administrative divisions, topography, urban construction, watershed distribution, and the results of hydrological analysis in ArcGIS 10.2 (ESRI, Redlands, CA, USA), the Dan River Basin was divided into 10 sub—basins (Figure 1). Three spatial scales (1000 m riverine reach, 1000 m riparian, and sub—basin) of landscape pattern indices were extracted [12,14]. Water samples were collected from the Dan River Basin in February (dry season) and July (wet season) of 2022; a total of 40 water samples were collected from 21 sampling sites, which were located at the main stream and tributaries of the 10 sub—basins, and 1 was located at the Shan—Hubei junction (Figure 1). Nine typical in—dices were selected and tested by the specific method of the national standard to evaluate water quality, including dissolved oxygen (DO), chemical oxygen demand (COD), total nitrogen (TN), total phosphorus (TP), ammonia nitrogen (NH3–N), nitrate nitrogen (NO3–N), nitrite nitrogen (NO2–N), hexavalent chromium (Cr6+), and total organic carbon (TOC) [29].

2.2. Data Analysis

The average comprehensive pollution index (ACPI) method was adopted in the study. The ACPI was calculated using Equations (1) and (2) and the evaluation classification is in Table A1:
Pi = Ci/Si(When the pollution index is the dissolved oxygen Pi = Si/Ci)
P = 1 n i = 1 n Pi
where Ci is the measured value; Si is the limit value from the national standard for Surface Water [29]; n is the number of evaluation indicators; Pi is the sub—index of parameter i; P is the ACPI [30].
Spatial interpolation analysis in ArcGIS 10.2 was used to obtain the spatial distribution of the water quality indices in the dry and wet seasons. Six landscape pattern indices were selected, including the patch density (PD), patch richness density (PRD), largest patch index (LPI), landscape shape index (LSI), Shannon’s diversity index (SHDI), and contagion index (CONTAG) [31,32], which were calculated using Fragstats 4.2, and their ecological concepts are shown in Table A2 [33,34]. SPSS (IBM SPSS Inc., Chicago, IL, USA) was used to analyze correlations among the proportion of land—use types, landscape pattern indices, and water quality at three spatial scales [35,36]; the spatial scale with the greatest correlation with water quality was selected for redundancy analyses (RDA). Canoco 5.0 was used to perform RDA and calculate the contribution rates of environmental variables. In the two—dimensional ranking plot of RDA, the length of the arrows represents the influence of environmental variables on species, and the angle between the two arrows indicates the correlation between the two variables [14,37].

3. Results

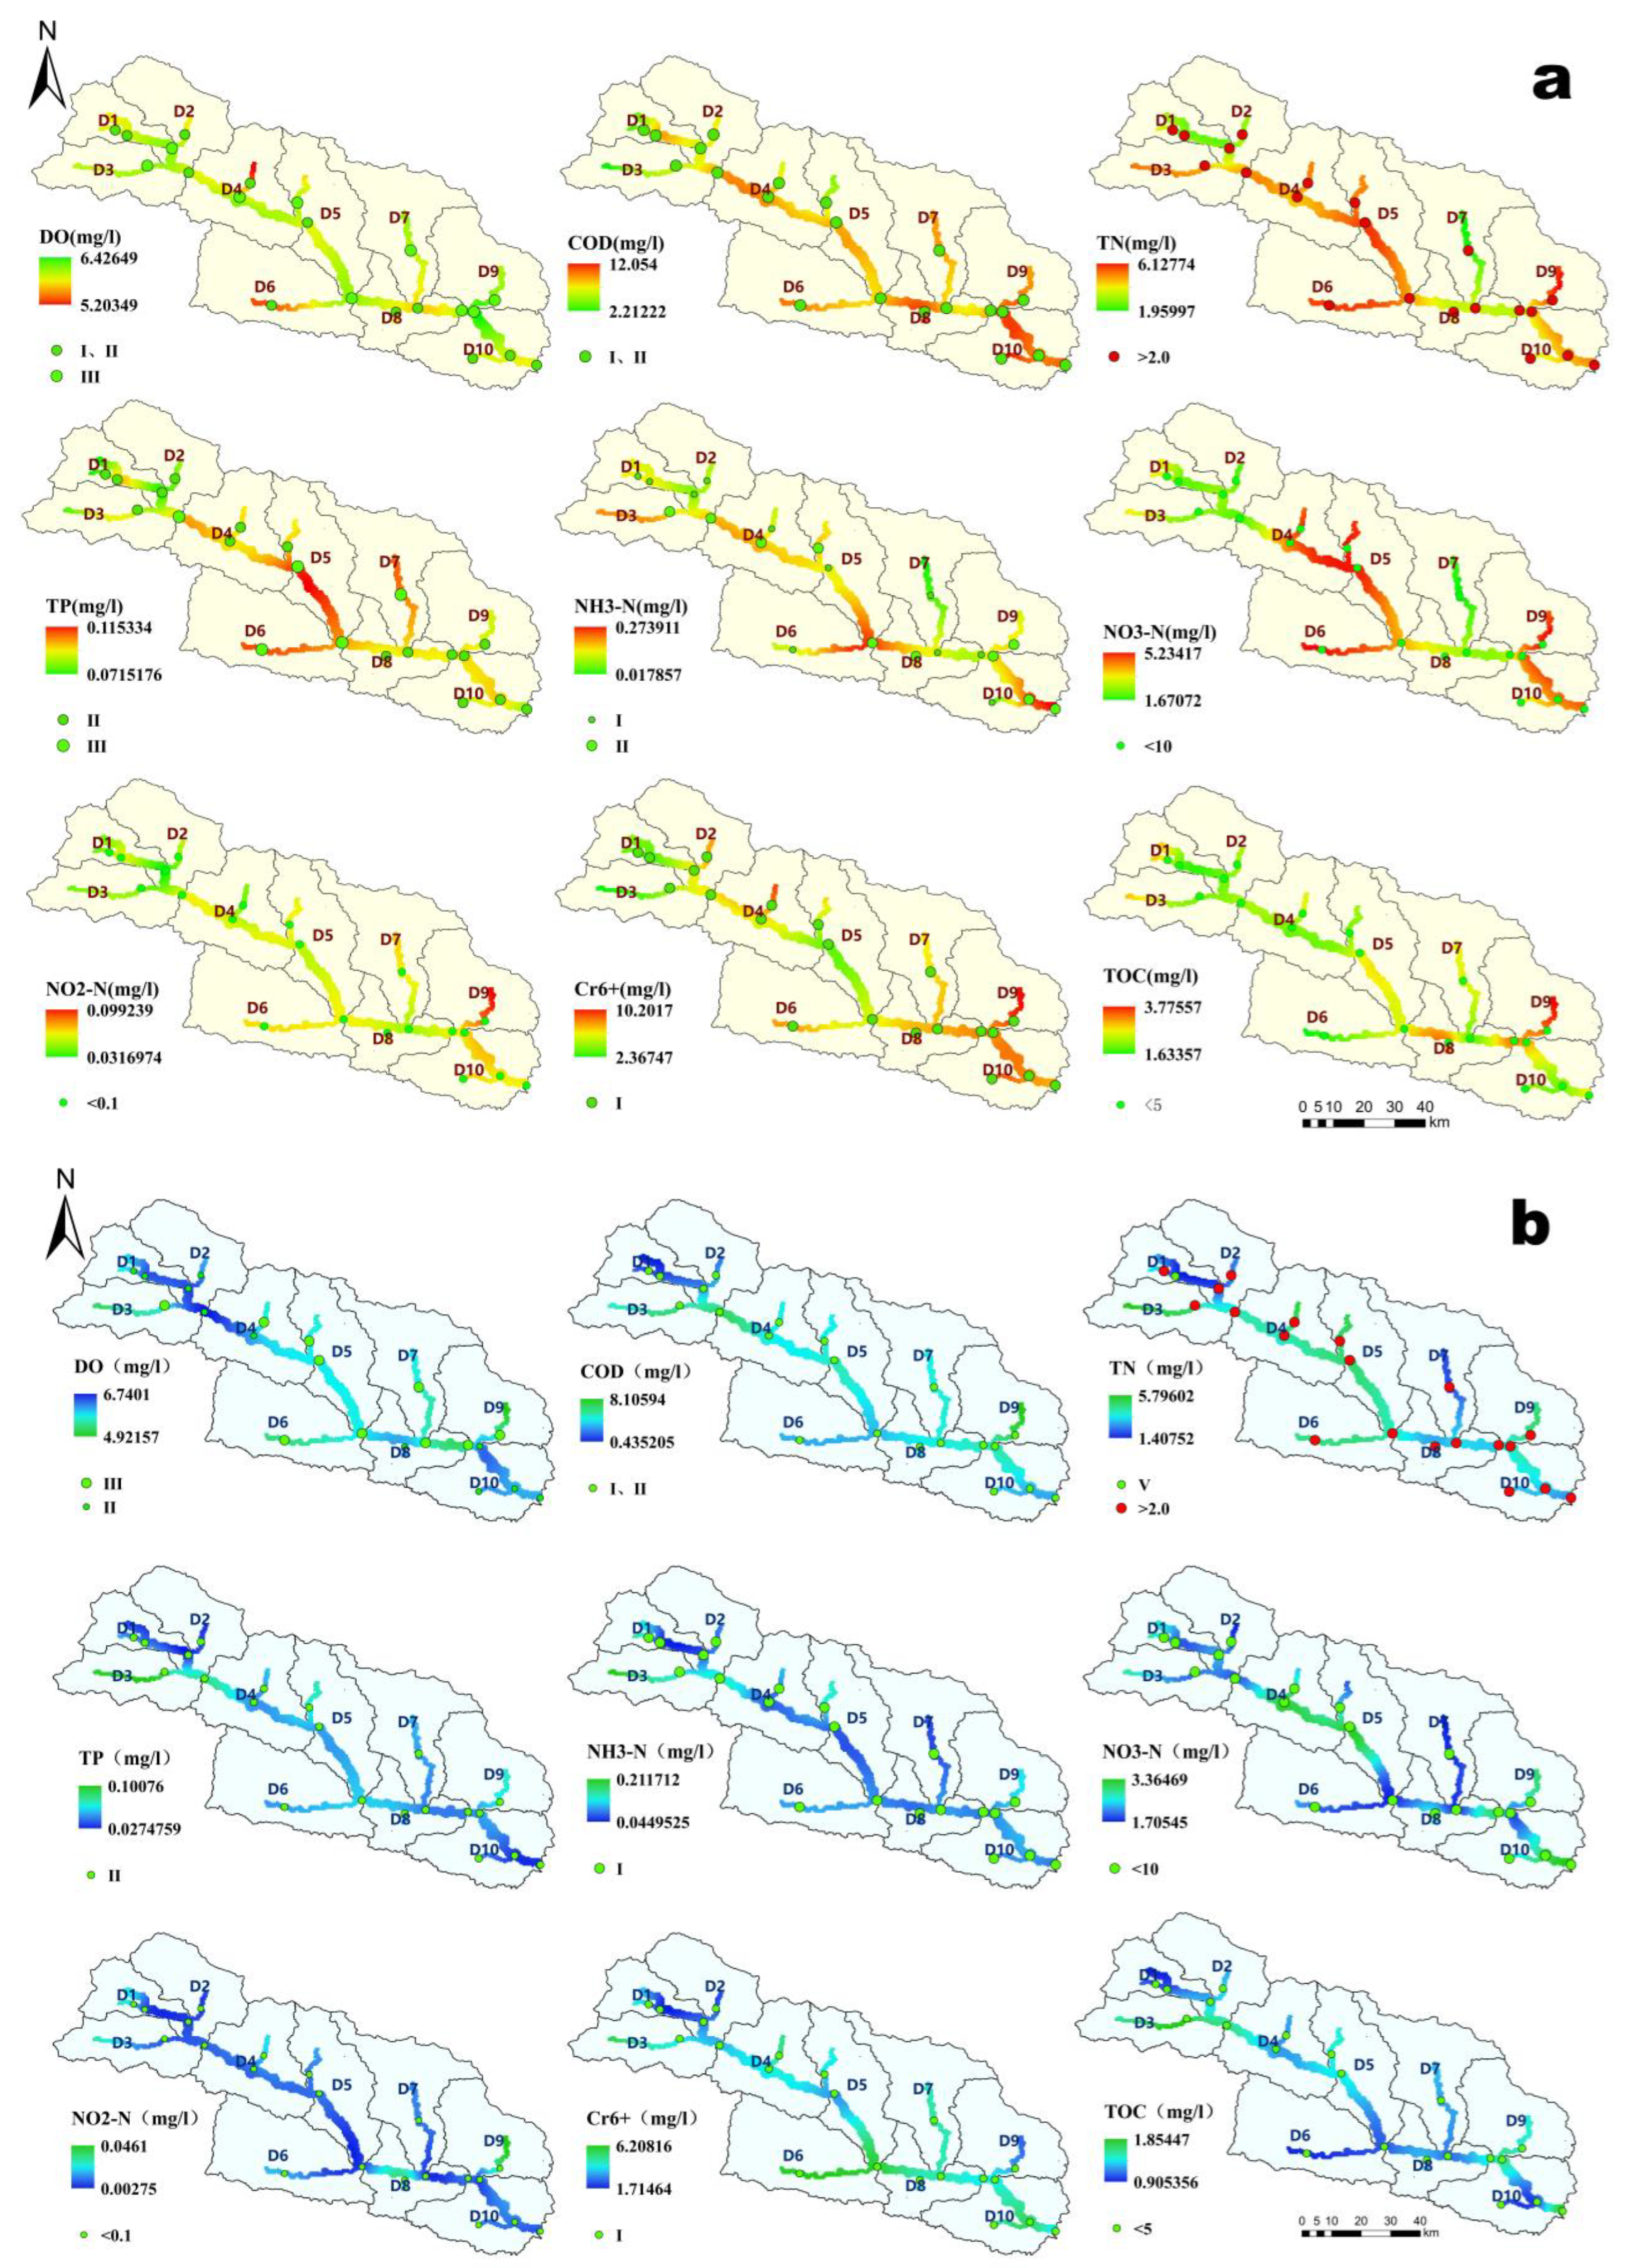
3.1. Temporal and Spatial Distributions of Water Quality

As shown in Table A3, COD, TN, NH3–N, and NO3–N had great spatial variability, ranging from 19.99% to 34.73%, 25.14% to 27.99%, 22.3% to 43.38%, and 21.15% to 32.67%, respectively. Except for DO, the concentrations of eight indices were significantly higher in the dry season than those in the wet season (p < 0.05) (Figure 2). According to the limited values of Class II in the National Environmental Quality Standard for Surface Water [29], the exceeding rates of TP and TN were 24% and 100% in the dry season, respectively. The concentration of TN exceeded the limit value of Class V by 95% in the wet season.
During the dry season, D4–D6 had the highest values of TN, TP, NH3–N, and NO3–N (Figure 3a). COD, TN, NO3–N, NO2–N, and Cr6+ had the highest values of sub—basin D9 and D10. In the wet season, D3 and D4 had the highest COD, TN, TP, NH3–N, and TOC concentrations (p < 0.05). High concentrations of TN, NO3–N, and Cr6+ were observed in D6. D9 exhibited high COD, TN, and NO2–N (Figure 3b).
ACPI in the Dan River increased in both seasons, with higher Pi values and a larger fitting slope during the dry season (Figure 4). According to the classification standard for the degree of surface water pollution (Table A1), 24% of the sampling sites were heavily polluted (S8, S9, S12, S18, and S21) and 76% were moderately contaminated during the dry season. And moderately and mildly polluted sites accounted for 48% and 52%, respectively, during the wet season (Figure 4).

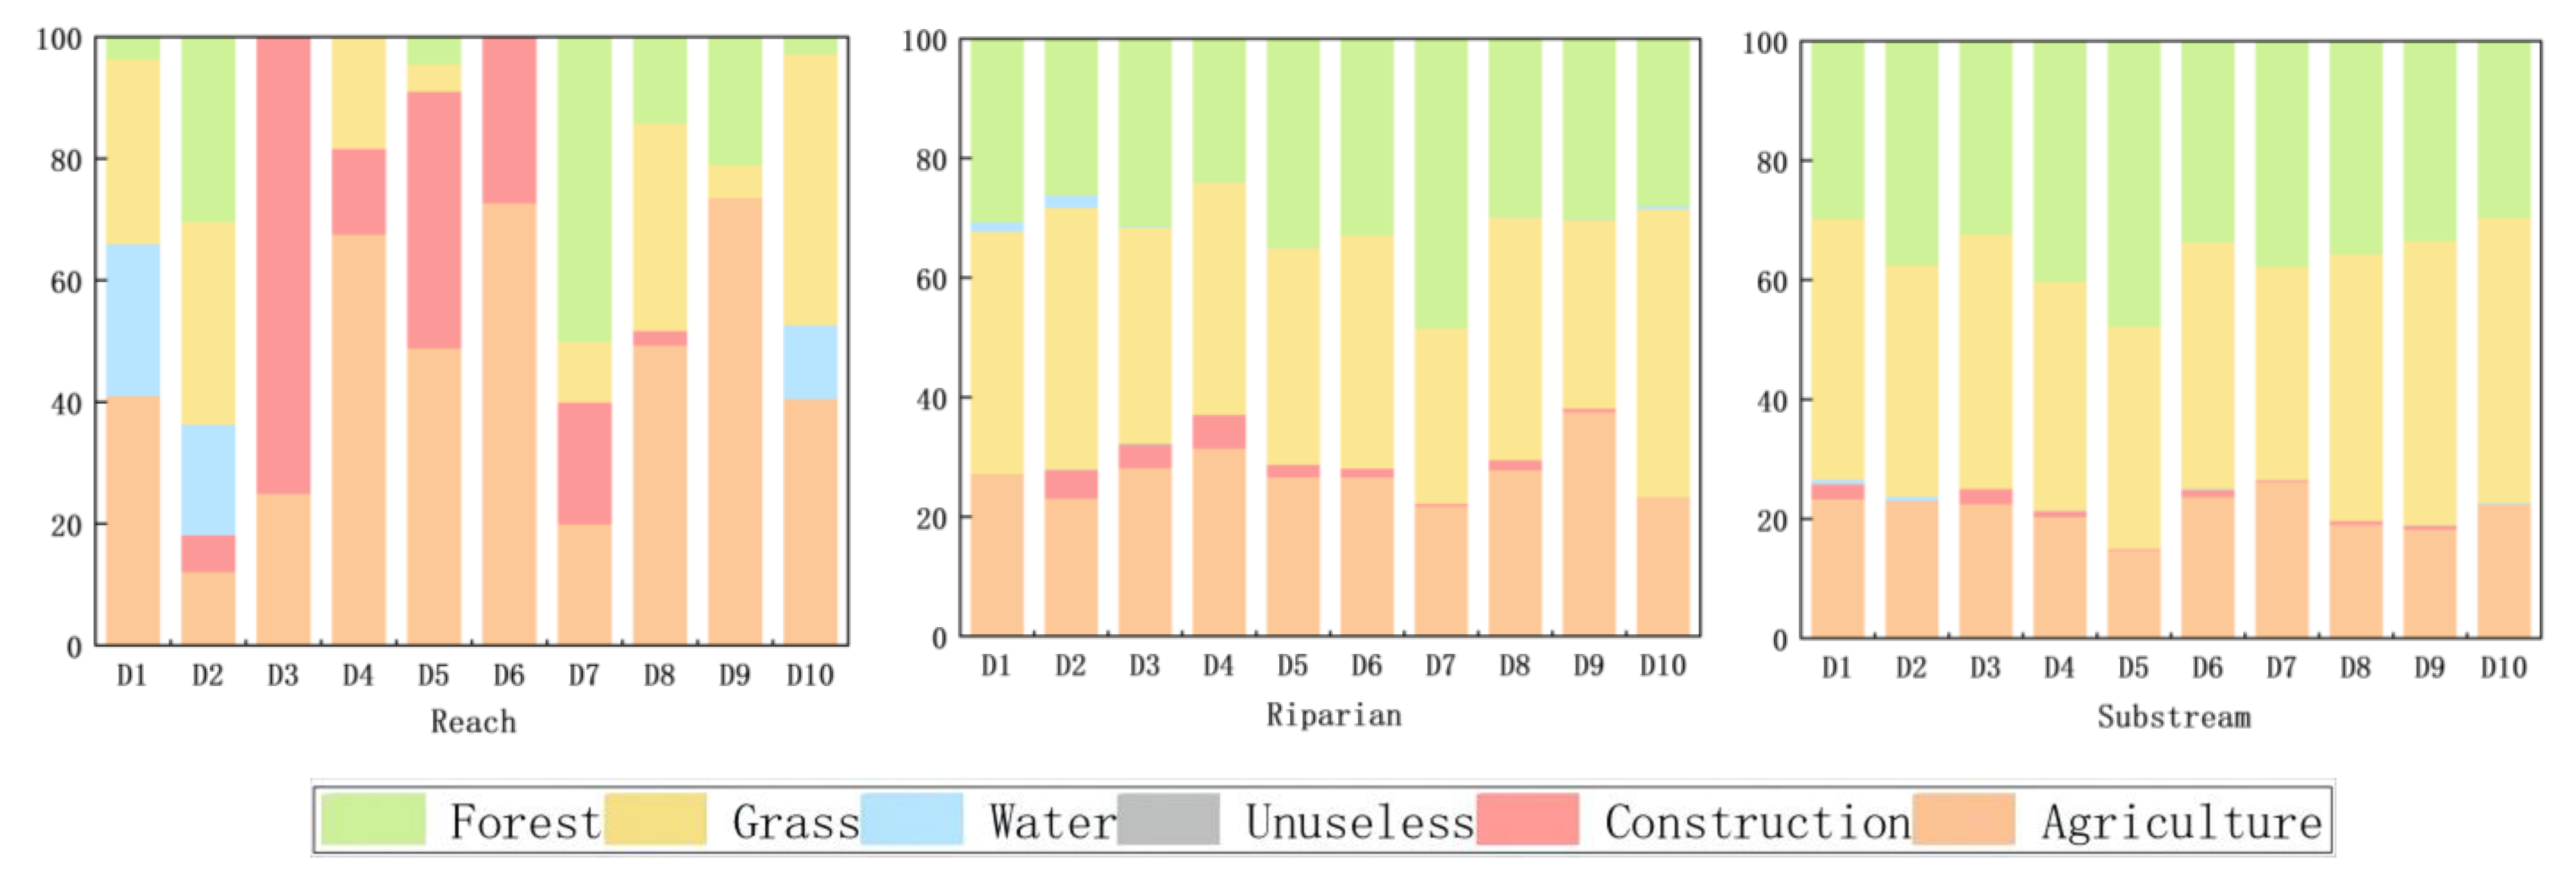
3.2. Land—Use Composition and Landscape Pattern Indices

The land—use composition of the three scales in the Dan River Basin is shown in Figure 5. There was significant spatial heterogeneity in land—use structure. At the riverine reach scale, agricultural land accounts for the largest proportion, ranging from 12% to 74%, followed by construction land, forests, and grassland. For D3, D4, D5, D6, and D9, agricultural land and construction land with relatively severe human disturbance occupy the largest proportions, among which D3 and D6 account for 100%. Forest, grassland, and water are the primary land types on D1, D2, D7, and D10, respectively. At the riparian and sub—basin scales, land—use patterns consist of agricultural land, grassland, and forests, among which grassland accounts for the largest proportion, ranging from 29% to 49%, followed by forests and agricultural land. With an increase in spatial scale, the proportion of agricultural and construction land gradually decreases, whereas the proportion of forest and grassland increases.
The values of landscape pattern indices vary across the three spatial scales (Table 1). The LPI, PD, and PRD values decrease with increasing spatial scale, whereas those of LSI and CONTAG increase. SHDI is the largest in the riparian area, followed by sub—basin. With the expansion of spatial scale, the landscape shows less heterogeneity and fragmentation, stronger connectivity, less human influence, and better stability. However, the shapes of the patches become more complex, and the dominant patch type within the landscape decreases.

3.3. Impact of Land—Use Structure and Landscape Pattern on Water Quality

3.3.1. Effects of Land—Use Structure on Water Quality

Correlation analysis (Table 2) showed that correlations between the proportion of land—use types and water quality indices have scale effects, which correlations at the riverine reach are stronger than those at riparian and sub—basin. During the dry season, agricultural land is significantly positively correlated with COD, TN, NO3–N, NO2–N, and TOC, and construction land is significantly positively correlated with TP. Forests, grassland, and water area are significantly negatively correlated with TN and TP concentrations. During the wet season, agricultural land is positively correlated with TN, TP, and NO2–N, and construction land is positively correlated with TN and TP. Forests are negatively correlated with TN, grassland is positively correlated with TN, TP, and NH3–N, and water area is negatively correlated with COD, TN, TP, and NH3–N.

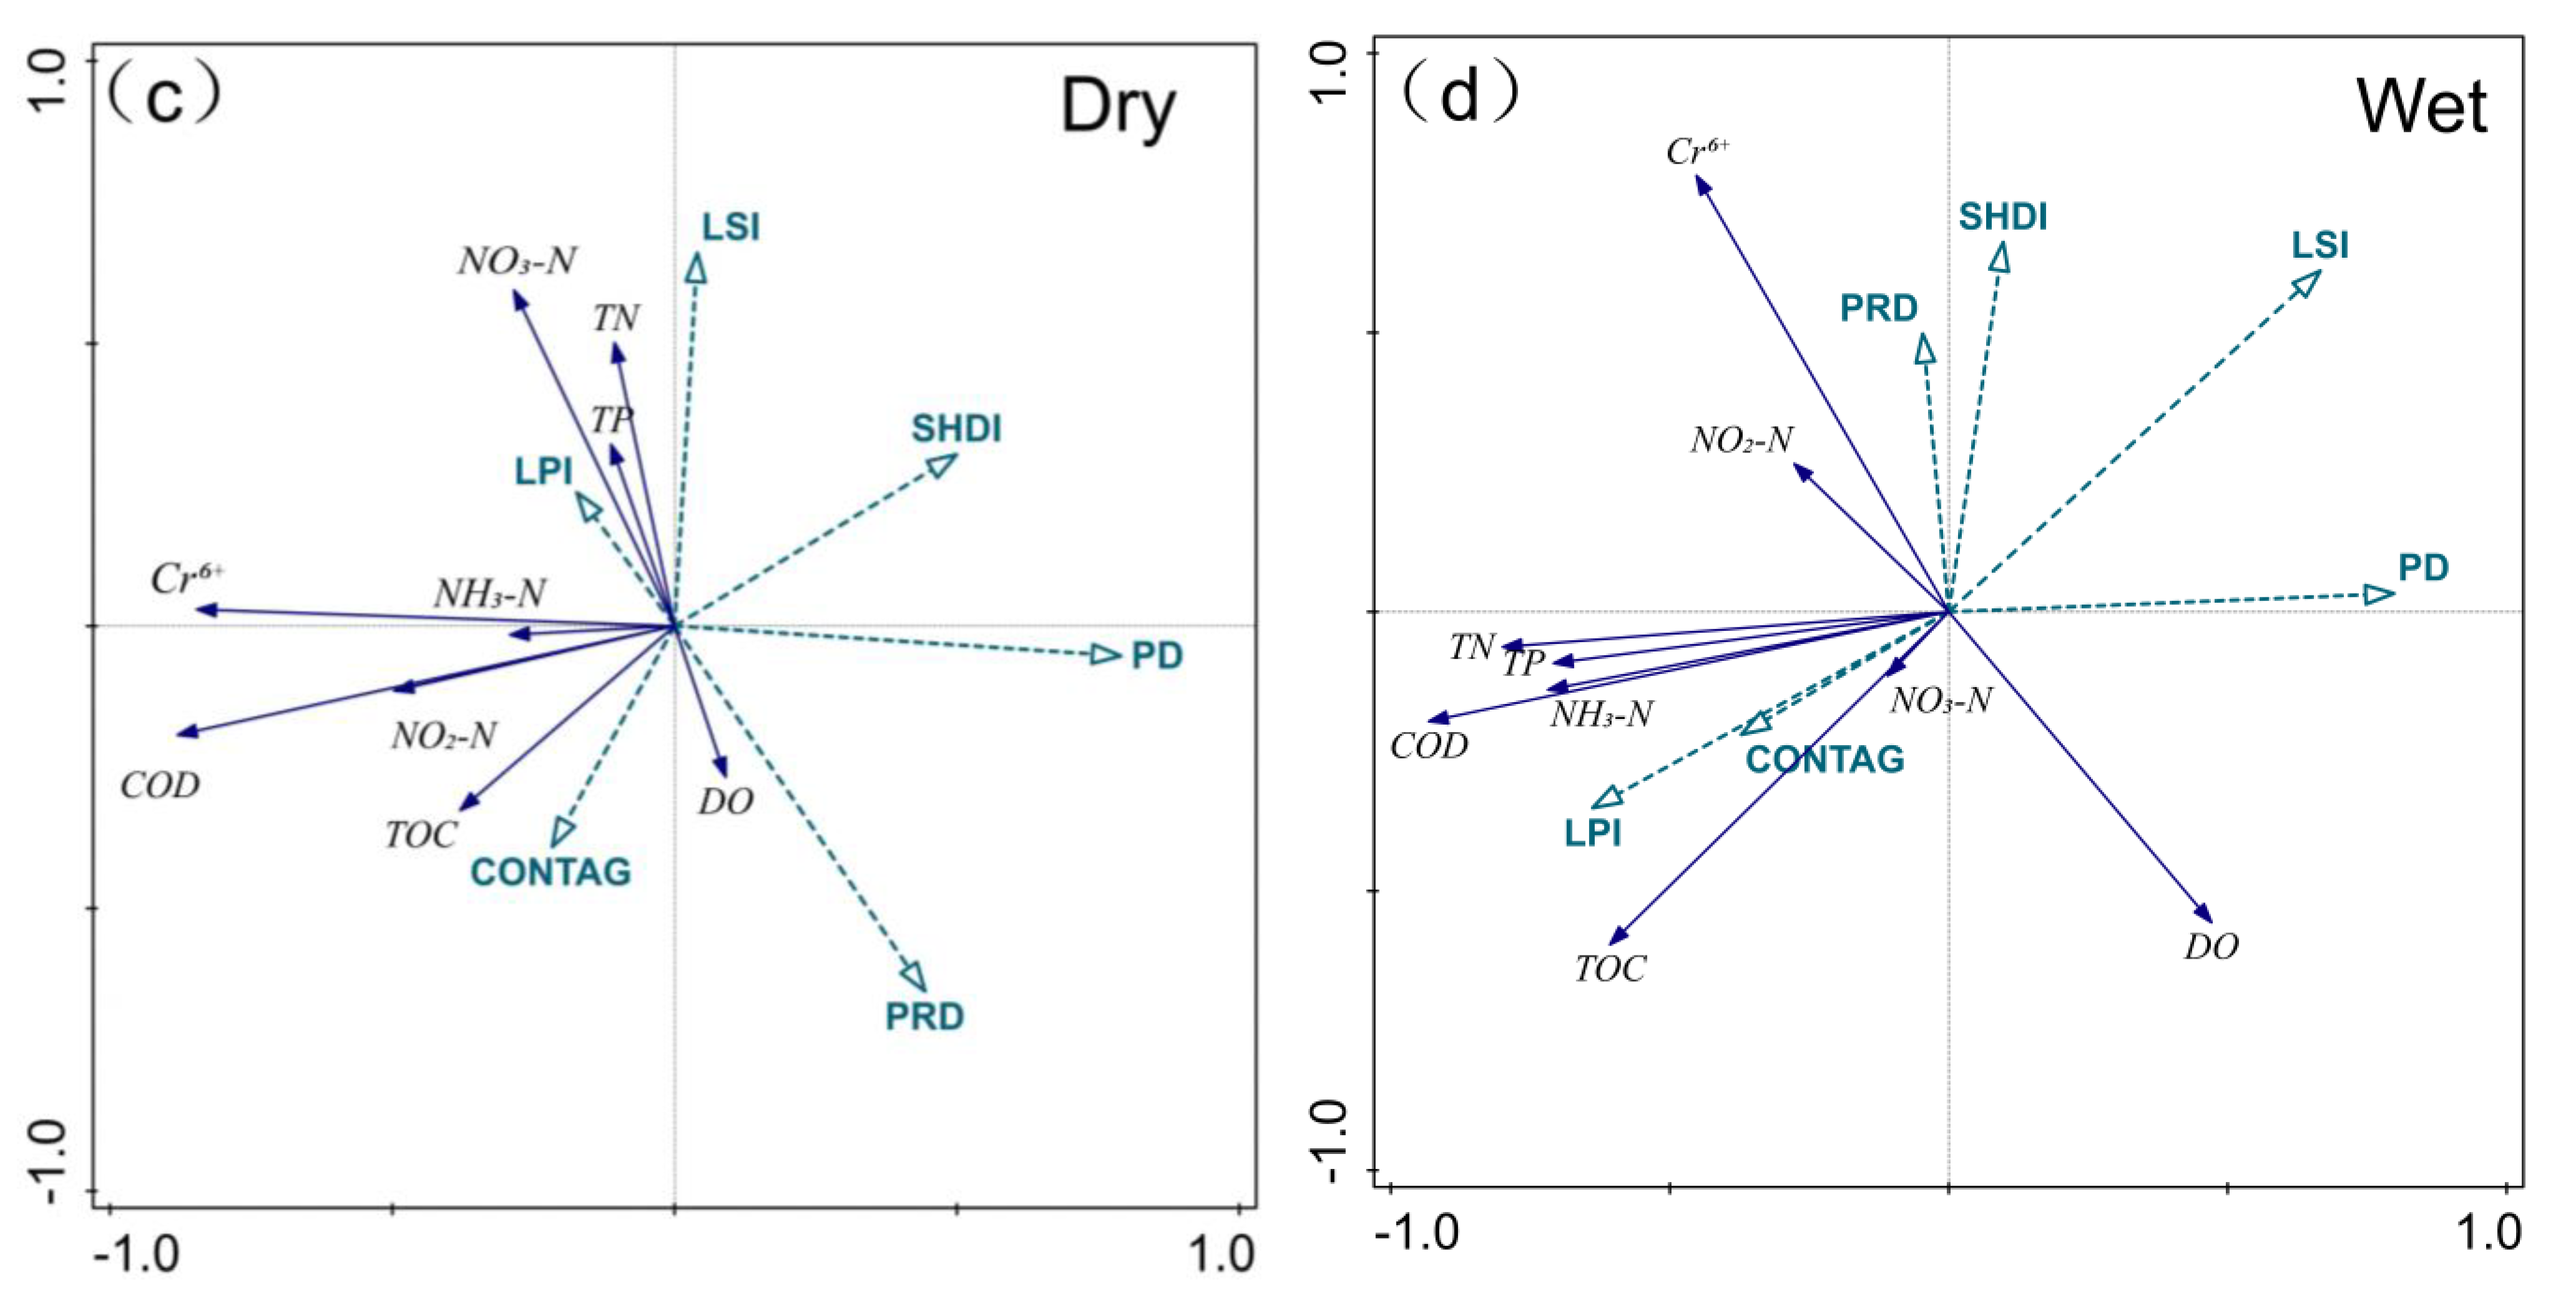
3.3.2. RDA of Land—Use Composition and Landscape Pattern Indices to Water Quality

Correlation analyses showed that among the three spatial scales, riverine reach could best explain the relationship between land—use composition and water quality. And then the total interpretation rates of land—use composition and landscape pattern indices to water quality at three spatial scales were conducted by RDA (Table 3 and Table 4), and were highest for riverine reach, followed by sub—basin and riparian reach. For land—use structure, total interpretation rates were 83.7% in the dry season, 77.2% in the wet season, and 74% and 88.5% for landscape pattern indices, respectively. Riverine reach was selected for further discussion. The interpretation rates of agricultural land, forest, and water area on water quality were relatively high, accounting for 77.2% in the dry season and 84.6% in the wet season, while construction land and grassland were relatively low, indicating that water quality is greatly affected by agricultural land, forest, and water area, and less affected by construction land and grassland. For landscape pattern indices, the interpretation rates of PD, LSI, and PRD for water quality were relatively high during the dry season, accounting for 78.4% of the total, whereas the interpretation rates of PD, SHDI, LSI, and PRD for water quality were relatively high during the wet season, accounting for 92.7%.
Figure 6 shows a two—dimensional sequence diagram of land—use composition and landscape pattern indices and their influence on water quality indices at the riverine reach scale. The correlations between water quality indices and land—use composition were the same in the dry and wet seasons (Figure 6a,b). TN, TP, NH3–N, NO3–N, NO2–N, COD, TOC, and Cr6+ were positively correlated with agricultural land and construction land and negatively correlated with forest, grassland, and water area. For landscape pattern indices (Figure 6c,d), during the dry season, TN, TP, NH3–N, NO3–N, NO2–N, COD, and Cr6+ were positively correlated with LPI and negatively correlated with PRD, PD, and SHDI; TN, TP, NH3–N, and NO3–N were positively correlated with LPI and LSI and negatively correlated with PRD, PD, SHD, and CONTAG. In the wet season, COD, TN, TP, NH3–N, NO3–N, and TOC were positively correlated with LPI and CONTAG and negatively correlated with PD, PRD, LSI, and SHDI. Cr6+ and NO2–N were positively correlated with PRD and SHDI and negatively correlated with PD.

4. Discussion

4.1. Effects of Land—Use Structure on Water Quality

Water quality in the Dan River Basin is better in the wet season and more stable than that in the dry season, and its self—purification ability is also stronger. This is mainly owing to the higher rainfall during the wet season and subsequent increase in river water volume, which has a good dilution effect on pollutants. Among the pollutants, the concentration of TN exceeded the national standard limit value of class V, which led to higher Pi values in this region; the concentration of TP in some sites exceeded the standard limit value of Class II in the dry season, indicating that the pollutant types in this basin are mainly N and P. It turned out that agricultural land is the main land—use type among all scales (Figure 5), and that agricultural land and construction land are distributed near the river bank. Human activities, such as farming and construction, may cause serious N and P pollution. Agricultural and construction land in D3–D6 account for a large proportion of the scale of the riverine reach, and sample sites in these reaches are mostly surrounded by urban residential areas, agricultural land, tourist attractions, roadways, and construction sites, where pollution is generated by production, construction, domestic garbage, and the application of pesticides and fertilizers, resulting in poor water quality [22,38,39]. Water pollution in D10 is lower, possibly owing to a decrease in towns and agricultural land, an increase in forests, and a widening of the river channel [40].
The water quality of the 21 sampling sites showed spatial heterogeneity, and the contamination of S8, S9, S12, and S18 was relatively severe, which may be because the quality of the samples was affected by the surrounding environment and land—use type of the sampling sites. S18 is a construction site that is undergoing excavation operations and S12 is located in the Yin Hua River; the nearby Wu Zhou mining industry pollutes water quality during the mining process.
Correlation and redundancy analyses showed that among the three spatial scales, the riverine reach is more strongly correlated with water quality than the other two spatial scales in the Dan River Basin, and can better explain the relationship with water quality. This conclusion conforms with those found along the Yellow River [41]. The proportions of agricultural and construction land were positively correlated with concentrations of TP, TN, NO3–N, and NO2–N [25,42], whereas forest, grassland, and water were negatively correlated with TN, TP, NH3–N, and COD [15,24,43]. These conclusions are consistent with those of previous studies. As the proportions of agricultural and construction land increases, the pollutants caused by urban residents’ living, infrastructure, industrial production, and the use of pesticides and fertilizers during cultivation will also increase, which will aggravate the pollution of water quality when entering the river. An increase in roadways also worsens the soil and water conservation of the ground and accelerates the entry of pollutants into water bodies [38,44,45]. Forests and grassland can intercept surface runoff, effectively alleviate water and soil loss, absorb pollutants, and prevent pollutants from entering water bodies [23,33,46]. A larger water area is conducive to the dilution of pollutants in the water, and it improves the self—purification of the water body, which helps improve water quality [40].
There are many human activities in agricultural and construction land, and their formation and development are greatly affected by human factors [11]. Therefore, the effect of agricultural and construction land on river water quality is greater than that of forests and grasslands. In the Dan River Basin, the water quality was less affected by construction land, which may be related to the small proportion of construction land and strict environmental supervision in this basin [47].

4.2. Effects of Landscape Pattern on Water Quality

The characteristics of landscape pattern at the three spatial scales differed (Table 1). The proportion of construction land at sub—basin and riparian scales was small (Figure 5), but the shapes of landscape patches at the riverine reach scale were simple, with high fragmentation and poor connectivity. This indicates that the proportion of agricultural land and towns where the river flows are relatively large and greatly affected by human activities, suggesting that the land—use structure and urban pattern of the Dan River Basin are unreasonable. The RDA of the landscape pattern indices and water quality indices showed that PD, LSI, and PRD have a significant impact on water quality, which indicates that the density, richness, shape, and fragmentation degree of the landscape at the riverine reach scale significantly impacts water quality [33]. TN, TP, NH3–N, and NO3–N were positively correlated with LPI and CONTAG and negatively correlated with PRD, PD, and SHDI [48], whereas NH3–N, NO2–N, COD, and TOC were negatively correlated with LSI. LPI shows the abundance of dominant types in the landscape and the degree of human influence. The more the landscape pattern is affected by human activities, the more complex the factors that affect water [45]. PD represents the fragmentation of the landscape, and CONTAG represents the connectivity of the landscape. The higher the degree of fragmentation, the worse the connectivity, which prevents pollutants from entering the water body and helps to alleviate water pollution [49]. PRD shows the richness and stability of the landscape patches in this basin. With an increase in patches, the landscape becomes more stable, and the ability to respond to environmental changes that maintain the stability of water quality becomes stronger. LSI shows the regularity of the shape of the patches. Generally, the greater the effect of human activities, the more regular the shape of the patches. The analysis results showed that with a decrease in the LSI, the landscape was more affected by human activities, and water pollution was aggravated.

4.3. Optimization of Water Quality and Landscape Pattern

Based on the above discussion, it is suggested that land managers and planners should focus on optimizing the structure of agricultural and construction land by reducing aggregation and increasing connectivity between forests and grassland. The proportion of grassland and forests along rivers should be increased, and inferior farmland should be returned to forest and grassland to reduce soil erosion and increase the interception and absorption of pollutants. In addition, to reduce pollutants such as TN and TP in water, it is necessary to improve crop cultivation techniques, reduce the use of pesticides and fertilizers, and develop new fertilizer formulas.
The production and construction projects with pollutant emission risks along the river should be supervised strictly to reduce the impacts of production and construction projects on water quality. Simultaneously, it is necessary to develop strict monitoring and implementation measures and a protection responsibility system for each river section and detect and deal with pollution incidents in time.

5. Conclusions

Applying correlation analysis and redundancy analysis, this paper studied the impact of land—use structure and landscape pattern on water quality at different spatial scales in the Dan River Basin, based on 21 water samples and land—use data in 2022, and concluded that:
(1) The water quality of the Dan River Basin has spatial and temporal heterogeneities. The water quality of each sampling point is different, and that in the wet season is better than that in the dry season; the main pollutants are nutrient elements such as N and P, which should be controlled.
(2) The main land—use types in the Dan River Basin are agricultural land, forest land, and grassland. There are scale effects on the effects of land use and landscape pattern characteristics on water quality. Among three spatial scales (riverine reach, riparian, and sub—basin), riverine reach best explains the water quality variation. Therefore, the scale effect should be considered during land—use planning.
(3) For land—use structures, agricultural land and forest have the greatest impacts on water quality, and increased proportions of agricultural and construction land leads to increases in pollutants in the water, which aggravates the deterioration of water quality, whereas forests, grassland, and water area alleviate water pollution. For the landscape pattern indices, pollutants are positively correlated with LPI and CONTAG and negatively correlated with PRD, PD, SHDI, and LSI. In other words, the more the landscape is influenced by humans, the simpler the shape of the patches, and the worse the water quality. The more abundant the landscape patches, the more stable the landscape pattern, and the more conducive it is to alleviating water pollution.
(4) Land managers and planners should focus on optimizing the land—use structure and landscape pattern, incorporating the scale effect into the plan, controlling the proportion of agricultural land, increasing the diversity of the landscape, reducing the aggregation and connectivity of agricultural land and cities, and increasing the proportions of grassland and forest along rivers. Therefore, strict environmental regulations must be established.

Author Contributions

Formal analysis, visualization and writing—original draft preparation, Y.Z. (Yuanyuan Zhang); writing—review and editing, Y.Z. (Yan Zhao); investigation, Y.Z. (Yuanyuan Zhang), H.Z. and J.C. (Jing Cao); methodology and validation, Y.Z. (Yuanyuan Zhang), J.C. (Jing Cao), and J.C. (Jingshu Chen); funding acquisition, C.S.; project administration and supervision, Y.C. All authors have read and agreed to the published version of the manuscript.

Funding

The research was funded by the Natural Science Basic Research Plan in Shaanxi Province of China (Program No.2021JQ−676).

Data Availability Statement

The data used in the current study are available from the corresponding author upon reasonable request.

Acknowledgments

We would like to express our gratitude to the Natural Science Basic Research Plan for the funding and support.

Conflicts of Interest

We declare that we have no competing financial interests or personal relationships that could have appeared to influence the work reported in this study.

Appendix A

Table A1. Comprehensive pollution index evaluation classification.
ValuePollution Level
≤0.20clean
0.21~0.40Still clean
0.41~0.70Mild pollution
0.71~1.00Moderate pollution
1.01~2.00Heavy pollution
>2.00Serious pollution
Table A2. Landscape pattern index and its ecological significance.
Landscape Pattern IndexEcological Significance
Patch density (PD)Describing the degree of spatial heterogeneity and fragmentation of the landscape, and the larger the value, the higher the degree of heterogeneity and fragmentation.
Patch richness density (PRD)Referring to the abundance of patches per unit area, which reflects the diversity of patch types within the landscape, the more abundant the patches, the stronger the ability to resist external disturbances.
Largest patch index (LPI)Reflecting the dominant type of landscape, the value range is (0,100), and the size of its value determines the landscape dominant species and internal species abundance. And it also reflects the direction and strength of human activities.
Contagion index (CONTAG)Reflecting the degree of agglomeration or extension trend of different patch types in the landscape, with a value range of (0,100). The high contagion value indicates that a certain dominant patch type in a landscape forms a good connectivity; otherwise, it indicates that the landscape is a dense pattern with many elements and has a high degree of fragmentation.
Shannon’s diversity index (SHDI)Reflecting the heterogeneity of landscape systems. The large SHDI value indicates that the degree of landscape fragmentation is high, and there are many types of blocks in the landscape or the distribution of each block type in the landscape is balanced.
Landscape shape index (LSI)Indicates the degree of plaque regularity, and a large value indicates that the plaque is irregularly shaped.
Table A3. Descriptive statistics of various water quality indicators.
IndexMaximumMinimumMean ValueSDCV (%)
DO (mg/L)Dry5.3876.4005.9360.2263.81
Wet5.4186.7376.0210.3365.58
COD (mg/L)Dry5.50912.0108.6361.72619.99
Wet1.5337.1174.1571.44434.73
TN (mg/L)Dry2.0975.7364.2361.06525.14
Wet1.8764.8493.4950.97927.99
TP (mg/L)Dry0.0730.1120.0940.01111.29
Wet0.0310.0810.0510.01325.76
NH3–N (mg/L)Dry0.0320.3010.1520.06643.38
Wet0.0630.1400.0920.02022.30
NO3–N (mg/L)Dry1.7075.1663.5951.17532.67
Wet1.7593.3712.4160.51121.15
NO2–N (mg/L)Dry0.0320.0890.0600.01219.83
Wet0.0060.0360.0140.00860.11
Cr6+
(μg/L)
Dry2.9559.6936.7311.87627.87
Wet2.0536.0884.0471.04625.85
TOC (mg/L)Dry1.7593.4412.4390.48820.00
Wet0.9471.8601.2910.24018.63

References

  1. Hu, X.; Wang, H.; Zhu, Y.; Xie, G.; Shi, H. Landscape Characteristics Affecting Spatial Patterns of Water Quality Variation in a Highly Disturbed Region. Int. J. Environ. Res. Public Health 2019, 16, 2149. [Google Scholar] [CrossRef]
  2. Galbraith, L.M.; Burns, C.W. Linking Land—Use, Water Body Type and Water Quality in Southern New Zealand. Landsc. Ecol. 2007, 22, 231–241. [Google Scholar] [CrossRef]
  3. Turner, R.E.; Rabalais, N.N. Linking Landscape and Water Quality in the Mississippi River Basin for 200 Years. BioScience 2003, 53, 563–572. [Google Scholar] [CrossRef]
  4. Tim, U.S.; Jolly, R. Evaluating Agricultural Nonpoint—Source Pollution Using Integrated Geographic Information Systems and Hydrologic/Water Quality Model. J. Environ. Qual. 1994, 23, 25–35. [Google Scholar] [CrossRef]
  5. de Oliveira, L.M.; Maillard, P.; de Andrade Pinto, E.J. Application of a land cover pollution index to model non—Point pollution sources in a Brazilian watershed. Catena 2017, 150, 124–132. [Google Scholar] [CrossRef]
  6. Ouyang, W.; Skidmore, A.K.; Toxopeus, A.G.; Hao, F. Long-term vegetation landscape pattern with non-point source nutrient pollution in upper stream of Yellow River basin. J. Hydrol. 2010, 389, 373–380. [Google Scholar] [CrossRef]
  7. Basnyat, P.; Teeter, L.D.; Flynn, K.M.; Lockaby, B.G. Relationships Between Landscape Characteristics and Nonpoint Source Pollution Inputs to Coastal Estuaries. Environ. Manag. 1999, 23, 539–549. [Google Scholar] [CrossRef]
  8. Giri, S.; Qiu, Z. Understanding the relationship of land uses and water quality in Twenty First Century: A review. J. Environ. Manag. 2016, 173, 41–48. [Google Scholar] [CrossRef]
  9. Liu, Y.N.; Kong, L.Q.; Xiao, Y.; Zheng, H. Relationships between landscape pattern and ecosystem water purification service in the Yangtze River Basin. Acta Ecol. Sin. 2019, 39, 844–852. [Google Scholar] [CrossRef]
  10. Bu, H.; Meng, W.; Zhang, Y.; Wan, J. Relationships between land use patterns and water quality in the Taizi River basin, China. Ecol. Indic. 2014, 41, 187–197. [Google Scholar] [CrossRef]
  11. Plexida, S.G.; Sfougaris, A.I.; Ispikoudis, I.P.; Papanastasis, V.P. Selecting landscape metrics as indicators of spatial heterogeneity—A comparison among Greek landscapes. Int. J. Appl. Earth Obs. Geoinf. 2014, 26, 26–35. [Google Scholar] [CrossRef]
  12. Jie, Y.; Youpeng, X.; Bin, G.; Yuefeng, W.; Yu, X.; Qian, M. River water quality change and its relationship with landscape pattern under the urbanization: A case study of Suzhou City in Taihu Basin. J. Lake Sci. 2017, 29, 827–835. [Google Scholar] [CrossRef]
  13. Wei, F.; Mei-hua, H.; Lan-ying, W.; Wei, W.; Juan, X.; Guo-shuang, Z.; Jun-ju, Z.; Guo-feng, Z. Relationship between landscape pattern and hydrochemical characteristics of Binggou River Basin in eastern Qilian Mountains. Chin. J. Ecol. 2019, 38, 3779–3788. [Google Scholar] [CrossRef]
  14. Shi, P.; Zhang, Y.; Li, Z.; Li, P.; Xu, G. Influence of land use and land cover patterns on seasonal water quality at multi—spatial scales. Catena 2017, 151, 182–190. [Google Scholar] [CrossRef]
  15. Zhang, Y.J.; Chen, S.; Xiang, J.C. Correlation between the water quality and land use composition in the river side area—A case of Chaohu Lake Basin in China. Resour. Environ. Yangtze Basin 2011, 20, 1054–1061. [Google Scholar]
  16. Li, K.; Wang, L.; Sun, W.; Wang, X.R.; Li, Z.H. Spatial effect of landscape pattern on river water quality under urbanization. Acta Sci. Circumstantiae 2020, 40, 343–352. [Google Scholar] [CrossRef]
  17. Mello, K.d.; Valente, R.A.; Randhir, T.O.; dos Santos, A.C.A.; Vettorazzi, C.A. Effects of land use and land cover on water quality of low—order streams in Southeastern Brazil: Watershed versus riparian zone. CATENA 2018, 167, 130–138. [Google Scholar] [CrossRef]
  18. Zhang, J.; Li, S.; Dong, R.; Jiang, C.; Ni, M. Influences of land use metrics at multi—spatial scales on seasonal water quality: A case study of river systems in the Three Gorges Reservoir Area, China. J. Clean. Prod. 2019, 206, 76–85. [Google Scholar] [CrossRef]
  19. HU Lin, L.S. Scale Effects of Land Use Structure and Landscape Pattern on Water Quality in the Longchuan River Basin. J. Ecol. Environ. Sci. 2021, 30, 1470–1481. [Google Scholar] [CrossRef]
  20. Dong, X.H.; Yang, X.D.; Liu, E.F.; Wang, R. Application of redundancy analysis in predigesting sedimentary proxies for paleolimnological research: A case study of Taibai Lake. Geogr. Res. 2007, 26, 477–484. [Google Scholar] [CrossRef]
  21. Li, S.; Gu, S.; Liu, W.; Han, H.; Zhang, Q. Water quality in relation to land use and land cover in the upper Han River Basin, China. CATENA 2008, 75, 216–222. [Google Scholar] [CrossRef]
  22. Shi, B.; Bach, P.M.; Lintern, A.; Zhang, K.; Coleman, R.A.; Metzeling, L.; McCarthy, D.T.; Deletic, A. Understanding spatiotemporal variability of in—Stream water quality in urban environments—A case study of Melbourne, Australia. J. Environ. Manag. 2019, 246, 203–213. [Google Scholar] [CrossRef] [PubMed]
  23. Winston, R.J.; Hunt, W.F.; Osmond, D.L.; Lord, W.G.; Woodward, M.D. Field Evaluation of Four Level Spreader–Vegetative Filter Strips to Improve Urban Storm—Water Quality. J. Irrig. Drain. Div. 2011, 137, 170–182. [Google Scholar] [CrossRef]
  24. Wei, W.; Gao, Y.; Huang, J.; Gao, J. Exploring the effect of basin land degradation on lake and reservoir water quality in China. J. Clean. Prod. 2020, 268, 122249. [Google Scholar] [CrossRef]
  25. Sliva, L.; Williams, D.D. Buffer zone versus whole catchment approaches to studying land use impact on river water quality. Water Res. 2001, 35, 3462–3472. [Google Scholar] [CrossRef] [PubMed]
  26. Johnson, L.; Richards, C.; Host, G.; Arthur, J. Landscape influences on water chemistry in Midwestern stream ecosystems. Freshw. Biol. 1997, 37, 193–208. [Google Scholar] [CrossRef]
  27. Collins, K.E.; Doscher, C.; Rennie, H.G.; Ross, J.G. The Effectiveness of Riparian ‘Restoration’ on Water Quality—A Case Study of Lowland Streams in Canterbury, New Zealand. Restor. Ecol. 2013, 21, 40–48. [Google Scholar] [CrossRef]
  28. Xu, G.; Li, P.; Lu, K.; Tantai, Z.; Zhang, J.; Ren, Z.; Wang, X.; Yu, K.; Shi, P.; Cheng, Y. Seasonal changes in water quality and its main influencing factors in the Dan River basin. CATENA 2019, 173, 131–140. [Google Scholar] [CrossRef]
  29. Ministry of Ecology and Environment of the People’s Republic of China. Environmental Quality Standards for Surface Water; MEE: Beijing, China, 2002; GB3838−2002.
  30. Guo, J.; Wang, C.M.; Huang, D.Z.; Li, Q.; Lian, H. Pollution characterization and water quality assessment of Dongting Lake. Environ. Chem. 2019, 38, 152–160. [Google Scholar] [CrossRef]
  31. Xu, Y.; Fu, B.; Lü, Y. Research on landscape pattern and ecological processes based on landscape models. Acta Ecol. Sin. 2010, 30, 212–220. [Google Scholar] [CrossRef]
  32. Gillies, R.R.; Kustas, W.P.; Humes, K.S. A verification of the ‘triangle’ method for obtaining surface soil water content and energy fluxes from remote measurements of the Normalized Difference Vegetation Index (NDVI) and surface e. Int. J. Remote Sens. 1997, 18, 3145–3166. [Google Scholar] [CrossRef]
  33. Huang, Z.; Han, L.; Zeng, L.; Xiao, W.; Tian, Y. Effects of land use patterns on stream water quality: A case study of a small—Scale watershed in the Three Gorges Reservoir Area, China. Environ. Sci. Pollut. Res. Int. 2016, 23, 3943–3955. [Google Scholar] [CrossRef] [PubMed]
  34. Wu, J.G. Landscape Ecology: Pattern, Process, Scale and Hierarchy, 2nd ed.; Higher Education Press: Beijing, China, 2007; p. 266. ISBN 978−7−04−020879−5. [Google Scholar]
  35. Xizhi, L.; Jing, H.; Peiqing, X.; Pan, Z. Correlation analysis between the water quality and land use composition in chaobai river basin. Nat. Environ. Pollut. Technol. 2017, 16, 307–314. [Google Scholar]
  36. Zeng, Y.; Jin, W.; Wang, H.; Zhang, H. Simulation of land-use changes and landscape ecological assessment in eastern part of Qinghai Plateau. Trans. Chin. Soc. Agric. Eng. 2014, 30, 185–194. [Google Scholar] [CrossRef]
  37. ter Braak, C.J.F.; Smilauer, P. Canoco Reference Manual and Users Guide: Software for Ordination, Version 5.0.; Microcomputer Power: Ithaca, NY, USA, 2012; p. 496. [Google Scholar]
  38. Fedorko, E.J.; Pontius, R.G., Jr.; Aldrich, S.P.; Claussens, L.; Hopkinson, C.S.; Wollheim, W.M. Spatial Distribution of Land Type in Regression Models of Pollutant Loading. Biol. Bull. 2004, 207, 173. [Google Scholar] [CrossRef] [PubMed]
  39. Huang, J.L.; Li, Q.S.; Hong, H.S.; Lin, J.; Qu, M.C. Preliminary study on linking land use & landscape pattern and water quality in the Jiulong River watershed. Huanjing Kexue 2011, 32, 64–72. [Google Scholar]
  40. Ji, D.Q.; Wang, Y.; We, J.B.; Wu, Z.F.; Liu, Q.; Cheng, J. Relationships between landscape spatial characteristics and surface water quality in the Liu Xi River watershed. Acta Ecol. Sin. 2015, 35, 246–253. [Google Scholar] [CrossRef]
  41. Guo, Y.Y.; Li, S.Y.; Liu, R.; Zhang, J. Relationship between landscape pattern and water quality of the multi-scale effects in the Yellow River Basin. J. Lake Sci. 2021, 33, 737–748. [Google Scholar] [CrossRef]
  42. Cui, H.; Zhou, X.D.; Guo, M.L.; Wu, W. Land use change and its effects on water quality in typical inland lake of arid area in China. J. Environ. Biol. 2016, 37, 603–609. [Google Scholar]
  43. Tong, S.T.Y.; Chen, W. Modeling the relationship between land use and surface water quality. J. Environ. Manag. 2002, 66, 377–393. [Google Scholar] [CrossRef]
  44. Jung, K.-W.; Lee, S.-W.; Hwang, H.-S.; Jang, J.-H. The effects of spatial variability of land use on stream water quality in a costal watershed. Paddy Water Environ. 2008, 6, 275–284. [Google Scholar] [CrossRef]
  45. Yujing, G.; Yan, W.; Yungen, L.; Yi, Z.; Chao, Z.; Lei, H. The effects of landscape pattern evolution in Puzhehei karst lake wetland littoral zone on water quality. Acta Ecol. Sin. 2018, 38. [Google Scholar] [CrossRef]
  46. Bian, Z.Q.; Liu, Y.Y.; Ding, S.Y. Correlation between Spatial-Temporal Variation in Landscape Patterns and Surface Water Quality: A Case Study in the Yi River Watershed, China. Appl. Sci. 2019, 9, 1053. [Google Scholar] [CrossRef]
  47. Wang, J.; li, P.; Gao, H.D.; Shi, P.; Zhang, Q.L.; Yang, Q.N.; Ma, Y.Y. Preliminary study on the relationship between land use /landscape index and water quality in the upper reaches of Danjiang river. Res. Soil. Water Conserv. 2018, 25, 383–389. [Google Scholar] [CrossRef]
  48. Peng, J.; Liu, Y.; Corstanje, R.; Meersmans, J. Promoting sustainable landscape pattern for landscape sustainability. Landsc. Ecol. 2021, 36, 1839–1844. [Google Scholar] [CrossRef]
  49. Song, Y.; Song, X.; Shao, G. Response of Water Quality to Landscape Patterns in an Urbanized Watershed in Hangzhou, China. Sustainability 2020, 12, 5500. [Google Scholar] [CrossRef]
Figure 1. Maps of sampling sites and land use in the Dan River Basin. And the insets show Dan River Basin within the Qin Ling Mountain, and the position within China MAP. S1–S21 indicate sampling sites, D1–D10 indicate sub—basins.
Water 15 03276 g001
Figure 2. Box plot of water quality indices of the whole Dan River Basin (dry and wet season). X and Y represent the significant levels of water quality indices during the wet and dry seasons.
Water 15 03276 g002
Figure 3. Spatial distribution characteristics of water quality indices in the dry (a) and wet reason (b) were estimated based on the concentrations of each parameter detected from 42 water samples. The red points in this figure indicate the value of that index beyond the limit of class V.
Water 15 03276 g003
Figure 4. Average comprehensive pollution index of sampling points in two periods.
Water 15 03276 g004
Figure 5. Proportions of land—use types at different spatial scales (riverine reach, riparian, and sub—basin).
Water 15 03276 g005
Figure 6. RDA two—dimensional ranking plots of land—use types (a,b) and landscape pattern indices (c,d) with water quality indices during the dry (a,c) and wet (b,d) seasons.
Water 15 03276 g006aWater 15 03276 g006b
Table 1. Landscape pattern indices at different spatial scales.
Spatial ScaleIndexMean ValueSDMaximumMinimum
Riverine reachLPI40.2112.5218.9059.46
PD2.430.401.873.02
LSI3.970.663.014.97
CONTAG48.985.5441.4058.34
PRD0.540.060.430.58
SHDI1.070.110.941.26
RiparianLPI18.886.269.2429.99
PD1.590.221.342.01
LSI23.083.3016.6628.79
CONTAG54.343.0647.9458.30
PRD0.020.010.010.03
SHDI1.160.071.071.27
SubstreamLPI17.735.5711.0029.95
PD0.720.100.590.90
LSI29.573.8621.4335.80
CONTAG57.662.5354.0862.82
PRD0.010.000.000.01
SHDI1.100.051.021.19
Table 2. Correlation between land use and water quality at different spatial scales. **: Correlation is significant with p < 0.01, *: Correlation is significant with p < 0.05.
Spatial ScaleLand UseSeasonDOCODTNTPNH3–NNO3–NNO2–NCr6+TOC
Riverine reachArgidry−0.150.48 *0.72 **0.390.420.77 **0.55 *0.390.58 **
wet−0.51 *0.290.70 **0.47 *0.390.370.76 **0.210.01
Forestdry0.44−0.07−0.53 *−0.69 **−0.29−0.150.030.150.34
wet−0.090.09−0.50 *−0.33−0.35−0.23−0.10−0.340.19
Grassdry−0.060.16−0.58 **−0.75 **−0.34−0.12−0.100.350.01
wet0.29−0.42−0.58 **−0.79 **−0.61 **0.380.32−0.07−0.29
Waterdry0.13−0.38−0.52*−0.79 **−0.20−0.29−0.26−0.31−0.53 *
wet0.65 **−0.75*−0.74 **−0.77 **−0.63 **−0.01−0.17−0.46 *−0.40
Constrdry−0.12−0.350.330.71 **0.08−0.14−0.29−0.47 *−0.18
wet−0.200.290.46*0.58 **0.40−0.28−0.60 **0.180.26
RiparianArgidry0.220.160.49*0.030.260.370.080.210.38
wet0.120.53*0.52*0.58 **0.46*0.440.61 **−0.210.55 *
Forestdry−0.03−0.070.140.62 **0.09−0.100.30−0.410.21
wet−0.53 *0.260.160.48*0.27−0.54 *−0.330.090.02
Grassdry−0.09−0.08−0.22−0.64 **0.03−0.04−0.12−0.06−0.44
wet0.41−0.72 *−0.42−0.66 **−0.440.270.07−0.08−0.49 *
Waterdry0.61 **−0.38−0.29−0.85 **−0.06−0.24−0.23−0.26−0.50 *
wet0.89 **−0.27−0.55 *−0.38−0.180.13−0.21−0.68 *0.18
Constrdry0.13−0.48 *0.220.15−0.270.04−0.64 **−0.20−0.14
wet0.240.180.360.270.120.21−0.24−0.200.49 *
SubstreamArgidry−0.42−0.21−0.56 **0.01−0.19−0.67 **−0.31−0.30−0.52 *
wet−0.04−0.61*−0.56 **−0.43−0.49 *−0.81 **−0.47 *0.26−0.61 **
Forestdry−0.15−0.330.150.49 *−0.50 *0.30−0.31−0.130.36
wet−0.360.180.410.15−0.120.20−0.15−0.040.21
Grassdry0.300.56 **0.04−0.54 *0.47 *0.070.49 *0.47 *0.01
wet0.240.06−0.19−0.070.240.190.53 *0.02−0.01
Waterdry−0.13−0.13−0.37−0.58 **−0.04−0.15−0.12−0.03−0.52 *
wet0.40−0.82 *−0.59 **−0.76 **−0.59 **−0.15−0.01−0.12−0.63 **
Constrdry−0.15−0.200.160.180.14−0.15−0.19−0.360.01
wet0.01−0.020.160.410.08−0.260.21−0.130.04
Table 3. Interpretation rates of water quality by land use at different scales (%).
Water PeriodSpatial ScaleWaterAgriForestConstrGrassTotal
DryRiverine reach23.225.116.311.37.883.7
Riparian19.921.813.23.41.860.1
Substream30.215.310.48.18.772.7
WetRiverine reach30.722.811.87.34.677.2
Riparian26.612.05.90.812.557.8
Substream22.821.615.73.51.665.2
Table 4. Interpretation rates of water quality by landscape patterns at different scales (%).
Water PeriodSpatial ScalePDLSILPICONTAGSHDIPRDTotal
DryRiverine reach33.113.85.05.35.711.174.0
Riparian7.62.215.130.61.812.469.7
Substream24.68.823.96.44.22.970.8
WetRiverine reach38.715.15.21.310.717.588.5
Riparian8.08.111.37.14.016.755.2
Substream7.316.78.37.65.722.267.8
Disclaimer/Publisher’s Note: The statements, opinions and data contained in all publications are solely those of the individual author(s) and contributor(s) and not of MDPI and/or the editor(s). MDPI and/or the editor(s) disclaim responsibility for any injury to people or property resulting from any ideas, methods, instructions or products referred to in the content.

