Article

Interprovincial Virtual Water-Energy Flow and Its Network Structure Resilience in Yangtze River Economic Belt

1
College of Sciences, North China University of Science and Technology, Tangshan 063210, China
2
College of Water Sciences, Beijing Normal University, Beijing 100875, China
3
Changjiang River Scientific Research Institute of Changjiang Water Resources Commission, Wuhan 430010, China
4
Hubei Provincial Key Laboratory of Basin Water Resources and Ecological Environment, Wuhan 430010, China
*
Author to whom correspondence should be addressed.
Water 2023, 15(17), 3069; https://doi.org/10.3390/w15173069
Submission received: 30 June 2023 / Revised: 17 August 2023 / Accepted: 25 August 2023 / Published: 27 August 2023
(This article belongs to the Special Issue Studies on Water Resource and Environmental Policies)

Abstract

:
Water and energy are essential resources that flow between different regions in economic activities, forming a complex network that profoundly impacts sustainable development. Revealing network structural resilience allows for the identification of weak links, thus enhancing the capacity for sustainable development. This study employs a resilience-based method to examine changes in virtual water-energy transfers, combining input–output tables and total resource consumption coefficients (TRCC) to investigate the structural resilience of the virtual water-energy network. Case studies were conducted in the Yangtze River Economic Belt (YEB) in 2012 and 2017. The results show that the virtual water flow rate decreased by 28.66%, while that of virtual energy increased by 4.88% in YEB. The virtual energy network’s structural resilience is better than that of the virtual water network and shows significant improvement in later periods. The virtual water network structure has a clear hierarchical structure, while the virtual energy network structure is relatively flat. The transmission and connectivity of the two networks do not differ significantly, but the virtual energy network’s transmission is superior to that of the virtual water network. There is a significant improvement in the virtual energy network’s agglomeration in the later stages, while there is no significant change in the virtual water contact network.

1. Introduction

Water resources and energy are basic natural resources and important strategic resources in economic and social development. There is a complex correlation between the two, forming a circulation network [1,2,3]. The acquisition, treatment, distribution, and wastewater treatment and reuse processes in water resources entail significant energy consumption. Many energy extraction processes, such as petroleum, natural gas, and coal mining, require substantial amounts of water resources. This interdependence may give rise to water and energy supply issues and irreversible environmental damage [4]. As one of the most populous countries in the world, China has a multi-dimensional demand for water resources and energy [5], encompassing various sectors, including industry, agriculture, transportation, urban areas, daily life, and ecology. Under the guidance of national macro policies, resource flow between different provinces and cities in China has become increasingly frequent, forming complex networks in terms of water resources and energy [6]. Studying the spatial characteristics of water and energy distribution facilitates the exploitation of regional resource advantages and further alleviates the pressure on resource-scarce cities [7]. Taking YEB as an example, studying the complex network and structural resilience formed by water resources and energy among provinces in the YEB is of great significance for the rational utilization of regional water resources and energy, promoting resource balance, stimulating socioeconomic development, and maintaining ecological security.
To identify the flow of water and energy, virtual resource accounting is an indispensable link, and input–output (I–O) analysis is one of its main methods [8,9,10,11,12]. I–O analysis is to calculate the number of resources circulating between various sectors via economic input and output based on the economic links between various sectors. I–O analysis models are divided into single- and multi-regional inputoutput models [13]. Based on the I–O model, Wang et al. analyzed the circulation characteristics of virtual energy in 5 sectors in Gansu from 2007 to 2012 [14]. Yang et al. calculated the circulation and transfer of virtual water and energy among various sectors based on the I–O table of Heilongjiang in 2012 [15]. Sun and Zheng analyzed the structure of China’s water consumption in 42 sectors based on input–output table [16]. MRIO model can not only calculate the local resource circulation but also calculate the resource circulation of any two regions through the economic circulation between regions. Zhang et al. conducted a multi-regional input–output (MRIO) analysis of China’s regional energy utilization as reflected in the final demand and inter-regional trade 2007 and pointed out that the energy flow has largely shifted from the central and western regions to the eastern regions [17]. Cao et al. calculated the virtual water flow in the Beijing-Tianjin-Hebei region based on I–O table in 2012, and pointed out that the virtual water showed a net outflow as a whole [18]. Yan and Sun calculated the water footprint transfer of 30 regions in China based on interregional I–O Tables in 2007 and 2012 [19]. Hong et al. took China’s YEB as an example, used the complex network theory to build a resource network model, and explored the characteristics of the resource network from a new perspective of dual conservation of water and energy [6]. At present, the research on water-energy based on complex networks is still in its infancy, and the research on complex network topology based on water-energy relationships still has a large development space.
In recent years, network structure resilience has become a new research rise in resource flow network structure stability [20,21,22]. At present, there is no unified method for evaluating the network structure resilience. Resilience refers to the stability and resilience of a system to maintain its original state after suffering external shocks. According to the “structure determines function principle” in the system theory, the network is regarded as a physical phenomenon, and the network topology parameters based on the complex network theory are considered to have a key impact on resilience [23,24]. Vijaya found that the enterprise supply chain network with the lowest density and centrality, the largest connectivity, and the network scale has the highest resilience [25]. Peng et al. evaluated the network structure resilience of the three types of networks, economy, information, and transportation, from the aspects of hierarchy, matching, transmissibility, and aggregation [26]. Hou and Sun [27] used the complex network theory to analyze the evolution of the network resilience of urban agglomeration from three aspects: the overall completeness, the structure characteristics, and the network aggregation. Currently, although network structure resilience has been called one of the focuses of complex network structure, the research on the structure resilience of water-energy flow networks has not been found, which is one of the important issues of water-energy NEXUS.
In summary, existing research has mainly focused on constructing network connections from a singular perspective of either water resources or energy. However, water energy is an interactive and complex system that requires the careful consideration of various factors, including energy demand, sustainable utilization of water resources, and environmental protection, in order to achieve coordinated economic, social, and environmental development [28]. Network resilience can enhance the stability, reliability, and recoverability of network structures and has been applied in various fields, such as information and communication networks, transportation systems, and the Internet of Things. However, its application in water-energy network structures remains limited. This study aims to calculate the water and energy flows among the 11 provinces (municipalities) in the YEB using a multi-regional input–output (MRIO) table and comprehensive total resource consumption coefficients. Based on this, a water-energy flow network is constructed, and the structural resilience of water resources and energy networks is evaluated using network resilience analysis. By calculating network density, average path length, core-periphery structure fit, degree distribution curve slope, and clustering coefficient based on network resilience indicators, this study provides support for the consumption and management of water and energy in the YEB region.

2. Materials and Methods

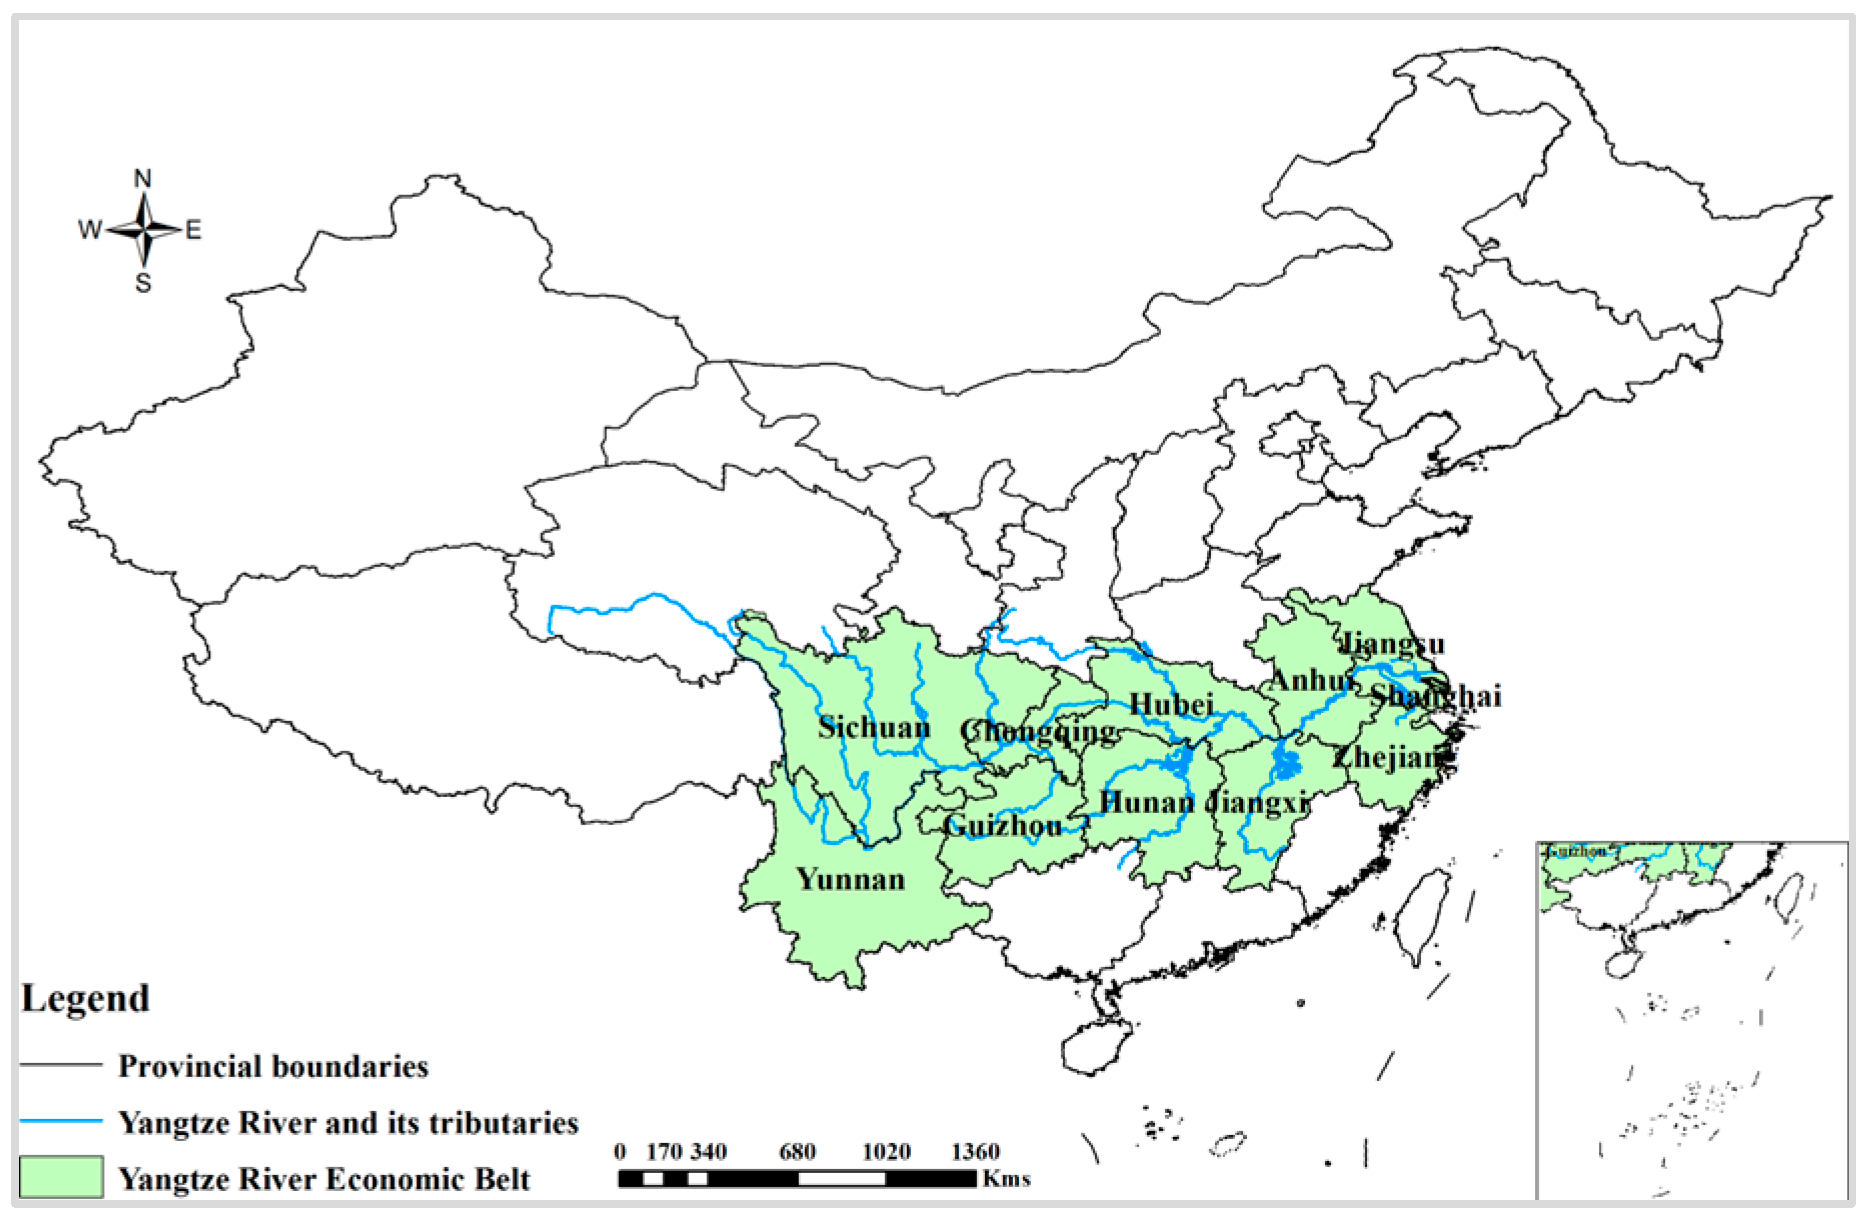
2.1. Study Area and Data Sources

The YEB in China is a significant strategic development area encompassing 11 provinces and cities, including Sichuan, Guizhou, Yunnan, Chongqing, Hubei, Hunan, Jiangxi, Shanghai, Jiangsu, Zhejiang, and Anhui. (Figure 1). Spanning over an estimated area of 2.05 × 10⁶ km2, the region constitutes approximately 21.4% of China’s overall landmass, traversing the upper, middle, and lower reaches of the river and playing a crucial role in ensuring its high-quality development.
YEB boasts abundant water resources, with a total volume of 1.56 × 10¹² m3 in 2020, constituting 49.36% of China’s aggregate water resources. Water resource distribution across the YEB exhibits a gradient, with superior abundance in the upper reaches and relatively scarce availability in the lower reaches. Moreover, YEB serves as a key industrial hub for China, housing several traditional sectors with high energy consumption and pollution. The upper reaches of the YEB yield significant quantities of raw coal and natural gas, with Guizhou ranking first in raw coal production at 163.55 million tons while Sichuan leads in natural gas production at 35.639 billion m3. Hydropower potential is abundant in the middle and upper reaches, with Sichuan and Yunnan accounting for 87% and 84%, respectively. It is noteworthy that the spatial distribution of both water and energy resources in the YEB is uneven, thus reinforcing the significance of trade circulation between the different regions in the YEB as a crucial foundation for rapid economic and social development.
This study is mainly based on the MRIO table of China in 2012 and 2017. Among them, the latest available MRIO is the 2017 version. The remaining data mainly come from the China Water Resources Bulletin, the First Water Conservancy Census Bulletin, the China Economic Census Yearbook, the Statistical Yearbook, the Energy Statistical Yearbook, the Wine Industry Yearbook, the Agricultural Product Processing Industry Yearbook, and the statistical yearbook of 11 provinces (cities) in YEB.

2.2. Total Resource Consumption Coefficient (TRCC)

The input–output table, containing horizontal and vertical columns based on the material conservation theorem, was compiled by American economist W. Leontief to depict the potential direct and indirect links in the flow of production factors within economic sectors. Input–output analysis is a commonly used method in econometrics [29] and has been extensively applied in research examining leading sectors and industrial linkages [30], resource circulation, and environmental impact [31]. In this study, a multi-regional input–output (MRIO) model is required to elucidate the circulation of water resources-energy between any two provincial administrative regions in YEB. Table 1 presents the MRIO table of resource consumption for YEB in both 2012 and 2017.
The MRIO model contains 11 regions, R 1 , R 2 , , R 11 . Each region has n sectors (Table 1). The row balance relationship is as follows.
X i R r = s = 1 11 j = 1 n x i j R r R s + s = 1 11 y i R r R s + e i R r
where R r and R s are any two regions. X i R r is the total output of the sector i in the region R r . x i j R r R s is the intermediate input provided by sector i of region R r to sector j of region R s ; y i R r R s is the input of sector i in region R r to the final demand of region R s . e i R r is the output of sector i in region R r .
The direct resources consumption coefficient (DRCC) is as follows:
a i j R r R s = x i j R r R s / x j R s
Bring Equation (2) into Equation (1):
X i R r = s = 1 11 j = 1 n a i j R r R s x i R r + s = 1 11 y i R r R s + e i R r
Expressed as the matrix form:
X R r = A R r R s X R r + Y R r R s + E R r
Further,
X R r = ( 1 A R r R s ) 1 ( Y R r R s + E R r )
where L = ( 1 A R r R s ) 1 = [ l R r R s ] is Leontief inverse matrix. [ l R r R s ] is the input of sector i to meet the production needs of a unit product of sector j in region R s .
To establish the connection between economic and resource consumption W j R r was introduced into the MRIO table. W j R r represents resource consumption. DRCC represents the total amount of resources invested by each sector in the process of producing a unit of product [32], and the formula is:
R j R r = r j R r / x j R r
where R j R r refers to the total amount of the resources to be consumed in unit products or services of sector j in region R r . r j R r refers to the number of resources consumed by sector j in region R r ; x j R r is the total output of sector j in region R r .
According to DRCC, the TRCC can be calculated as follows:
TRCC = R L = R ( 1 A ) 1 = [ q R 1 q R 2 q R z ]
TRCC refers to the total resource consumed by the whole economic system to increase one unit of products in a sector. Namely, only by increasing so much resource supply can this unit of products be produced. In the calculation of DRCC, only the number of resources invested in natural form is considered, but in fact, the production needs multiple links. In each link, it is often necessary to invest not only a large number of natural form resources but also the products or services produced by various sectors using natural resources. The production or processing of these products also consumes natural resources. Although the use of this part of natural resources does not occur directly in this sector, its products or services meet the intermediate needs of this sector. Therefore, this part of the resources consumed are indirect resources, which, together with direct resources, constitute the total consumption resources.
The virtual resource flow from region R r to R s within YEB can be calculated based on final consumption in the MRIO table and TRCC as follows [33]:
V R T R r R s = i = 1 n q i R r y i R r R s
Let q i R r be the total consumption coefficient of water and energy, respectively, and use Equation (8) to calculate the virtual trade flow of water and energy within YEB.

2.3. Network Structure Resilience Evaluation Indicators

The flow of water resources and energy between provinces (cities) forms a complex network, and the resilience of this network is crucial to the quality of the sustainable and coordinated development of YEB [34]. This study evaluates the network structure resilience from hierarchy, transmissibility, connectivity, and aggregation, which are the main factors that affect resilience [20,27].
The node cities in the network structure in this study are 11 provinces (cities) in YEB. This study analyzes the resilience of urban networks from these four aspects, as shown in Table 2. In the Table 2, “−” represents a negative correlation, and “+” represents a positive correlation.
(1)
Network hierarchy degree and degree distribution
Network hierarchy degree is usually defined as the number of connections between a node and others. The larger the degree, the more connections this node has with others. The degree distribution of each node is degree distribution. The larger the slope of the degree distribution, the more uneven the connections are in spatial distribution. When the nodes with higher degrees fail or are attacked, the worse the adaptability and recoverability of the whole network are and the easier it is to be paralyzed. Therefore, the slope of degree distribution is inversely proportional to the network resilience. The calculation formula is:
K h = C ( K h * ) a
To process the formula:
ln ( K h ) = ln ( C ) + a ln ( K h * )
where K h represents the degree of node h , K h * represents the rank of node h , C is a constant, and α represents the slope of the degree distribution curve.
(2)
Network transmissibility-average path length
Transmissibility is evaluated using the average path length of the whole network. The smaller the length, the shorter the path from one node to another, indicating that the better network transmissibility, the higher the transmissibility efficiency, the better the network structure resilience, and the stronger the anti-interference ability. So, the average path length is inversely proportional to the network resilience. The calculation formula is:
L = 1 1 2 n ( n 1 ) i > 1 d i j
where L is the average path length of the network, n is the number of nodes, and d i j is the shortest path length of nodes i to j .
(3)
Network connectivity-network density
Connectivity is evaluated using network density. The higher the network density, the more connections the nodes have, indicating that the better the connectivity of the network, the stronger the ability of the node cities in the region to cope with shocks and recover and the higher the network structure resilience. The calculation formula is:
D = N / n ( n 1 )
where D is the network density, N is the number of actual associations, and n is the number of provinces (cities).
(4)
Network aggregation-local clustering coefficient and average clustering coefficient
Aggregation is evaluated using the clustering coefficient, and the local clustering coefficient describes the degree of aggregation of network nodes. The calculation formula is:
C i = 2 E i K i ( K i 1 )
where C i is the local clustering coefficient, K i is the degree of node i , and E i is the actual number of edges generated between adjacent nodes of node i .
The local clustering coefficient only calculates the aggregation of a single node connected with neighboring nodes. The average clustering coefficient is used to observe the aggregation degree of the whole network through the average of local clustering coefficients of all nodes in the network. The calculation formula is:
C = 1 / n 1 n C i
The larger the average clustering coefficient, the denser the network, the closer the connection between nodes, and the higher the degree of dependence among network node cities, which is conducive to enhancing the ability of coordination, cooperation, and joint response among node cities in the face of crisis. However, the worse the robustness of the network, the lower the anti-interference ability to the outside. When any node is interrupted, more network connections will be interrupted, so the average clustering coefficient is inversely proportional to the network resilience level.

3. Results

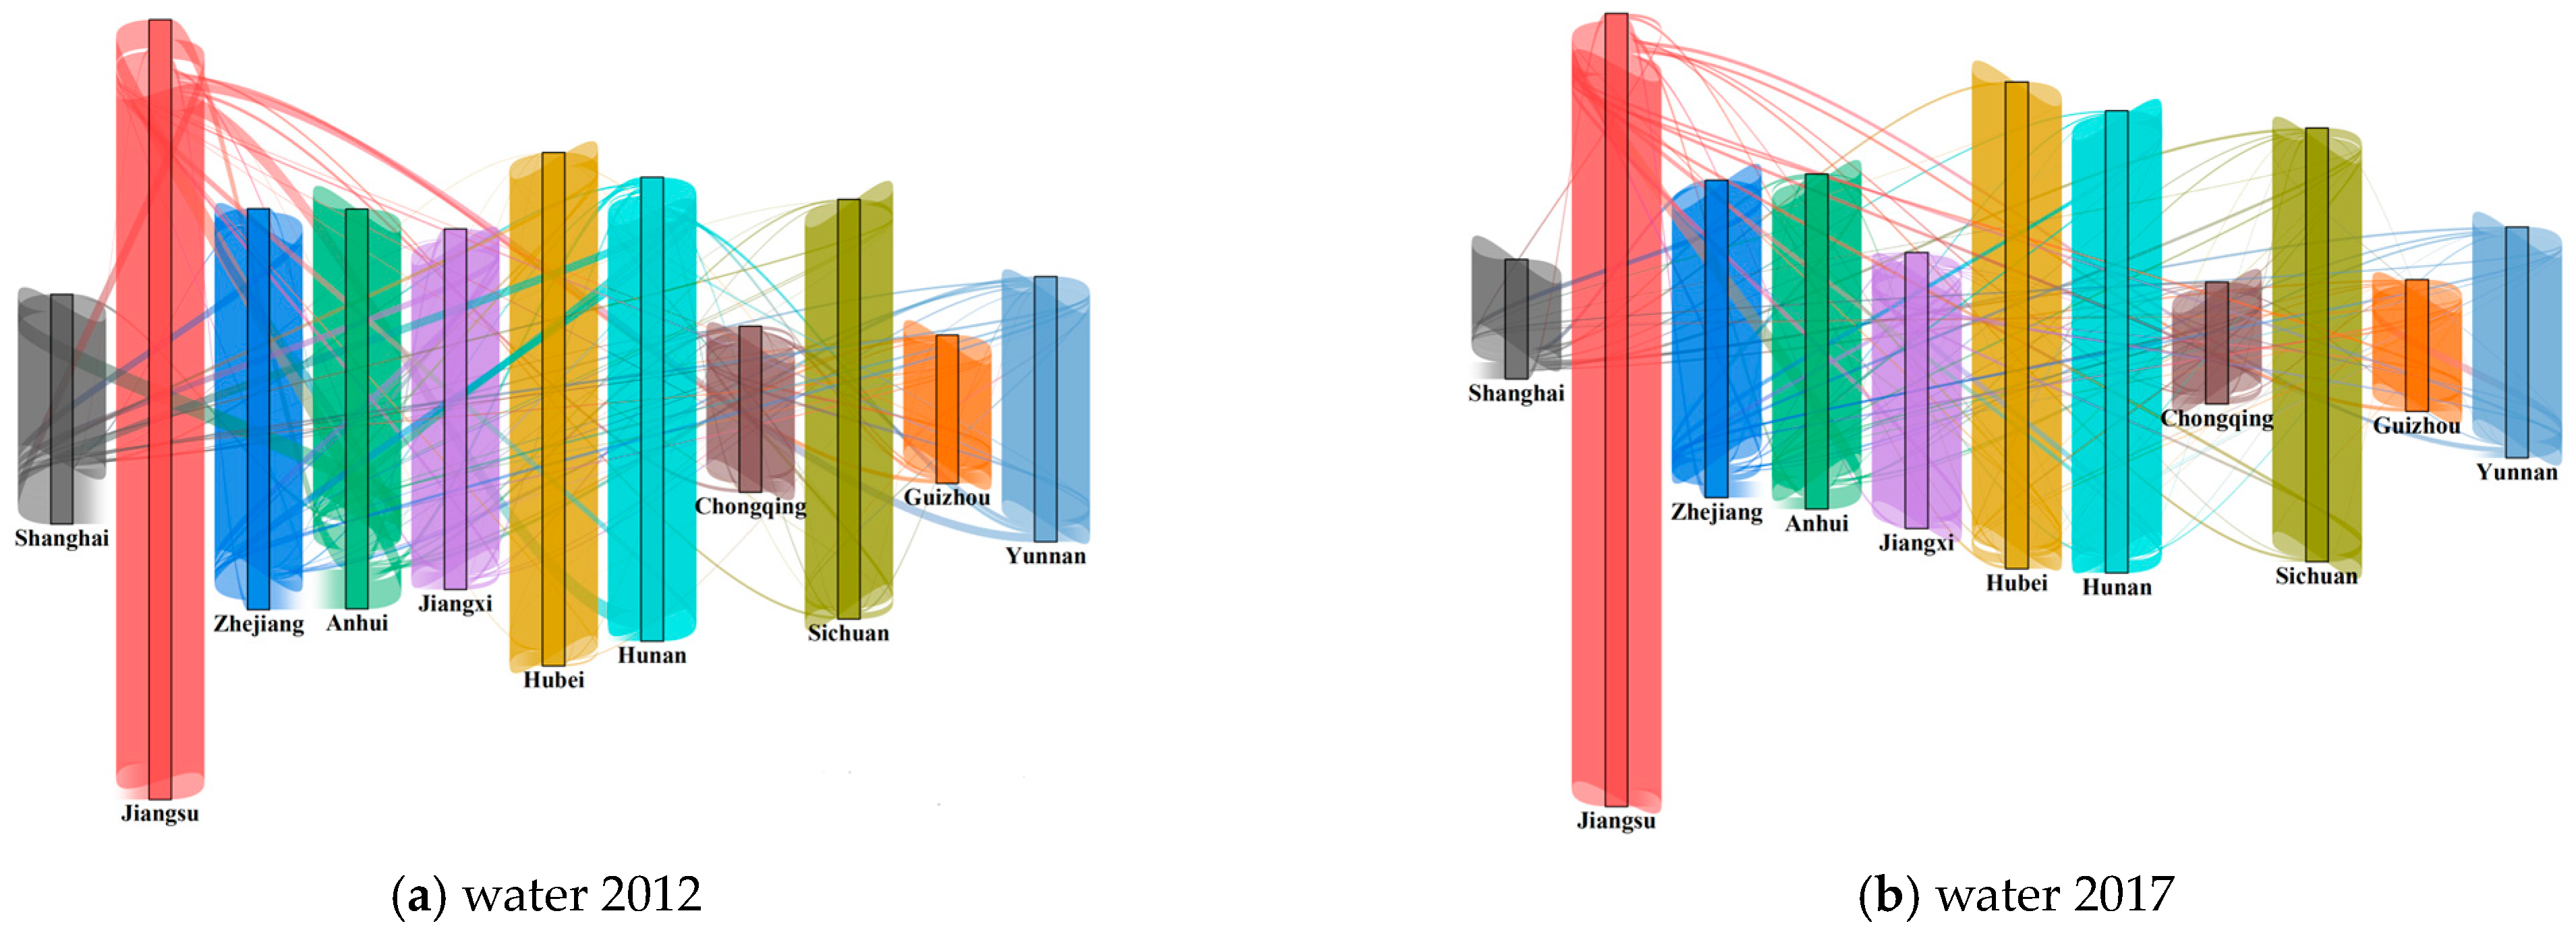
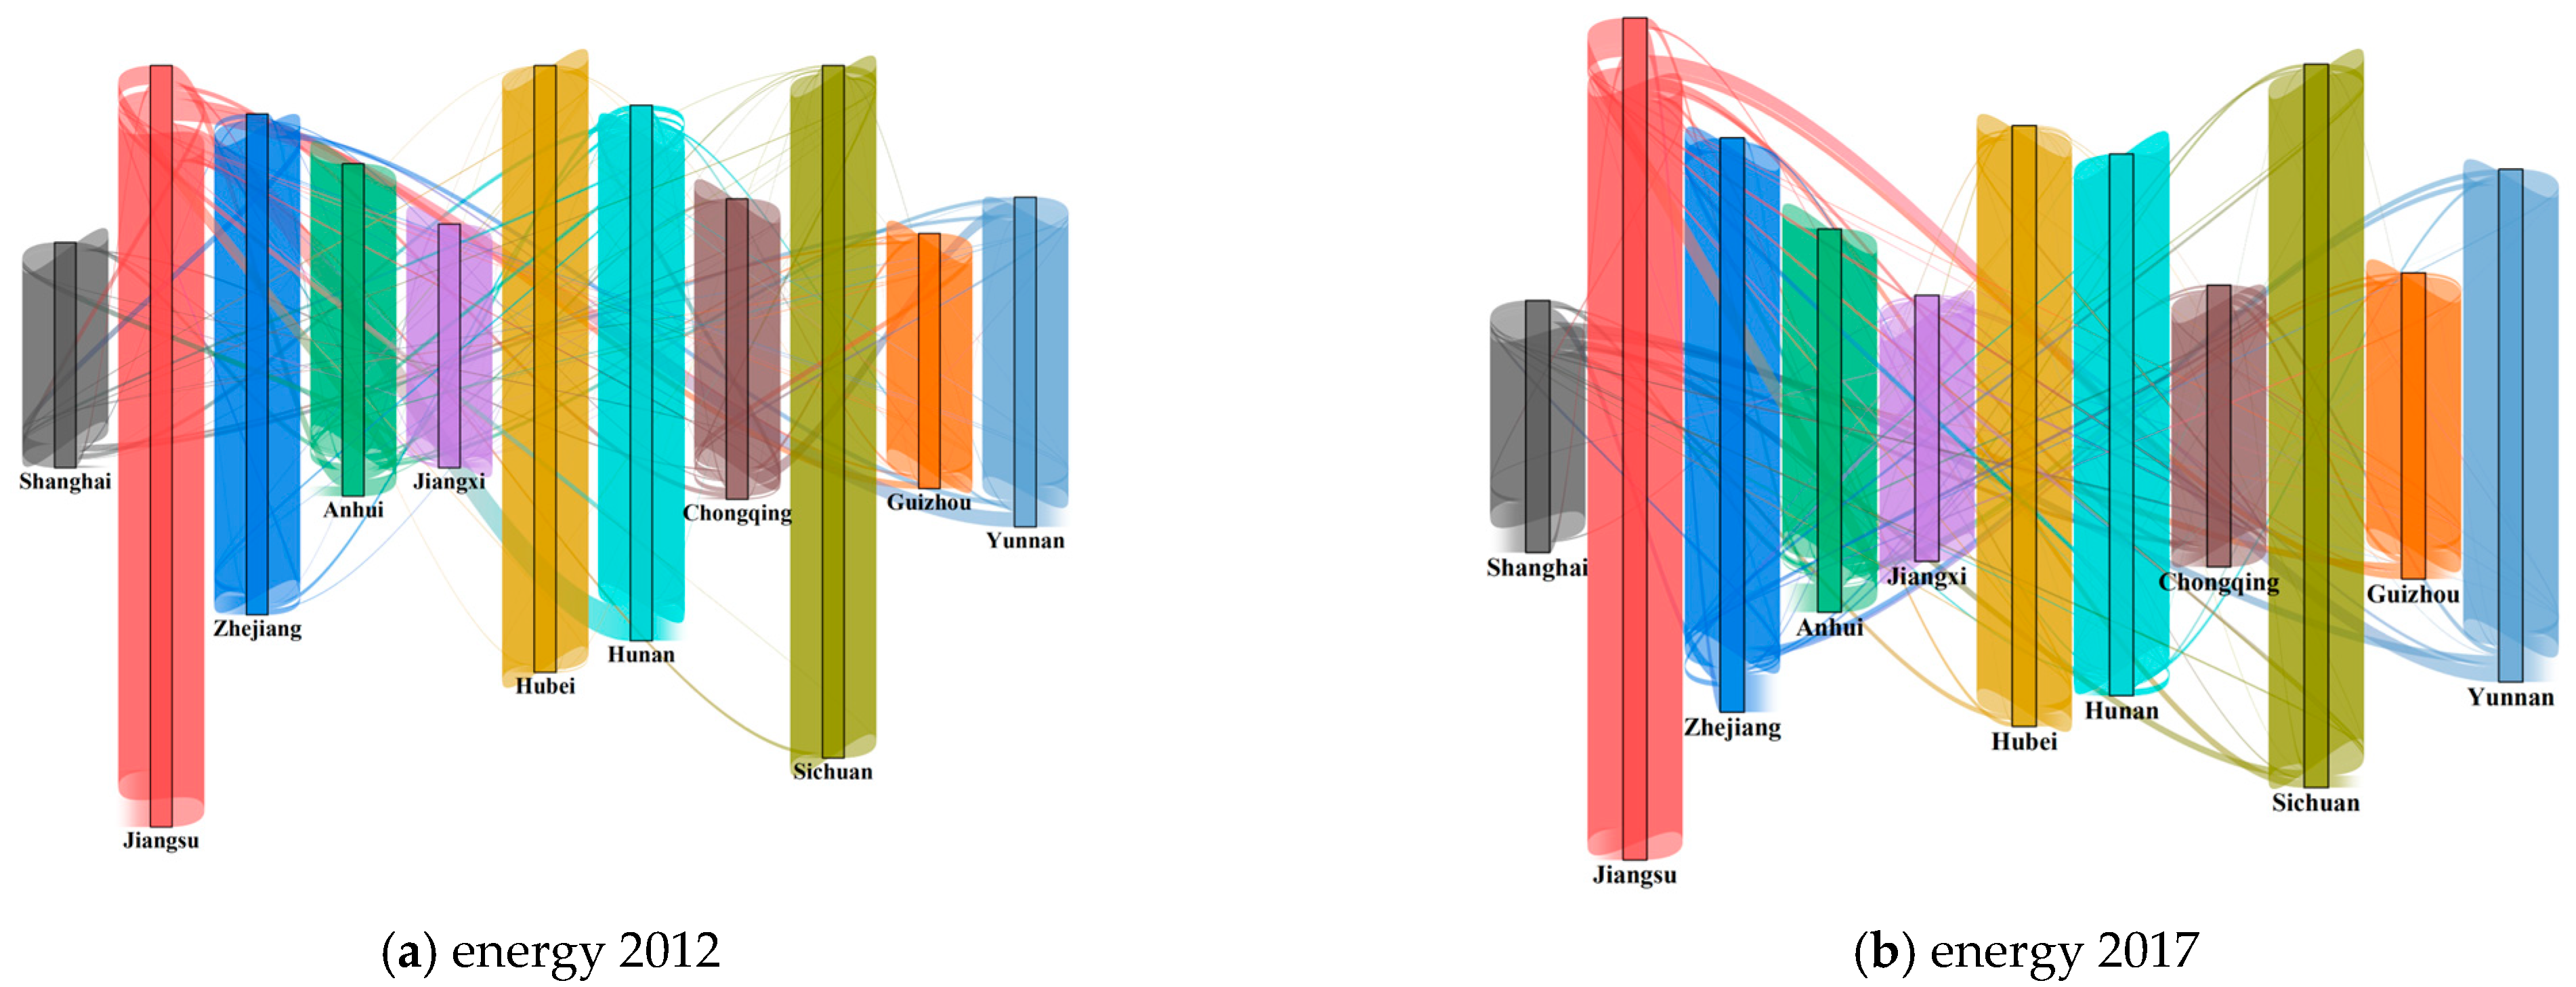
3.1. Virtual Water Resources-Energy Flow inside YEB

According to the method of virtual resources in Section 2.2, the results of virtual water flow in YEB in 2012 and 2017 were calculated, respectively (Table 3).
In 2012, Shanghai, Zhejiang, Chongqing, Guizhou, and Yunnan experienced virtual net water inflow. Among them, Shanghai had the largest net inflow of 29.29 billion m3, primarily sourced from Jiangsu and Anhui. Zhejiang had the second-largest net inflow of around 15.59 billion m3. The trade of virtual water was found to be most frequent in the lower reaches of the YEB. Anhui, Jiangsu, and the middle reaches of the YEB had a net outflow of virtual water, with Anhui and Jiangsu being the top two provinces in terms of net virtual water outflow. In 2017, Jiangsu, Zhejiang, Jiangxi, Hubei, and Guizhou showed a net inflow of virtual water, with little difference among provinces (cities). Jiangsu had the largest net inflow of virtual water (9.41 billion m3), while Jiangxi had the least inflow (2.53 billion m3). Shanghai, Anhui, Hunan, Chongqing, Sichuan, and Yunnan displayed virtual water outflow, especially Shanghai and Hunan, which had an outflow of 8.69 and 8.02 billion m3.
The YEB plays a crucial role as a driver of economic growth in China. The upper, middle, and lower urban provinces (cities) within the YEB possess distinct geographical and resource advantages, contributing to their diverse roles in the region’s development. The upper urban provinces (cities) act as a conduit connecting the southwest region with the inland hinterland, known for its abundant water and agricultural products resources. As such, they have the potential to serve as distribution centers for energy, raw materials, and grain while also serving as important hubs connecting the eastern, central, and western regions. However, in 2012, almost all the upper urban provinces (cities) exhibited a net inflow of virtual water, except for Sichuan province, which demonstrated a net outflow of 0.07 billion m3 of virtual water. In contrast, the middle urban provinces (cities) connect South China and the central and western regions and have rich human resources and infrastructure conditions, making them ideal sites for manufacturing and service industries. In 2012, all cities in the middle reaches of the YEB experienced a net outflow of virtual water. However, by 2017, Jiangxi and Hubei provinces had transformed from a net outflow to a net inflow of virtual water. The lower provinces (cities) connect the Yangtze River Delta and the Pearl River Delta, which are rich in cultural resources and innovative environments. These areas have become focal points for international trade and service economies. They have the potential to become gathering places for financial, trade, and cultural industries, playing an essential role in connecting domestic and international operations. In 2017, the rapid growth of international trade caused virtual water in Shanghai to shift from a net inflow to a net outflow, while the net inflow in Jiangsu and Zhejiang also decreased significantly. The increasing trend of international trade development is inevitable. Although the lower provinces (cities) are relatively short of water resources, they remain the focus of financial trade. To enhance the economic development of the YEB, decision-makers should leverage the advantages of water resources in the middle and upper urban provinces (cities) and the economic innovation environment in the lower urban provinces (cities), ultimately maximizing the potential of the YEB.
The results of virtual energy flow in YEB (2012 and 2017) are shown in Table 4.
In 2012, the virtual energy trading in the YEB region showed a net inflow of virtual energy to areas such as Yunnan, Hunan, Guizhou, Jiangxi, and Shanghai. Among these areas, Yunnan had the largest net inflow of virtual energy, totaling 115.28 billion kg, followed by Hunan with 98.84 billion kg. Conversely, the remaining regions displayed a net outflow of virtual energy, with the lower reaches exhibiting the largest net outflow at 247.21 billion kg, accounting for 89.15% of the total net outflow in the YEB. Within the YEB region, Jiangsu had the largest net outflow of virtual energy, reaching 163.80 billion kg, followed by Zhejiang and Anhui, with virtual energy outflows of 54.61 and 28.80 billion kg, respectively. The middle and upper-reach cities within the YEB, such as Jiangxi, Hubei, Hunan, Sichuan, and Guizhou, displayed limited virtual energy flow and minimal energy trade with other regions. In 2017, Zhejiang, Jiangxi, Hubei, Sichuan, Guizhou, and Yunnan were the net inflow areas. The net outflow of virtual energy is the largest in Shanghai, 131.03 billion kg, and Yunnan ranked second with 121.41 billion kg.
In 2012 or 2017, the provinces (cities) that recorded the largest virtual energy exports were Jiangsu and Shanghai. Both regions are located in the lower reaches of the YEB, where resources are comparatively scarce. Conversely, Yunnan, an upper city with a resource-endowed profile, consistently exhibits the largest net inflow of virtual energy. The middle and upper-reach cities endowed with natural resources have evidently failed to leverage their advantages and optimize their resources. This has led them to rely on external resources, which is deemed counterproductive to rational and orderly development within the YEB. Therefore, it is crucial to rationalize the exploitation of resource advantages in the middle and upper-reach cities, promote efficient resource circulation within the YEB, and foster further economic growth.

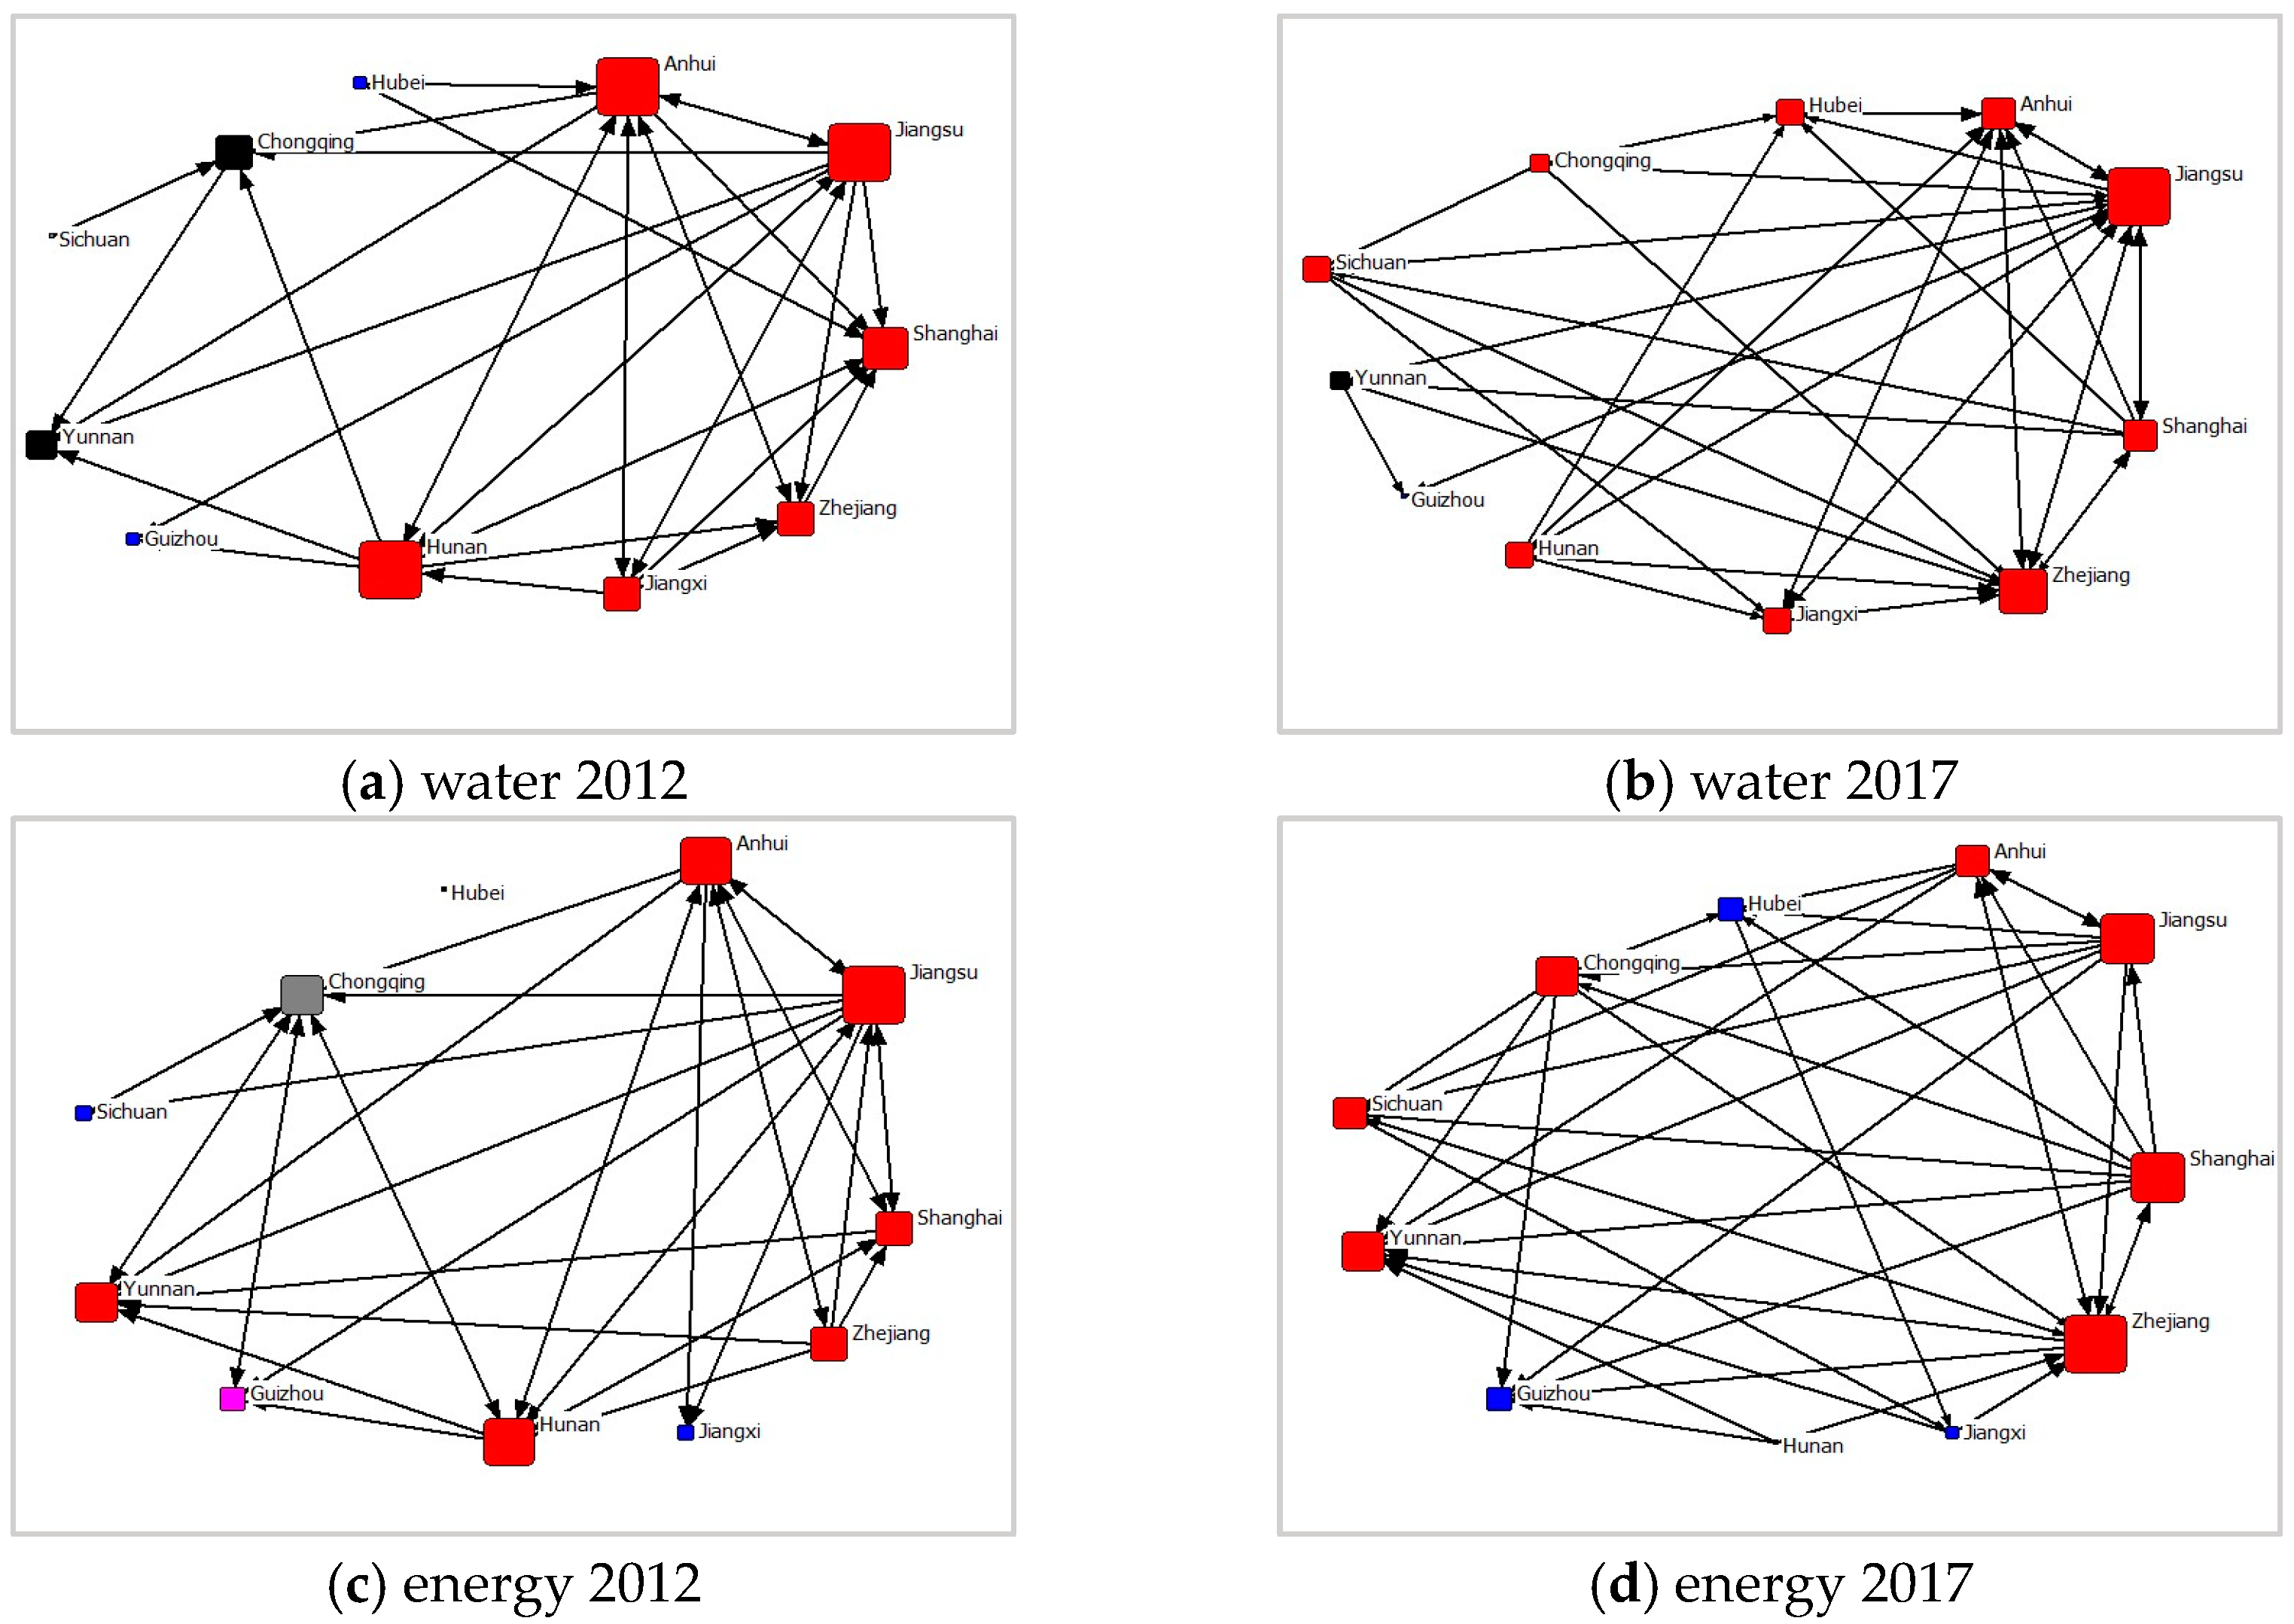
3.2. Network Structure Resilience Indicators

The YEB, consisting of eleven provinces, functions as a network where each province acts as a network node. This study aims to analyze the inter-provincial flows of water resources and energy within the YEB region. Correlation values exceeding the average connection strength are assigned the value 1 to indicate a significant correlation. Conversely, correlation values below the average are denoted as 0, indicating either semi-correlation or insignificant correlation. This process enhances the ability of the network connection matrix to accentuate the spatial structure of urban agglomeration. Subsequently, social network analysis was employed to extract the topology structure of the network (Figure 2). In the network topology diagram, each node represents a province, and the size of the node reflects the quantity and strength of connections between that province and other provinces, thereby indicating its position in the network. The larger the node, the greater the number of connections it has with other provinces, indicating a higher status in the network.
Six indicators, namely network density, average path length, core-edge structure fitting degree, degree distribution curve slope, average clustering coefficient, and local clustering coefficient, were utilized to evaluate the network structure resilience of water-energy aggregation in YEB. See Table 5 and Table 6.
A higher network density value indicates better network connectivity, with both types of networks having densities below 0.5. However, there was a slight increase in density values during the later stage. The average path length for inter-city flow in these networks was less than two nodes, with the virtual energy network demonstrating a lower average path length compared to the virtual water network. This suggests that the transmission efficiency of virtual energy is higher than that of virtual water. However, there was no significant difference in the numerical values between the two networks during the early and late stages, and the transmission efficiency remained unchanged. The slope |a| of the degree distribution curve is an important indicator of the urban agglomeration network level and the prominence of core cities. The slope |a| of the degree distribution curve of virtual water network is higher than that of virtual energy network, which shows that the development of virtual energy city network is relatively balanced and the core edge effect is not prominent, while the core edge effect of virtual water city network is significant, but it has been improved obviously in the later stage. The average clustering coefficient is an indicator of network structure resilience, with a lower value suggesting better network structure resilience. During the later stage, the average clustering coefficient of the virtual water network slightly increased from 0.573 to 0.578, indicating a decrease in network resilience. Conversely, the average clustering coefficient of the virtual energy connection network decreased significantly, indicating an improvement in network resilience during the later stage.
In the context of the virtual water and energy connection network, it is noted that the clustering coefficients of the lower provinces (cities) in the YEB, such as Shanghai, Jiangsu, and Zhejiang, have experienced a noticeable decline in the later period. Conversely, the clustering coefficient of Anhui, Hunan, and Chongqing has shown an upward trend. Furthermore, the upper city of Guizhou exhibited a remarkably high cluster coefficient of 1 in both 2012 and 2017, indicating a susceptibility to external interference. It is noteworthy that despite being located in the upstream region of the YEB, which possesses abundant water resources, Guizhou has not fully utilized its resource advantages. In regard to the virtual energy connection network, only Jiangsu has recorded a marginal increase in cluster coefficient, which peaked at 0.393 in the later stages. In contrast, other provinces (cities) in the YEB displayed a decrease in their respective cluster coefficients. Overall, these findings suggest that the virtual energy contact network has improved measurably in the later period, while the virtual water connection network exhibits a more nuanced pattern of change.

4. Discussion

4.1. Virtual Resource Flow Characteristics

4.1.1. Virtual Water Flow Characteristics

YEB has good water resources endowment in all provinces(cities), which can basically meet their own water demand and at the same time deliver water to other regions. By utilizing the Sankey diagram, it is possible to visually represent the inflow/outflow of water resources. In the Sankey diagram, the connecting lines between provinces symbolize the pathways of water flow, with the width of the lines being proportional to the magnitude of the flow. The wider line indicates a greater volume of water flow. Virtual water flow patterns inside YEB in 2012 and 2017 are shown in Figure 3.
Compared with 2012, the pattern of virtual water flow in 2017 changed greatly. Among them, Zhejiang and Guizhou maintained net inflow, while Anhui and Sichuan maintained net outflow. In provinces (cities) where the virtual water net inflow and outflow status remained unchanged, the inflow and outflow showed a decreasing trend. For instance, Zhejiang’s net inflow decreased from 15.59 billion m3 in 2012 to 8.78 billion m3 in 2017. The other provinces (cities) changed from the original net outflow to net inflow or vice versa. Among the provinces (cities), Jiangsu has the biggest change, from a net outflow of 19.74 billion m3 in 2012 to a net inflow of 9.41 billion m3 in 2017. The smallest change was in Sichuan, with a net outflow of 0.07 billion m3 in 2012 and a net outflow of 0.81 billion m3 in 2017. Overall, the flow of virtual water resources within YEB has slowed down, with the trade flow of virtual water between provinces (cities) decreasing by 28.66%.
The main virtual water outflow area was transferred from the middle reaches to the upper reaches, indicating that the provinces (cities) with better water resources endowment in the upper reaches gradually gave play to their resource advantages, strengthened trade with the middle and lower reaches, and eased the water pressure in the middle and lower reaches. Among them, Shanghai, which has a poor water resources endowment, has developed its international trade and relies heavily on virtual water imports, resulting in a net outflow of virtual water in China. Even if the virtual water outflow area moves upper, the net outflow of the upper cities is still not significant. It is necessary to rationally allocate water resources, increase the utilization rate of water resources in the middle and upper provinces (cities), and flow lower to areas outside the YEB. Decision-makers need to improve the international trade status of the middle and upper regions as well as alleviate water pressure in the lower reaches. In addition, it is necessary to strengthen cooperation with relevant provinces and cities in the Yangtze River basin, collaboratively address cross-border water resource issues, and promote coordinated and sustainable development of water resources in the YEB.

4.1.2. Virtual Energy Flow Characteristics

The virtual energy of YEB showed a net outflow in 2012 and 2017, and the Sankey diagrams of virtual energy are shown in Figure 4.
Compared with 2012, the flow pattern of virtual energy changed significantly in 2017. Changes have taken place in five provinces (cities), including Shanghai, Zhejiang, Hubei, Hunan, and Sichuan, where Shanghai and Hunan have changed from inflow to outflow and the other three from outflow to inflow.
The main reason for the great alteration of the virtual energy flow pattern in Zhejiang and Hubei can be attributed to the fact that their energy consumption growth rates surpass their energy production rates, leading to a deficit between the two. In 2017, there was still a mismatch between the virtual energy flow pattern and energy endowment in YEB. Although Yunnan and Guizhou possess favorable energy conditions with high primary energy output, virtual energy displayed an overall net inflow trend compared to 2012; meanwhile, in the lower reaches of YEB with comparatively lower primary energy outputs, virtual energy manifested as net outflows on a large scale. In terms of volumetric change, among all the aforementioned regions, Zhejiang exhibited the most substantial transition from net outflow to the inflow of virtual energy, registering a variation of up to 155.54 billion kg. Yunnan’s net inflow increased from 115.28 billion kg in 2012 to 121.41 billion kg in 2017, accounting for a mere 5.32% increase. Overall, virtual energy flows within YEB were more frequent but had a smaller range, increasing by 4.88%.
Generally, the outflow of virtual energy is concentrated in the lower areas, while the inflow of virtual energy is concentrated in the middle and upper reaches with better energy endowments. There is a serious mismatch between the inflow and outflow of energy, which is not conducive to the further development of the YEB. Therefore, decision-makers should focus on increasing energy production in the middle and upper reaches, implementing a prioritized strategy for clean energy and building intelligent energy systems in the downstream areas, and gradually extending them to the middle and upper reaches cities that have been produced accordingly. Strengthen the balance between internal energy supply and demand, further promote international cooperation in energy, carry out exchanges and cooperation with the international community in the energy field, learn from the advanced experience and technology of developed countries, and improve the level of energy development and utilization.

4.2. Network Structure Resilience Analysis

4.2.1. Network Hierarchy

The slope |a| value of the degree distribution curve of the virtual water network is large, and the |a| value of the virtual water connection network in 2012 and 2017 is greater than 0.5, with obvious hierarchy and large degree difference, and the position of the core city is more obvious, while the virtual energy connection network is relatively flat, with the |a| value of 0.386 in 2017, indicating that the degree difference between node cities is relatively small. The urban centers possessing a degree of 8 or above can be classified as core group cities. Figure 5 shows that the virtual water network in 2012 featured Jiangsu, Anhui, and Hunan as the core provinces, whereas in 2017, the virtual water network was characterized by the provinces of Jiangsu and Zhejiang. Similarly, the sole core province of Jiangsu was identified in the virtual energy network in 2012.
Conversely, Shanghai, Jiangsu, and Zhejiang were recognized as the core provinces in the virtual energy network in 2017. These findings suggest that Jiangsu is at the forefront of the virtual water and virtual energy connection networks. Generally, the degree of cities in the lower reaches (Shanghai, Jiangsu, Zhejiang, Anhui) in the virtual water connection networks is higher than those in the middle reaches (Jiangxi, Hubei, Hunan) and the upper reaches (Chongqing, Sichuan, Guizhou, Yunnan). This trend indicates the dominance of the virtual water contact network of cities in the lower reaches.
In addition, the cities situated in the lower reaches possess a dominant position in the virtual energy connection network. However, the degree of the cities in the upper reaches has notably increased in the current virtual energy connection network, approaching the status of the core city. This outcome implies that the energy resources in the upper reaches of the YEB have been utilized more efficiently.
The fitting degree of the core-edge structure is shown in Figure 6. From a quantitative standpoint, the present study has determined that the fitting degree of the core-edge structure within virtual water networks was 0.590 in 2012. However, it increased to 0.711 in 2017, indicating an improved efficacy and enhanced sealing property of virtual water networks over time. Additionally, the fitting degree of the core-edge structure of virtual energy networks was found to be significantly reduced in comparison to its value in 2012. This can be attributed to the increased complexity of the network and improved ability to resist interference.
The lower reaches of YEB are characterized by a more advanced industrial and service sector, including finance, logistics, commerce, and trade. This augments employment opportunities and enhances the appeal of these regions, thereby stimulating further development of lower provinces (cities). These cities enjoy proximity to the Yangtze River Delta and other waterways, facilitating port trade and maritime transportation and conferring an advantageous geographical position. The growth of international trade amplifies the likelihood of downstream cities’ involvement in it. However, due to the greater demand for water resources and energy, the underutilization of these resources in the upper and middle reaches of the YEB has resulted in an obvious network-level disparity within the urban agglomeration of the YEB. Specifically, the later fitting degree of core-edge structure is particularly intensified within the water resources network.

4.2.2. Network Transmissibility

The average path length L of the two kinds of connection networks is between 1.4 and 1.7, and the transmission of inter-city flow is no more than two nodes. However, the virtual water connection network exhibits a higher average path length compared to the virtual energy connection network, indicating that the latter possesses greater transmission efficiency and regional accessibility. Specifically, the average path length of the virtual water connection network remains relatively stable at 1.618 and 1.620 in 2012 and 2017, respectively, while that of the virtual energy connection network stands at 1.422 and 1.400 for the same periods. Notably, there is little variation between their early and late periods, and no discernible change in transmission efficiency is observed.
The enhancement of transmission efficiency in water/energy networks can be achieved by minimizing the average path length. One approach is to decrease the average distance between nodes by increasing network nodes, thus improving network connectivity. Additionally, improving collaboration among nodes within the existing water/energy transmission network can facilitate information and resource sharing, further enhancing overall network performance. Further optimization of network topology can be achieved by utilizing a single control system, which may involve adopting a more compact network structure to minimize average path length among urban nodes.

4.2.3. Network Connectivity

The network densities of the virtual water and virtual energy in 2012 and 2017 were examined in this study and found to be 0.3000 and 0.3909, respectively, for virtual water and 0.3273 and 0.3455, respectively, for virtual energy. Although there has been a modest improvement in the connectivity of these networks, their network densities remain low, all of which are below 0.5. As a result, the overall network connection is inadequate, leaving the network in a weak connection state.
The distribution of network connectivity in the YEB is uneven, with water resources being relatively abundant in the upper reaches, particularly in comparison to Sichuan and Guizhou provinces. The lower reaches of the YEB have relatively scarce water resources, necessitating higher connectivity between cities, which plays a leading role in enhancing network connectivity. However, this also highlights the need for improving the utilization of urban resources in the YEB.
To ameliorate such challenges, it is recommended to enhance connectivity among urban nodes, augment the number of nodes in middle and upper cities, and strengthen interconnections between them, thereby increasing network density and transmission efficiency and mitigating the disparate distribution of water resources in the YEB. Additionally, leveraging intelligent control technologies to dynamically regulate the entire network can further improve its connectivity.

4.2.4. Network Aggregation

The average clustering coefficient reflects the aggregation degree of the whole network. A higher average clustering coefficient fosters an environment conducive to trust-building among members of small groups reduces opportunistic behaviors, but may restrict the introduction of external information. Conversely, lower average clustering coefficients may enhance the adaptability and resilience of regions during times of attack or stress but may also decrease the overall robustness and resilience of the network. When comparing the average clustering coefficients of virtual water connection networks between 2012 and 2017, there exists only a marginal difference, with respective values of 0.573 and 0.578. Meanwhile, the clustering coefficients of virtual energy connection networks during these same time periods exhibit significant differences, with respective values of 0.622 in 2012 and 0.358 in 2017. This suggests that the structural resilience of virtual energy connection networks has vastly improved over time.
One means of improving the resilient structure of energy and water networks would involve reducing their levels of aggregation, including both the overall and local urban aggregation. Decentralized layouts and distributed architecture may aid in achieving such reductions, dispersing water and energy production and storage throughout numerous locations, particularly those resources found in upper cities within the YEB region. Furthermore, strengthening physical safety measures, reducing the pollution and loss of water and energy during transportation, and maximizing resource utilization can further enhance the resilience of these networks.

4.2.5. Comprehensive Analysis

According to the network topology diagram (Figure 2), the core node groups of the virtual water connection network consist primarily of Shanghai, Jiangsu, and Zhejiang in the lower reaches of the Yangtze River Economic Belt (YEB). These core node groups form a central structure with the lower reaches of the YEB serving as the primary nodes, resulting in an overall form characterized by a “core of the lower reaches of the city + the scattered points in the upper reaches of the city”. The year 2012 revealed that the core edge effect was evident, which became more severe in 2017. Cities located in the lower reaches of the YEB play a crucial role within the core node city group since they can connect with the virtual energy network. Meanwhile, cities located in the upper reaches also play an essential part, creating a form of “core at both ends + loose in the middle”. Water resources and energy are interdependent, with water serving as a source of energy that can be harnessed and transformed for utilization. Facilities such as hydroelectric power plants, tidal power stations, and wave power stations enable the conversion of water’s kinetic energy into electrical energy, providing society with clean and renewable energy sources. Energy production often requires substantial volumes of water resources. Coal-fired and nuclear power plants rely on water for cooling systems, while the extraction and processing of oil and natural gas also demand significant water usage. In the context of the YEB, where water energy networks are structured, the core provinces and cities associated with water energy are predominantly located in downstream regions. Examining the network resilience of these regions and seeking balance among water resources and energy can facilitate the coordinated development of the economy, society, and environment.
In 2012, the core edge effect was obvious, and it was obviously improved in the later period; the network structure became more complex, and the resilience of the network structure was significantly improved. In terms of the virtual water connection network, Guizhou exhibits a degree value of 2 throughout both the early and late stages, having contact with only two cities. In the event of severed connections, Guizhou would become isolated from the entire network. Moreover, cities in the upper reaches of the YEB with abundant water resources exhibited low degrees, failing to fully exploit their resources to establish connections with other cities, necessitating further development and adjustment in later stages. Furthermore, the virtual energy contact network reflects how the city degree in the middle reaches of the YEB is relatively low, while Hunan exhibits a decreasing trend in the later period. As such, developing cities with abundant resources in the upper region and lower cities with more developed economies remain essential. Increasing attention should be given to enhancing the position and role of the middle reaches of the YEB in both networks, thereby improving the structural resilience of the entire connection network.
According to evaluative results, the structural resilience of the virtual energy connection network is significantly better than that of the virtual water connection network. While the network hierarchy and connectivity of the latter improve obviously, its transmissibility and aggregation do not show any improvement in the later period. In contrast, the virtual energy network demonstrates marked improvements in all areas during the same period, with a more complex and diversified network structure resulting in greater adaptability and resilience to external attacks.
However, it is important to acknowledge that the analysis of changes in network structural robustness is limited due to the data covering only 2012 and 2017. The availability of data is restricted, and the presence of time gaps may impede accurate analysis. Additionally, other potential factors and influences were not taken into account, and few research methods were used to compare and analyze results.

5. Conclusions

Based on China’s MRIO tables in 2012 and 2017, this study calculated virtual water and energy flow among regions of YEB and then discussed water resources-energy interregional flow networks from the perspective of structure resilience. The main results are as follows: Within YEB, the virtual water flowing between provinces (cities) decreased by 28.66%, while the circulation of virtual energy is more frequent, with an increase of 4.88%. Although the increase is small, it still reflects the energy complementarity among various regions within YEB. The trade flow of provinces (cities) is concentrated mostly in neighboring provinces (cities), among which the virtual resource flow in the lower reaches is the most frequent. The overall water resources and energy endowment in the YEB is favorable, which can basically meet the regional resource use needs while exporting resources to other regions outside YEB. Water resources and energy endowments of the middle and upper reaches of the YEB are better than those of the lower reaches, but the level of virtual resource flow is low. Therefore, the middle and upper reaches should make full use of their own resource endowments, strengthen trade with the lower reaches, achieve reasonable distribution of resources, promote the development of the lower reaches while driving their own economic development, and narrow the gap between the economic development of the upper, middle and lower reaches.
The resilience of virtual energy networks surpasses that of virtual water; however, both networks require further enhancement. In contrast to the middle and upper reaches of YEB, provinces (cities) situated in the lower reaches exhibit relatively poor water and energy endowments, yet they assume a dominant position in the overall network, and the core-edge effect is particularly pronounced. It is imperative to leverage the resource advantages of upper regions, bolster trade exchanges with other regions while satisfying their own needs, eliminate the core-edge effect, and improve risk management capabilities, thereby enhancing the resilience of the entire network. Based on the analysis of virtual water and energy flow, as well as the resilience of the water resources and energy networks in the YEB region, decision-makers can enhance network connectivity and augment energy transmission pathways to ensure a stable water-energy supply. Moreover, efforts to enhance the adaptability of the water-energy network to external disturbances can be pursued. Additionally, measures such as rational allocation of water-energy core provinces and cities and improvements in the transmission and distribution systems are necessary to achieve efficient utilization and balanced development of water-energy resources.
This study constructs the network structure of YEB from the perspective of virtual resource flow and discusses its resilience and space-time distribution, which can provide support for water resources and energy management. However, since the currently available China’s interregional input–output table is only updated to 2017, the timeliness of the research results needs to be updated in real-time according to the release of subsequent data, which is a work that needs to be carried out continuously in the future.

Author Contributions

Conceptualization, Y.Y. and H.W.; methodology, Y.Y. and X.Z.; software, H.W.; validation, R.Z., X.Z. and Y.Y.; formal analysis, Y.Y. and X.Z.; investigation, J.X.; resources, Y.Y., H.W. and J.X.; data curation, Y.Y.; writing—original draft preparation, Y.Y. and X.Z.; writing—review and editing, Y.Y. and X.Z.; visualization, J.X.; supervision, H.W.; funding acquisition, Y.Y. All authors have read and agreed to the published version of the manuscript.

Funding

This study was supported by the CRSRI Open Research Program (Program SN: CKWV20221035/KY), Beijing Natural Science Foundation (8222057), the National Natural Science Foundation of China (52279005), and the 111 Project (Grant No. B18006).

Data Availability Statement

All data included in this study are available upon request by contact with the corresponding author.

Conflicts of Interest

The authors declare no conflict of interest.

References

  1. Shen, Q.; Niu, J.; Liu, Q.; Liao, D.; Du, T. A resilience-based approach for water resources management over a typical agricultural region in Northwest China under water-energy-food nexus. Ecol. Indic. 2022, 144, 109562. [Google Scholar] [CrossRef]
  2. Ke, J.; Khanna, N.; Zhou, N. Analysis of water–energy nexus and trends in support of the sustainable development goals: A study using longitudinal water–energy use data. J. Clean. Prod. 2022, 371, 133448. [Google Scholar] [CrossRef]
  3. Nakhaei, M.; Akrami, M.; Gheibi, M.; Daniel Urbina Coronado, P.; Hajiaghaei-Keshteli, M.; Mahlknecht, J. A novel framework for technical performance evaluation of water distribution networks based on the water-energy nexus concept. Energy Convers. Manag. 2022, 273, 116422. [Google Scholar] [CrossRef]
  4. Yuan, L.; Ding, L.; He, W.; Kong, Y.; Ramsey, T.S.; Degefu, D.M.; Wu, X. Compilation of Water Resource Balance Sheets under Unified Accounting of Water Quantity and Quality, a Case Study of Hubei Province. Water 2023, 15, 1383. [Google Scholar] [CrossRef]
  5. Yuan, L.; Wu, X.; He, W.; Degefu, D.M.; Kong, Y.; Yang, Y.; Xu, S.; Ramsey, T.S. Utilizing the strategic concession behavior in a bargaining game for optimal allocation of water in a transboundary river basin during water bankruptcy. Environ. Impact Assess. Rev. 2023, 102, 107162. [Google Scholar] [CrossRef]
  6. Hong, S.; Cheng, T.; Wang, H. Characteristics of the water-energy network in the Yangtze River Economic Belt. Resour. Sci. 2021, 43, 1794–1807. [Google Scholar] [CrossRef]
  7. Kong, Y.; He, W.; Zhang, Z.; Shen, J.; Yuan, L.; Gao, X.; An, M.; Ramsey, T.S. Spatial-temporal variation and driving factors decomposition of agricultural grey water footprint in China. J. Environ. Manag. 2022, 318, 115601. [Google Scholar] [CrossRef]
  8. Dabo, G.; Klaus, H. Assessment of regional trade and virtual water flows in China. Ecol. Econ. 2006, 61, 159–170. [Google Scholar]
  9. Zhu, L.; Yong, G.; Soeren, L.; Hongyan, Z.; Tsuyoshi, F.; Dabo, G. Embodied energy use in China’s industrial sectors. Energy Policy 2012, 49, 751–758. [Google Scholar]
  10. Wang, Z.; Huang, K.; Yang, S.; Yu, Y. An input–output approach to evaluate the water footprint and virtual water trade of Beijing, China. J. Clean. Prod. 2013, 42, 172–179. [Google Scholar] [CrossRef]
  11. Zhang, C.; Anadon, L.D. A multi-regional input–output analysis of domestic virtual water trade and provincial water footprint in China. Ecol. Econ. 2014, 100, 159–172. [Google Scholar] [CrossRef]
  12. Zhang, B.; Qiao, H.; Chen, Z.M.; Chen, B. Growth in embodied energy transfers via China’s domestic trade: Evidence from multi-regional input–output analysis. Appl. Energy 2016, 184, 1093–1105. [Google Scholar] [CrossRef]
  13. Yang, Y.; Xiao, C.; Wang, X.; Liu, S. Review on water resources based on input-output theory and prospect of water resources management. J. Glaciol. Geocryol. 2021, 43, 214–224. [Google Scholar]
  14. Wang, X.; Zhang, Y.; Zhou, L.; Cao, J. Research on virtual energy industry distribution and interprovincial trade in Gansu Province. China Environ. Sci. 2020, 40, 1847–1856. [Google Scholar]
  15. Yang, Y.; Qiu, Y.; Wang, X.; Liu, H.; Zhang, J.; Li, H.; Zhu, H. Analysis of Water Resources and Energy Consumption Path in Heilongjiang Province. Water Power 2021, 47, 18–23. [Google Scholar]
  16. Sun, C.; Zheng, J. Structural path analysis of water resources consumption in China based on input-output table. Prog. Geogr. 2021, 40, 370–381. [Google Scholar] [CrossRef]
  17. Zhang, B.; Chen, Z.M.; Xia, X.H.; Xu, X.Y.; Chen, Y.B. The impact of domestic trade on China’s regional energy uses: A multi-regional input–output modeling. Energy Policy 2013, 63, 1169–1181. [Google Scholar] [CrossRef]
  18. Cao, T.; Wang, S.; Chen, B. Virtual water analysis for the Jing-Jin-Ji region based on multiregional input-output model. Acta Ecol. Sin. 2018, 38, 788–799. [Google Scholar]
  19. Yan, X.; Sun, C. Study on the Characteristics of Inter-Regional Water Footprint Spatial Transfer Network in China. Resour. Environ. Yangtze Basin 2021, 30, 602–613. [Google Scholar]
  20. Peng, C.; Lin, Y.Z.; Gu, C.L. Evaluation and optimization strategy of city network structural resilience in the middle reaches of Yangtze River. Geogr. Res. 2018, 37, 1193–1207. [Google Scholar]
  21. Xie, Y.S.; Wang, C.J.; Han, Z.L.; Liu, S.Z. Structural resilience evolution of multiple urban networks in the Harbin-Dalian urban belt. Prog. Geogr. 2020, 39, 1619–1631. [Google Scholar] [CrossRef]
  22. Fang, Y.L.; Su, X.Q.; Huang, Z.F.; Guo, B.B. Structural Characteristics and Resilience Evaluation of Tourism Flow Networks in Five Major Urban Agglomerations in Coastal China: From the Perspective of Evolutionary Resilience. Econ. Geogr. 2022, 42, 203–211. [Google Scholar]
  23. Crespo, J.; Suire, R.; Vicente, J. Lock-in or lock-out? How structural properties of knowledge networks affect regional resilience. J. Econ. Geogr. 2014, 14, 199–219. [Google Scholar] [CrossRef]
  24. Guimera, R.; Mossa, S.; Turtschi, A.; Amaral, L.A.N. The worldwide air transportation network: Anomalous centrality. community structure, and cities’ global roles. Proc. Natl. Acad. Sci. USA 2005, 102, 7794. [Google Scholar] [CrossRef]
  25. Bombelli, A.; Santos, B.F.; Tavasszy, L. Analysis of the air cargo transport network using a complex network theory perspective, Transportation research. Part E Logist. Transp. Rev. 2020, 138, 101959. [Google Scholar] [CrossRef]
  26. Dixit, V.; Verma, P.; Tiwari, M.K. Assessment of pre and post-disaster supply chain resilience based on network structural parameters with CVaR as a risk measure. Int. J. Prod. Econ. 2020, 227, 107655. [Google Scholar] [CrossRef]
  27. Hou, L.; Sun, J. Evaluation of network structure resilience of Chengdu-Chongqing urban agglomeration from the perspective of complex networks. World Reg. Stud. 2022, 31, 561–571. [Google Scholar]
  28. Niță, M.R.; Mitincu, C.G.; Nita, A. A river runs through it? Exploring the contestation of Environmental Impact Assessment procedures for small hydropower projects. Energy Res. Soc. Sci. 2023, 96, 102943. [Google Scholar] [CrossRef]
  29. Xu, J. Econometrics; Higher Education Press: Beijing, China, 2014. [Google Scholar]
  30. Jin, G. Measurement and Analysis of Embodied Energy in China’s International Trade Based on Multinational I-O Model; Zhejiang University: Hangzhou, China, 2015. [Google Scholar]
  31. Ren, Y. Inter-Regional Virtual Water Flow in China Based on Resource and Environment-Oriented Multi-Regional Input-Output Approach; Beijing Forestry University: Beijing, China, 2020. [Google Scholar]
  32. Xu, J.; Chen, X.; Yang, C. Calculation method of direct water consumption coefficient and complete water consumption coefficient. Water Resour. Plan. Des. 2002, 4, 28–30+36. [Google Scholar]
  33. Tian, G.; Li, J.; Li, L. Pattern of virtual water flow in the Yangtze River Economic Belt based on multi-regional input-output model, China Population. Resour. Environ. 2019, 29, 81–88. [Google Scholar]
  34. Wei, Y.; Xiu, C. Study on the concept and analytical framework of city network resilience. Prog. Geogr. 2020, 39, 488–502. [Google Scholar] [CrossRef]
Figure 1. Geographical location of YEB.
Water 15 03069 g001
Figure 2. Topology network of virtual water (a,b) and virtual energy (c,d) in YEB.
Water 15 03069 g002
Figure 3. Virtual water flow pattern of YEB in 2012 and 2017.
Water 15 03069 g003
Figure 4. Virtual energy flow pattern of YEB in 2012 and 2017.
Water 15 03069 g004
Figure 5. Degree value spatial distribution.
Water 15 03069 g005
Figure 6. Core edge division.
Water 15 03069 g006
Table 1. MRIO model of resource use in YEB.
Intermediate ConsumptionFinal ConsumptionExportTotal Output
ShanghaiYunnanShanghaiYunnan
S1SnS1Sn
Intermediate inputShanghaiS1 x 11 R 1 R 1 x 1 n R 1 R 1 x 11 R 1 R 11 x 1 n R 1 R 11 y 1 R 1 R 1 y 1 R 1 R 11 e 1 R 1 x 1 R 1
Sn x n 1 R 1 R 1 x n n R 1 R 1 x n 1 R 1 R 11 x n n R 1 R 11 y n R 1 R 1 y n R 1 R 11 e n R 1 x n R 1
YunnanS1 x 11 R 11 R 1 x 1 n R 11 R 1 x 11 R 11 R 11 x 1 n R 11 R 11 y 1 R 11 R 1 y 1 R 11 R 11 e 1 R 11 x 1 R 11
Sn x n 1 R 11 R 1 x n n R 11 R 1 x n 1 R 11 R 11 x n n R 11 R 11 y n R 11 R 1 y n R 11 R 11 e n R 11 x n R 11
Import input I 1 R 1 I n R 1 I 1 R 11 I n R 11
Added value V 1 R 1 V n R 1 V 1 R 11 V n R 11
Total investment x 1 R 1 x n R 1 x 1 R 11 x n R 11
Water consumption W 1 R 1 W n R 1 W 1 R 11 W n R 11
Energy consumption E 1 R 1 E n R 1 E 1 R 11 E n R 11
Table 2. Evaluation indicators of network structure resilience.
IndicatorSpecific VariableSpatial MeaningFunction
HierarchyDegree distributionDistribution characteristics of node degree values
TransmissibilityAverage path lengthTransmission efficiency of network
Connectivitynetwork densityThe connectivity of the network+
AggregationClustering coefficientThe aggregation degree of the network
Table 3. Calculation results of virtual water flow inside YEB (Unit: billion m3).
Province
(City)
OutputInput
2012201720122017
Shanghai8.9516.4538.247.77
Jiangsu47.8722.6428.1332.05
Zhejiang13.2314.8728.8223.65
Anhui47.9121.7927.0315.46
Jiangxi20.0212.2410.5814.77
Hubei10.215.832.3611.84
Hunan28.2515.5621.397.54
Chongqing9.0211.6815.337.70
Sichuan8.439.908.369.10
Guizhou6.136.8311.7710.86
Yunnan10.2112.1718.239.24
Total210.23149.98210.23149.98
Table 4. Calculation results of virtual energy circulation inside YEB (Unit: billion kg).
Province
(City)
OutputInput
2012201720122017
Shanghai85.52176.1991.7245.16
Jiangsu277.90220.44114.10134.68
Zhejiang101.5488.4346.93189.36
Anhui139.89148.98111.0973.43
Jiangxi28.3458.6844.1560.88
Hubei27.9436.659.2569.94
Hunan90.8473.89189.6838.64
Chongqing97.9999.6891.1962.98
Sichuan39.3156.3134.6388.83
Guizhou36.4523.3777.6997.30
Yunnan29.3519.06144.63140.47
Total955.071001.68955.071001.68
Table 5. Resilience index of urban network structure.
TypeYearNetwork Density (D)Average Path Length (L)Core-Edge Structure Fitting DegreeDegree Distribution Curve Slope (a)Average Clustering Coefficient (C)
Virtual water20120.3001.6180.59−0.601850.573
20170.39091.6200.711−0.532520.578
Virtual energy20120.32731.4220.7560.622
20170.34551.4000.472−0.386030.358
Table 6. Local clustering coefficient of provinces (cities).
Province (City)Virtual WaterVirtual Energy
2012201720122017
Shanghai0.5670.50.70.393
Jiangsu0.3390.2780.3330.393
Zhejiang0.750.3930.80.292
Anhui0.3210.5670.4520.433
Jiangxi0.70.6510.25
Hubei0.50.450.3
Hunan0.3570.750.50.333
Chongqing0.4050.50.40.381
Sichuan0.60.50.433
Guizhou110.8330.4
Yunnan0.750.6670.70.333
Disclaimer/Publisher’s Note: The statements, opinions and data contained in all publications are solely those of the individual author(s) and contributor(s) and not of MDPI and/or the editor(s). MDPI and/or the editor(s) disclaim responsibility for any injury to people or property resulting from any ideas, methods, instructions or products referred to in the content.

