


Comparative Analysis of the Hydrodynamic Performance of Dual Flapping Foils with In-Phase and Out-of-Phase Oscillations

Abstract
:1. Introduction
2. Motion Model
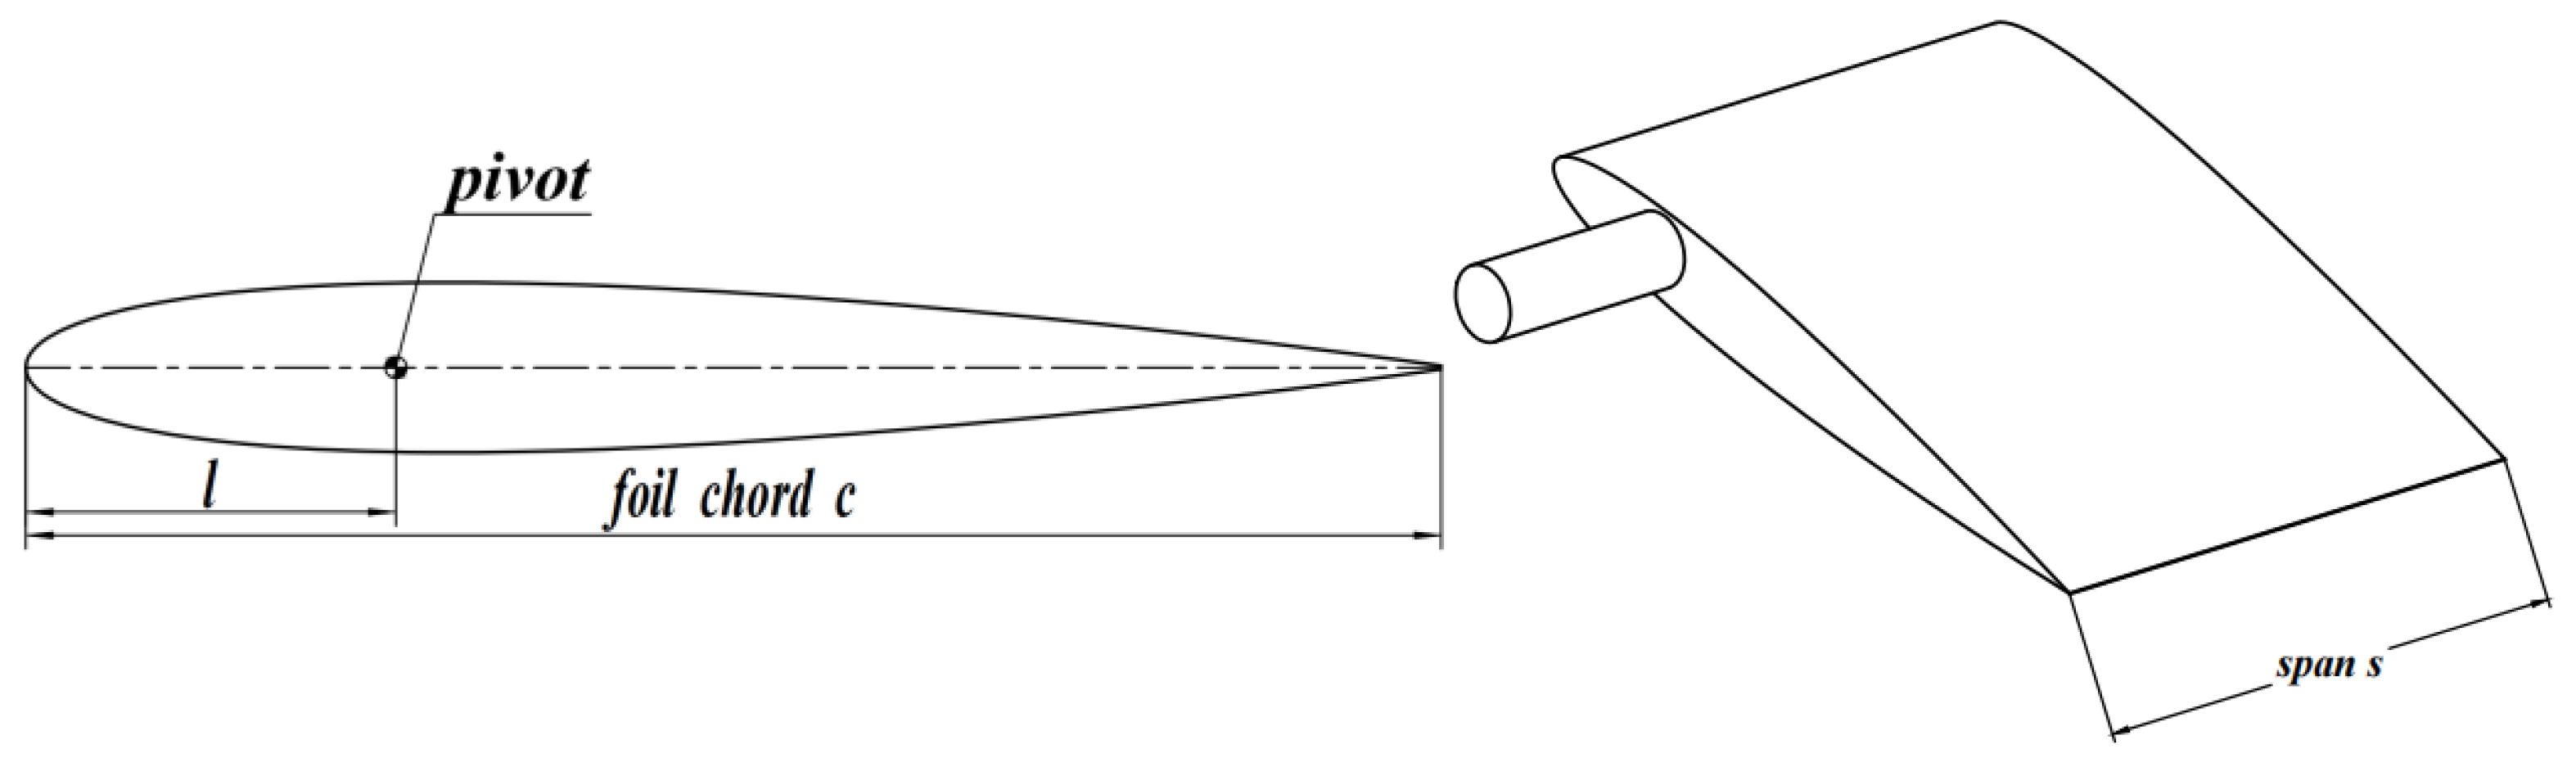
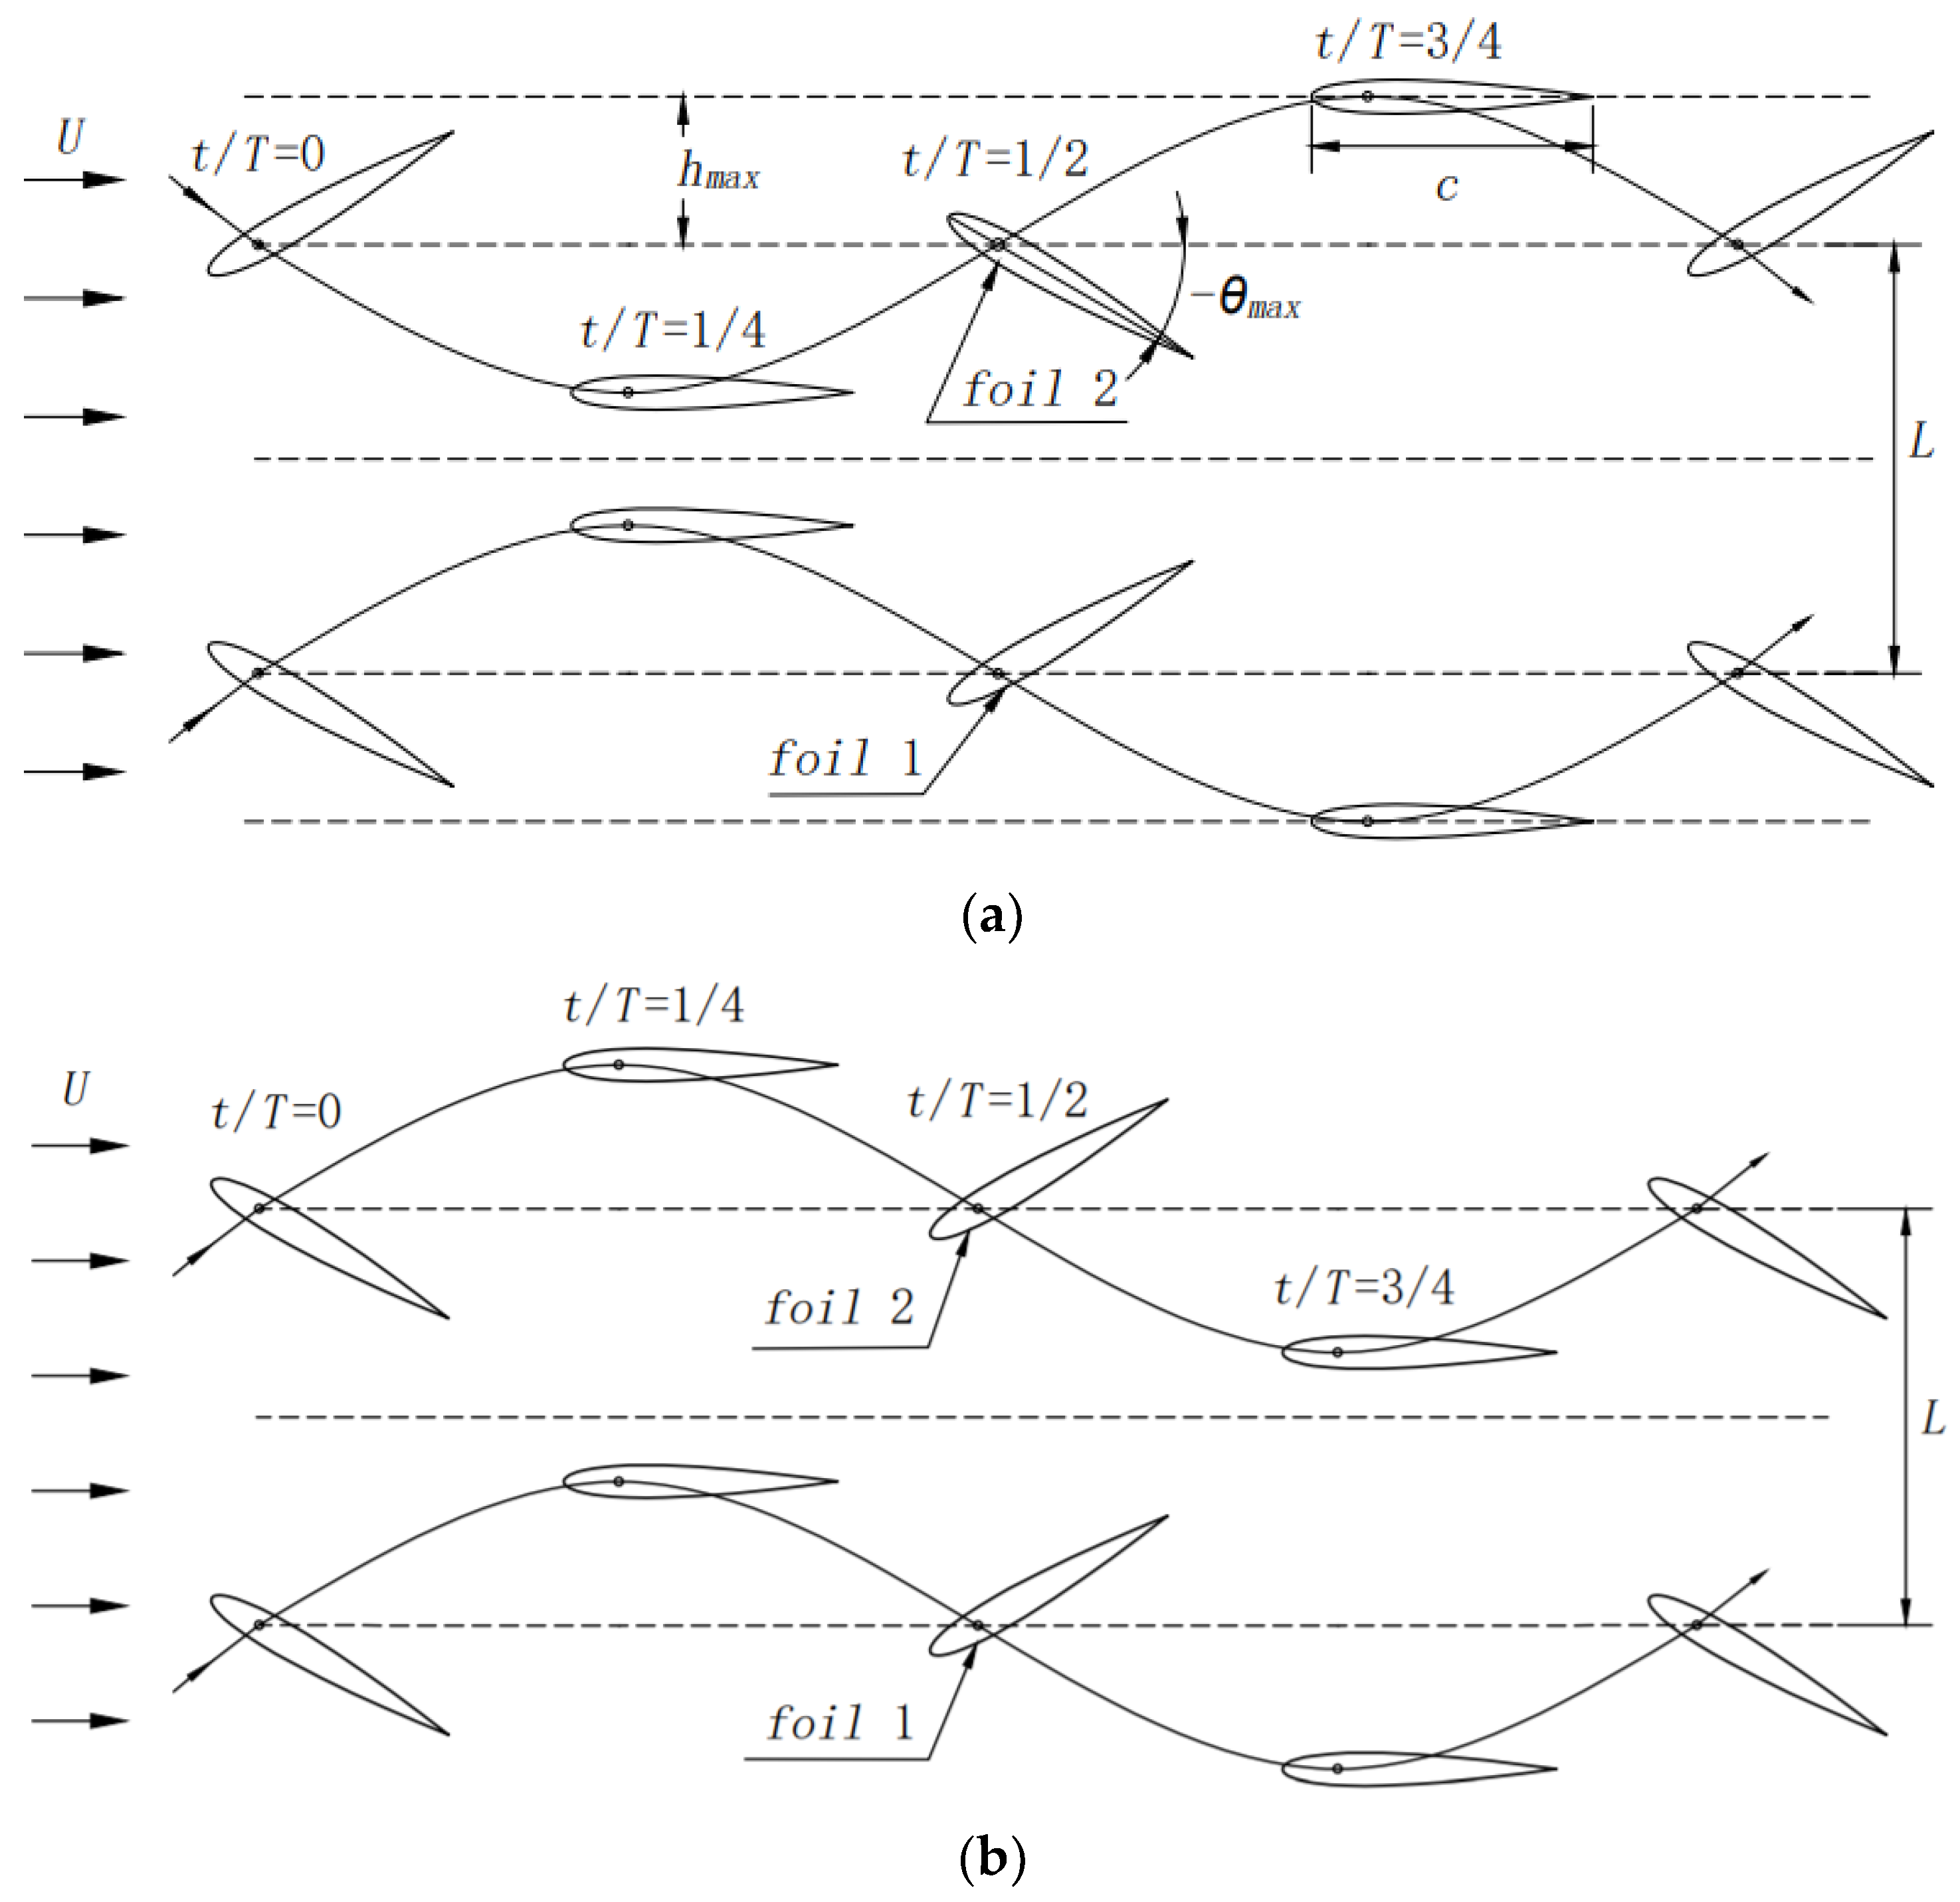
2.1. Motion Description
2.2. Mechanical Parameters and Pumping Indicators
3. Numerical Method and Validation
3.1. Governing Equation and Turbulence Model’
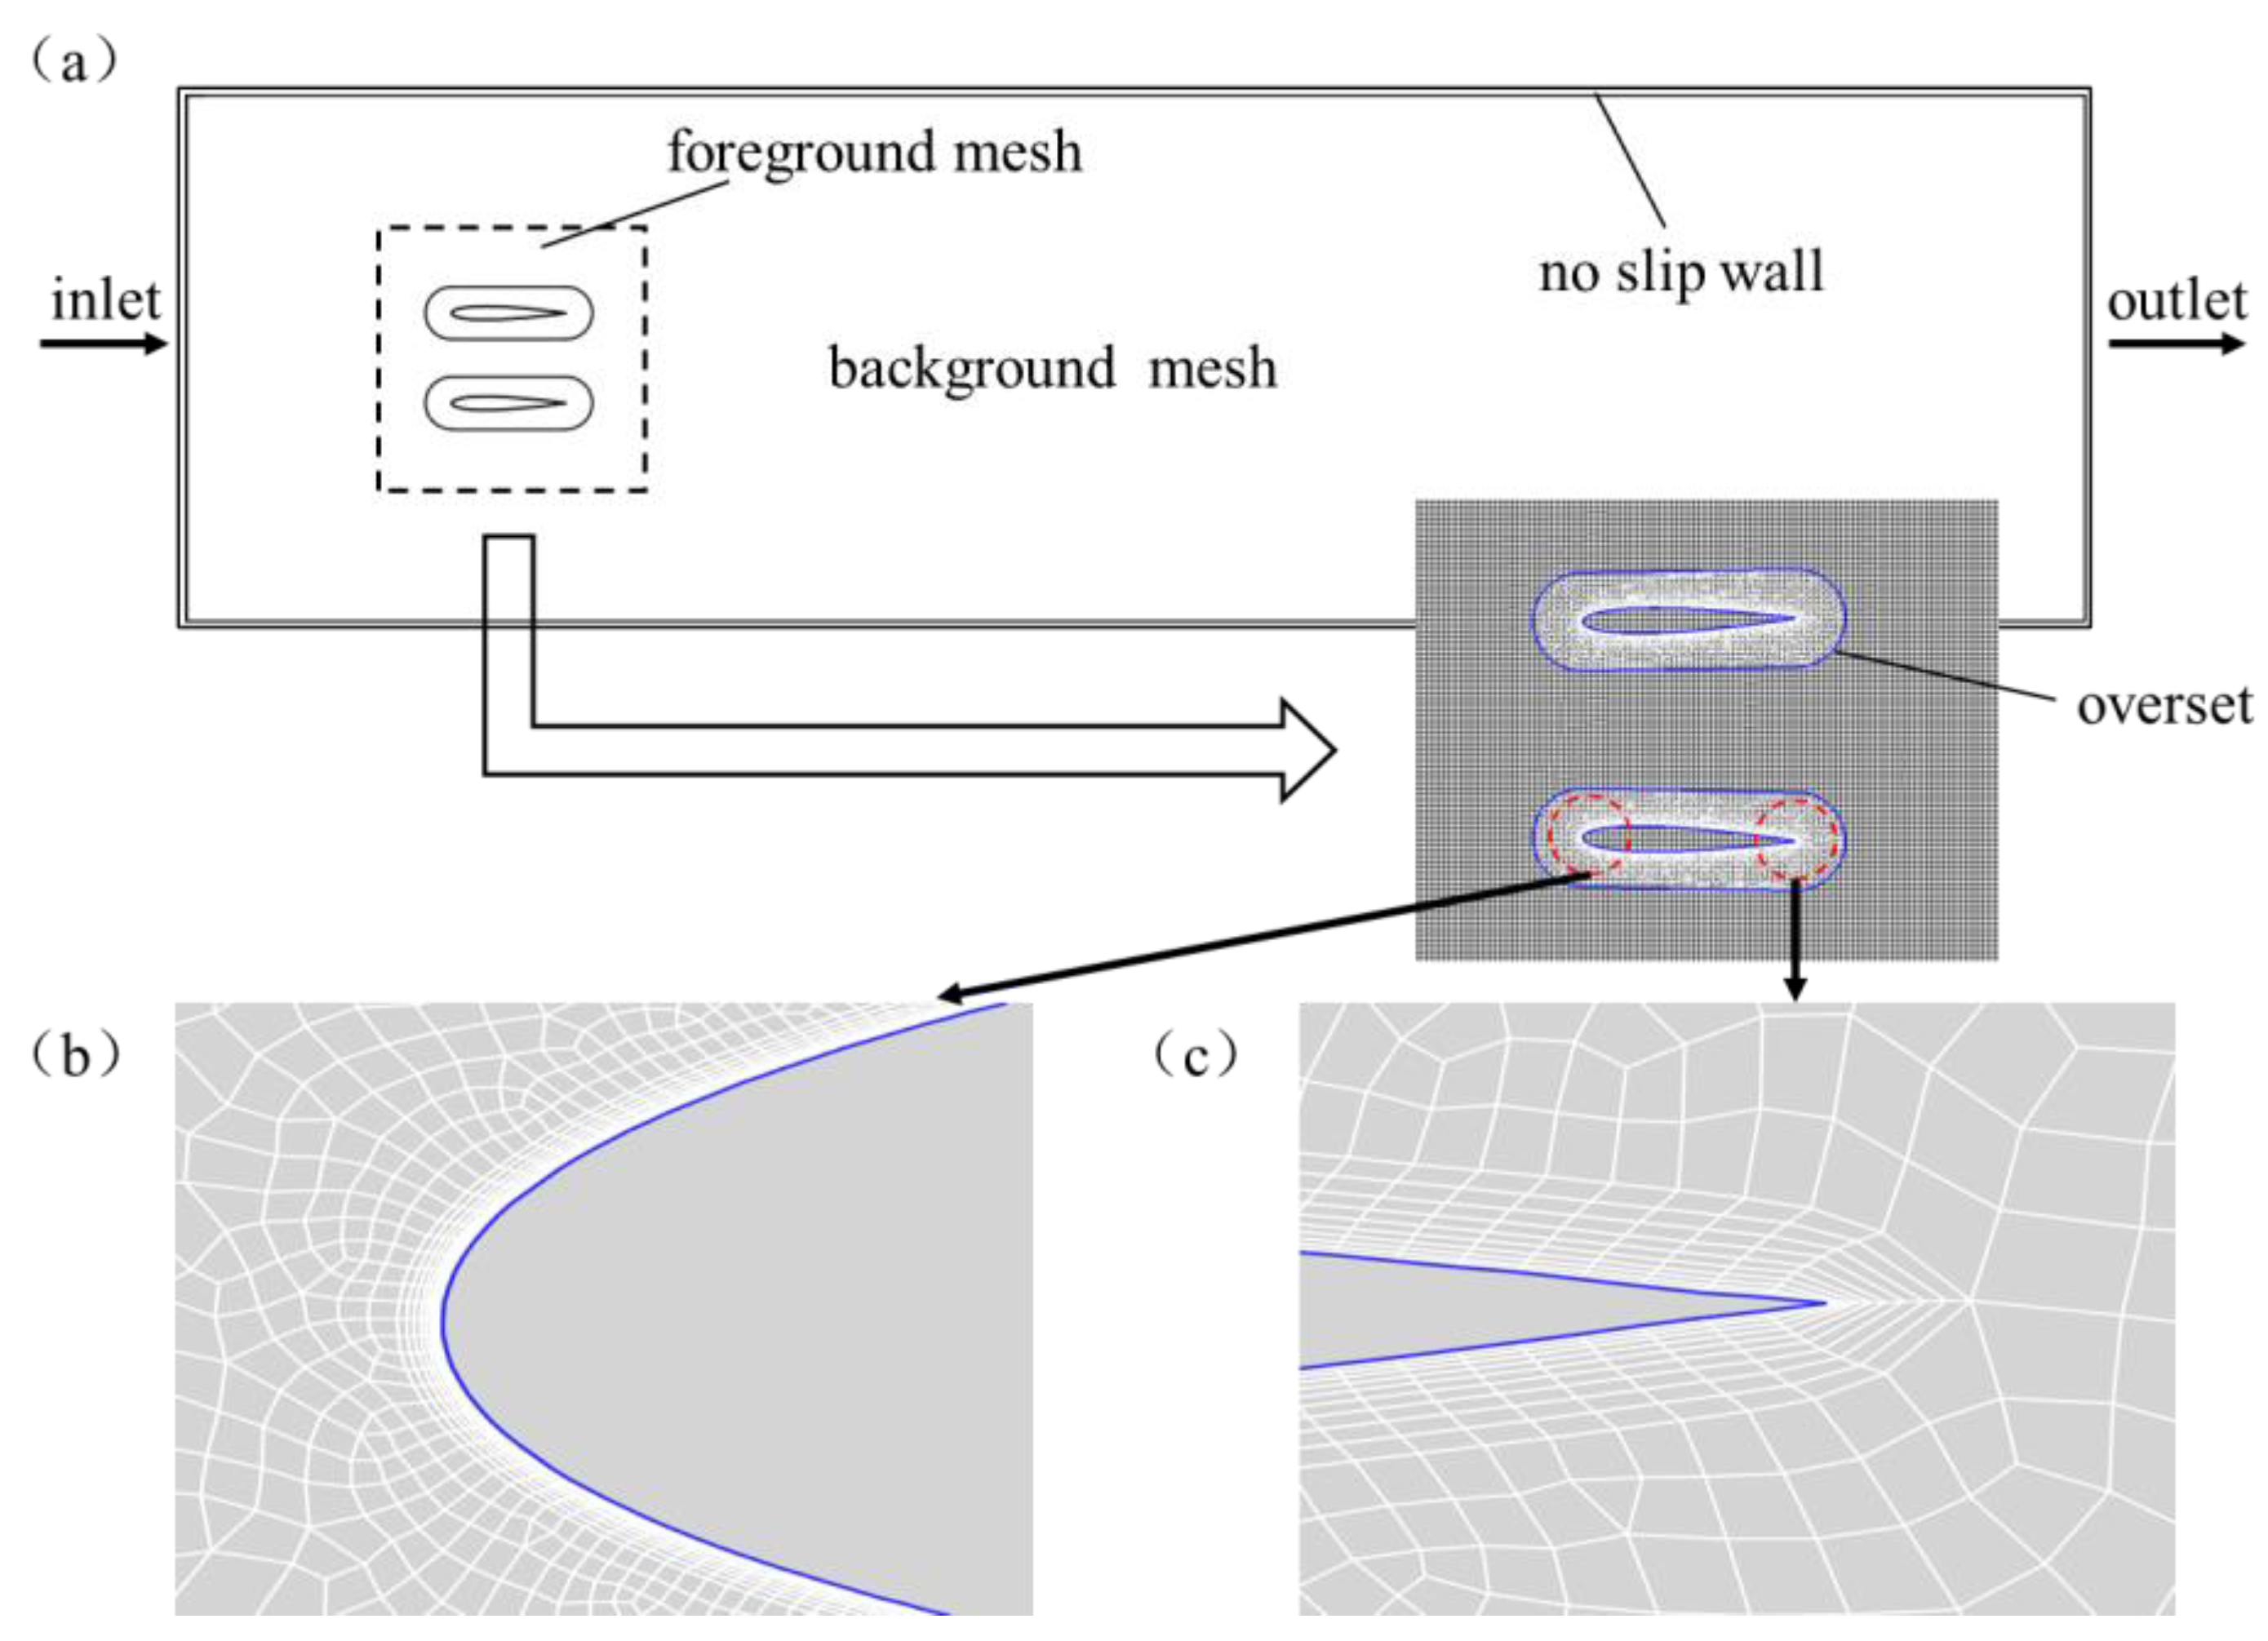
3.2. Computational Domain and Mesh Generation
3.3. Boundary Conditions and Parameter Settings
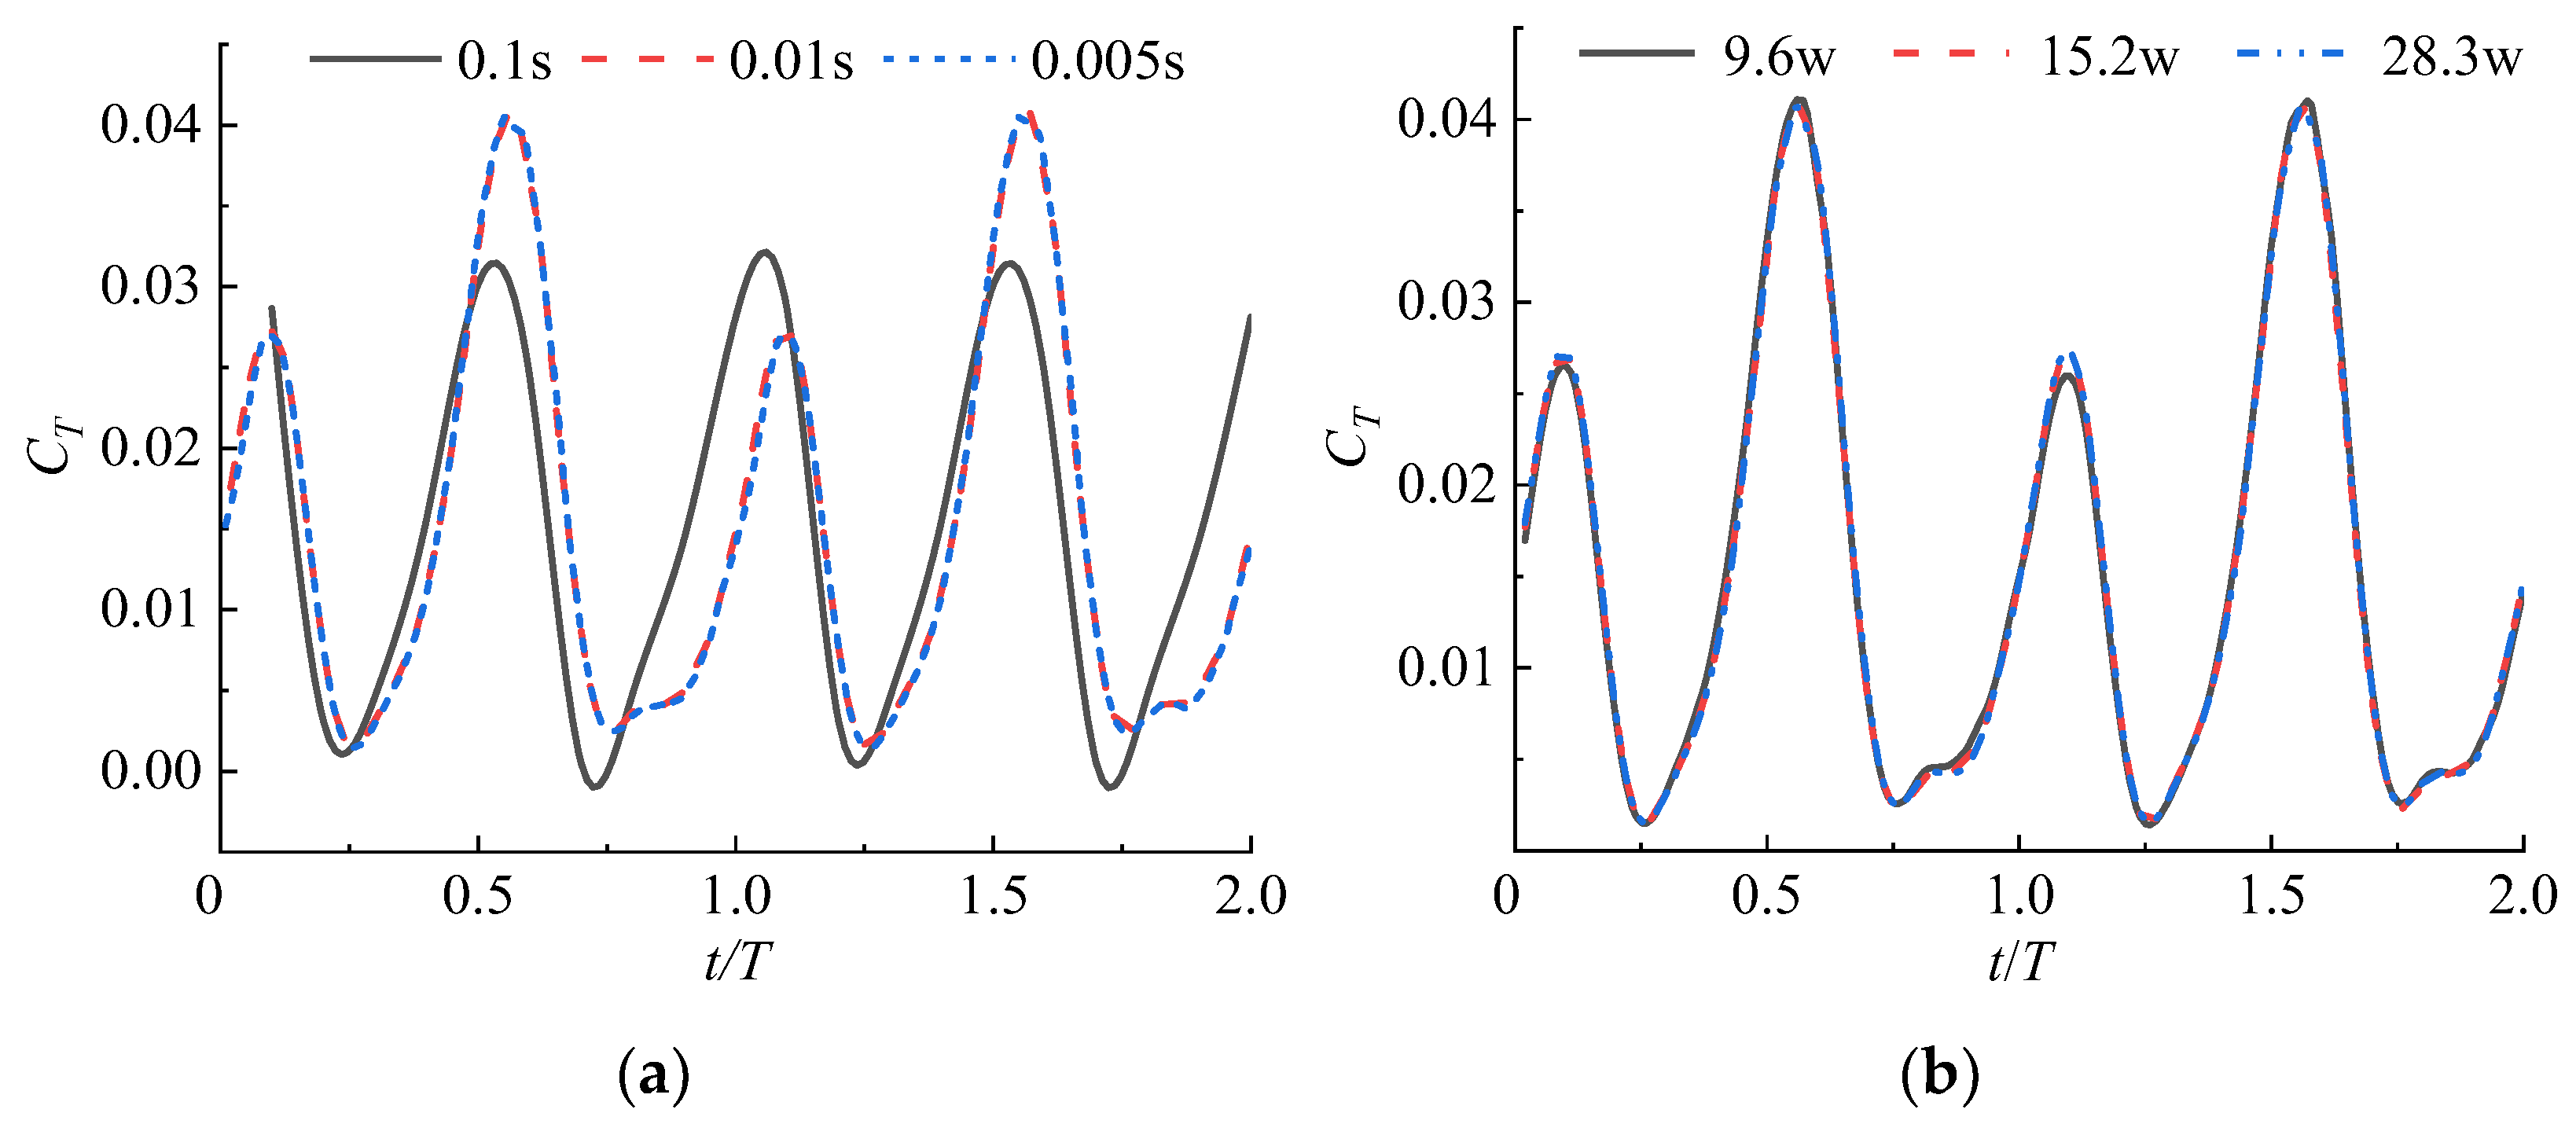
3.4. Verification of the Irrelevance of the Time Steps and Grid Number
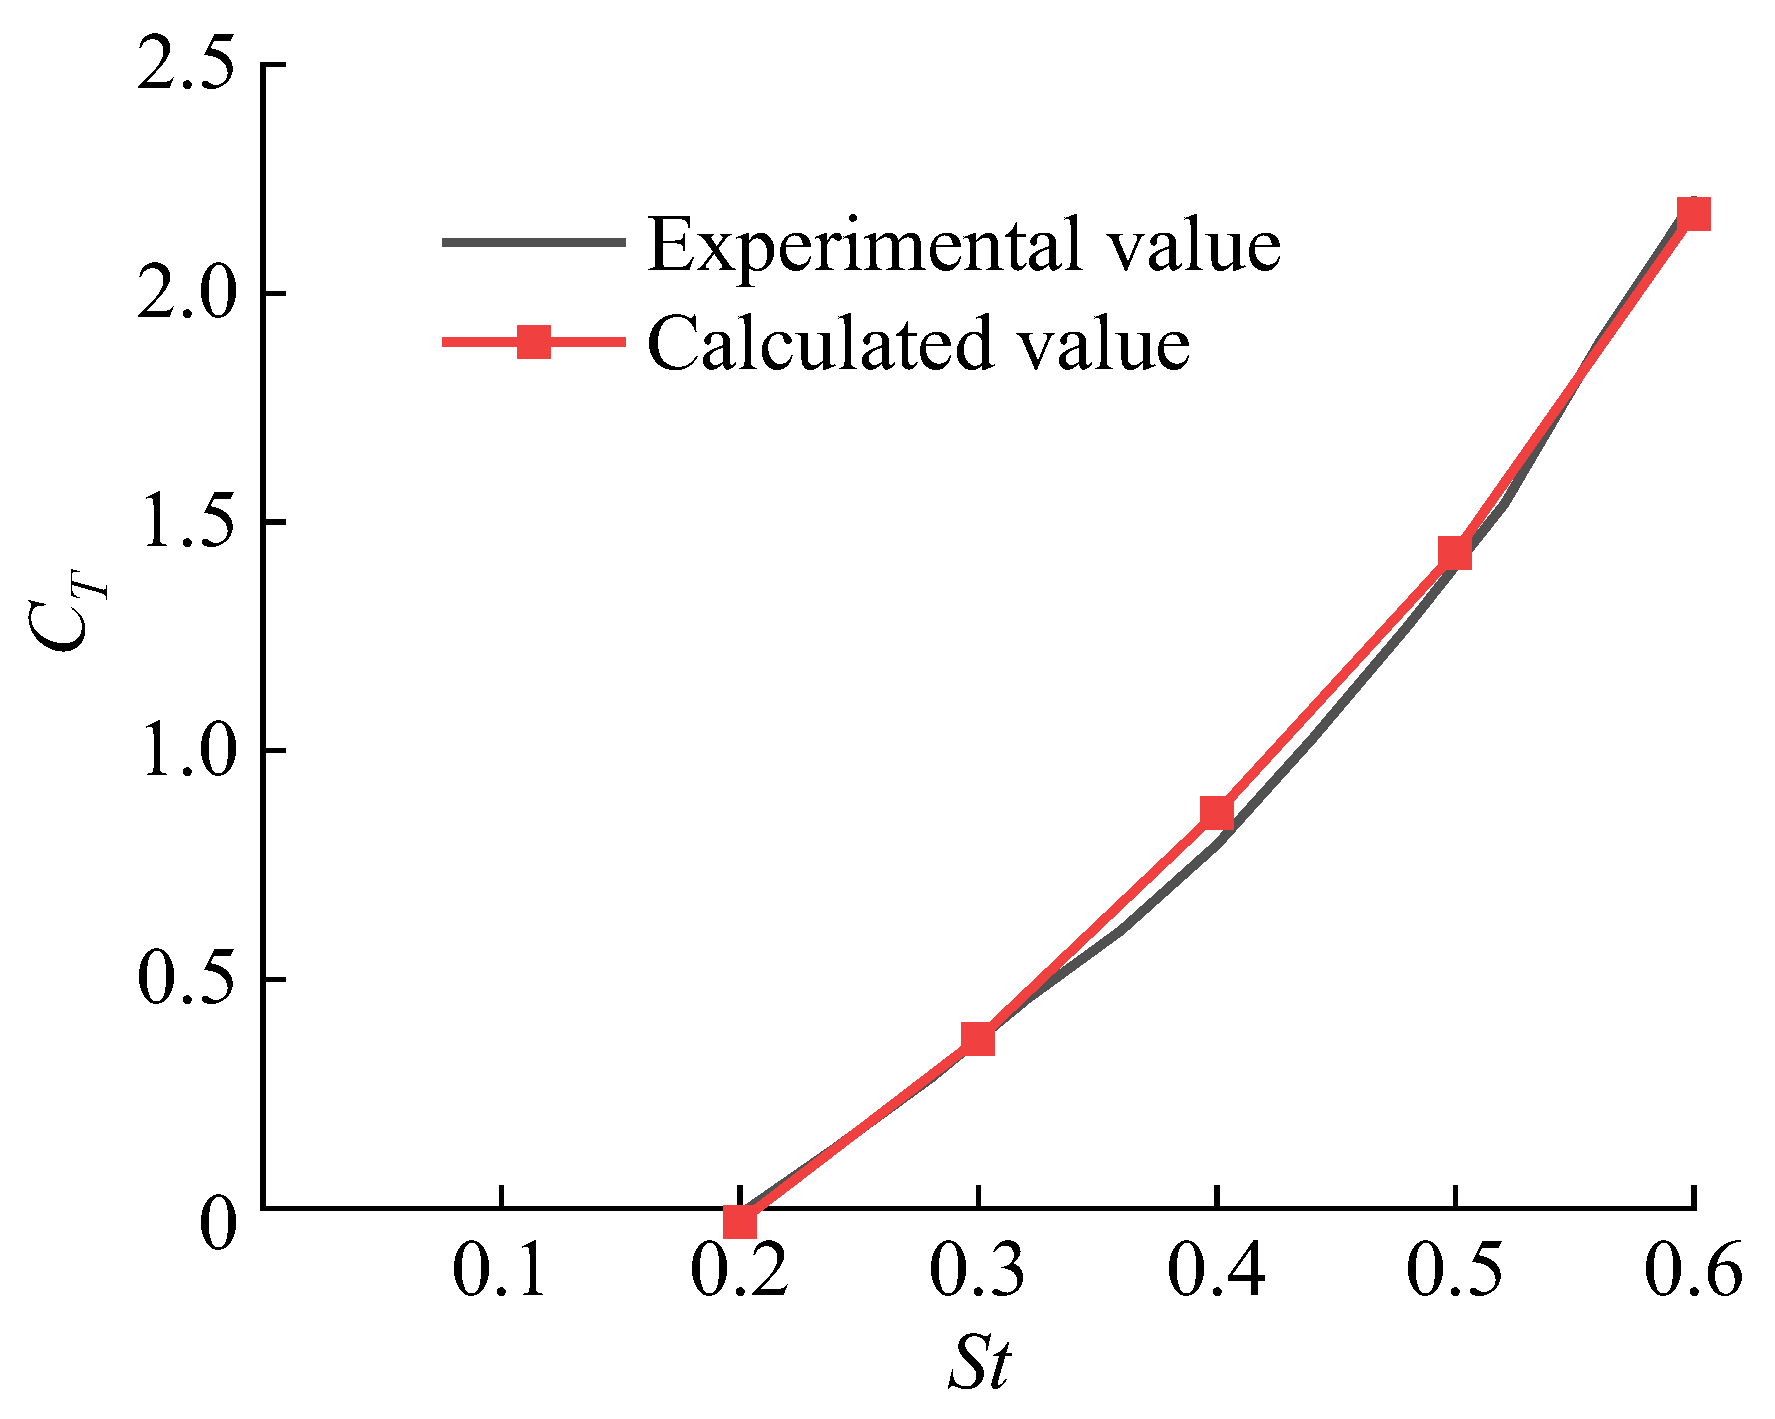
3.5. Validation
4. Experimental Setup
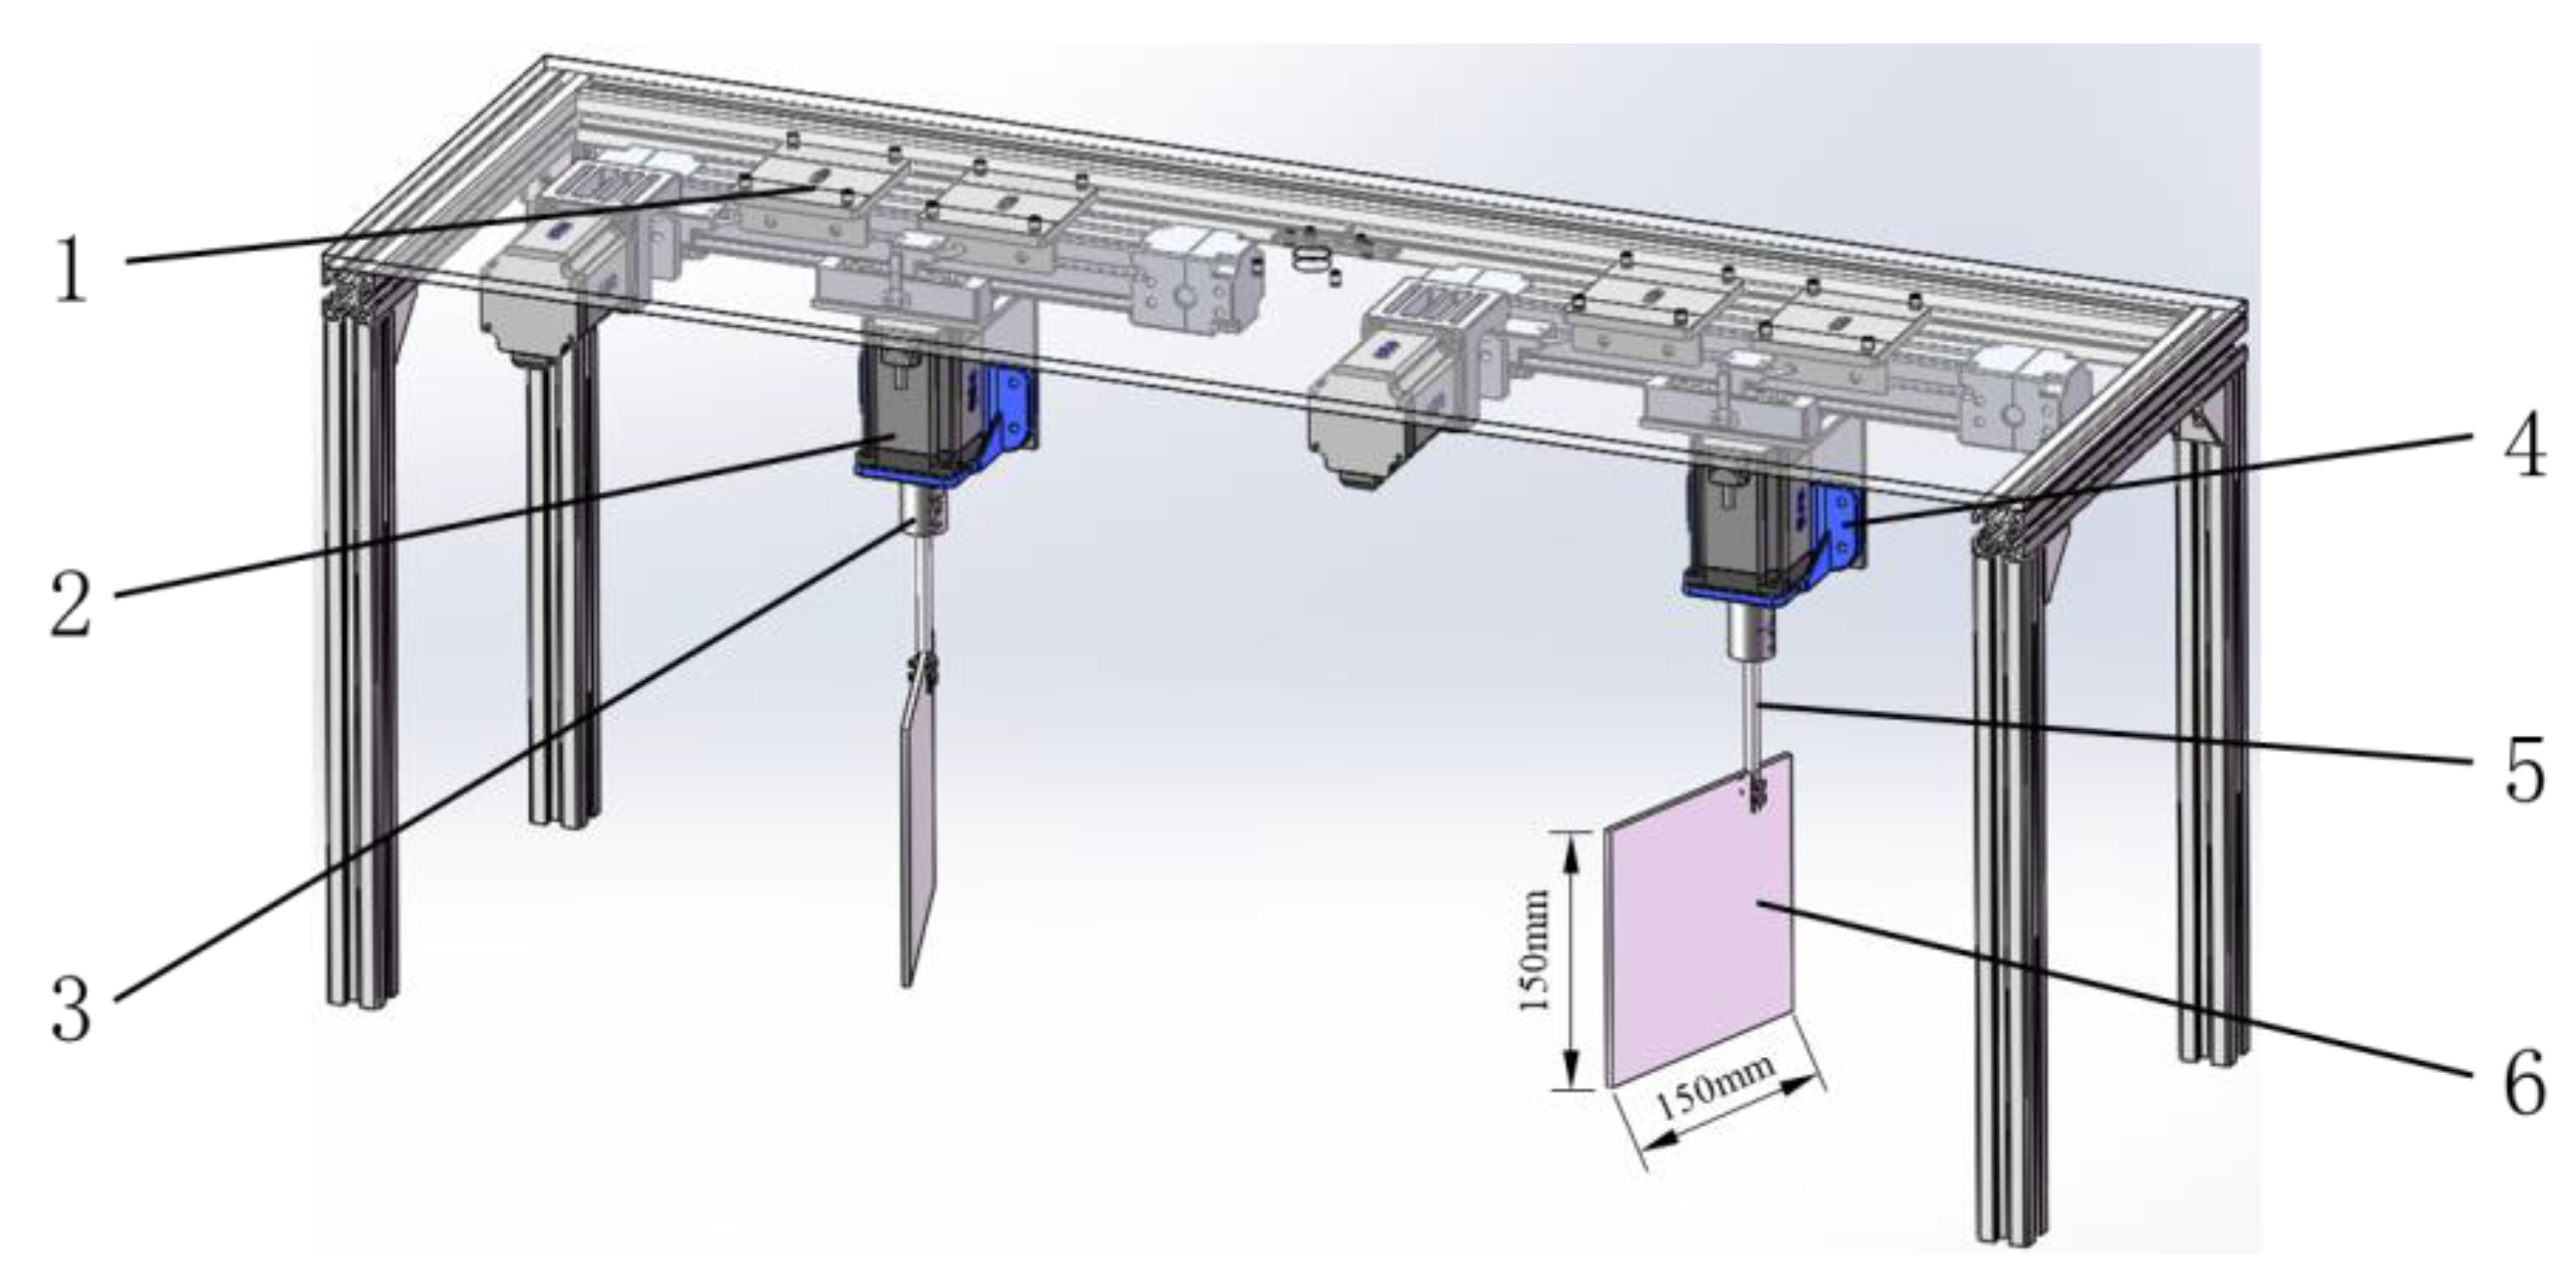
4.1. Bionic Pumping Device
4.2. Uncertainty Analysis
5. Results and Analysis
5.1. Influence of Two Oscillation Modes on Mechanical Properties
5.2. Influence of Two Oscillation Modes on the Flow Field
5.3. Influence of Two Oscillation Modes on the Pumping Performance
5.4. Performance Test
6. Conclusions
- (1)
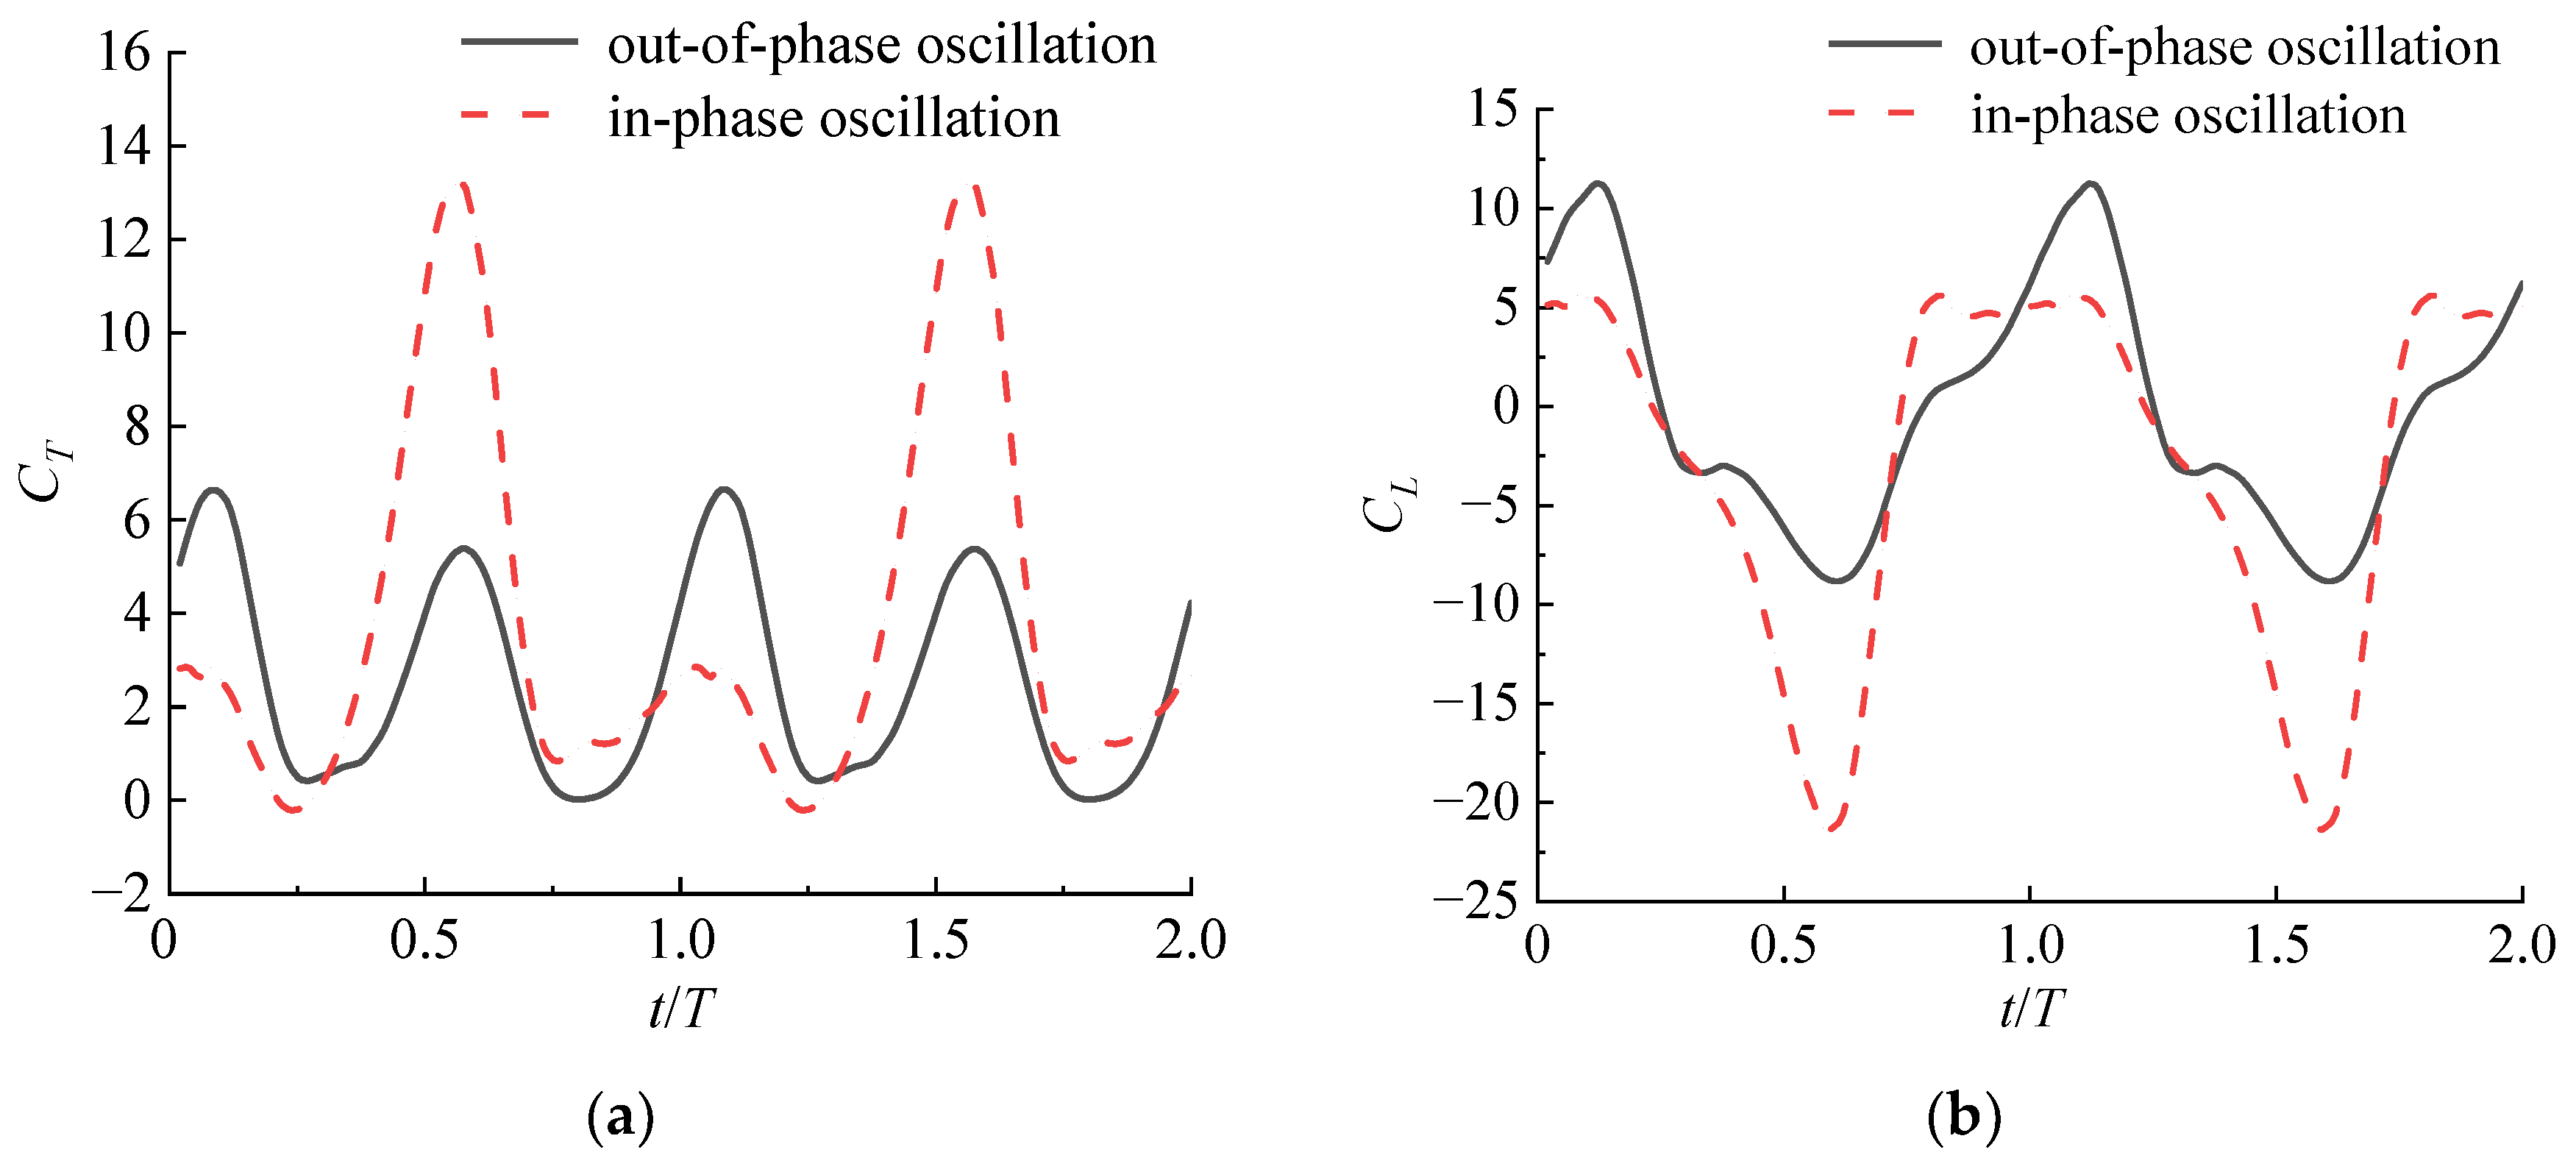
- The mechanical properties of the two oscillation modes exhibit notable distinctions. Out-of-phase oscillation consistently produces thrust throughout a motion cycle, whereas in-phase oscillation generates both thrust and drag forces. Furthermore, under the instantaneous lift coefficient curve, the out-of-phase oscillation is more symmetrical than the in-phase oscillation, indicating that the out-of-phase oscillation’s flow field is more uniform.
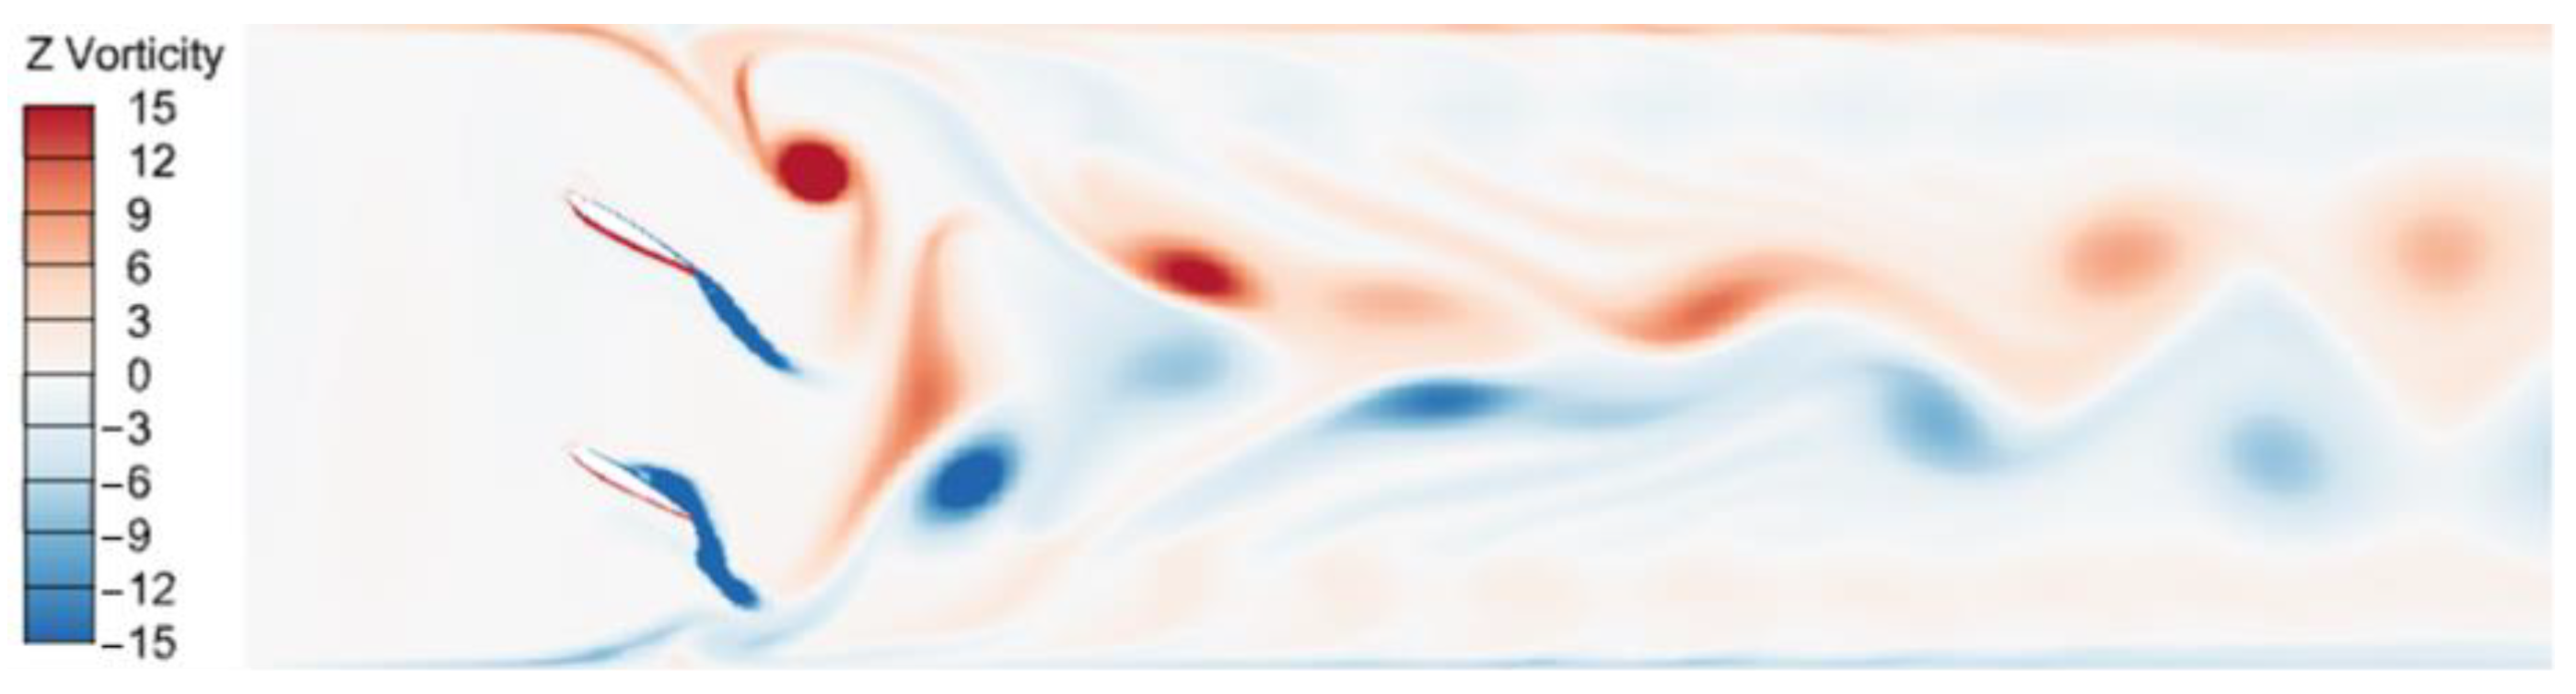
- (2)
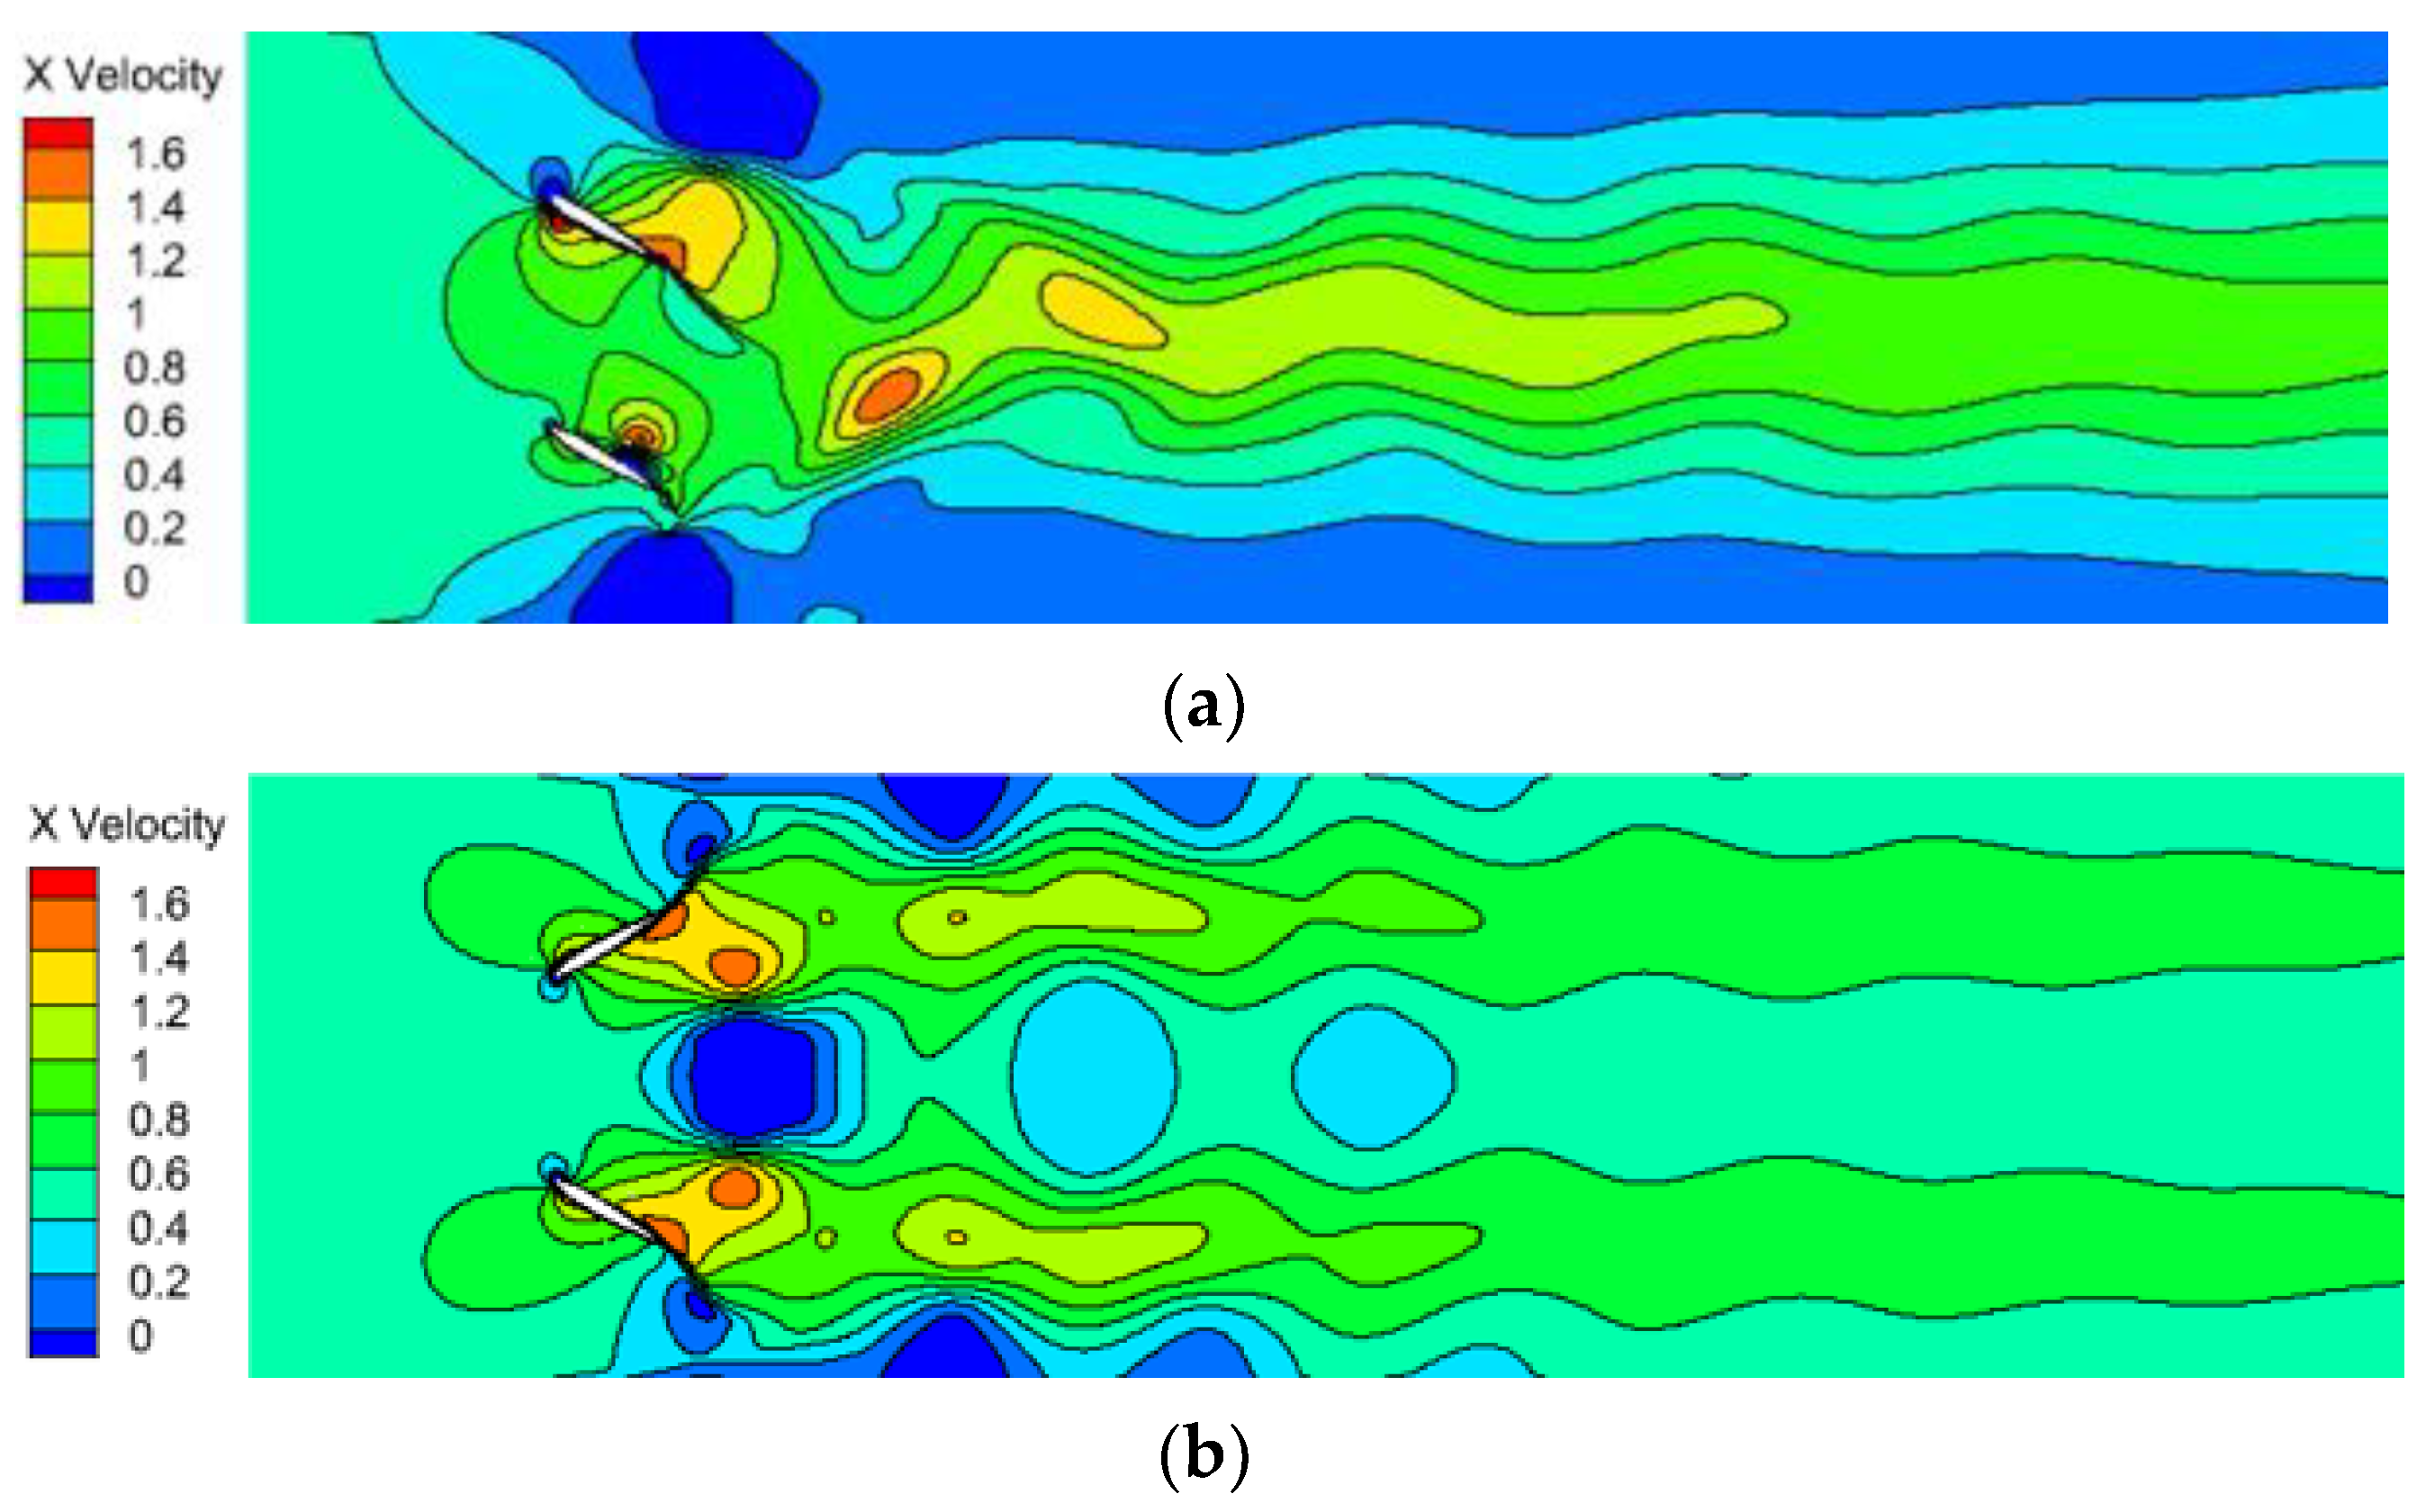
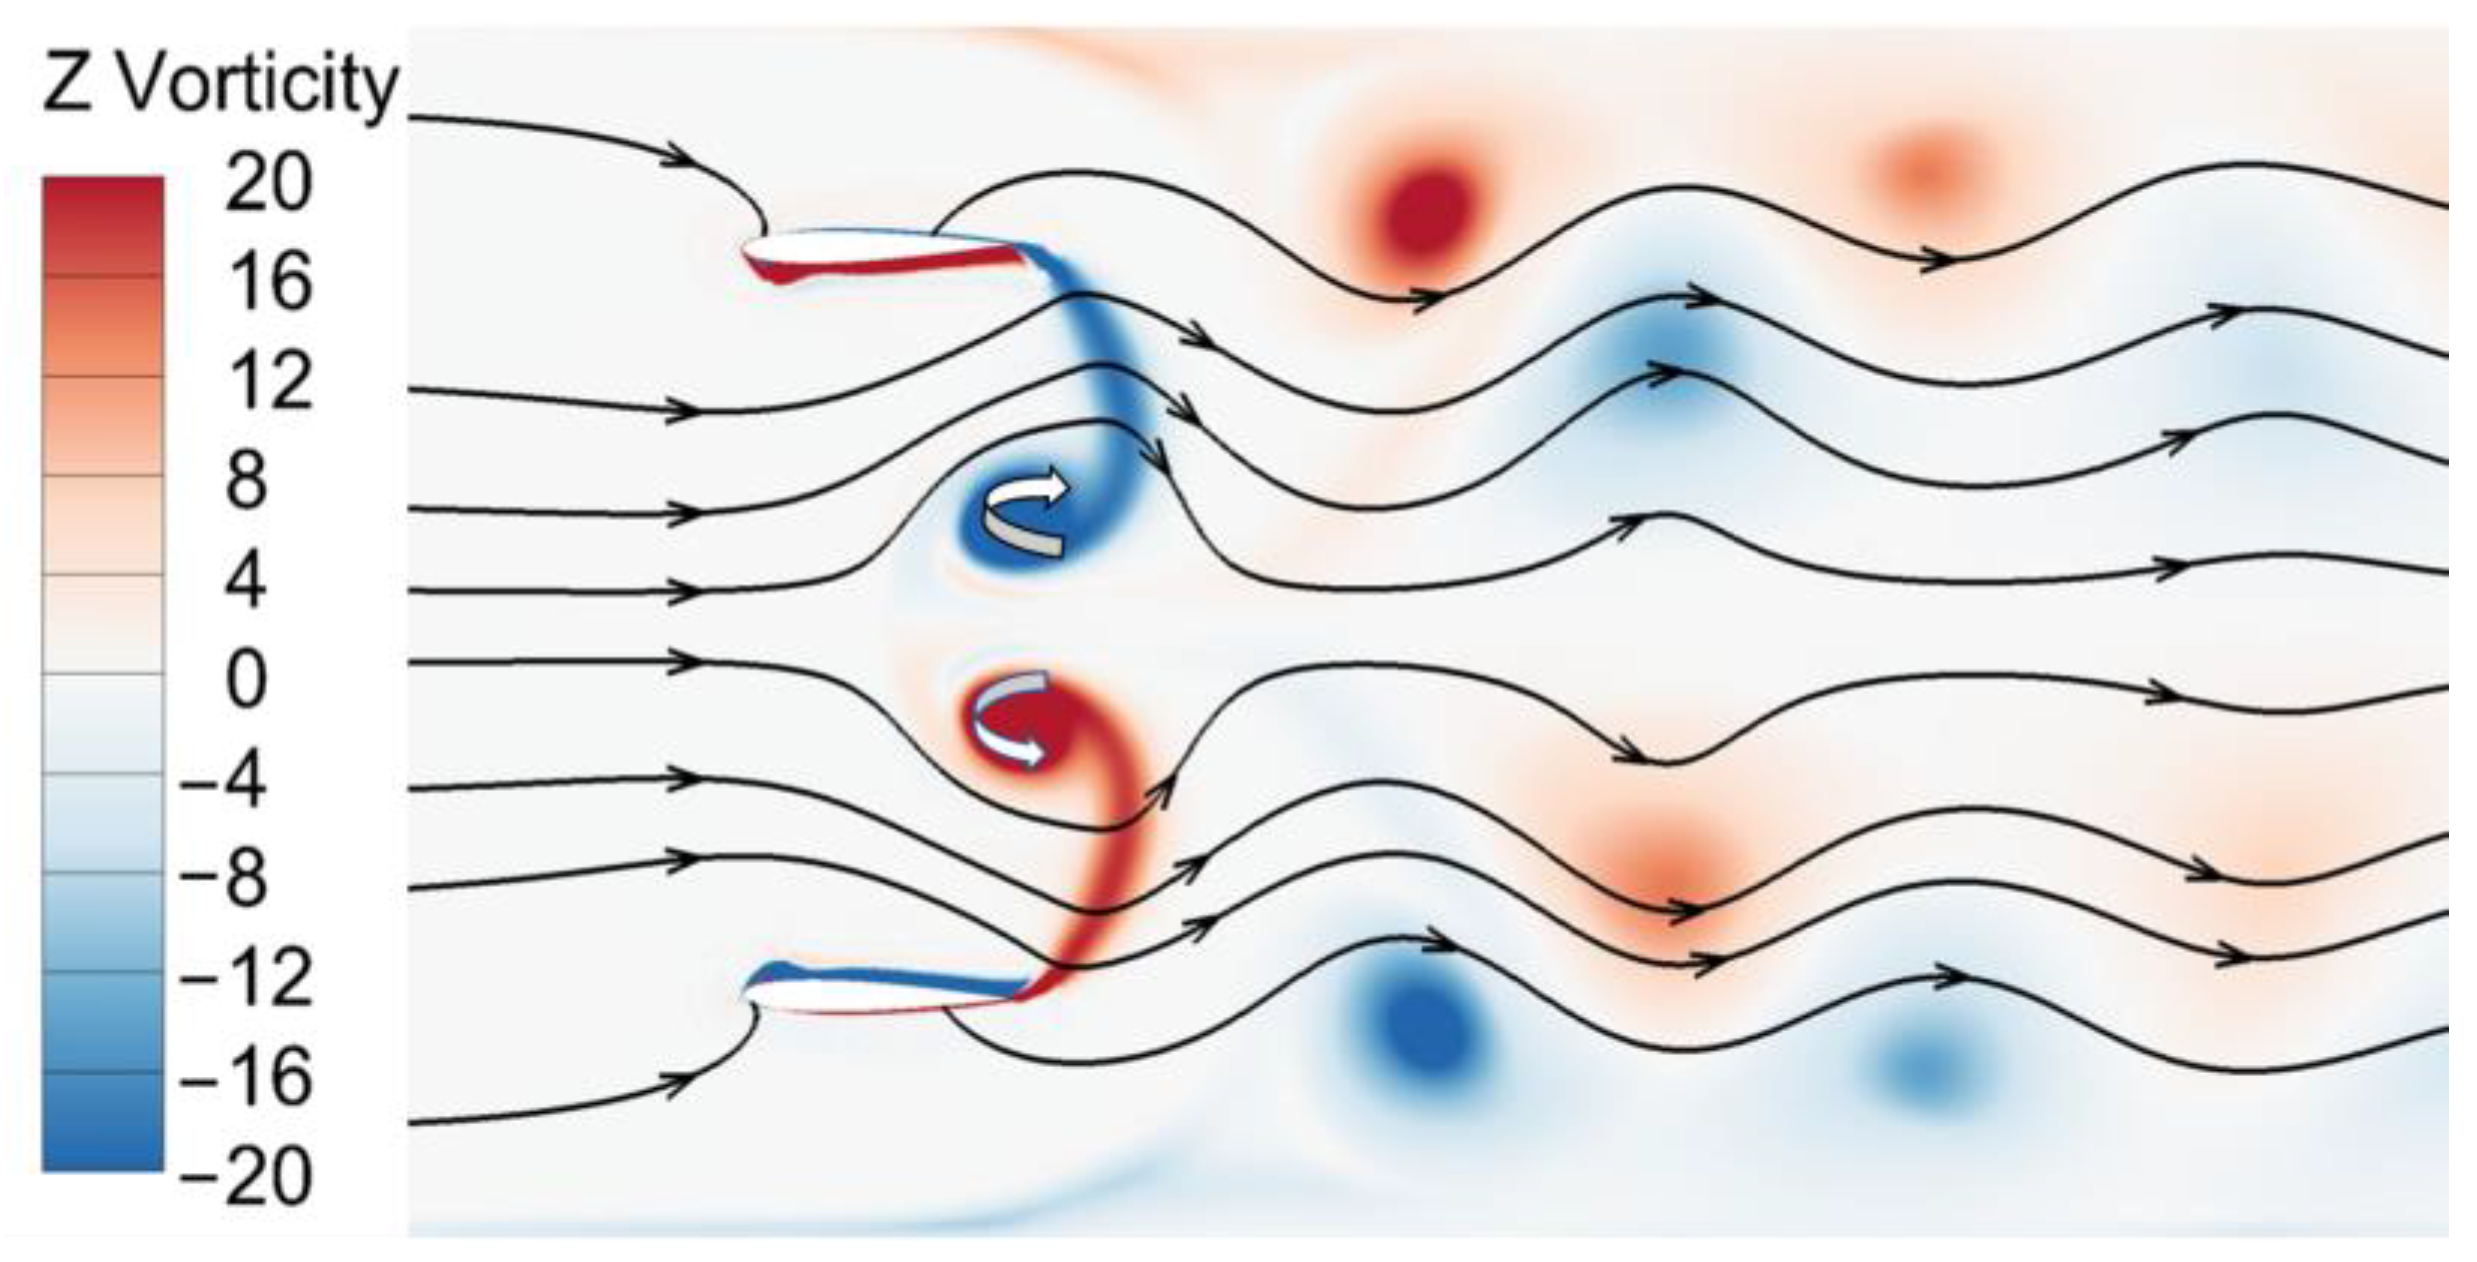
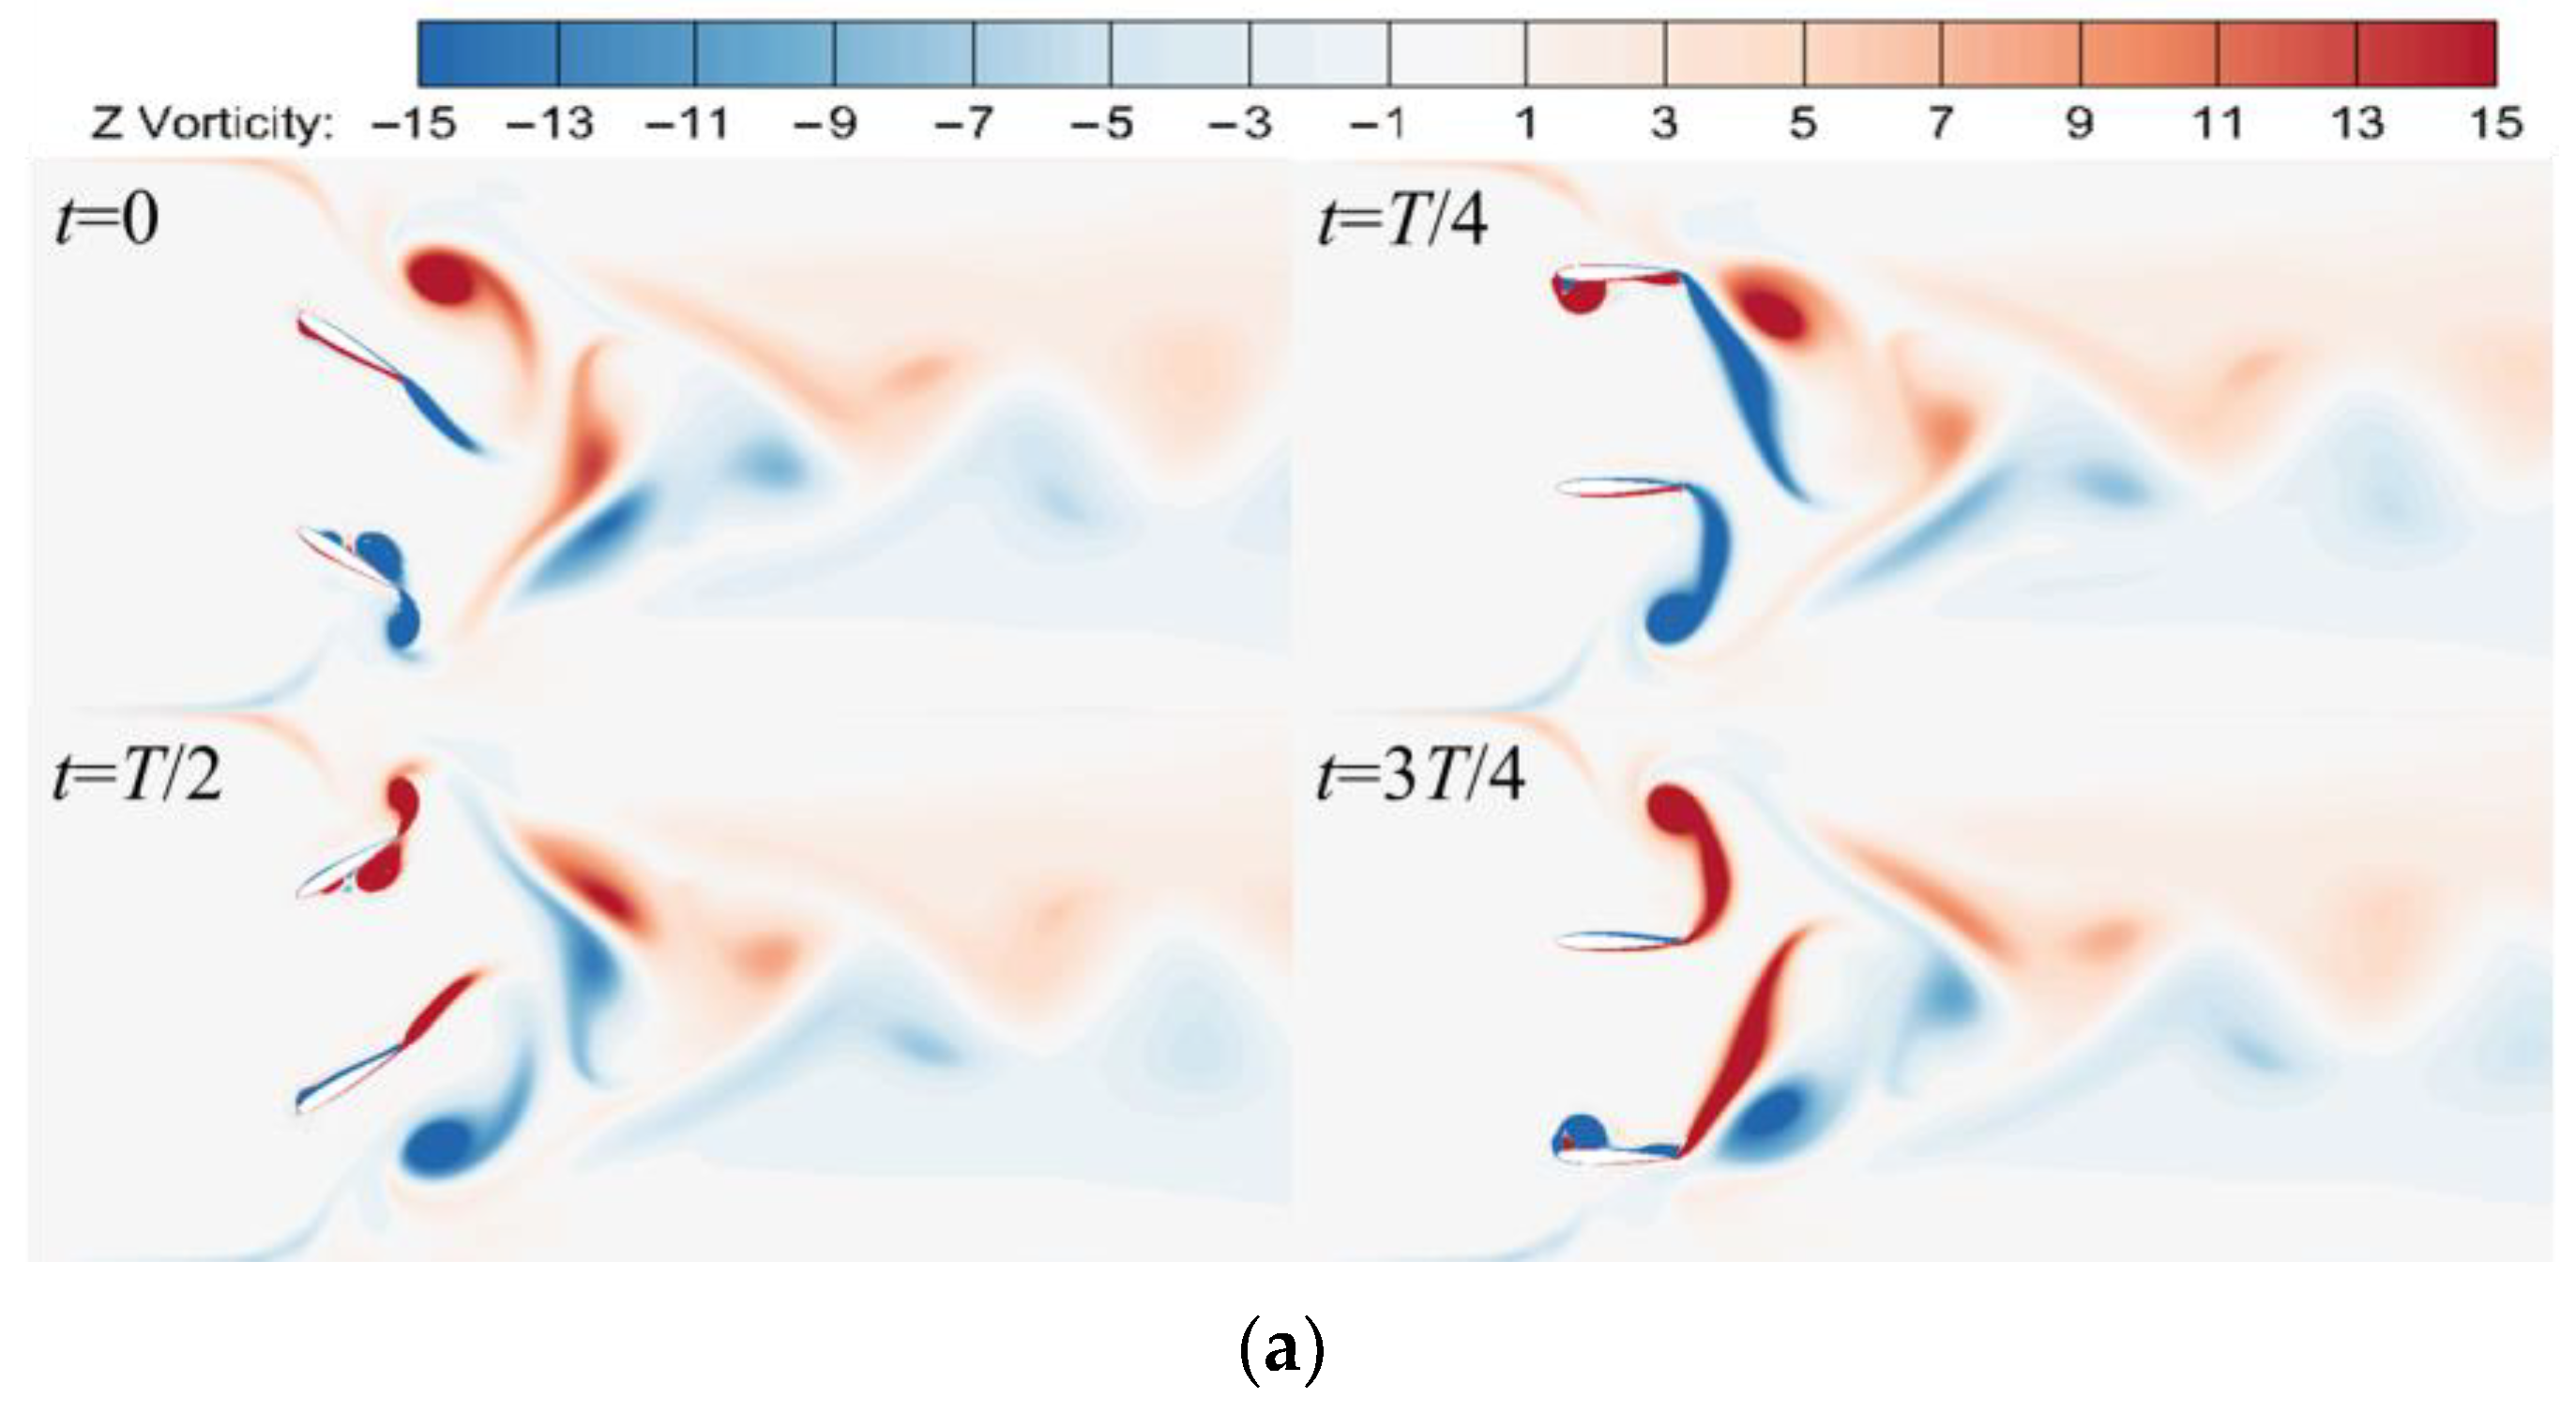
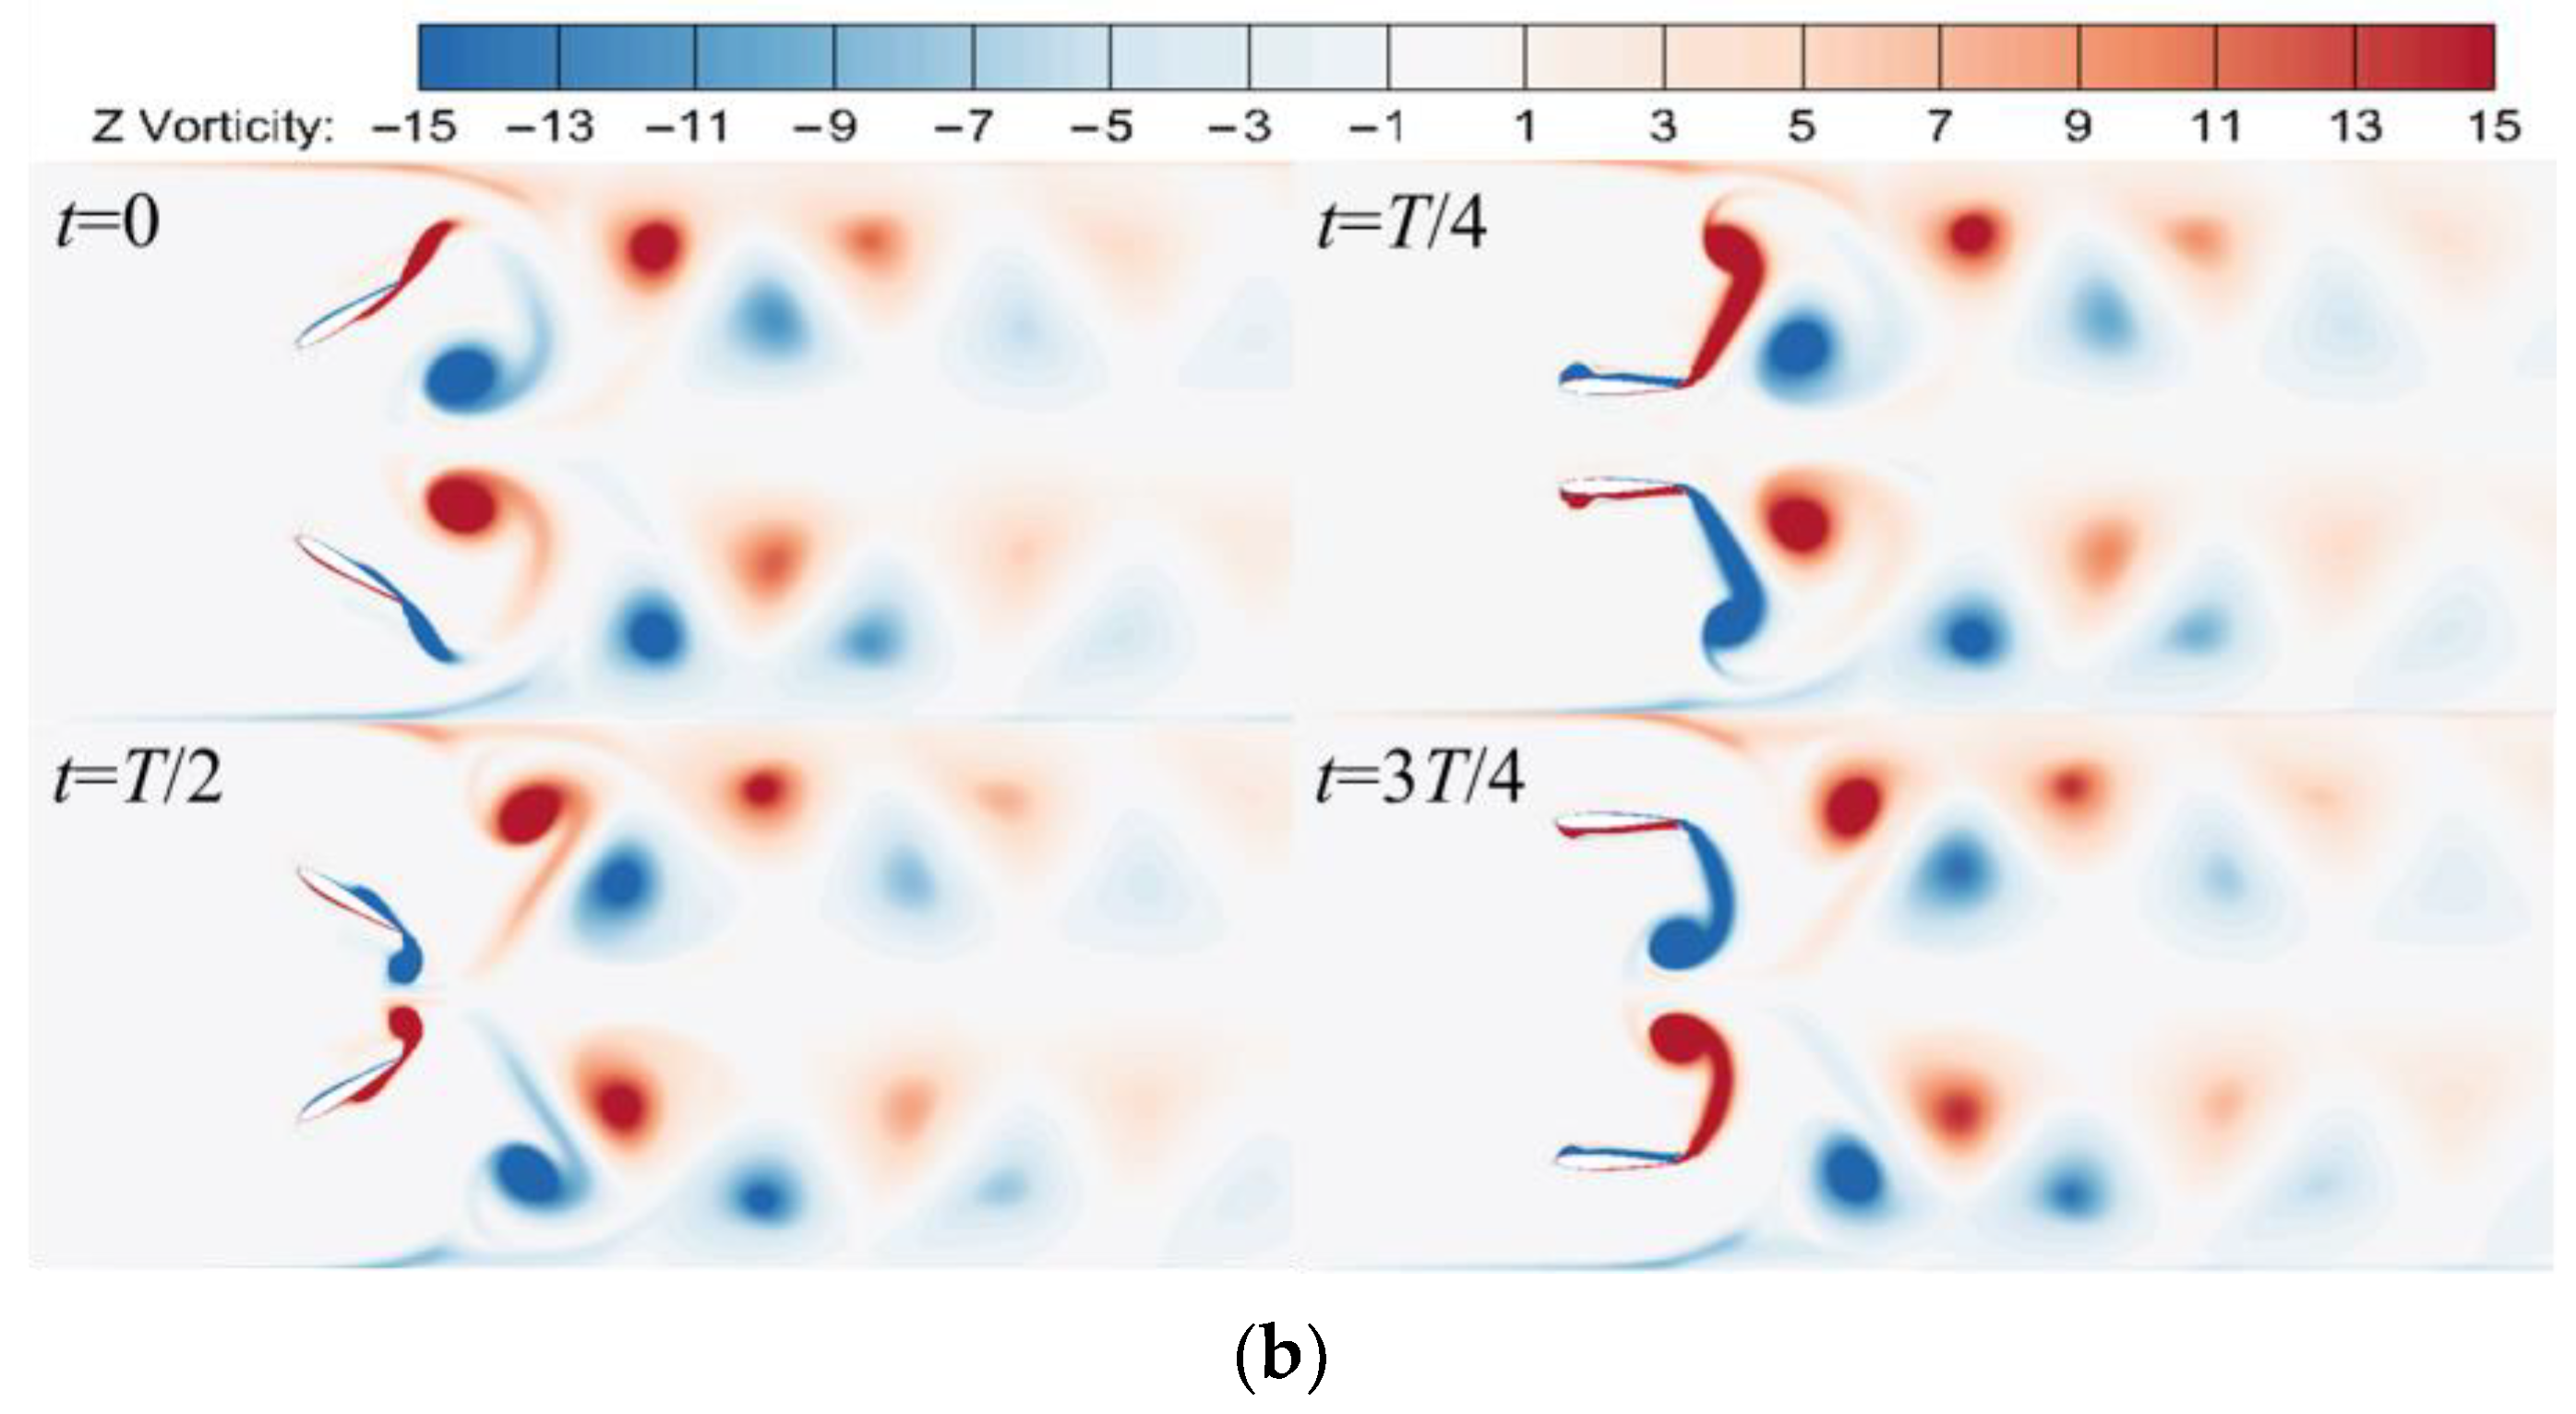
- The form of the tail vortex structure is a crucial determinant affecting the hydraulic performance of the dual flapping foil. There is a significant difference in the tail vortex structure between the two oscillation modes, with in-phase oscillation forming a pair of vortex streets and out-of-phase oscillation forming two pairs of vortex streets. Furthermore, it influences the flow field, whereby in-phase oscillation results in the formation of a single straight jet, while out-of-phase oscillation led to the formation of two parallel straight jets.
- (3)
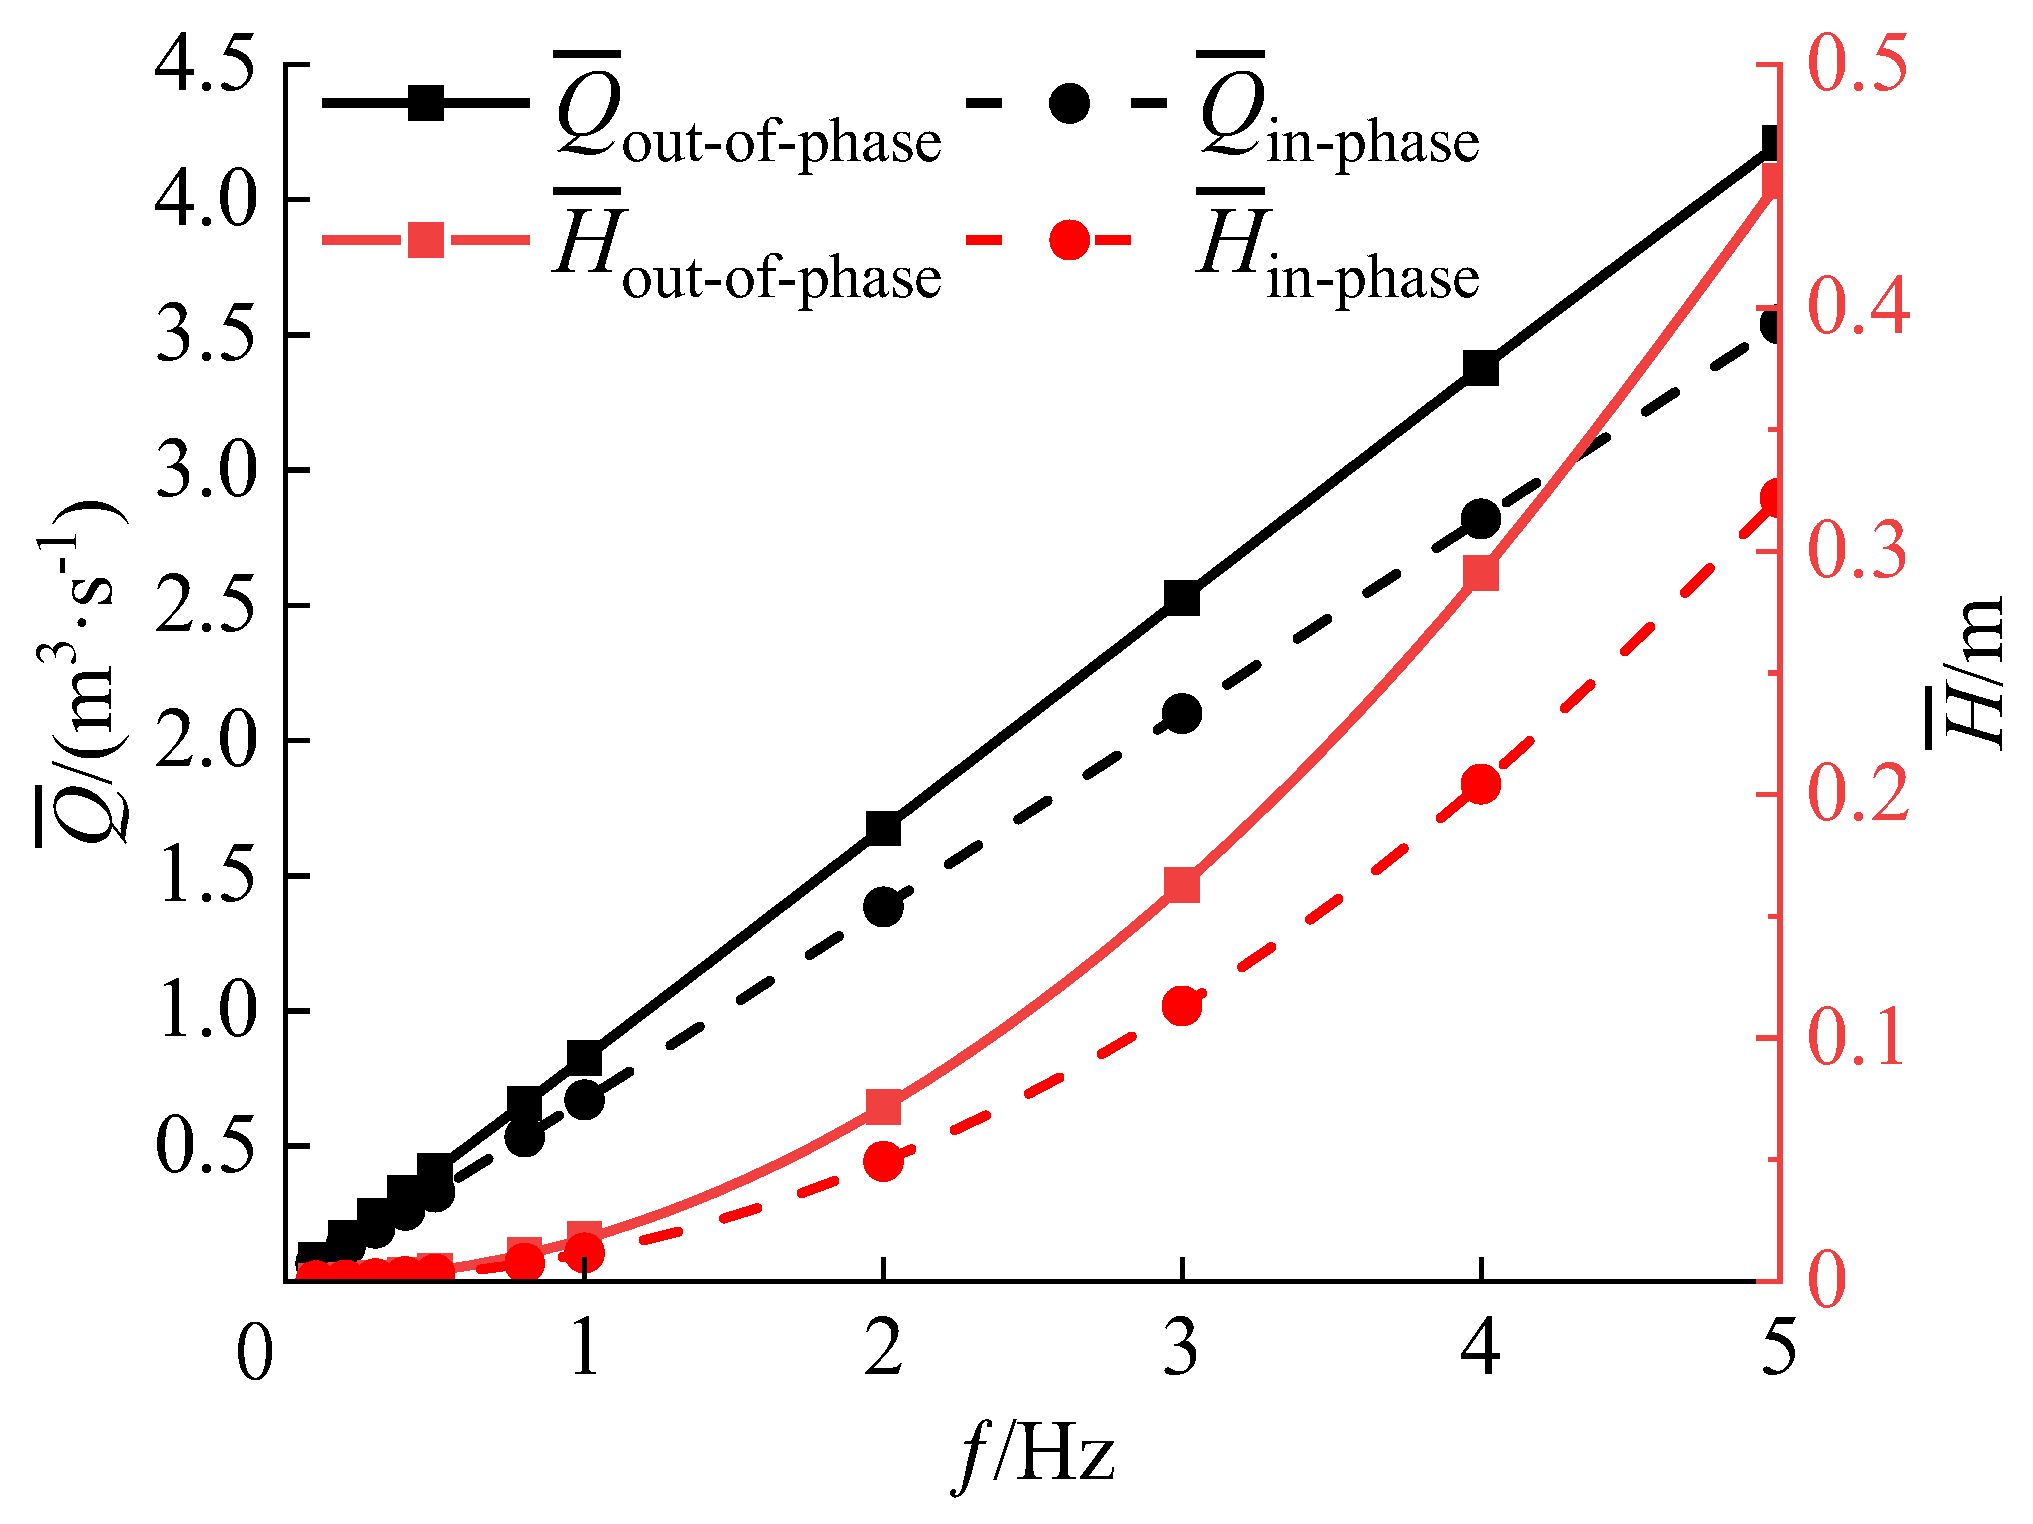
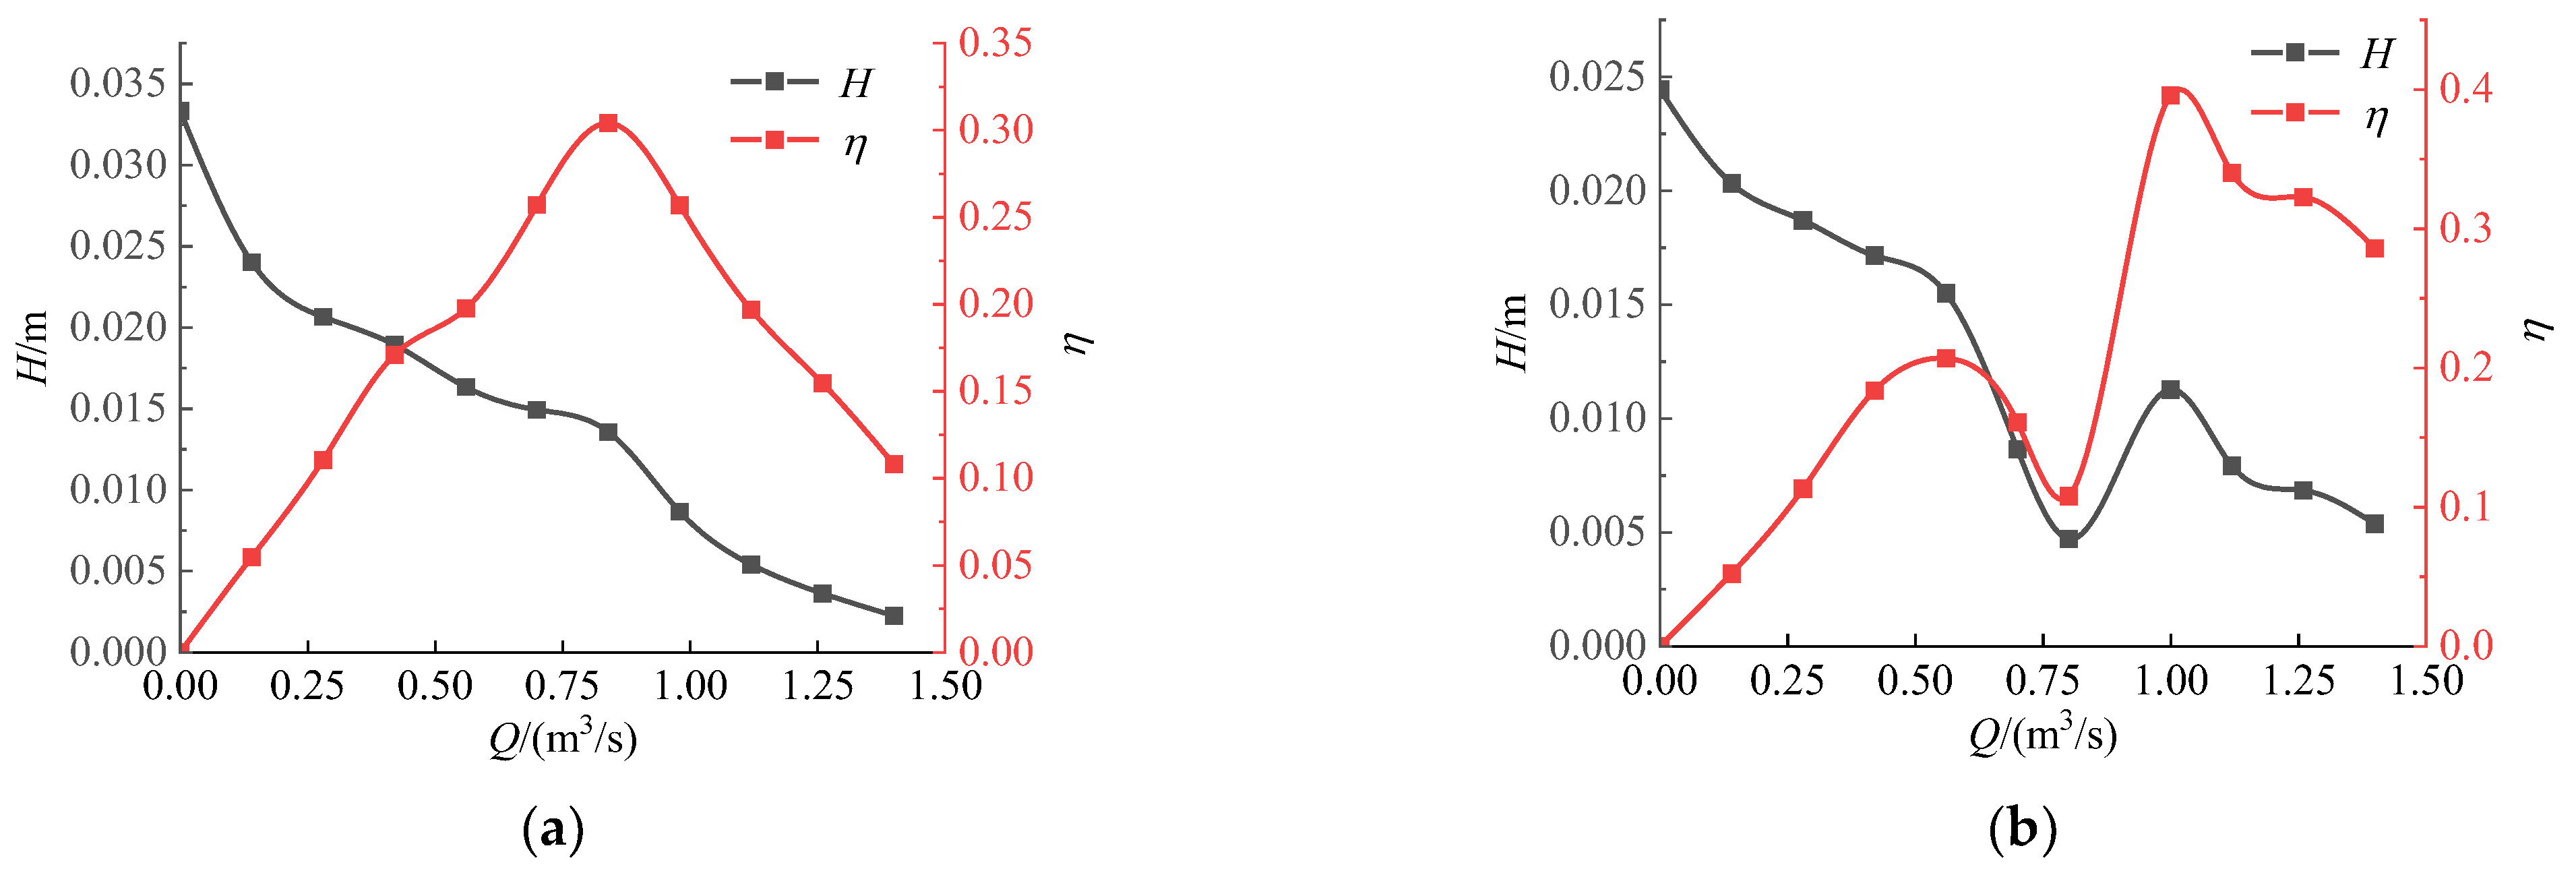
- Both oscillations have propulsive effects on the water body. The pumping efficiency of the out-of-phase oscillation is greater than that of the in-phase oscillation. Specifically, with the oscillation frequency f = 1 Hz, the pumping efficiency of the out-of-phase oscillation reaches 38.4%, which is 90.5% greater than that of the in-phase oscillation. Furthermore, it should be noted that the out-of-phase oscillation results in a greater outlet flow, a more uniform flow field structure, and a superior pumping effect. Experimental verification has demonstrated that the out-of-phase oscillation yields a greater outlet flow rate when compared to the in-phase oscillation.
- (4)
- The calculation results show that the dual flapping foil and conventional pumps have similar characteristic curves. However, in the flow rate range of 0.64~1 m3/s, the characteristic curve of the dual flapping foils with in-phase oscillation reveals an “S” type unstable oscillation phenomenon, namely the hump phenomenon, which will lead to the instability of the device. In contrast, out-of-phase oscillation does not exhibit this phenomenon, effectively extending its application range. In addition, the out-of-phase oscillating hydrofoil has a reduced applicable head, allowing it to better meet the requirements of ultra-low head conditions.
Author Contributions
Funding
Data Availability Statement
Conflicts of Interest
References
- Geng, J.; Wang, Y.; Hu, S.G. WQI based water quality assessment and spatial-temporal change in plain river network area of Jiashan county. Environ. Eng. 2023, 41, 187–193+209. [Google Scholar]
- Liu, J.; Ding, R.; Chen, Y.; Zhu, W.; Fan, Z.; Ma, J. Assessment and Optimization of Water Resources Regulation for River Networks in the Tidal Plain-A Case Study of the Qingsong Area in Shanghai. Water 2022, 14, 3523. [Google Scholar] [CrossRef]
- Wang, H.; Shen, Z.; Zeng, Y.; Yan, H.; Li, Y.; Yuan, W. Connection between Anthropogenic Water Diversion and Hydrodynamic Condition in Plain River Network. Water 2021, 13, 3596. [Google Scholar] [CrossRef]
- Ma, Y.Q.; Cao, W.; Zhao, Y.M. Eutrophication characteristics, cause analysis and control strategies in a typical plain river network region. Acta Sci. Circumst. 2022, 42, 174–183. [Google Scholar]
- Yuan, X.Z.; Xu, X.F.; Yu, L.L. Simulation analysis of sewage discharge in plain river network based on coupled hydrodynamic model. China Rural Water Hydropower 2022, 12, 39–46. [Google Scholar]
- Xiao, X.M.; Chen, D.Y.; Hu, H.P. Semi-closed Water Flowing Project Based on Joint Scheduling of Sluice & Pumping Station. China Water Wastewater 2022, 38, 113–116. [Google Scholar]
- Li, X.; Tang, H.W.; Wang, L.L. Simulation of water environment under joint operation of gates and pumps in plain river network area. J. Hohai Univ. Nat. Sci. 2016, 44, 393–399. [Google Scholar]
- Cao, W.; Li, W. Study on the Performance Improvement of Axial Flow Pump’s Saddle Zone by Using a Double Inlet Nozzle. Water 2020, 12, 1493. [Google Scholar] [CrossRef]
- Mu, T.; Zhang, R.; Xu, H.; Zheng, Y.; Fei, Z.; Li, J. Study on improvement of hydraulic performance and internal flow pattern of the axial flow pump by groove flow control technology. Renew. Energy 2020, 160, 756–769. [Google Scholar] [CrossRef]
- Zheng, Y.; Chen, Y.J.; Zhang, R. Analysis on unsteady stall flow characteristics of axial-flow pump. Trans. Chin. Soc. Agric. Mach. 2017, 48, 127–135. [Google Scholar]
- Wu, X.; Zhang, X.; Tian, X.; Li, X.; Lu, W. A review on fluid dynamics of flapping foils. Ocean Eng. 2020, 195, 106712. [Google Scholar]
- Feng, Y.K.; Su, Y.M.; Su, Y.Y. Study on hydrodynamic performance of oscillating wing under simulated fish swimming mode. J. Huazhong Univ. Sci. Technol. Nat. Sci. Ed. 2019, 12, 38–43. [Google Scholar]
- Hua, E.R.; Chen, W.Q.; Tang, S.W.; Xie, R.S.; Guo, X.M.; Xu, G.H. Study on the characteristics of pushing flow of flapping hydrofoil device in small channel. J. Agric. Mach. 2022, 53, 9. [Google Scholar]
- Hua, E.R.; Luo, H.T.; Xie, R.S.; Chen, W.Q.; Tang, S.W.; Jin, D.Y. Investigation on the Influence of Flow Passage Structure on the Performance of Bionic Pumps. Processes 2022, 10, 2569. [Google Scholar] [CrossRef]
- Ma, P.; Wang, Y.; Xie, Y.; Liu, G. Behaviors of two semi-passive oscillating hydrofoils with a tandem configuration. Energy 2021, 214, 118908. [Google Scholar] [CrossRef]
- Moreira, D.; Mathias, N.; Morais, T. Dual flapping foil system for propulsion and harnessing wave energy: A 2D parametric study for unaligned foil configurations. Ocean Eng. 2020, 215, 107875. [Google Scholar] [CrossRef]
- Xu, W.; Xu, G.; Duan, W.; Song, Z.; Lei, J. Experimental and numerical study of a hydrokinetic turbine based on tandem flapping hydrofoils. Energy 2019, 174, 375–385. [Google Scholar] [CrossRef]
- Mannam, N.P.B.; Krishnankutty, P.; Vijayakumaran, H.; Sunny, R.C. Experimental and Numerical Study of Penguin Mode Flapping Foil Propulsion System for Ships. J. Bionic Eng. 2017, 14, 770–780. [Google Scholar] [CrossRef]
- Wang, Y.L.; Jiang, W.; Xie, Y.H. Numerical Investigation Into the Effects of Motion Parameters on Energy Extraction of the Parallel Foils. J. Fluids Eng.-Trans. ASME 2019, 141, 061104. [Google Scholar] [CrossRef]
- Dahmani, F.; Sohn, C.H. Effect of convergent duct geometry on the energy extraction performance of tandem oscillating hydrofoils system. J. Fluids Struct. 2020, 95, 102949. [Google Scholar] [CrossRef]
- Kinsey, T.; Dumas, G. Optimal Tandem Configuration for Oscillating-Foils Hydrokinetic Turbine. J. Fluids Eng.-Trans. ASME 2012, 134, 031103. [Google Scholar] [CrossRef]
- He, G.; Yang, H.; Mo, W.; Zhao, Z.; Wang, W.; Ghassemi, H. Influence of inter-foil spacing on energy extraction of tandem oscillating hydrofoils. Ocean Eng. 2022, 259, 111953. [Google Scholar] [CrossRef]
- Bao, Y.; Zhou, D.; Tao, J.J.; Peng, Z.; Zhu, H.B.; Sun, Z.L.; Tong, H.L. Dynamic interference of two anti-phase flapping foils in side-by-side arrangement in an incompressible flow. Phys. Fluids 2017, 29, 033601. [Google Scholar] [CrossRef]
- Dewey, P.A.; Quinn, D.B.; Boschitsch, B.M.; Smits, A.J. Propulsive performance of unsteady tandem hydrofoils in a side-by-side configuration. Phys. Fluids 2014, 26, 041903. [Google Scholar] [CrossRef]
- Liu, H.B.; Wang, Y.; Ma, P.L. Coupling analysis of parameters based on parallel-oscillating hydrofoils hydrokinetic turbine. J. Zhejiang Univ. Eng. Sci. 2017, 51, 153–159. [Google Scholar]
- Gungor, A.; Hemmati, A. Wake symmetry impacts the performance of tandem hydrofoils during in-phase and out-of-phase oscillations differently. Phys. Rev. E 2020, 102, 043104. [Google Scholar] [CrossRef]
- Gungor, A.; Khalid, M.S.U.; Hemmati, A. Classification of vortex patterns of oscillating foils in side-by-side configurations. J. Fluid Mech. 2022, 951, A37. [Google Scholar] [CrossRef]
- Chao, L.-M.; Pan, G.; Zhang, D.; Yan, G.-X. On the thrust generation and wake structures of two travelling-wavy foils. Ocean Eng. 2019, 183, 167–174. [Google Scholar] [CrossRef]
- Huera-Huarte, F.J. Propulsive performance of a pair of pitching foils in staggered configurations. J. Fluids Struct. 2018, 81, 1–13. [Google Scholar] [CrossRef]
- Wang, J.; Liu, P.; Chin, C.; He, G.; Song, W. Parametric study on hydro-elasticity characteristics of auto-pitch wing-in-ground effect oscillating foil propulsors. Ocean Eng. 2020, 201, 107115. [Google Scholar] [CrossRef]
- Du, X.X.; Zhang, Z.D. Numerical analysis of the influence of four flapping modes on the propulsive performance of underwater flapping wing. Eng. Mech. 2018, 35, 8. [Google Scholar]
- Hua, E.R.; Zhu, W.; Xie, R.; Su, Z.; Luo, H.; Qiu, L. Comparative Analysis of the Hydrodynamic Performance of Arc and Linear Flapping Hydrofoils. Processes 2023, 11, 1579. [Google Scholar] [CrossRef]
- Read, D.A.; Hover, F.S.; Triantafyllou, M.S. Forces on oscillating foils for propulsion and maneuvering. J. Fluids Struct. 2003, 17, 163–183. [Google Scholar] [CrossRef]
- Wang, K.J.; Zhao, Y.; Wang, S.H. Analysis of pressure fluctuation and internal flow characteristics of axial flow pump under off design condition. J. Hydroelectric. Eng. 2023, 42, 86–96. [Google Scholar]
- Xie, R.S.; Hua, E.T.; Xu, G.H. Research on Double Hump Phenomenon of Axial Flow Pump. Trans. Chin. Soc. Agri. Mach. 2022, 53, 178–185. [Google Scholar]
- He, N.C.; Tang, M.G.; Liu, H.L. Test and analysis on pressure pulsation and hydraulic performance of saddle zone in axial flow pump. J. Drain. Irri. Mach. Eng. 2018, 36, 118–123. [Google Scholar]
- Ye, C.; An, D.; Huang, W.; Heng, Y.; Zheng, Y. Investigation on Stall Characteristics of Centrifugal Pump with Guide Vanes. Water 2023, 15, 21. [Google Scholar] [CrossRef]


| Terms | Equipment | Type | Systematic Error |
|---|---|---|---|
| Flow | Doppler flowmeter | WIM-@ADV | ±1% |
| Head | Differential pressure sensor | 3051 | ±0.2% |
| Current | Clamp power meter | VC6412D | ±2.5% |
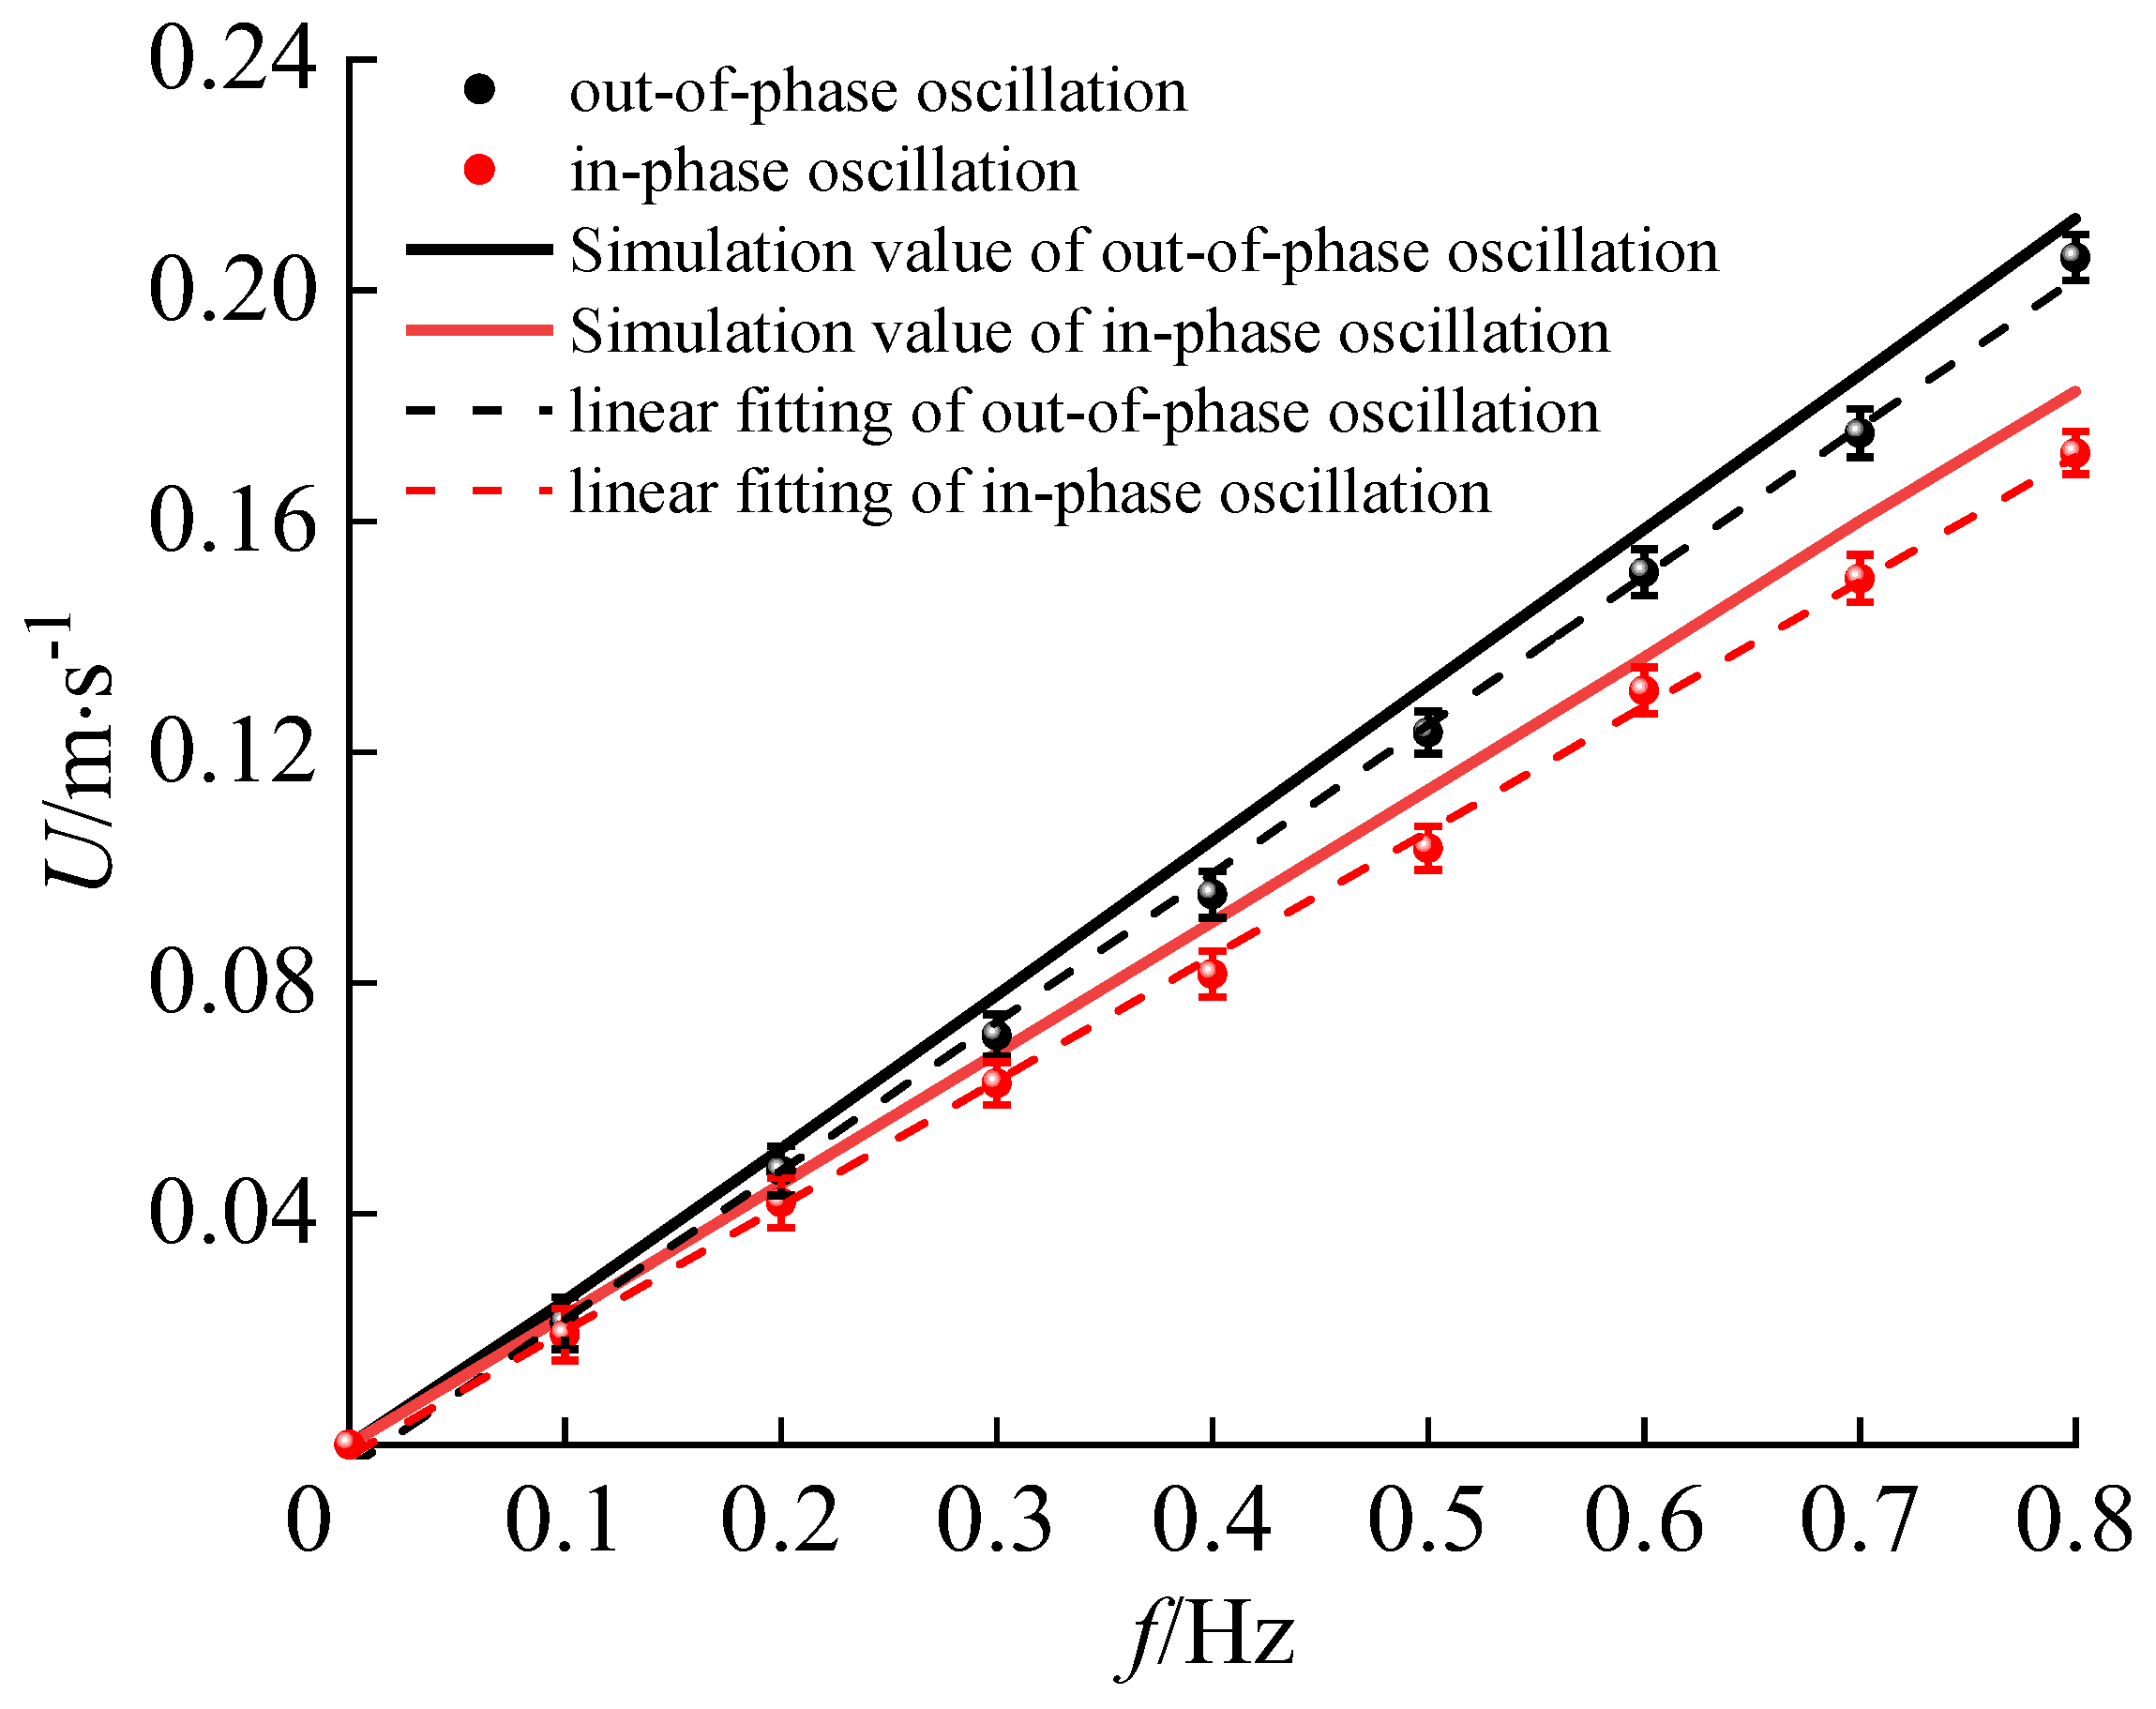
| f/Hz | 0.1 | 0.2 | 0.3 | 0.4 | 0.5 | 0.6 | 0.7 | 0.8 | |
|---|---|---|---|---|---|---|---|---|---|
| Expeiment 1 | 0.020 | 0.047 | 0.070 | 0.097 | 0.120 | 0.152 | 0.172 | 0.201 | |
| Expeiment 2 | 0.021 | 0.045 | 0.075 | 0.095 | 0.125 | 0.151 | 0.170 | 0.207 | |
| Expeiment 3 | 0.025 | 0.050 | 0.068 | 0.096 | 0.123 | 0.147 | 0.175 | 0.205 |
Disclaimer/Publisher’s Note: The statements, opinions and data contained in all publications are solely those of the individual author(s) and contributor(s) and not of MDPI and/or the editor(s). MDPI and/or the editor(s) disclaim responsibility for any injury to people or property resulting from any ideas, methods, instructions or products referred to in the content. |
© 2023 by the authors. Licensee MDPI, Basel, Switzerland. This article is an open access article distributed under the terms and conditions of the Creative Commons Attribution (CC BY) license (https://creativecommons.org/licenses/by/4.0/).
Share and Cite
Hua, E.; Qiu, L.; Xie, R.; Su, Z.; Zhu, W. Comparative Analysis of the Hydrodynamic Performance of Dual Flapping Foils with In-Phase and Out-of-Phase Oscillations. Water 2023, 15, 3275. https://doi.org/10.3390/w15183275
Hua E, Qiu L, Xie R, Su Z, Zhu W. Comparative Analysis of the Hydrodynamic Performance of Dual Flapping Foils with In-Phase and Out-of-Phase Oscillations. Water. 2023; 15(18):3275. https://doi.org/10.3390/w15183275
Chicago/Turabian StyleHua, Ertian, Linfeng Qiu, Rongsheng Xie, Zhongxin Su, and Wenchao Zhu. 2023. "Comparative Analysis of the Hydrodynamic Performance of Dual Flapping Foils with In-Phase and Out-of-Phase Oscillations" Water 15, no. 18: 3275. https://doi.org/10.3390/w15183275
APA StyleHua, E., Qiu, L., Xie, R., Su, Z., & Zhu, W. (2023). Comparative Analysis of the Hydrodynamic Performance of Dual Flapping Foils with In-Phase and Out-of-Phase Oscillations. Water, 15(18), 3275. https://doi.org/10.3390/w15183275