1. Introduction
In Italy, the alluvial fans of rivers flowing out from the northern Apennines and Alps have always been considered the main recharge zones for aquifers hosted in the Po Plain [
1]. The Southern sector of the Po Plain faces the northern Apennines and groundwater recharge is focused there in the apical part of the alluvial fans [
2,
3,
4], where both streambed dispersion and rainfall percolation from the topsoil are promoted by the wide outcrops of coarser materials, such as gravels and sands. After reaching the groundwater hosted in the apical part of the alluvial fans, water molecules start to move northwards, driven by a reduced hydraulic gradient (up to 0.001). The time required by water molecules to reach the distal part of the alluvial fans differs depending on flow paths. By means of carbon-14 (
14C) and tritium (
3H), the groundwater from different wells located in the distal parts of several alluvial fans facing the northern Italian Apennines was dated [
5]. The authors found that aquifers from alluvial fans are characterized by relatively young groundwater (1–15 TU), in which renewal processes (mainly fed by streambed dispersions) are active due to the highest hydraulic conductivities of the riverbed materials. Moving northwards, and with simultaneous reduction in the hydraulic conductivities and departure from the main recharge areas, groundwater ages were even higher than 5000 years in the case of low-plain areas (wells characterized by a depth in the order of 150–200 m) and higher than 5–50 kyrs in the deepest wells.
It should be highlighted that groundwater samples collected in a well are composed of different quotas of water, each one characterized by a group of water molecules travelling along a flow path with a specific travel time. Such quotas cannot be distinguished by the isotopic dating alone.
Among the several environmental tracers available in the literature (see, for instance: [
6,
7]), oxygen isotopes of water have been demonstrated to be powerful tools in unraveling complex hydrogeological problems, such as (with no claim to be exhaustive): (i) mixing between groundwater of different origins; (ii) estimating the area of groundwater recharge [
8]; (iii) characterizing which component (precipitation or losses from the streambeds) is exclusive or prevalent in recharging alluvial aquifers [
3]; and (iv) assessing the Mean Residence Time MRT of surficial water and groundwater (e.g., [
6]).
With reference to the last point, the MRT approach couples time-extended time-series of water isotopes with the lumped parameters model. Finally, the MRT method provides a distribution of ages (representing the different flow paths composing the groundwater samples) and a final mean value, which is the mass-weighted average residence time of all the water flow paths.
Very recently, [
9] proposed the concept of the young water fraction (F
yw) to the hydrological community. The F
yw is considered to be the percentage proportion of catchment outflow younger than approximately 2–3 months and, as in the case of MRT, can be estimated starting from the amplitudes of seasonal cycles of stable water isotopes in precipitation (input) and surficial water (output). Due to its intrinsic robustness and to the reduced number of parameters required compared to the MRT approach, the results are usually less biased [
9].
The formulas reported in [
9] have also been proven to be effective for assessing F
yw in the case of groundwater (both mountainous springs and wells from alluvial aquifers; see [
10,
11,
12]) with the final main objective of evaluating the risk of contamination (the greater the F
yw value, the higher the risk of groundwater being affected by pollutants). To the best of our knowledge, and unlike hydrological studies focusing on runoff generation mechanism in catchments, F
yw has never been used to obtain information on the saturated zone.
The purpose of present study is to evaluate the Fyw values from the wells of the alluvial fans facing the northern Apennines (an estimate that has never been made before on this area) and to preliminarily test its usefulness in providing further hydrogeological information on these aquifers.
The reason for having selected this study site (alluvial aquifers facing the northern Apennines) is twofold. Firstly, here, hundreds of water-stable isotope data from rivers and wells have already been made available by several researchers and can thus be used for estimating F
yw. Secondly, to date, these aquifers have been considered as characterized by a certain degree of homogeneity and isotropy as well as a pure-mass water transfer [
13,
14]. This means that water molecules travelling along groundwater flow paths should show a progressive reduction in F
yw in moving away from the infiltration point (apical part of the alluvial fan) along the same flow path. Thus, non-negligible values of F
yw from wells located far from the apical part of the alluvial fan represent a deviation from the aforementioned homogenous and isotropic aquifers or may evidence the presence of further recharge areas (surface aquifers or river reaches) hydraulically connected to the wells. In addition, F
yw values will be compared to the fastest travel time estimates carried out by means of the classical Darcy formula (a marker of a pure-mass water transfer, implying knowledge of the shortest flow path connecting each well to the corresponding main recharge area, i.e., apical part of the alluvial fan). The results are discussed in terms of the recharge mechanism and mass transfer vs. pressure wave phenomena acting in aquifers screened by wells.
3. Methodology
The study consists of two subsequent steps. Firstly, we used isotopic time series of stable isotopes from rivers and wells already available in the literature ([
5,
24]; see
Supplementary Materials Table S1 for the final dataset compilation used and for the instruments and analytical precisions reported in the aforementioned studies) to obtain the F
yw and corresponding uncertainties (see
Section 3.1 for further details). Secondly, we carried out statistical interpolation on the groundwater levels from the wells to obtain the equipotential lines and flow-nets of each fan. In this way, we reconstructed the shortest flow paths connecting the recharge areas and wells for each alluvial fan (see
Supplementary Materials Figure S1, in which the piezometric surface and flow nets are reported). Then, we carried out a calculation on fastest travel time FT
T, as per
Section 3.2. Finally, and with FT
T being a pure estimate of mass transfer, we compared F
yw, FT
T and other parameters (see
Section 3.3) through the Pearson and Spearman rank correlation matrices to obtain information on the recharge mechanism and mass (in terms of water molecules) transfer within the aquifers.
3.1. Young Water Fraction
As mentioned in the Introduction, the young water fraction (F
yw) has recently been proposed by [
9]. It is considered the percentage proportion of catchment outflow younger than approximately 2–3 months, and can be estimated starting from the amplitudes of seasonal cycles of stable water isotopes (δ
18O) in precipitation (A
in) and river water (A
out), with the following expression:
Although it was initially proposed for river water, it has recently been proven that this approach is reliable for assessing young water fractions of groundwater from mountainous areas (spring waters: [
25,
26,
27]) and lowlands (wells: [
10]). As a matter of fact, such an approach allows estimate uncertainties to be strongly reduced compared with the well-known Mean Travel Time formulation [
9,
28]. This is due to a reduced vulnerability of this index to aggregation bias and to less sensitivity to the assumed shape of the catchment transit-time distribution.
For the sake of convenience, we describe below the calculation, considering only the time series of δ
18O from precipitation (A
in), river water, and groundwater (A
out). A
in and A
out (here, we recall what is meant as the amplitudes of the sinusoids) are obtained by interpolating each time series of δ
18O with a modelled sine wave. The latter is characterized by specific mathematical expressions that, in the case of A
in, is:
in which δ
18O
in(i) is the modelled isotopic composition of precipitation at time i; δ
18 O_mean is the estimated mean value of δ
18O from precipitation over the considered time period; and w is the angular frequency (equal to 2π/T, in which T is the period between two consecutive d
18O peaks).
The output time series δ
18O_out(i) from river water and groundwater are still sinusoidal, but their amplitudes A
out are reduced with respect to input sinusoid δ
18O_in (i), while cosine also includes a phase lag (φ; the phase lag or time between the annual peaks of δ
18O in radians):
Estimates of F
wy are reported along with the corresponding uncertainties. The latter were estimated thanks to the error propagation method [
29]. As an example, if A
in and A
out are obtained along with their ±σ uncertainties (here renamed as ±dA
in and ±dA
out), the corresponding errors ±dF
yw associated to the specific value of young water fraction is obtained as follows:
3.2. Fastest Travel Time
The fastest travel time (FT
T, in years) represents the time spent by water molecules travelling along the shortest flow path that connects the recharge areas to the specific well [
30,
31]. To estimate FT
T, we carried out a particle-tracking scheme starting with a groundwater flow net and Darcy’s law. This approach (i.e., particle tracking with a groundwater flow net and Darcy’s law) has been widely used to define the flow paths of solute particles (here understood as contaminants) in the groundwater under purely active transport (for both drawing the protection zones of wells and remediation/mitigation activities; see [
32,
33,
34], which we do not claim to be exhaustive, wherein FT
T is equivalent to the time of arrival of the fastest contaminant to the control point, i.e., the well). The tracking of water molecule particles placed in a groundwater flow field can be solved by using either analytical or numerical methods [
35].
In our case, we used the analytical method simplified by considering the hydrogeological media (i.e., aquifers) as homogeneous (hydrogeological properties are constant in each point of the aquifer) and isotropic (hydrogeological properties are independent of the direction of measurement at each point of the aquifer).
Thus, assuming a homogeneous and isotropic medium, the Darcy velocity q (ms
−1) can be obtained as:
where K (ms
−1) is the hydraulic conductivity and i (dimensionless) the hydraulic gradient. The latter is calculated as follows:
where L (m) is the horizontal distance between the recharge area and the well while ΔH (m) is the head loss (here we recall that both parameters must be obtained by considering the particle track direction).
Being calculated over a unique section of the aquifer, q must be considered the apparent velocity of the water molecules, as its formulation takes into account both the solid skeleton and the voids (pores).
The seepage velocity v (ms
−1) is the effective velocity reached by water molecules into the pores, and requires a knowledge of the effective porosity (ne, dimensionless) of the medium:
The fastest travel time FT
T (in days) is finally calculated as:
It should be pointed out that the FT
T values obtained, as per Formula (8), represent the velocities of the fastest water molecules arriving at the wells being calculated along the shortest flow path between the recharge area and the specific well. From a conceptual point of view, it is evident that FT
T is inherently different from the groundwater Mean Residence Time. The latter is defined as the time obtained by averaging all the flow paths conveying water molecules from the recharge area to the well and can be calculated by processing a transit-time distribution. Unlike MRT, the young water fraction (F
yw), as defined in
Section 3.1, represents the most recent portion of the transit-time distribution, i.e., the fastest flow paths reaching the well, and can be conceptually compared to T
T.
Hydraulic conductivities (K) and effective porosities (n
e) were made available by [
36], which sums up the averaged values of such parameters from tens of pumping tests carried out in each alluvial fan.
Equipotential lines (i.e., lines connecting points with the same hydraulic head), from which the groundwater flow net was reconstructed, were obtained starting from the mean groundwater levels measured in each well. In detail, six-monthly groundwater level data from each well were available from 2001 to 2012 and were further averaged as a unique value for each well. Finally, the averaged values were interpolated in a GIS environment by means of the Ordinary Kriging (OK) method, which is the most popular kriging method, and is widely used in hydrogeological studies worldwide involving the three-dimensional development of piezometric surfaces [
37,
38]. The OK consists of a statistical approach in which observed values are interpolated following both a weighted average of the neighboring points and their overall spatial arrangement, to estimate the value of an unobserved point. For the mathematical detail, readers are referred to [
39]. Once OK were carried out, the resulting piezometric surfaces were further checked by means of semivariogram models to ensure that the spatial variation of hydraulic heads was statistically homogeneous across the whole surface (i.e., the same pattern of variation can be observed at all locations on the surface).
Finally, and for each well, we extracted the shortest flow net (i.e., the particle-track line) connecting each well to the corresponding recharge area, and we made calculations as per the above-mentioned Formula (8).
3.3. Parameters Processed into the Pearson and Spearman Correlation Matrices
In addition to the aforementioned FTT and Fyw, a statistical comparison through Pearson and Spearman matrices was carried out by taking into account a further six parameters that were calculated for each well. Namely, the distance of the well from the apical part (DAP in m; we recall that the apical part of each alluvial fan was preliminarily considered as the main recharge area of groundwater feeding the well); the linear distance between the well and the nearest river reach (DR in m); the altitude of the well (A in m a.s.l.); the well depth (WD in m b.g.l.); the depth of slotting (DS in m b.g.l.); and the maximum slotting depth (MSD in m b.g.l.; this parameter was necessary as several wells were equipped with a number of filters slotted at different depths). It is worth noting that in case of wells with filters slotted at different depths, we considered DS to be the mean depth (in m b.l.g) of the deepest filter.
For all the parameters (and thus, also for FT
T and F
yw), and before the statistical comparison by Pearson and Spearman rank correlation matrices, all the results were aggregated per alluvial fan (one mean value for each of the nine alluvial fans). In the case of the parameters DAP and DR, we distinguished both minimum (DAP
m and DR
m) and maximum (DAP
M and DR
M) values per alluvial fan. All the parameters are summarized in the
Supplementary Materials S1.
Pearson and Spearman matrices reflect the magnitude of similarity among the eight parameters. Pearson correlation is the most widely used parametric test ranking, through its r coefficient, the relationship between linearly related variables. Since the main assumption of this test is that the variables are normally distributed (variables have a bell-shaped curve), linearity assumes a straight-line relationship between each of the two variables. Spearman is a nonparametric approach that is commonly used when the assumptions of the Pearson correlation are violated (variables not normally distributed). In detail, the Spearman correlation coefficient determines the monotonic relationship between two variables (here, we recall that monotonicity implies that as the value of one variable increases so does the value of the other variable, even if not linearly) by means of its r
s coefficient. Both correlation coefficients (r and r
s) describe the strength and direction between the two variables and return the closer value to 1 (or −1) when the two different datasets have a strong positive (or negative) relationship. The significance probability (
p-value) for both the Spearman and Pearson correlation coefficients calculated in this study was set at 0.05, meaning that
p-values lower than 0.05 represented statistically significant relationships. Readers are referred to [
39] for further details on statistical formulations.
4. Results
Table 1 summarizes the results (minimum, maximum, mean values and corresponding standard deviations for A
in, DAP
M and DAP
m, DR
M and DR
m, A, WD, DW, MSD and F
yw) of calculations from all of the alluvial fans, along with the number of wells used for the estimates (the number of wells ranged from three in the Nure River to sixteen in the Secchia River). The variations in the δ
18O isotopic content of the river waters were higher in the rivers Lamone and Savio, with A
in equal to 0.978 and 1.091, respectively. The lowest value of A
in (0.291) was detected in the Reno River. By passing to the wells, their DAP (we recall that the apical part was considered the main recharge zone for the groundwater hosted within the alluvial fan) varied from 3300 m (Enza River) to about 50,000 m (Reno River). The proximity to the river reach (DR) decreased from 9 m (Reno River) to about 16,000 m (Secchia River).
The Panaro River was characterized by the lowest mean WD (70 m ± 27) as well as DS (59 m ± 17; wells are often characterized by multiple filters intersecting several aquifers). On the contrary, the abovementioned WD and DS were highest in the case of the Savio River (158 m ± 94 and 151 m ± 96, respectively). If we consider the MSD, the lowest value was that of the Enza River (77 m ± 32), while the highest one was again that of the Savio River (135 m ± 86).
The estimated Fyw ranged from 0.137 ± 0.087 (Lamone River; groundwater from this alluvial fan showed the lowest proportions of young water) to 0.864 ± 0.432 (Reno River). It should be pointed out that four alluvial fans showed mean values of Fyw close to 0.400 (Trebbia River: 0.394 ± 0.137; Taro River: 0.420 ± 0.440; Enza River: 0.404 ± 0.291; Secchia River 0.402 ± 0.483) while other three were close to 0.200 (Nure River: 0.220 ± 0.073; Panaro River: 0.192 ± 0.098; Savio: 0.246 ± 0.255).
In any case, remarkable ranges of the Fyw values from wells (inducing higher values of standard deviations, which in case of Secchia River, is even larger than the mean value) are evident in several alluvial fans, evidencing a high variability of such a parameter.
The fastest travel times (FTT) largely varied by minimum values of 2.5 ± 0.6 years in the case of groundwater from the Trebbia River to the 11.2 ± 2.8 years of the groundwater from the Enza River. As in the case of the Fyw, the FTTS within some specific alluvial fans are higher in some cases (see Nure River and Reno River, with standard deviations equal to 3.7 years and 3.5 years, respectively).
By taking into account possible relationships among the abovementioned parameters, a bivariate analysis (cross-correlation) was carried out. The results are presented in the form of a Pearson rank correlation matrix (here, we recall that Pearson assesses linear relationships) in
Table 2, with corresponding r and
p-values. The threshold value for the level of significance was set at 0.05; therefore, relationships must be considered as statistically significant if
p < 0.05. In addition to the three relationships that were already expected to be positive (DS – WD: r = 0.98; DS – MSD: r = 0.85; WD – MSD; r = 0.81), we found a negative and statistically significant relationship between F
yw and DR
M (r = 0.52; the farther the well is from the river reach, the more the F
yw value decreases).
If the Spearman rank correlation matrix (i.e. that assessing of non-linear monotonic relationships; see
Table 3) was considered, we found to be positive and significant (
p < 0.05) a larger statistical performance between F
yw and DR
M (r
s = 0.69) and a new negative correlation between F
yw and DR
m (r
s = 0.51; wells next to the river reach tended to higher values of F
yw).
It should be pointed out that in both the Pearson and Spearman rank correlation matrices, no evidence of a statistical relationship between FTT and Fyw was found (p-values equal to 0.72 and 0.74, respectively).
5. Discussion
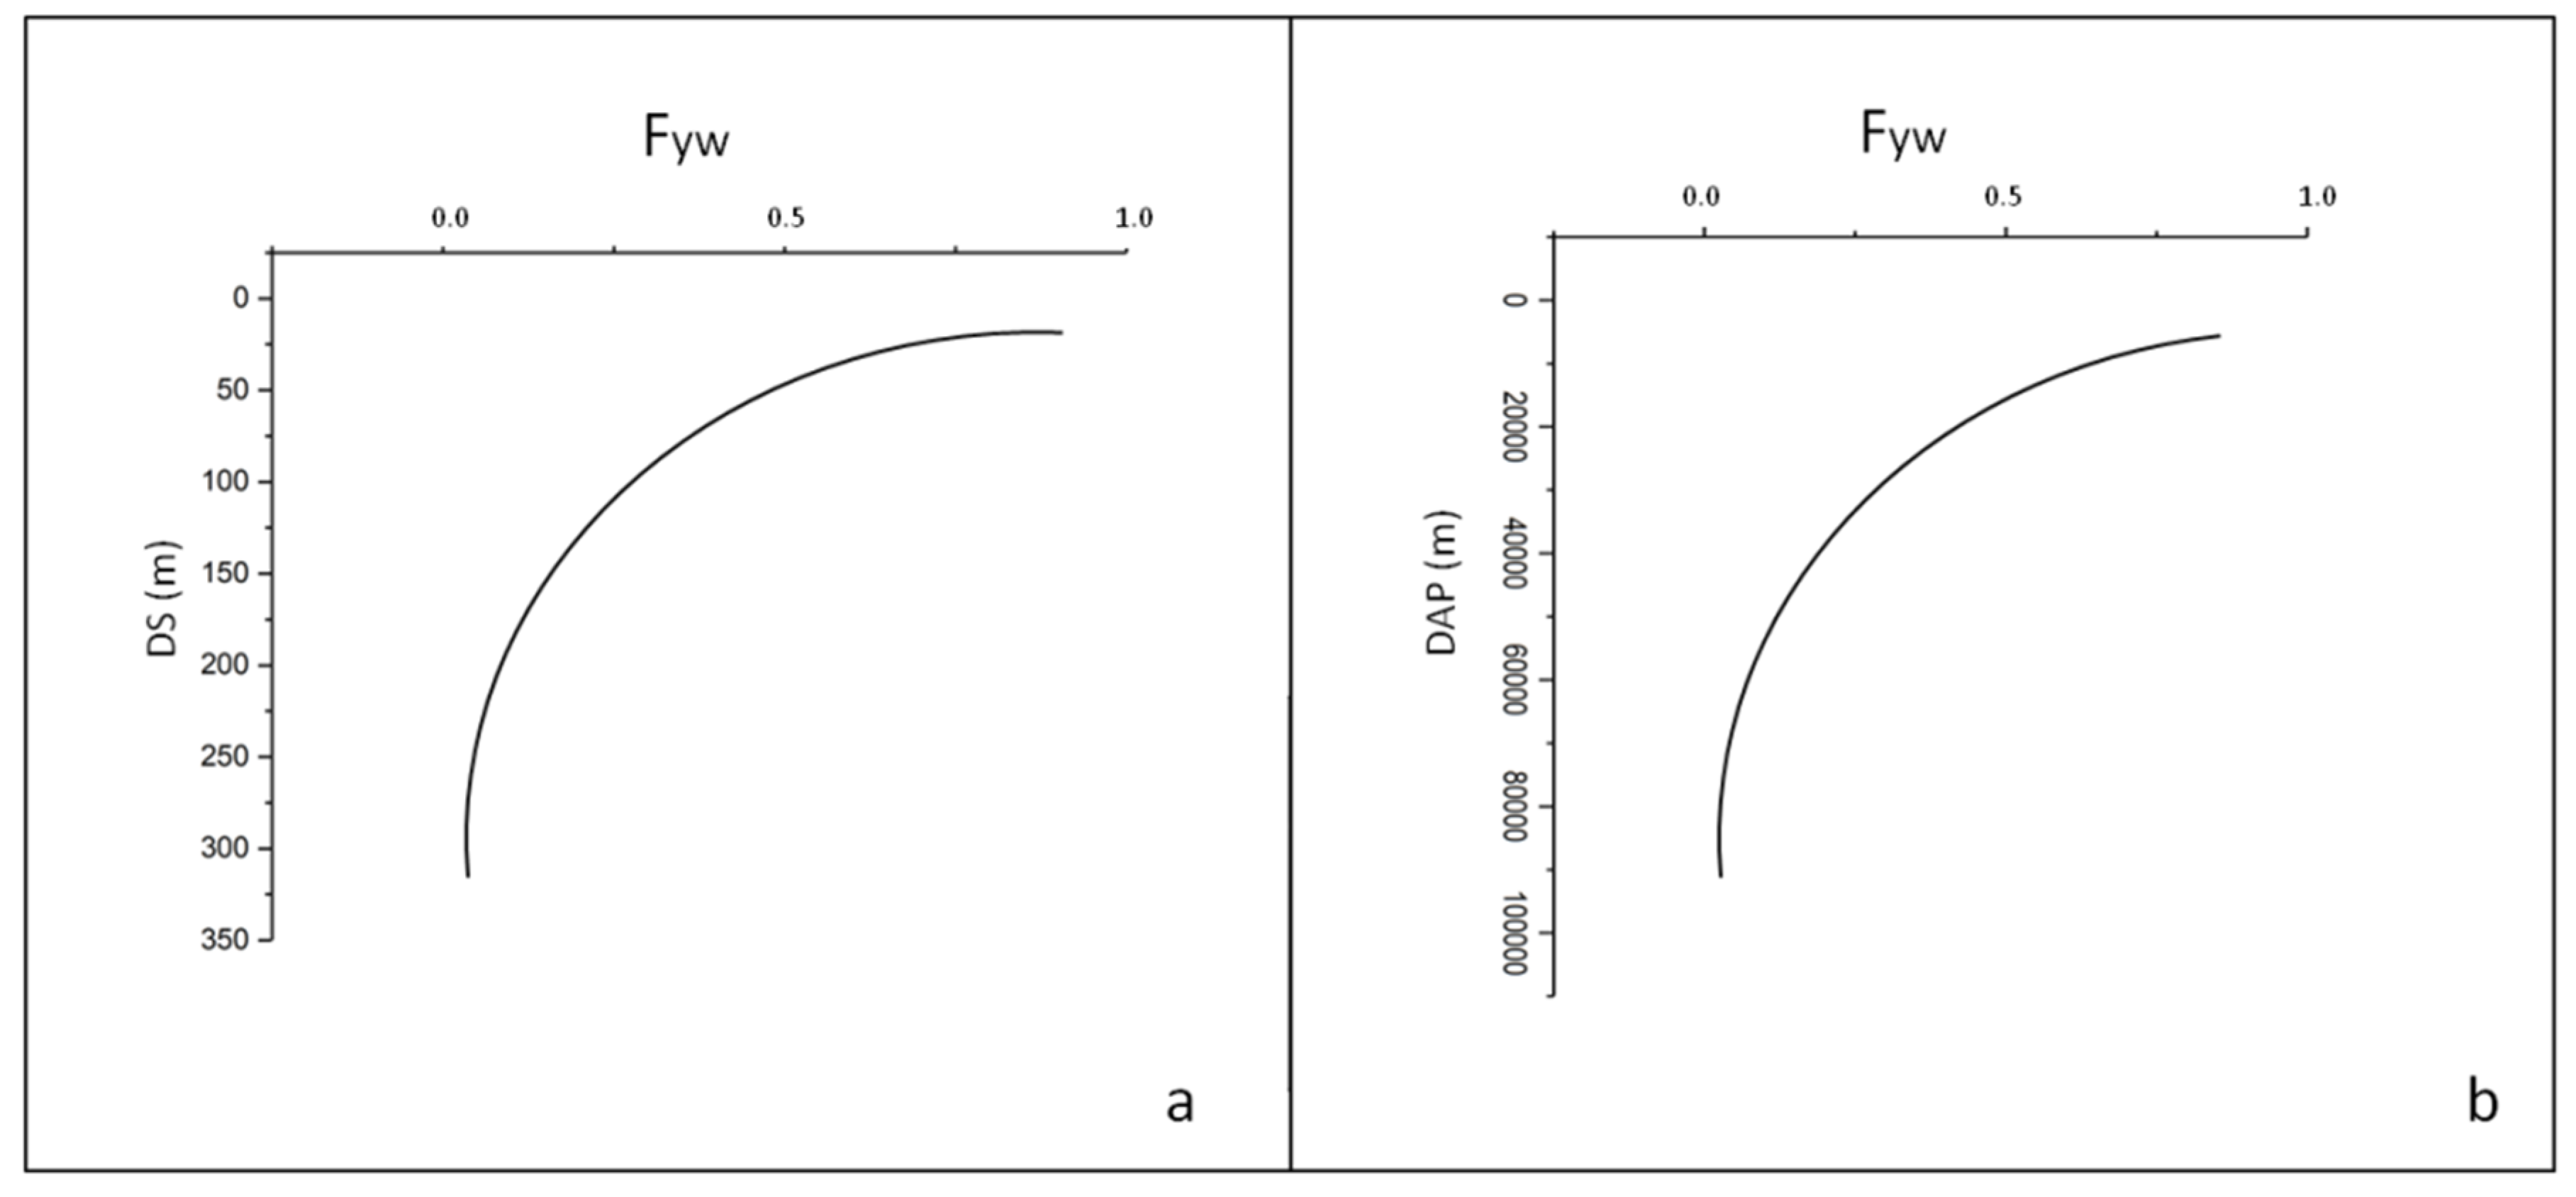
If a well is placed in the ideal case of a homogenous and isotopic aquifer, the groundwater pumped to the surface is composed of water molecules that have travelled several flow paths and, thus, are characterized by different travel times. As in the instance of the well above, water molecules from the lower part of the filter are characterized by the longest flow paths. In such a case, by going deepest along a slotted well, the amplitude of the δ18O isotopic signal should be progressively reduced (with an expected non-linear monotonic pattern that approximates an exponential function) until it disappears completely, in turn, inducing a reduction in the young water fractions Fyw with increasing depth. The same results (decrease in Fyw) are obtained when moving away from the infiltration point along the same flow path.
Thus, water molecules seeping through the streambed start to move along specific flow paths, away from the apical part and toward the distal sectors of the alluvial fans. In our case, the shallower groundwater hosted in aquifers from the apical parts of the alluvial fans (i.e., aquifers characterized by the coarsest materials, such as gravels and sands, and closest to the recharge areas) should show the highest values of F
yw, while the deepest aquifers from the distal parts should be characterized by groundwater with the lowest values of F
yw (see
Figure 2). In such cases of ideal aquifers, it should be stressed that water molecules travel along flow paths reflecting a pure-mass water transfer.
Here, we recall that this behaviour (which is observed in
Figure 2 and represents a non-linear decrease in F
yw with DS or DAP) is similar to that observed in several catchments by [
28], where an exponential decrease in F
yw with increasing flow-length (equivalent to DAP) and catchment areas (equivalent to DS) were experimentally found.
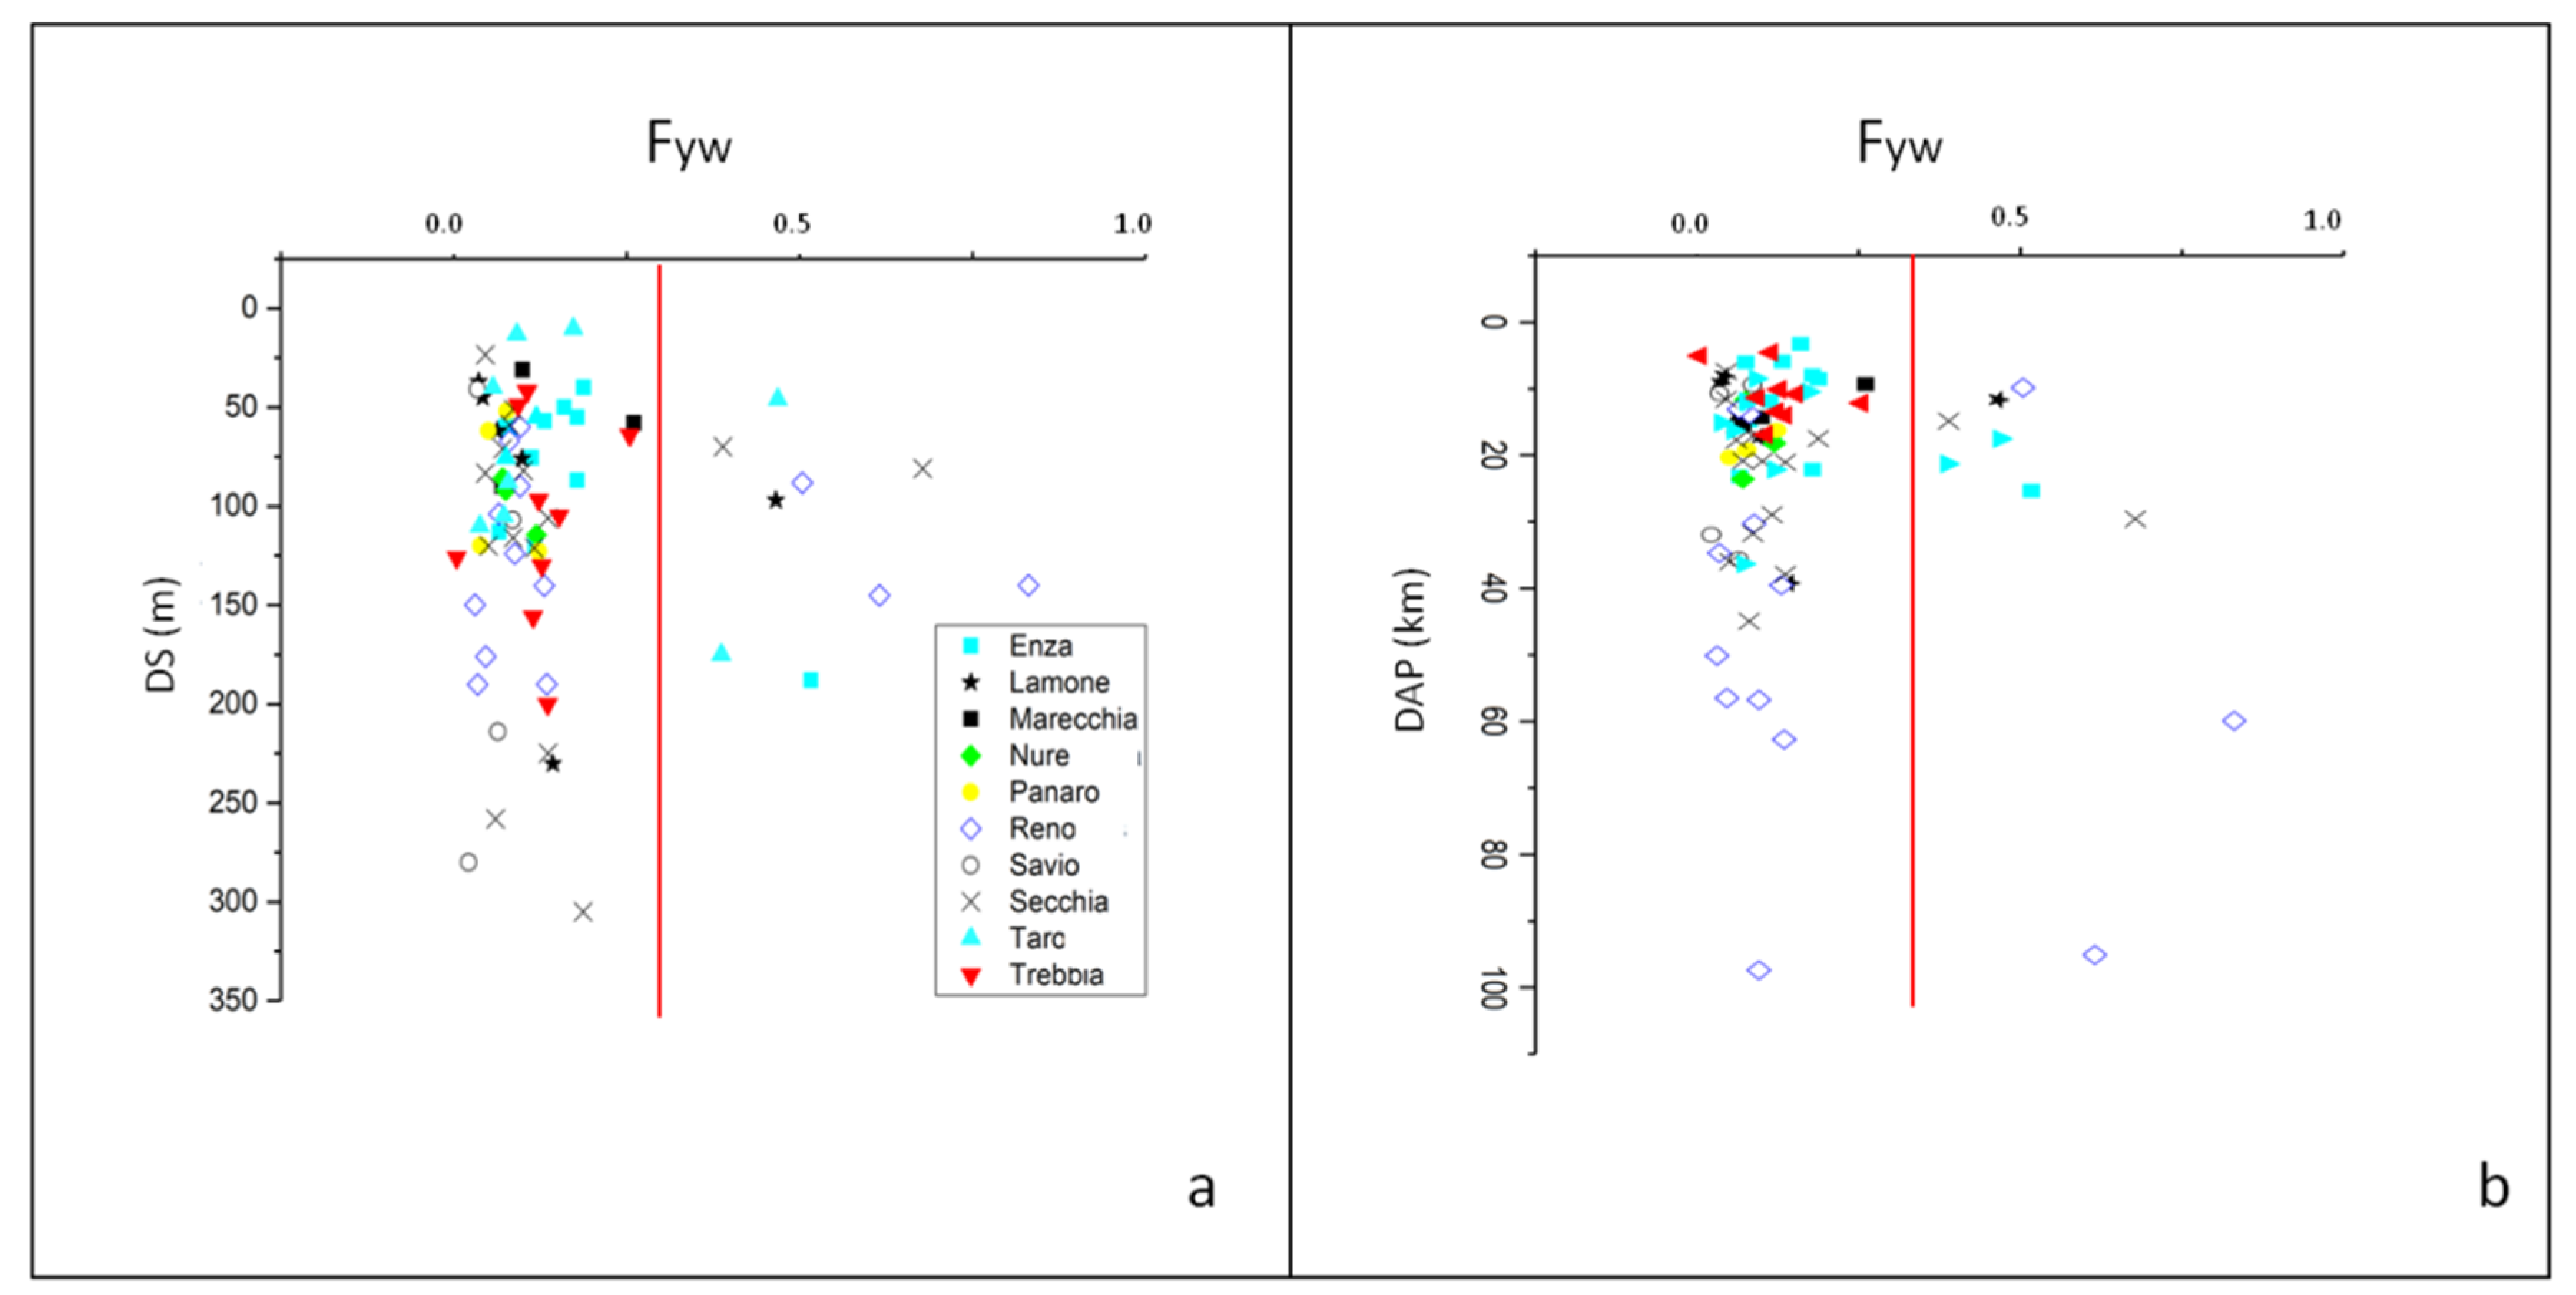
As we often observed a strong variation of F
yw from wells located in each considered alluvial fan (see the standard deviations reported in
Table 1), we decided to plot F
yw from all 75 wells against depth and distance from the recharge zone, to verify the compliance with the abovementioned hypothetical conditions of isotropic and homogeneous aquifers.
Figure 3 shows the behavior of F
yw with DS (a) and distance from the recharge area (distance from the apical part DAP (b). There was no evidence of a decrease (linear or monotonic) in F
yw with DS or DAP, with the majority of the wells characterized by F
yw values being lower than 0.3 (left part of the continuous red line in
Figure 3a,b). This means that groundwater pumped from filters located at different depths or located at variable distances from the recharge area (i.e., apical parts of the alluvial fans) were characterized by almost similar values of F
yw (thus, the variability of the δ
18O isotopic signal in groundwater is similar along the entire depth of the aquifer or moving far away from the recharge areas). This means that the pattern of F
yw with depth of slotting (DS) and distance from the recharge areas (DAP) suggests a more complex behaviour of these aquifers than that of the homogeneous and isotropic ones.
Moreover, only eight wells were characterized by an Fyw higher than the abovementioned selected threshold of 0.3, namely, three wells from the Enza River, three wells from the Reno River, one well from the Lamone River and one well from the Secchia River. Although Fyw values were indicative of a large amount of young waters in those wells, filters were also located at depths of up to about 200 m from the soil surface and far away from the recharge area (two wells from the Reno rivers were more than 60,000 m away from the apical part of the alluvial fan).
These patterns (almost an invariance of Fyw with DS and DAP) seemed to show that the behavior of the aquifers facing the northern Italian Apennines is quite far from ideal (homogeneous and isotropic with pure-mass transfer of water). Furthermore, and in compliance with the departure from the ideal case, both Pearson and Spearman rank correlation matrices have confirmed no evidence of a statistical relationship between FTT and Fyw (p-values in both cases largely exceeding the threshold of 0.05, and thus, no linear or monotonic relationships between such two variables).
One cause of the departure from an ideal system could be, in the case of wells located in the median or distal part of the alluvial fan, due to the (i) proximity of the river reach (DR). In this case, since these are pumping wells inducing an often remarkable lowering the piezometric head (several tens of meters as a result of large pumping rates), there could be feeding through the vertical drainage of younger water from upper unconfined aquifers by the river, or directly from surficial water. This fact was also confirmed through the quantitative and isotopic monitoring of some wells pumping groundwater for drinking purposes located at a distance of several kilometers from the apical part of the alluvial fan of the Enza River (see [
40]).
Another cause may be sought in the (ii) presence of groundwater flow path with the same FT
T, as a result of recharging areas developed on a reduced river reach over the same apical part of the alluvial fan. The consequence would be that of a lack of homogenization of flow path with different transit times, as the latter would not yet be present in the recharging area. The result is similar, therefore, to what we would have in a piston flow, with a stable isotope signal that would remain mostly the same, as the input signal along the whole path induces the maintenance of similar F
yw values. A third possible cause could be (iii) the presence of wells draining anisotropic and heterogeneous levels of aquifers/aquitards/aquicludes, mobilizing water with different transit times but similar stable isotopic contents (A
out), which in turn, induce equivalent values (low or high) of F
yw. As in the case of (i), these processes can also be enhanced by intense water withdrawal (already evidenced by remarkable subsidence phenomena at the soil surface; see [
41,
42]) forcing older groundwater to move toward filters from confined or semi-confined aquifers.
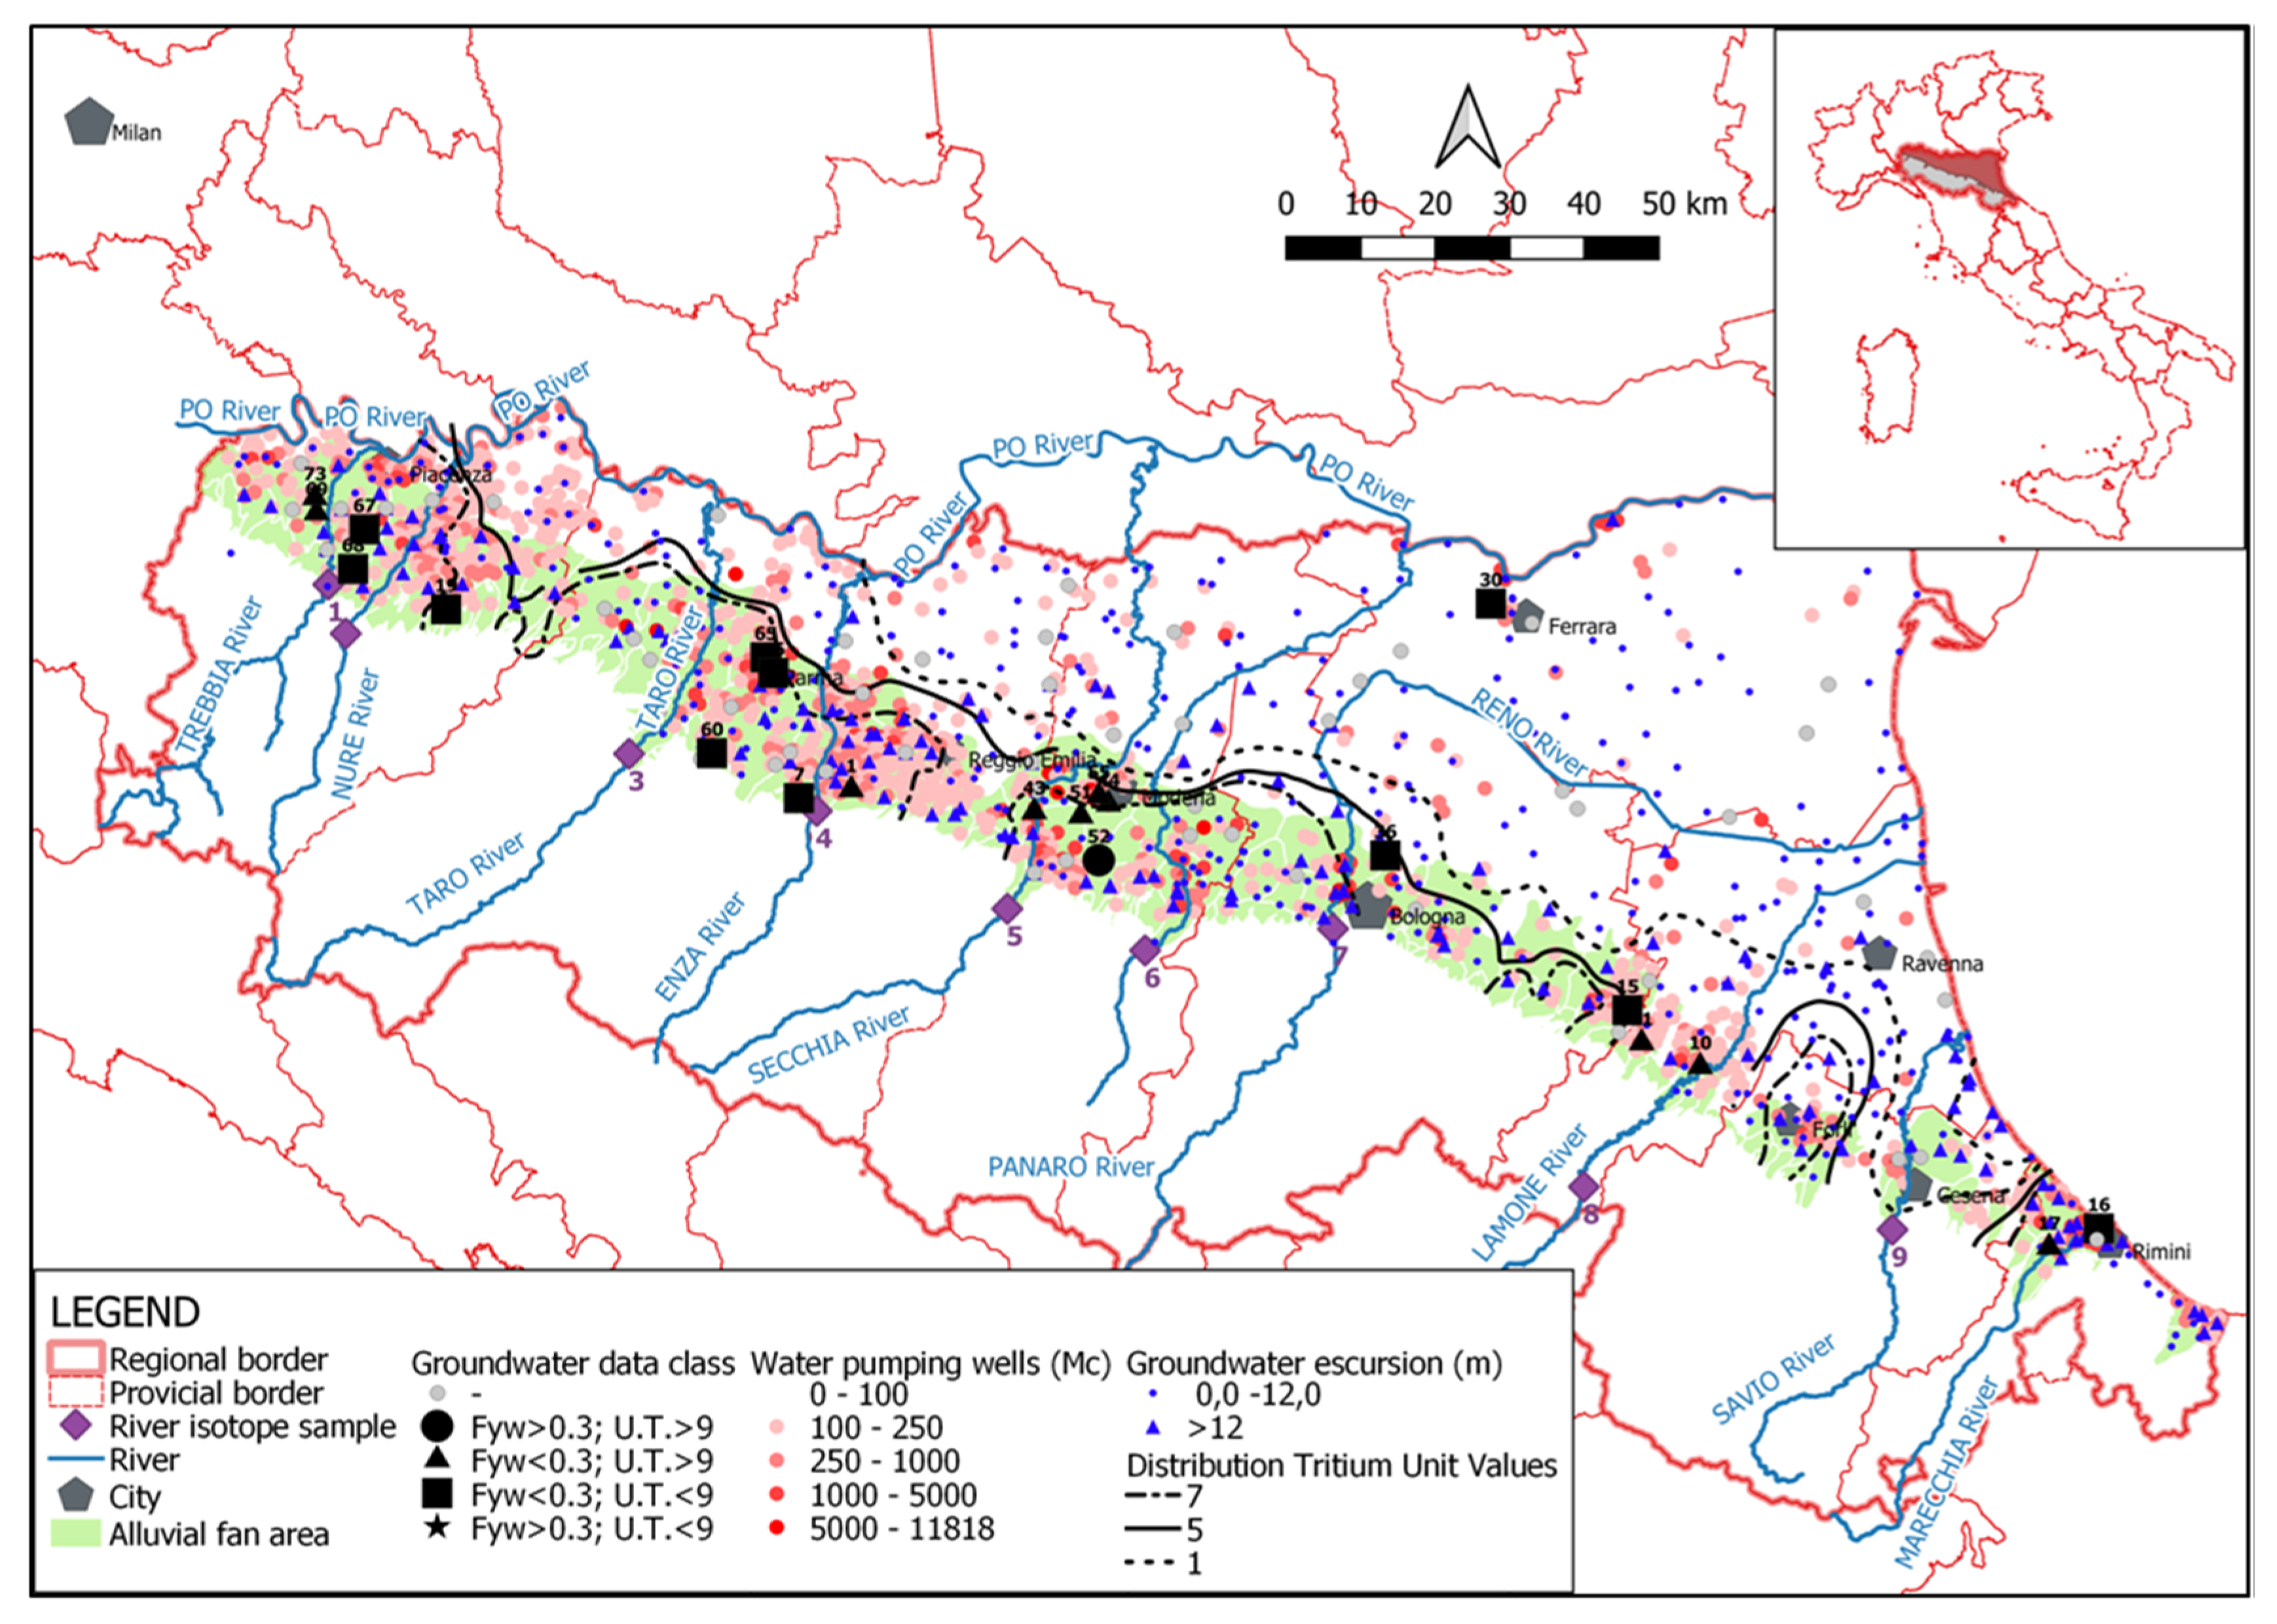
In
Figure 4 we compared the 75 wells in which we had calculated F
yw with all of the wells for which tritium data were available from [
5] (data are also summarized in the
Supplementary Materials S1). Here, we recall that tritium still belongs to the water molecules, faithfully following their flow paths, as well as stable water isotopes; the range of the observed values in sampled groundwater was between 0 and 15 TU [
5] with recently recharged water in wells having tritium between 9 TU and 15 TU [
5,
43]. It can be seen that the eight wells with the highest F
yw values were also characterized by high values of tritium (9–12 TU), indicating high groundwater renewal rates hosted with these aquifers (even at the annual scale). On the contrary, wells characterized by lower
18O/
16O fluctuations (i.e., all other groundwater with F
yw < 0.3) were characterized by higher (up to 15 TU; renewal rate at the annual scale) or lower values of tritium (up to nil values of tritium; renewal date at the multi-decadal or higher scale). In the case of both low F
yw (<0.3) and lower values of tritium, renewal rates were low or nil. Some of the abovementioned wells (i.e., those showing both low F
yw and tritium) are located not far from the apical parts or those whose filters are slotted in the upper aquifers, suggesting some slowdown (probably linked to the causes of lithological heterogeneity) of the water molecules along their flow path to the wells. These apparent inconsistencies between isotopic data (both tritium and
18O/
16O) belonging to the same water molecules further highlight the complexity of the aquifer systems investigated, which seem to behave as non-ideal (heterogeneous and isotropic) aquifers rather than ideal ones.
Thus, these results confirm that the Fyw can represent a valuable tool in hydrogeological studies involving groundwater hosted in alluvial aquifer worldwide, as it is capable of providing additional indications with respect to the use of stable isotopic values alone.
With reference to the alluvial aquifers facing the northern Apennines, further efforts need to be made to unravel their hydrogeological complexities. In particular, future works will be devoted to the Mean Residence Time MRT approach coupled with extended time-series of isotopes and chemicals (not only water isotopes but also carbon-14 (
14C) and nitrates; the latter are widespread over these alluvial fans as a result of manure over their apical parts and tend to decrease northwards [
44]) with a lumped parameter model. In such a way, the MRT method will allow all the different quotas of flow paths composing the groundwater samples to be dated. Furthermore, the results will be compared with geospatial maps reporting the groundwater withdrawals (here reported in
Figure 4 as millions of m
3 per year; however, it can be seen that most groundwater extractions are focused in alluvial fans areas) as well as groundwater excursions (see again
Figure 4; even though annual excursions exceeding 12 m are concentrated in the apical part of the alluvial fans, several wells with high annual excursion are located in the distal part of the alluvial fans or even in the lowlands); these will better clarify the anthropogenic role of pumping on natural aquifers, also in terms of the variations in flow paths.


