Article

Inline Pumped Storage Hydropower towards Smart and Flexible Energy Recovery in Water Networks

1
Department of Civil Engineering, Architecture and Georesources, CERIS, Instituto Superior Técnico, University of Lisbon, 1049-001 Lisbon, Portugal
2
Department of Architecture and Civil Engineering, University of Bath, Bath BA2 7AY, UK
*
Author to whom correspondence should be addressed.
Water 2020, 12(8), 2224; https://doi.org/10.3390/w12082224
Submission received: 15 June 2020 / Revised: 2 August 2020 / Accepted: 5 August 2020 / Published: 7 August 2020
(This article belongs to the Special Issue New Challenges in Water Systems)

Abstract

:
Energy and climate change are thoroughly linked since fossil energy generation highly affects the environment, and climate change influences the renewable energy generation capacity. Hence, this study gives a new contribution to the energy generation in water infrastructures by means of an inline pumped-storage hydro (IPSH) solution. The selection of the equipment is the first step towards good results. The energy generation through decentralized micro-hydropower facilities can offer a good solution since they are independent of the hydrologic cycle associated with climate change. The current study presents the methodology and analyses to use water level difference between water tanks or reservoirs in a base pumping system (BPS) to transform it into the concept of a pump-storage hydropower solution. The investigation was developed based on an experimental facility and numerical simulations using WaterGEMS in the optimization of the system operation and for the selection of the characteristic curves, both for the pump and turbine modes. The model simulation of the integrated system was calibrated, and the conceptual IPSH that can be installed was then investigated. The achieved energy for different technical scale systems was estimated using proper dimensional analysis applied to different scaled hydraulic circuits, as well as for hydropower response.

1. Introduction

The increasing need for energy in current societies is inducing more emissions of carbon dioxide to the atmosphere worsening the climate change issues. For that reason, the use of renewable energies has received serious attention in recent years. Ensuring a clean environment and a sustainable development of renewable energy sources widely and globally are appointed as future targets (in UN 2030 Agenda [1]). Although there are great interests in wind and solar as green energy sources, the hydropower should not be overlooked with huge given proof. Currently, hydropower is considered as one of the most flexible and preferred sources to produce electricity [2] and for renewable integration. Therefore, the idea of power production using water based on its available flow energy can contribute to the reduction in significant environmental impacts [3,4].
The basic principle of hydropower is driving a turbine by using the power of water through two common configurations: with or without reservoirs. In hydropower with a reservoir, the water can be stored and is able to generate a considerable amount of energy depending on its capacity, while in hydropower without a reservoir, it produces less, operating preferentially with a constant flow, such as water trunk mains or transmission lines [5]. For that reason, among the diverse use of water in multipurpose systems, one usage is increasing for generating energy [6,7]. This is a field in which large potential in the micro-hydropower (MHP) category with a low or medium head is available in different conveyance systems of water networks [8,9].
Many studies already exist in the literature, but still, there is space for further explorations. In that realm, tubular propeller turbines provide a good possibility that has been addressed in the study [10] presenting an experimental work on the characterization of an inline tubular propeller suitable for pressurized systems, such as water supply and distribution networks, reporting an efficiency around 60% for low-head (below 50 m) operations. Another study [11] has presented an investigation about the reduction in the energy consumption in water pipe networks through the use of low-cost MHPs as a means to exploit the excess pressure within these networks to produce stand-alone electricity production for local or rural consumption. In a case study, Samora et al. [12] developed a method being applied to the city of Fribourg in Switzerland and analyzed the benefits associated with a proposed hydropower scheme. The optimization led to more economic installations, and also combinations of one or more series turbines tested in this study, increasing the energy production. Additionally, a new integrated technical solution with economic and system flexibility benefits is introduced through replacing a pressure reduction valve (PRV) by a pump as turbine (PAT) [13]. In that sense, an implementation in a system having a head between 35 and 90 m reported energy generation of 20 to 94 MWh for flow rate varying between 20 and 50 L/s [14]. Choosing PATs instead of conventional turbines is a good practice that reduces the initial costs of the energy system [15,16]. Additionally, the excess energy in water networks can be recovered to optimize the energy efficiency of the systems [17] equipped with a pump station but presenting an excess of available energy in a gravity pipe branch. In order to use this excess of hydraulic available energy, a water turbine can be installed providing good energy results [17]. Very valuable studies exist on energy generation in water distribution networks (WDNs). Pérez-Sánchez et al. [18] tried to study the sustainability of WDNs by adding energy recovery possibility which leads to an added value to those systems. This study investigated different solutions in energy recovery and provided useful recommendations. Another recent study [19] introduced a novel system for WDNs to control the pressure using a hydraulically operated PRV and generate energy using a PAT. Hydropower generation in a small-scale WDN has also been investigated in another study by using PAT [20]. This study tried to characterize the PAT specification installed instead of a PRV by examining different scenarios. The literature review in WDN shows that most of the energy generation studies use PAT either as a single or hybrid solution. In that realm, Carravetta et al. [21] introduce PAT design strategies for WDNs based on a comparison between hydraulic and electrical regulations in a variable operating strategy. This study showed that the hydraulic regulation of the PAT leads to higher flexibility and efficiency. However, the flow rate is continuously changing in WDNs, which implies having a control system to avoid deficiency in the energy generation. In that case, rather than average values, the daily variation of the flow must be considered. Some studies suggest a real time control (RTC) strategy [22]. Creaco et al. recently presented a comprehensive study of different RTC methods in WDNs [23]. In that scope, Puleo et al. [24] studied the PAT application in WDNs by considering the flow variation that was driven by variable head tanks. This study used a global gradient algorithm to more accurately simulate the network parameters proving that the PAT efficiency is dependent on the network supply and pressure conditions. The flow variation subject is also studied by Alberizzi et al. [25] in a WDN in Italy when a PAT speed control strategy was applied to better exploit the flow rate even in high variations. The introduced strategy was applied and it was possible to provide energy recovery values of the order of 30% higher than a no speed variation scenario. The application of MHP solutions has gone even further to irrigation networks with a promising future of their applicability [26,27,28,29,30]. Additionally, novel solutions using the compressibility effect of air have been presented in some studies [9,31,32,33] that can be combined with pumped-storage hydropower (IPSH) to offer a hybrid pump–hydro solution. Despite the mentioned studies in this field, it is still worth exploring more aspects. Most of the mentioned solutions are completely dependent on a considerable available head to produce energy that mostly occurs through exploiting PATs. In that sense, this study tried to examine the idea of creating the required head by adding storage tanks to the system.
Hence, the current study introduces an inline pumped-storage hydropower (IPSH) solution based on experimental tests, numerical simulations and parametric analysis. Among several discussed practical solutions, IPSH can add more flexibility to pumping systems by providing higher head difference enabling the reduction in energy consumption through reusing the pumped water in gravity branches. Since it will not ask for major changes and large additional investments, using a by-pass to the main pumping system can offer a profitable hydro-energy solution. Among the energy generated, the water power potential energy is more flexible, adaptive and feasible to combine with other renewable sources to feed the pumping system as a hybrid solution. Based on that, this study aims to (a) define the electromechanical selection rules; (b) present a conceptual idea of energy generation by using storage tanks in WDN; (c) analyze results from an experimental small-scaled system by means of numerical simulations to calculate energy generation in a conceptual energy recovery prototype; (d) use suitable dimensional analysis (for hydraulic system and turbomachinery) to predict energy output in different systems’ scales. In general, this study presents a low-cost energy prediction using a pumped-storage hydropower solution through experimental measurements, calibration of the numerical model and dimensional analyses.

2. Electromechanical Equipment

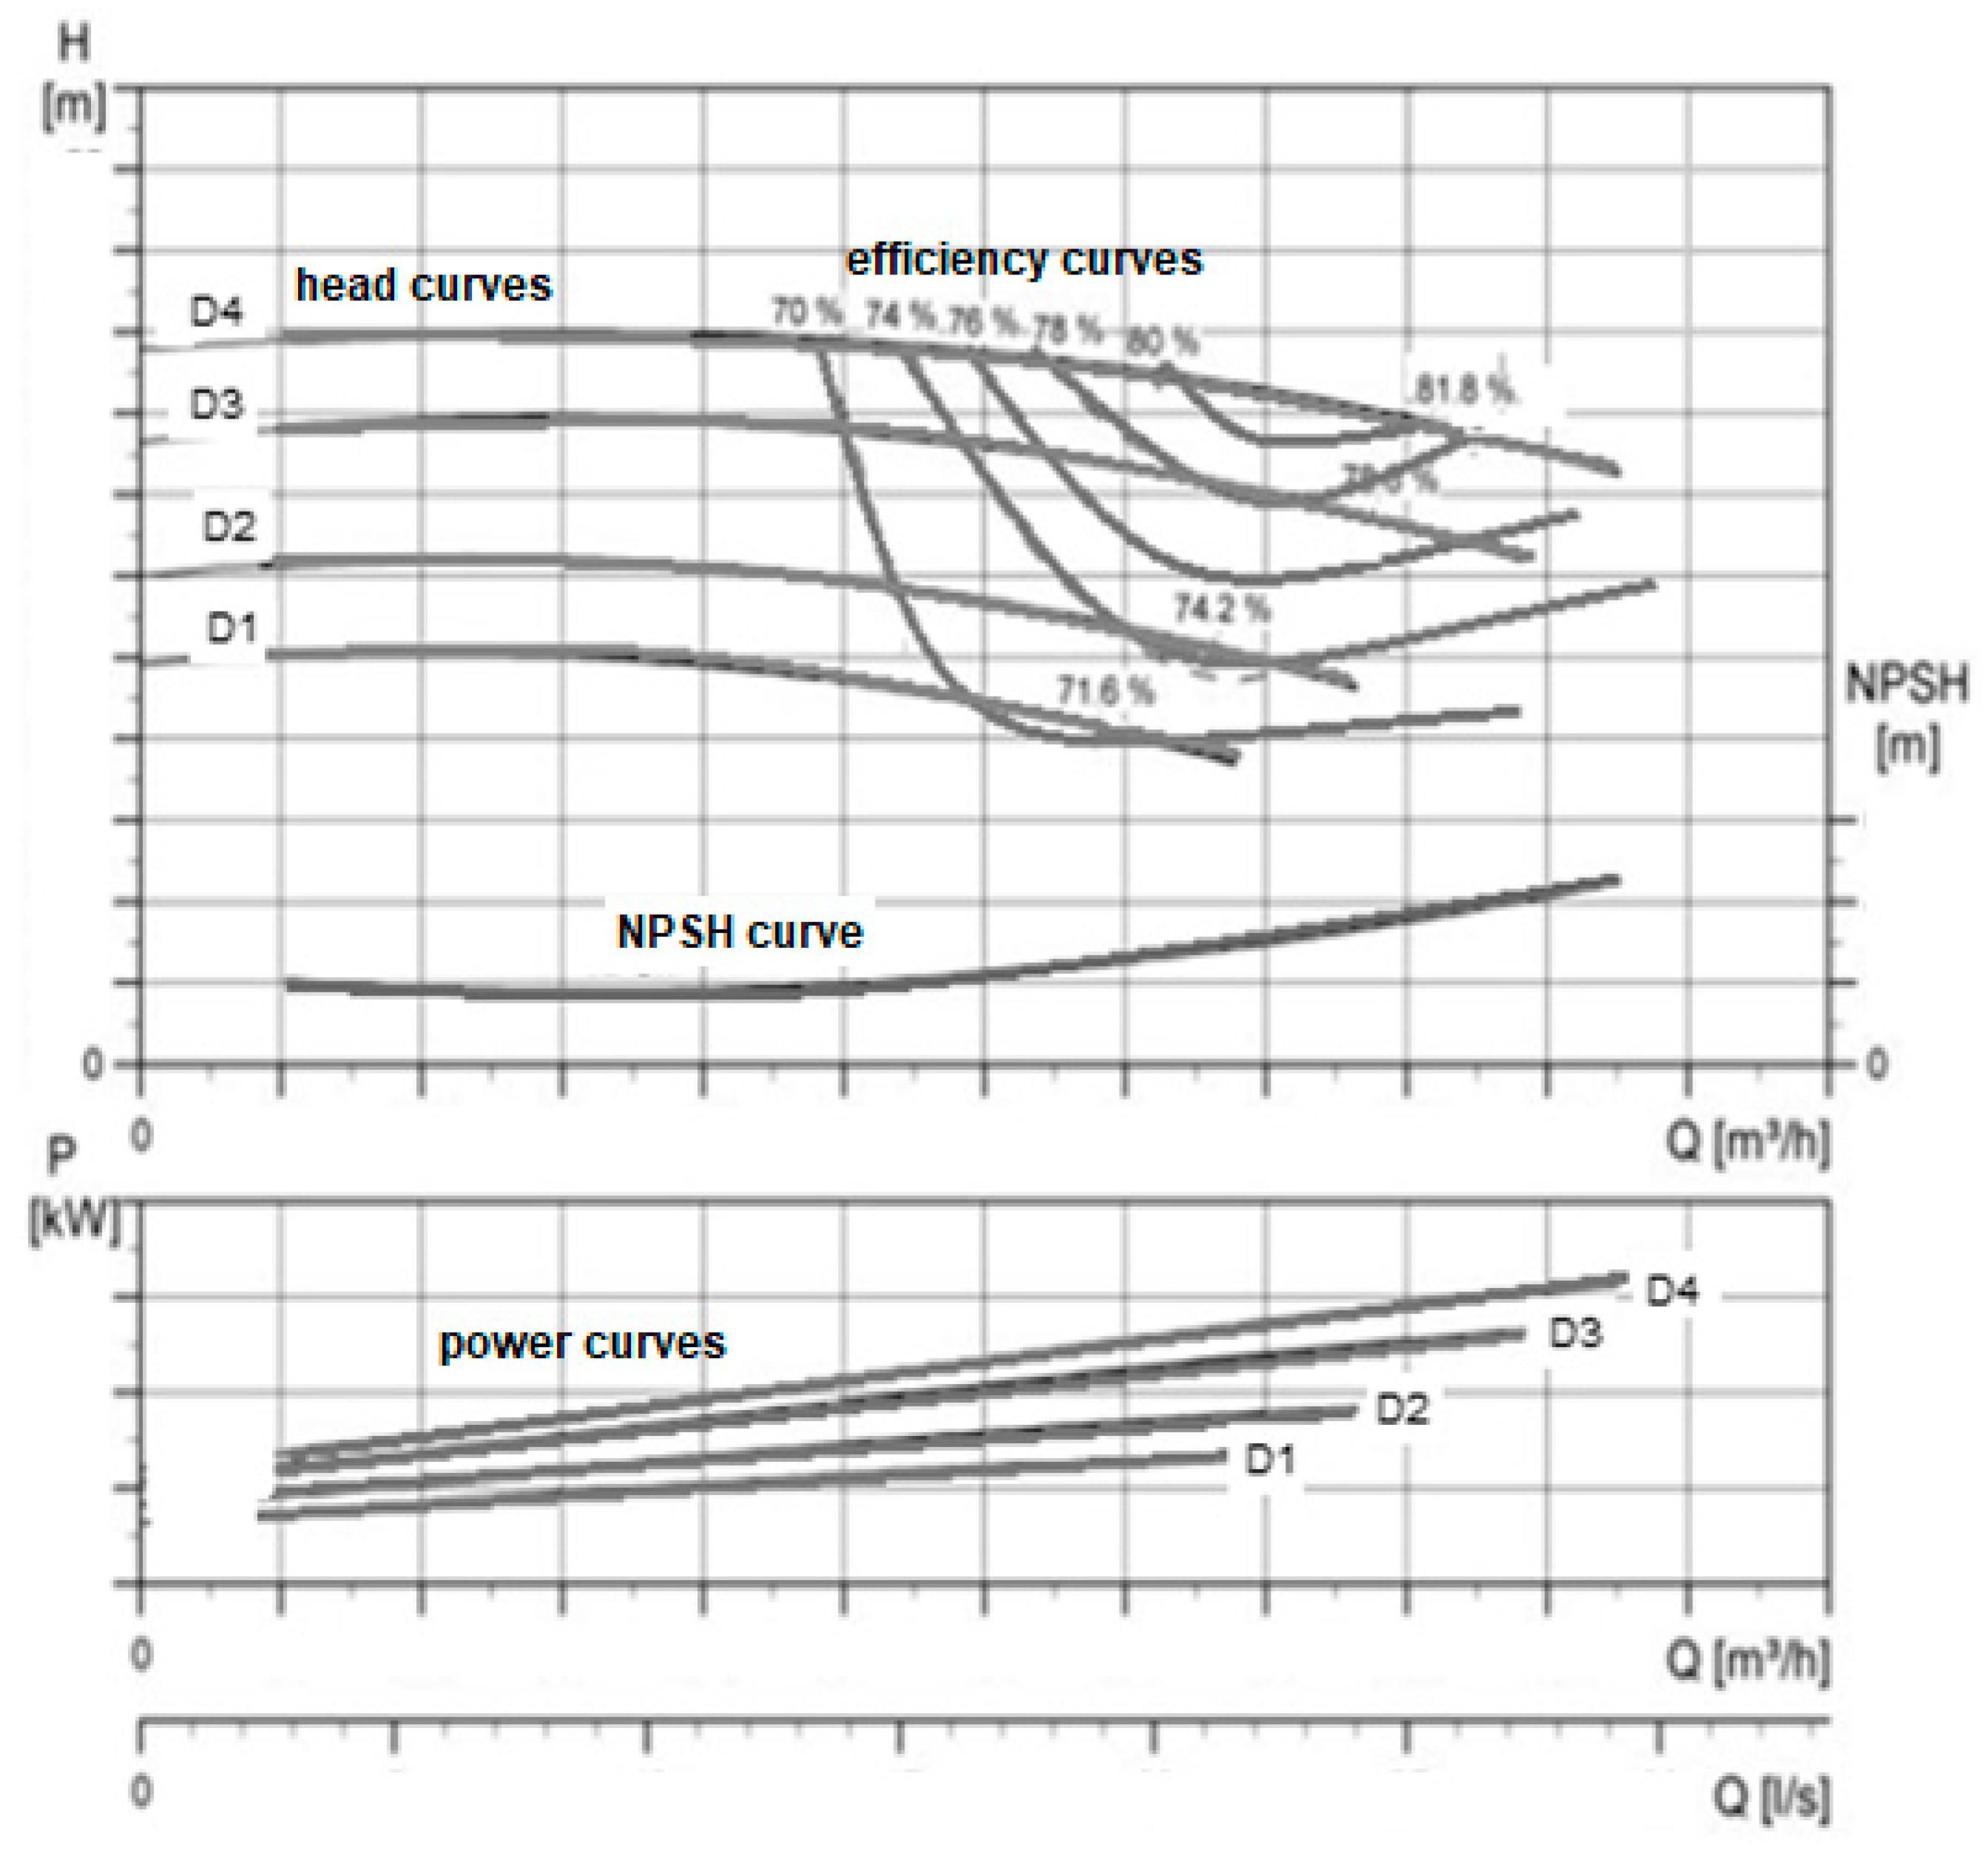
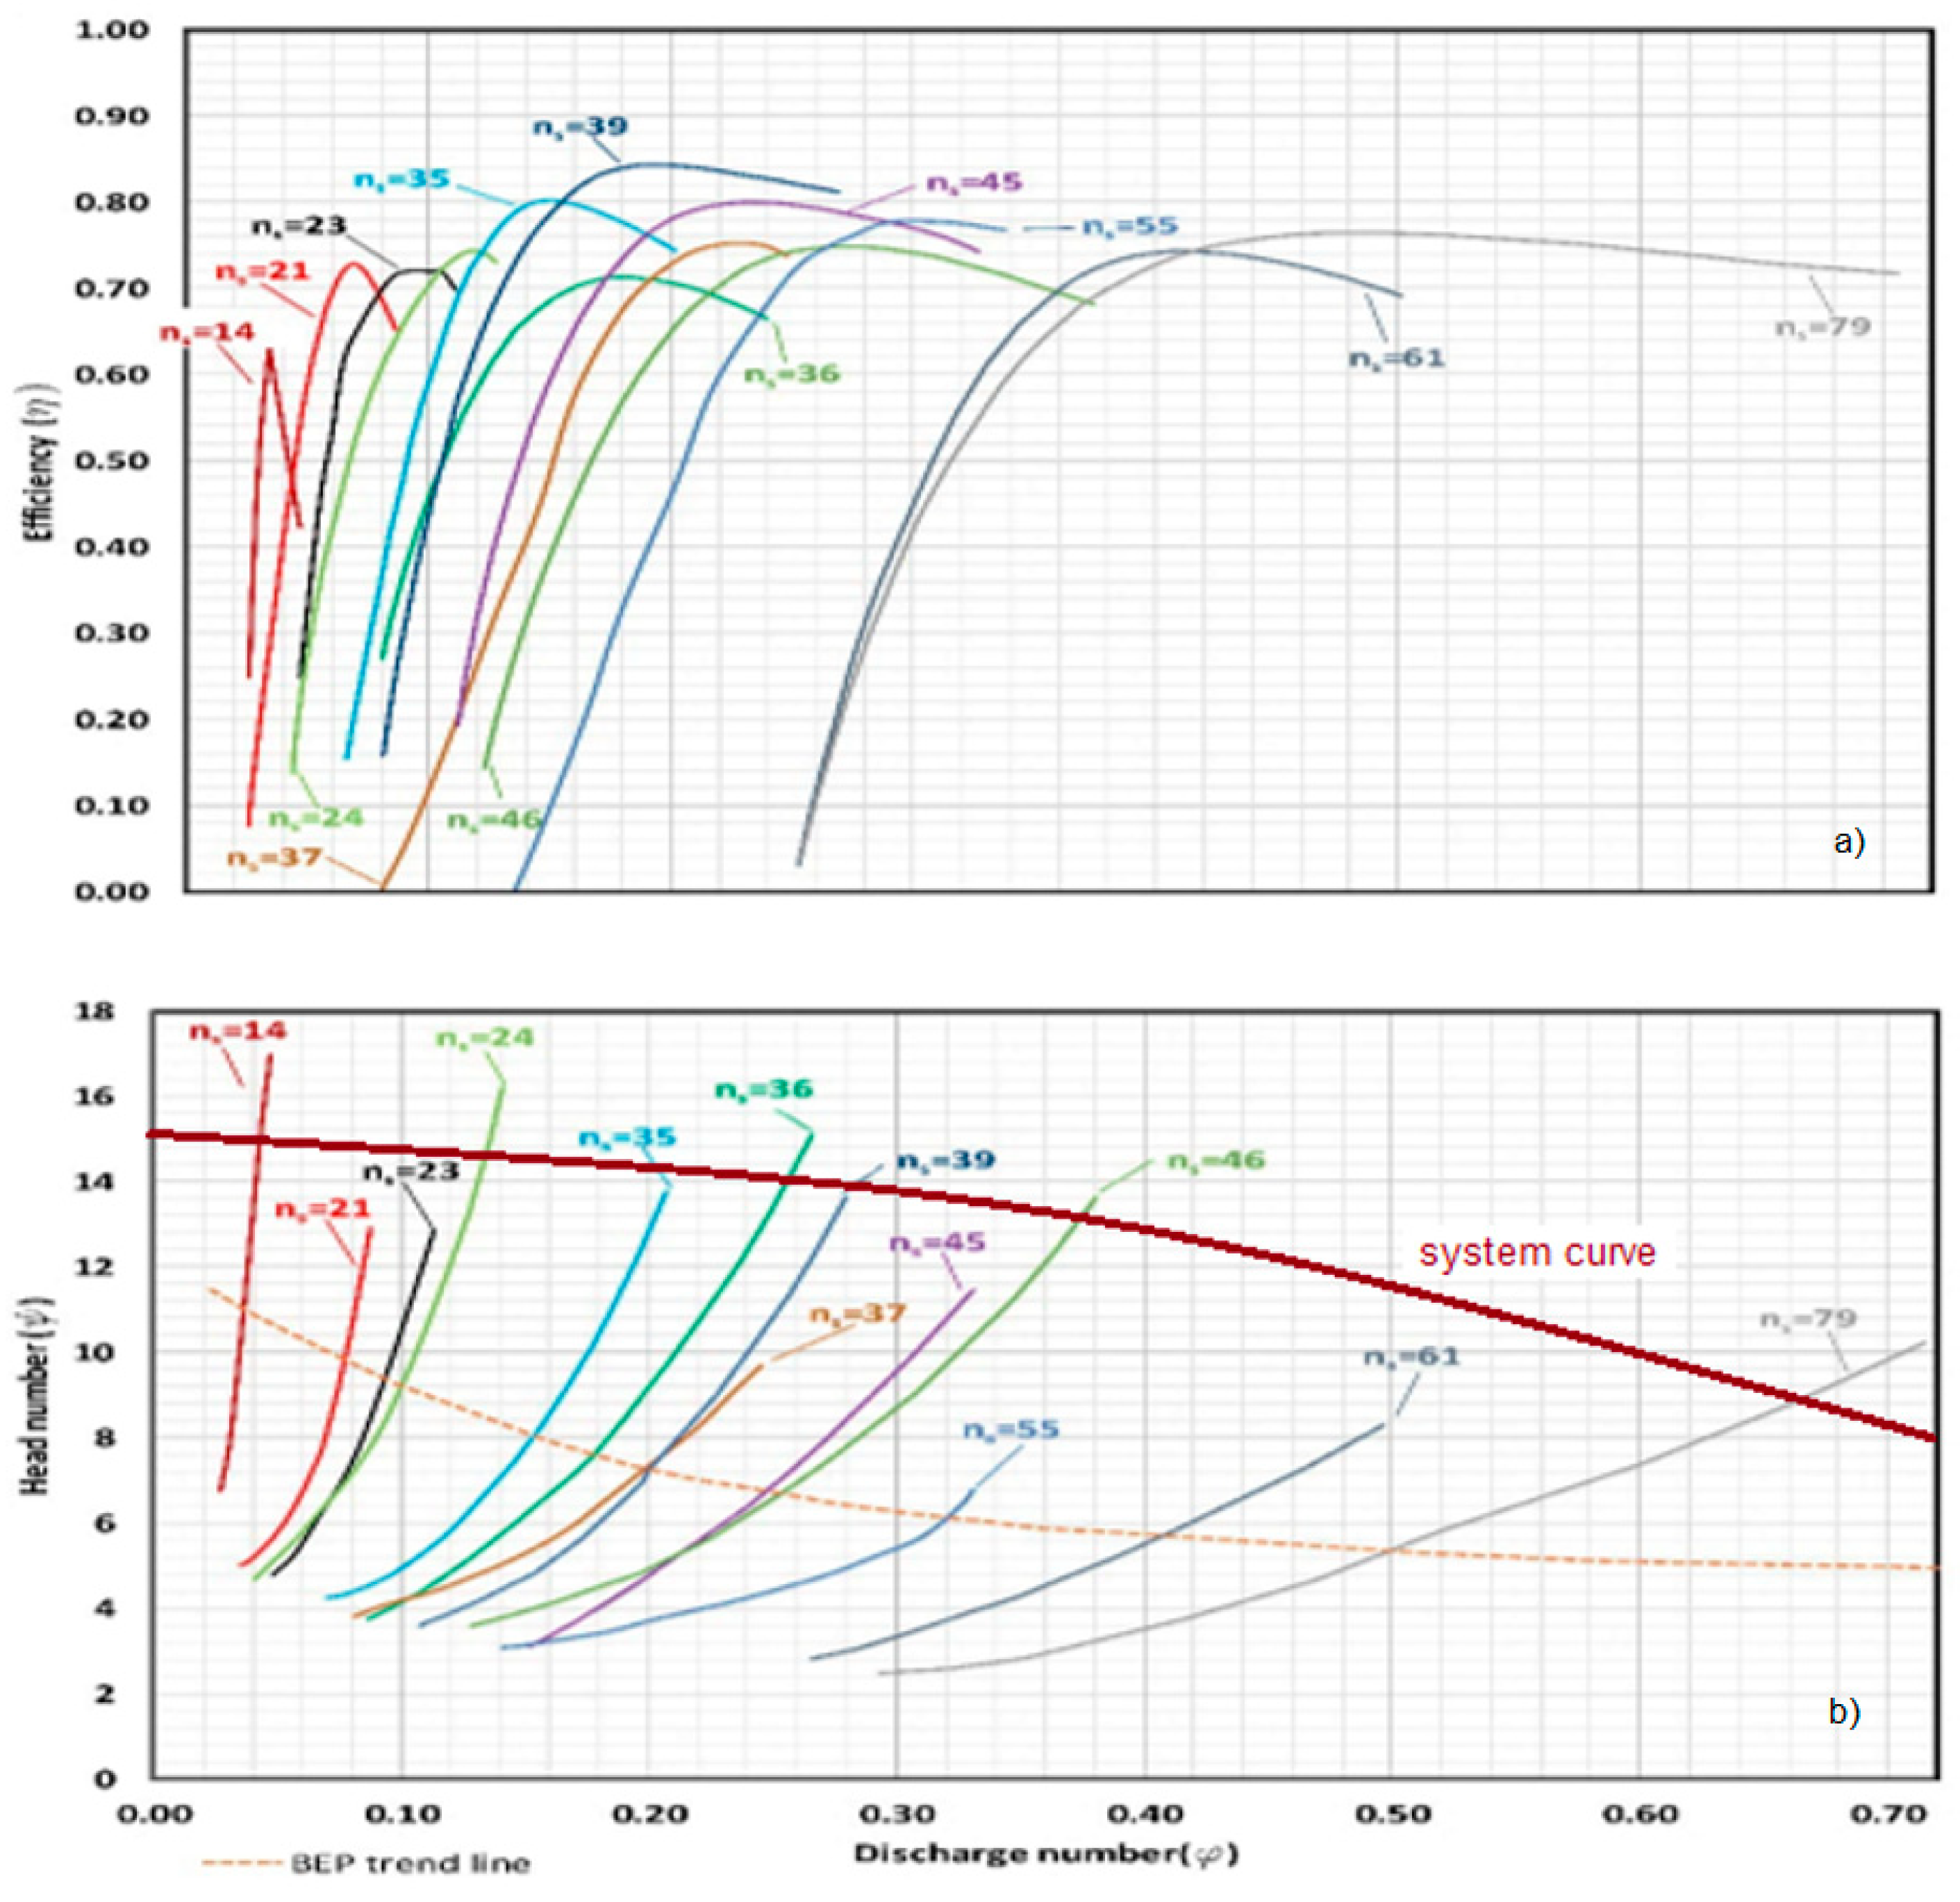
2.1. Pump Characteristics

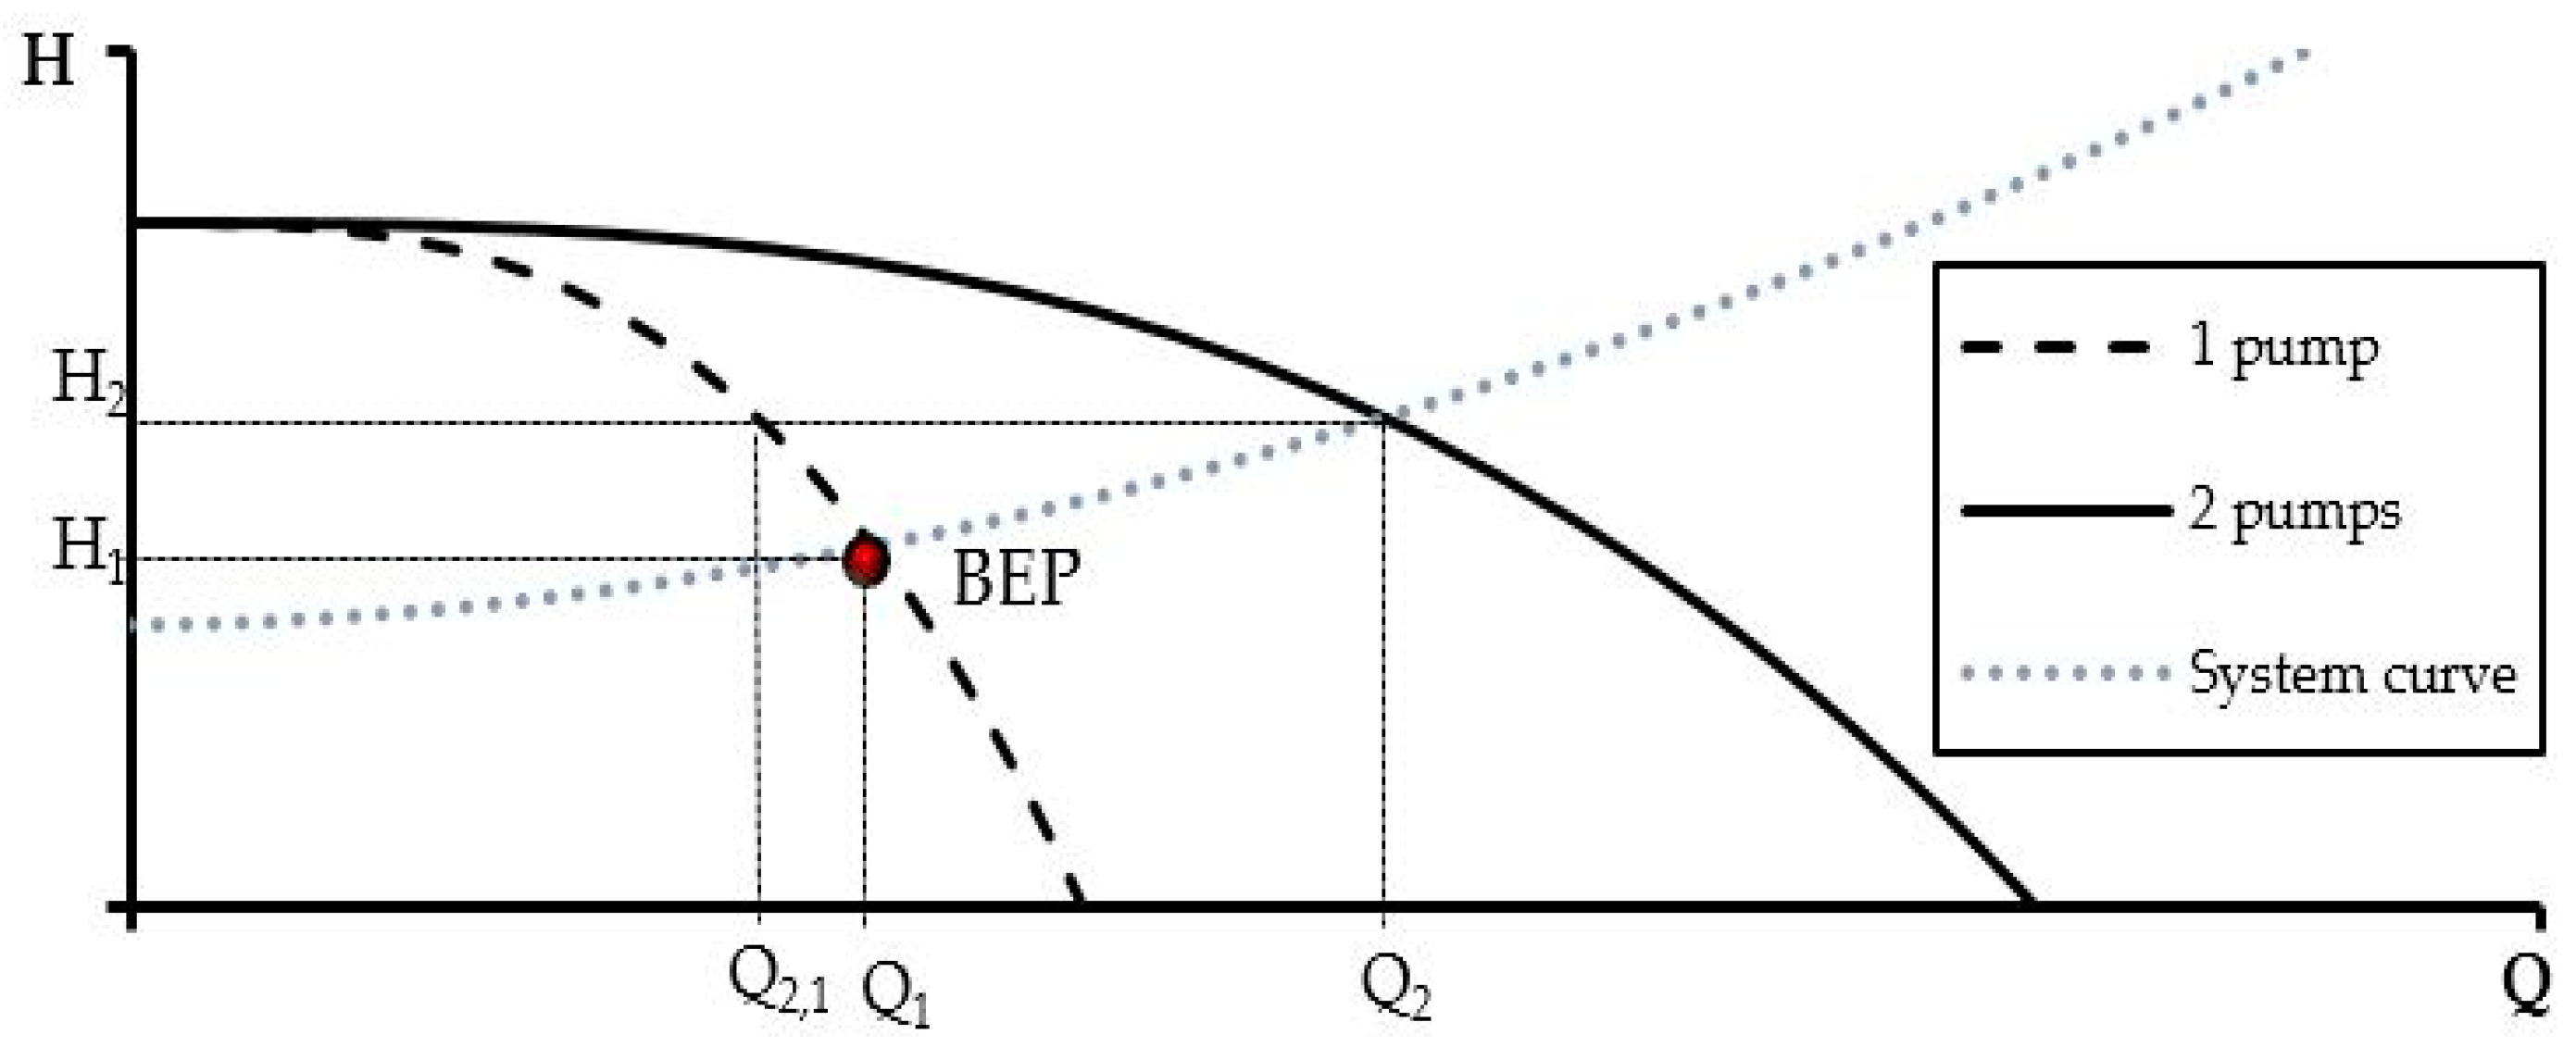
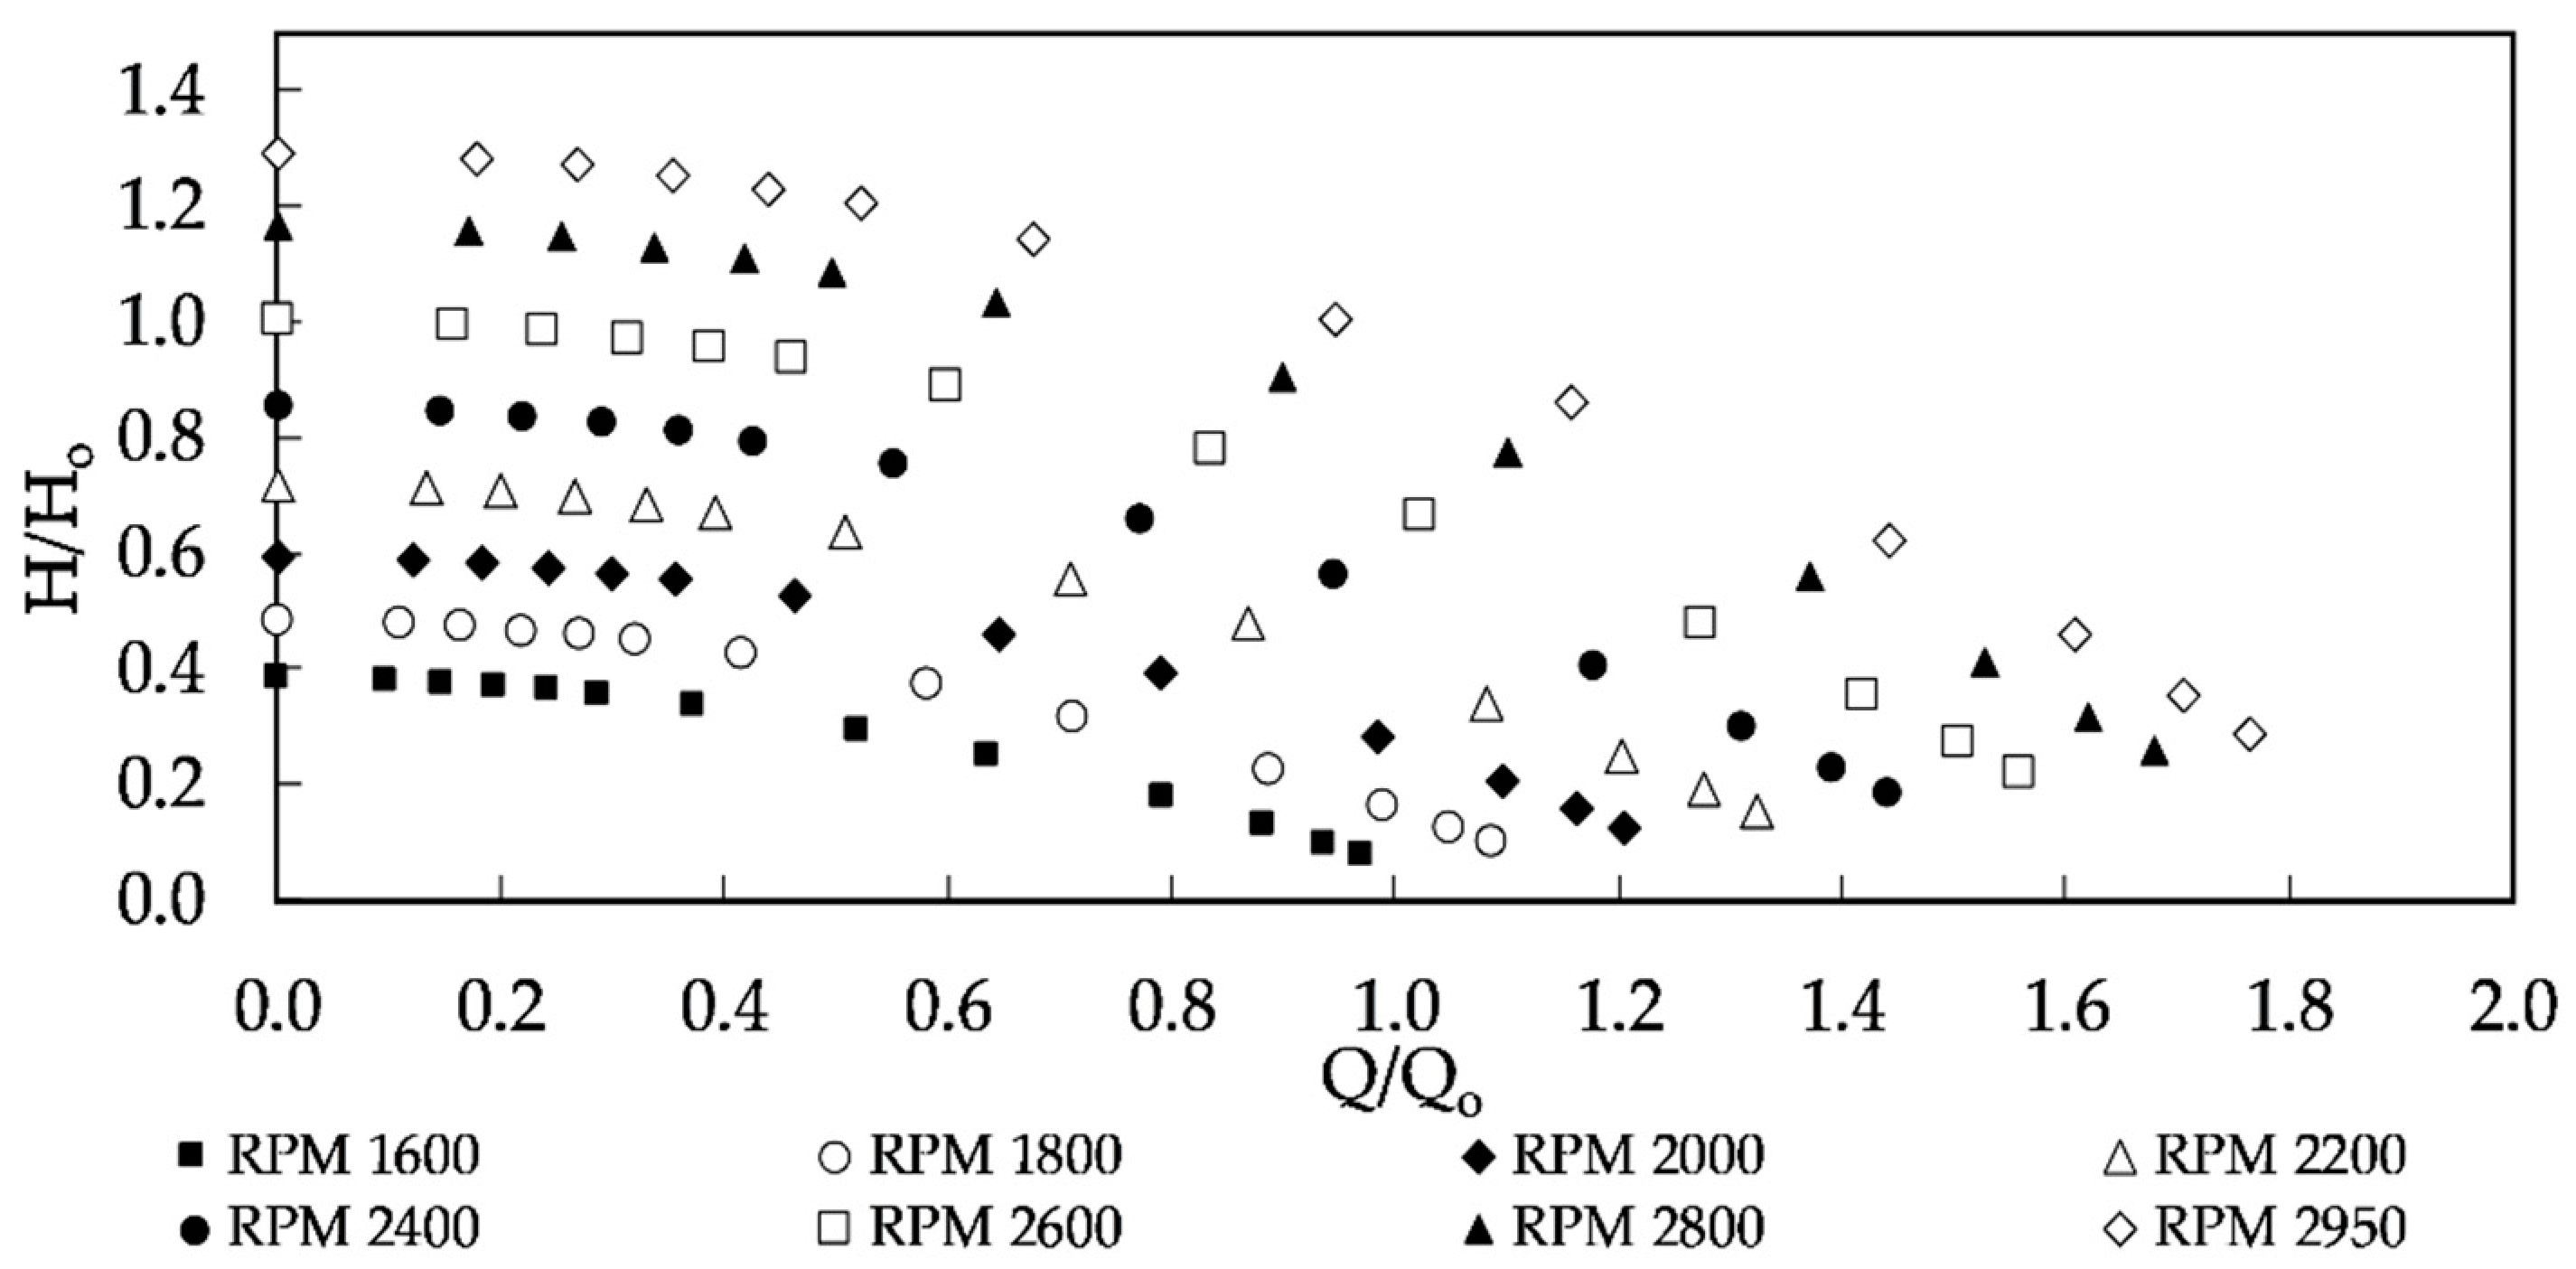
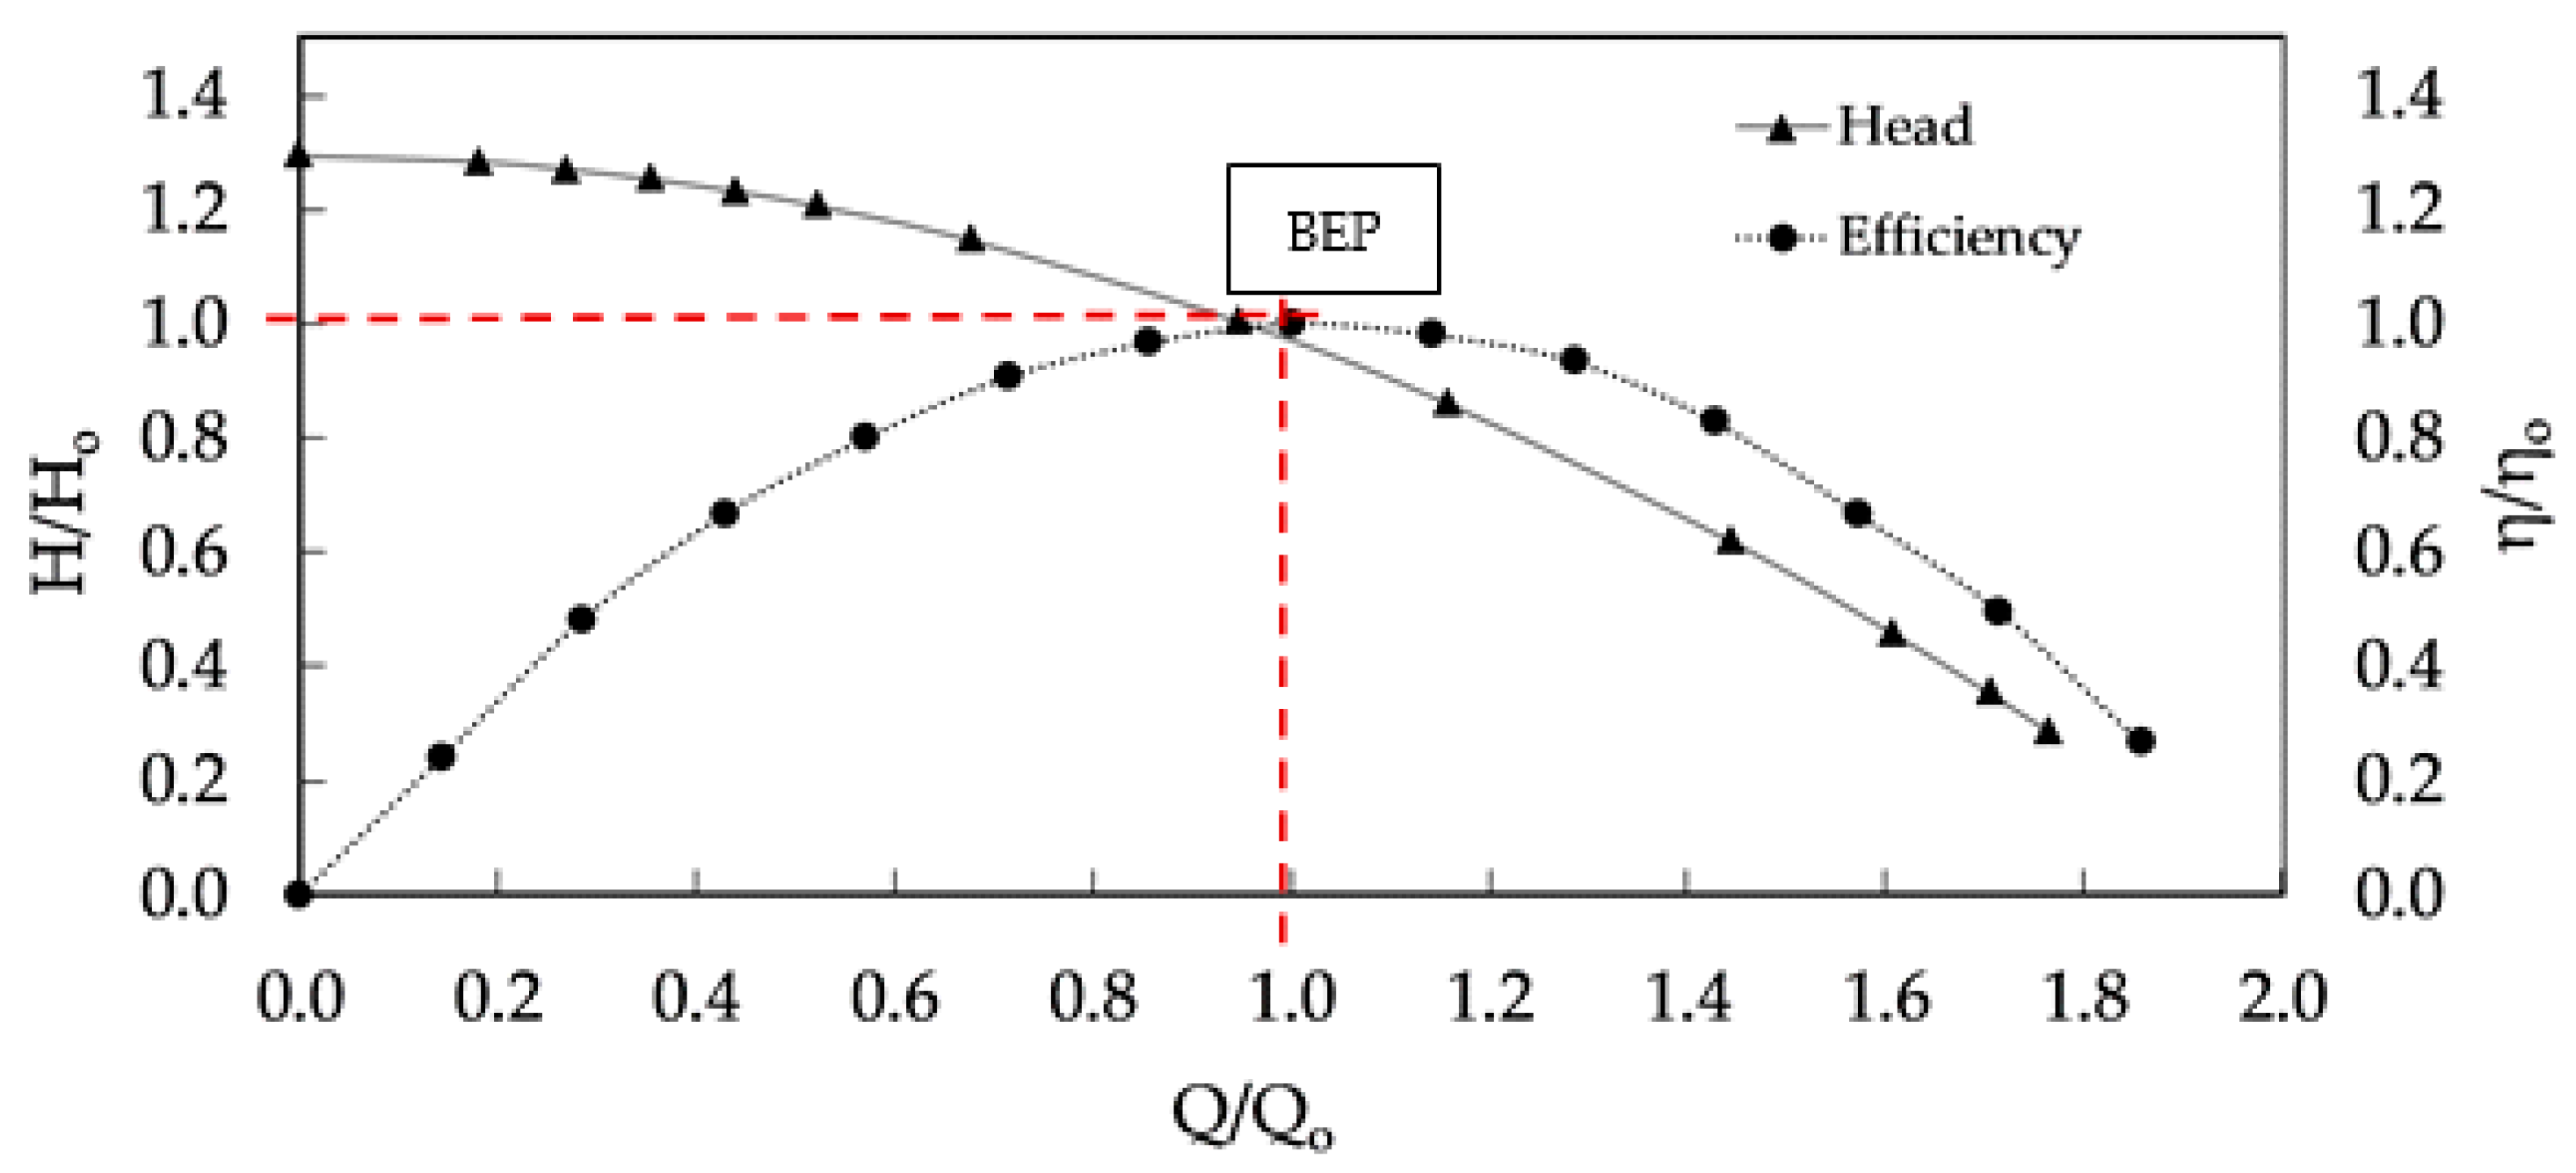
2.1.1. Characteristic Curves and Operational Point

Pump characteristic curves describe the relationship between the flow rate and the pump head for a specific pump type (Figure 1). Other important information is graphs for different impeller diameters, the net positive suction head (NPSH), the efficiency and power curves. In the case of any pump, its designation determines its specific nominal discharge impeller diameter. The pump’s efficiency throughout its characteristic curve should not drift too much from the best efficiency point (BEP). The motors whose pole number is associated with the rotational speed value also have their own efficiencies to be considered.
The operation point in each pump curve is dependent upon the characteristics of the system in which it is operating. The system head curve is the head equation or the relationship between flow and hydraulic losses in the hydraulic system. Figure 2 shows the pump’s operating point ( Q 1 , H 1 ) which can change with the differential water level, closure flow control valve or the rotational speed of the pump.
When two or more pumps were installed in parallel, the increasing of flow rates were obtained (Figure 2). The operating point ( Q 2 , H 2 ) represented a higher volumetric flow rate than a single pump for a consequence of greater system head loss, and the volumetric flow rate was lower than twice the flow rate achieved by using a single pump ( Q 2 , 1 < Q 1 ). All of these changes can influence the system efficiency.
The affinity laws expressed in Equation (1) represent the mathematical relationship between the rotational speed ( n ), flow rate ( Q ), head ( H ) and pump power ( P ) for the same impeller diameter. The pump specific speed is given by Equation (2).
N 1 N 2 = Q 1 Q 2 = H 1 H 2 = P 1 P 2 3
n s p = N Q 1 / 2 H 3 / 4
Variable speed drive (VSD) in pumps induces smooth speed variations of the rotating shaft, directly proportional to the flow, translating into significant pump power variations, which can increase the efficiency of the pumping operation when compared to pumps equipped with fixed speed drive (FSD). Nevertheless, this also affects the pump head, rendering it inoperable below the point where it will not cross the system curve. As possible operating points come closer the operation of the pump becomes unstable if transient regimes occur, inducing the flow variation. Additionally, the pump curve can have a shut-off head inferior to the system curve, meaning that the pump is not able to start at that particular speed.

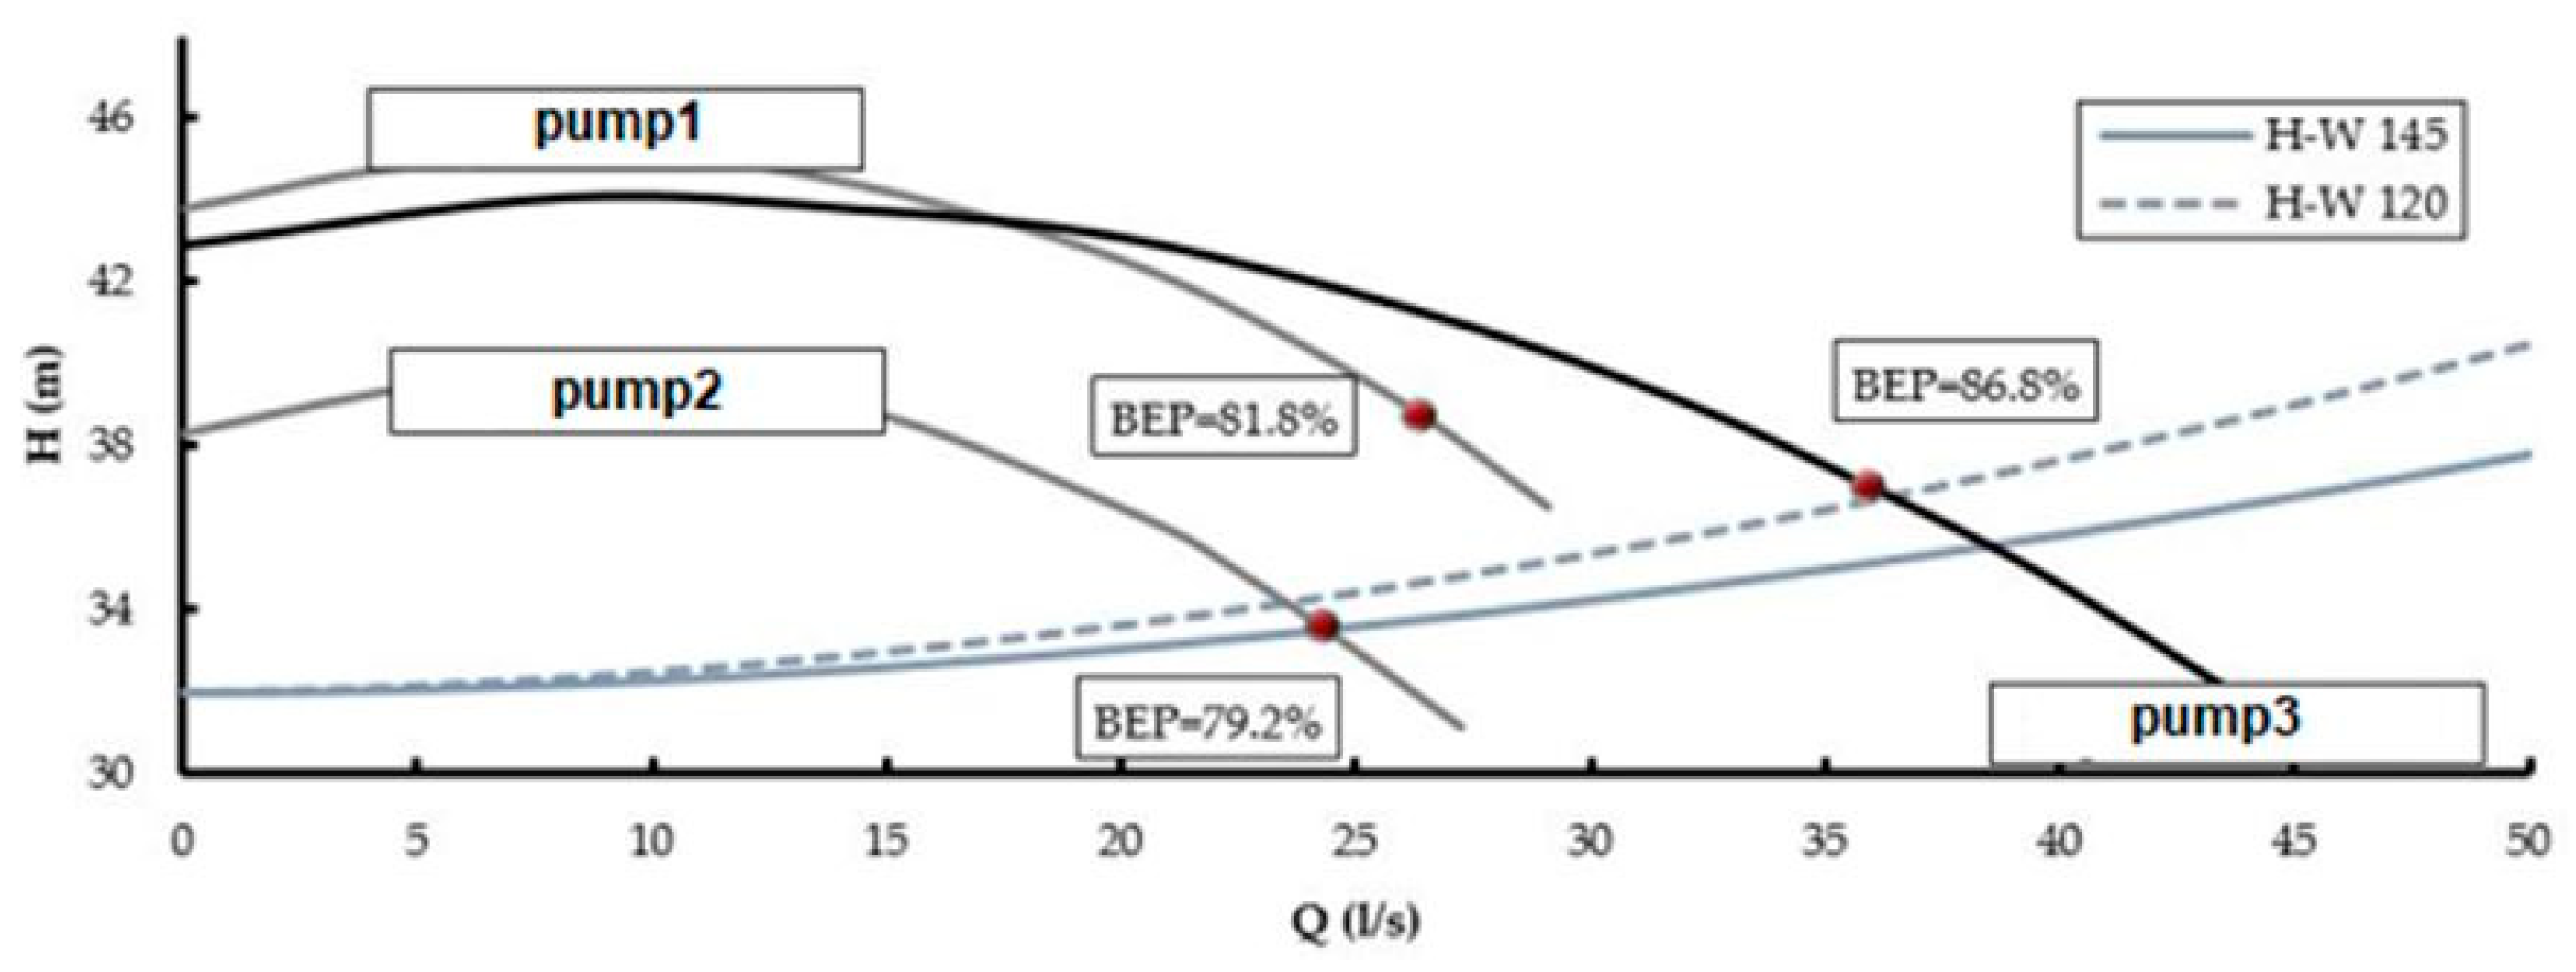
2.1.2. Selection of a Pump

In a water network system, the total water supply needed by the population must be met by the operation of one or more pumps, whereby the flow rate must be superior to the average daily demand, considering pumps with a flow up to double that value. Regarding the total head, the pumps should comprise a range which takes into account the increase in roughness of the pipes over time such as through Hazen–Williams (H–W) roughness coefficients. Based on the available pump curve, the pump needs to be suitable for its water supply system (WSS) or it will probably operate with reduced efficiency or even with flow instabilities. To have a real idea with a pump efficiency at a BEP of 72% and a motor with 92% efficiency, the total efficiency at that point is 66%. Since the operating point is far from the BEP, the operational costs resulting from additional energy consumption can be quite significant.
Then, in a pump system design, several pumps which fitted the considered flow and head ranges can be selected, such as the practical application presented in Figure 3.
  • Pump 1 is not appropriate since it would operate with flow rates not recommended by the manufacturer;
  • Pump 2 has a flow rate near to the average daily demand, increasing its probability of becoming obsolete if the demand is intensified or if the flow is reduced due to a pipe roughness increase over time. The maximum efficiency is also inferior to the pump 3 and, if equipped with a VSD, the possible speed range is minor given its inferior heads.
It is also relevant to analyze the speed range in which a pump can operate, where the solution space in the optimization process by the hydraulic simulator WaterGEMS does not include unfeasible solutions, which is determined by comparison to the system curve. The selection has to avoid system instability considering all the former considerations on the pump selection.

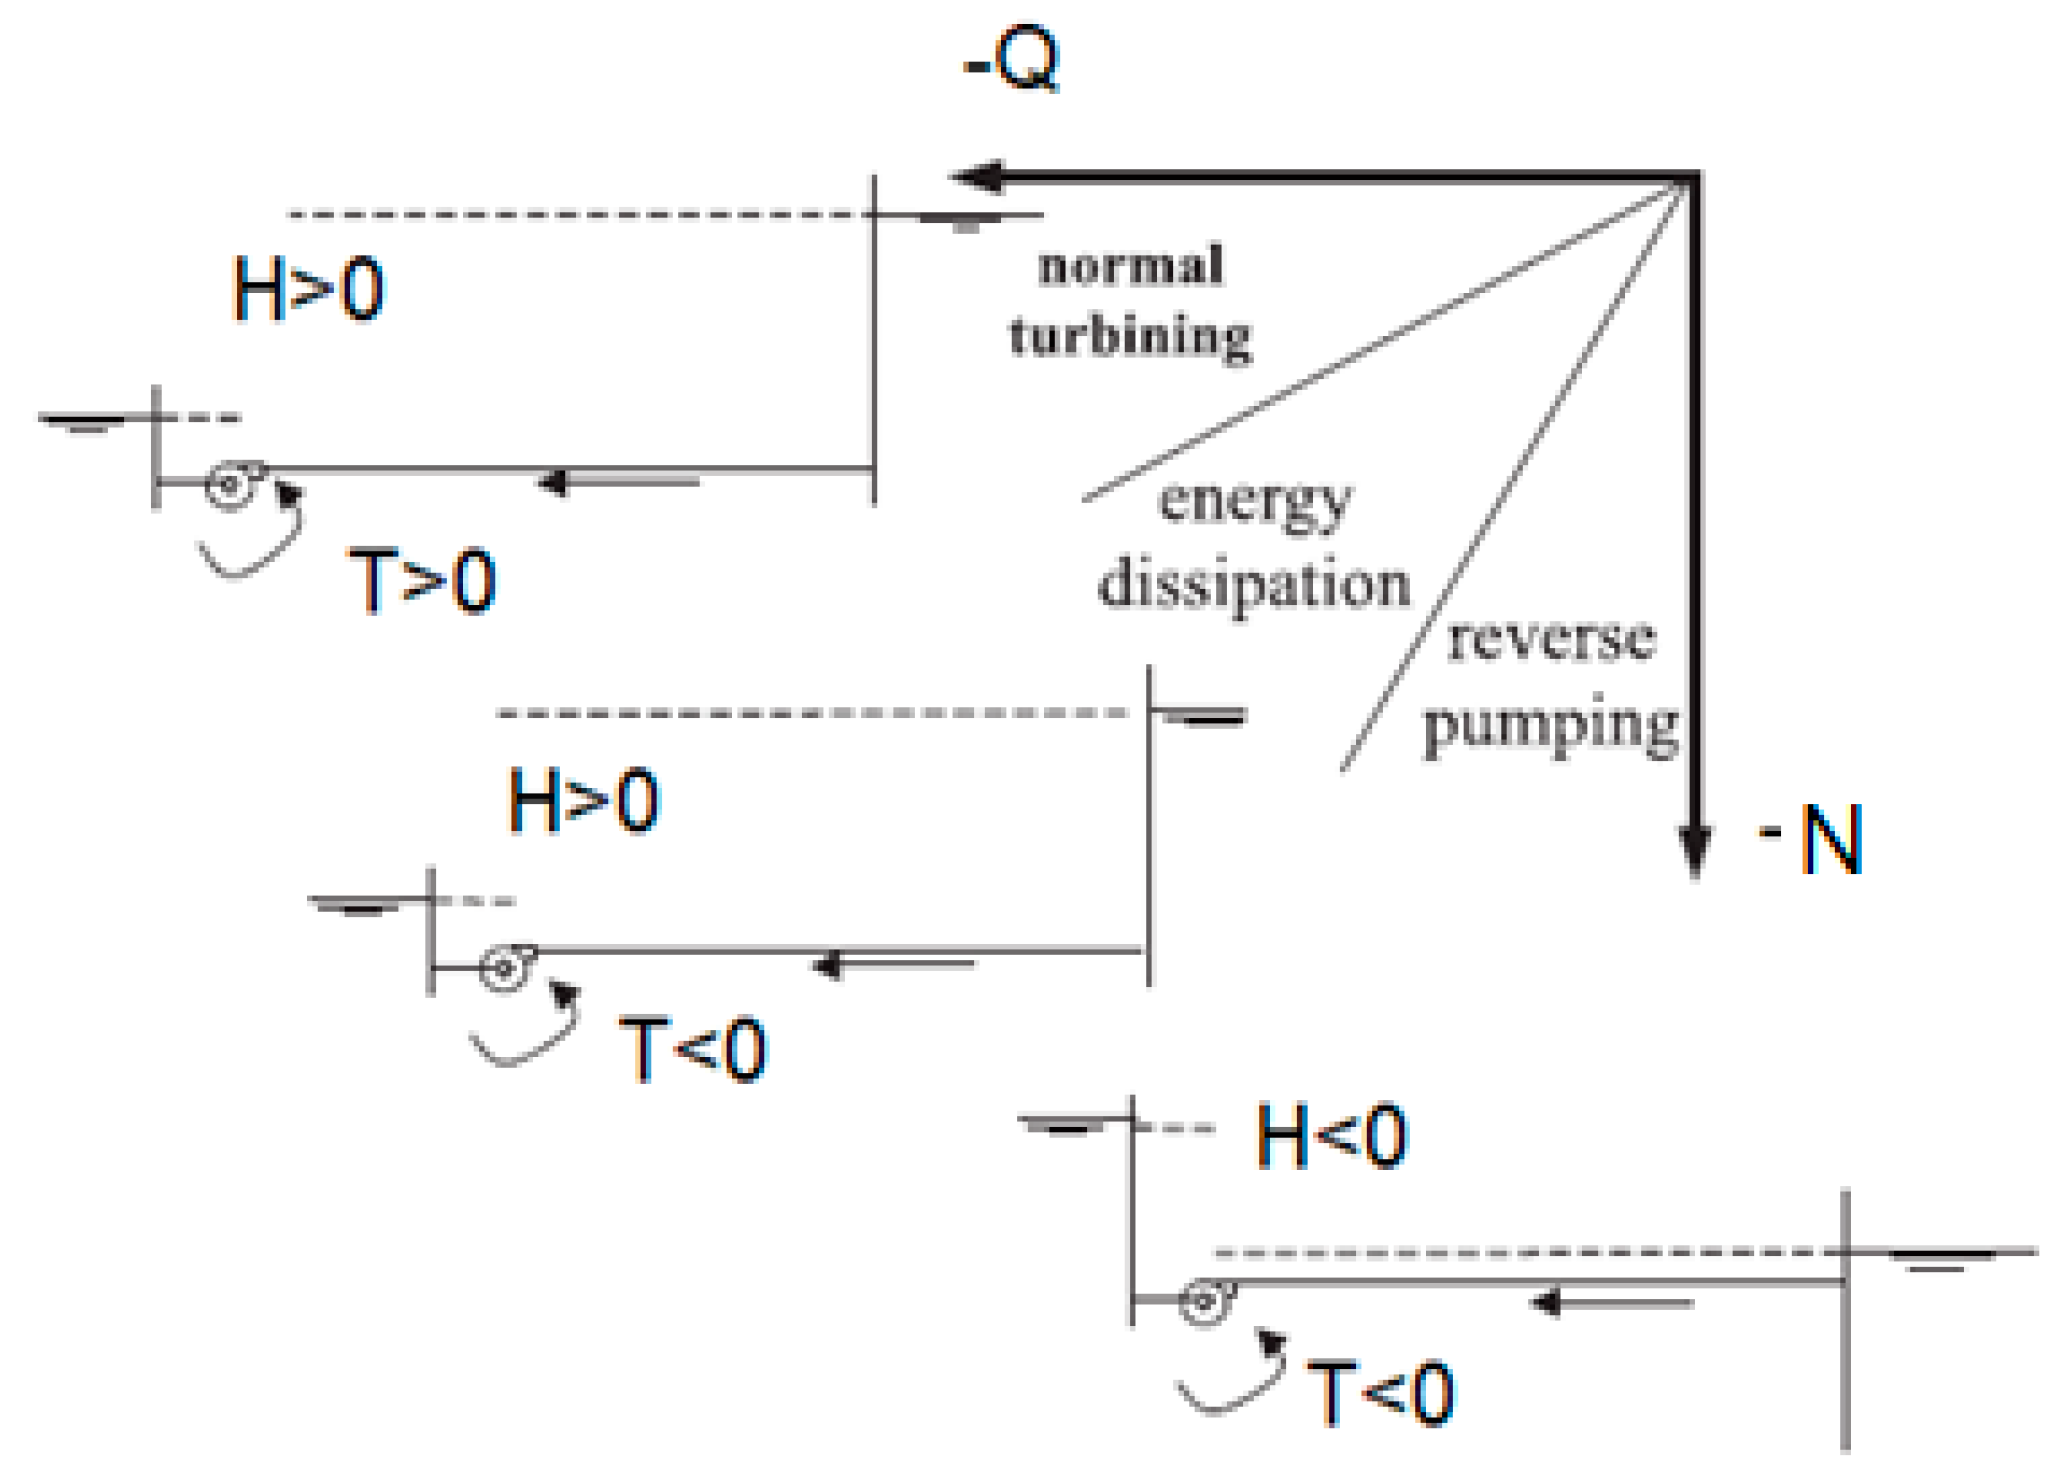
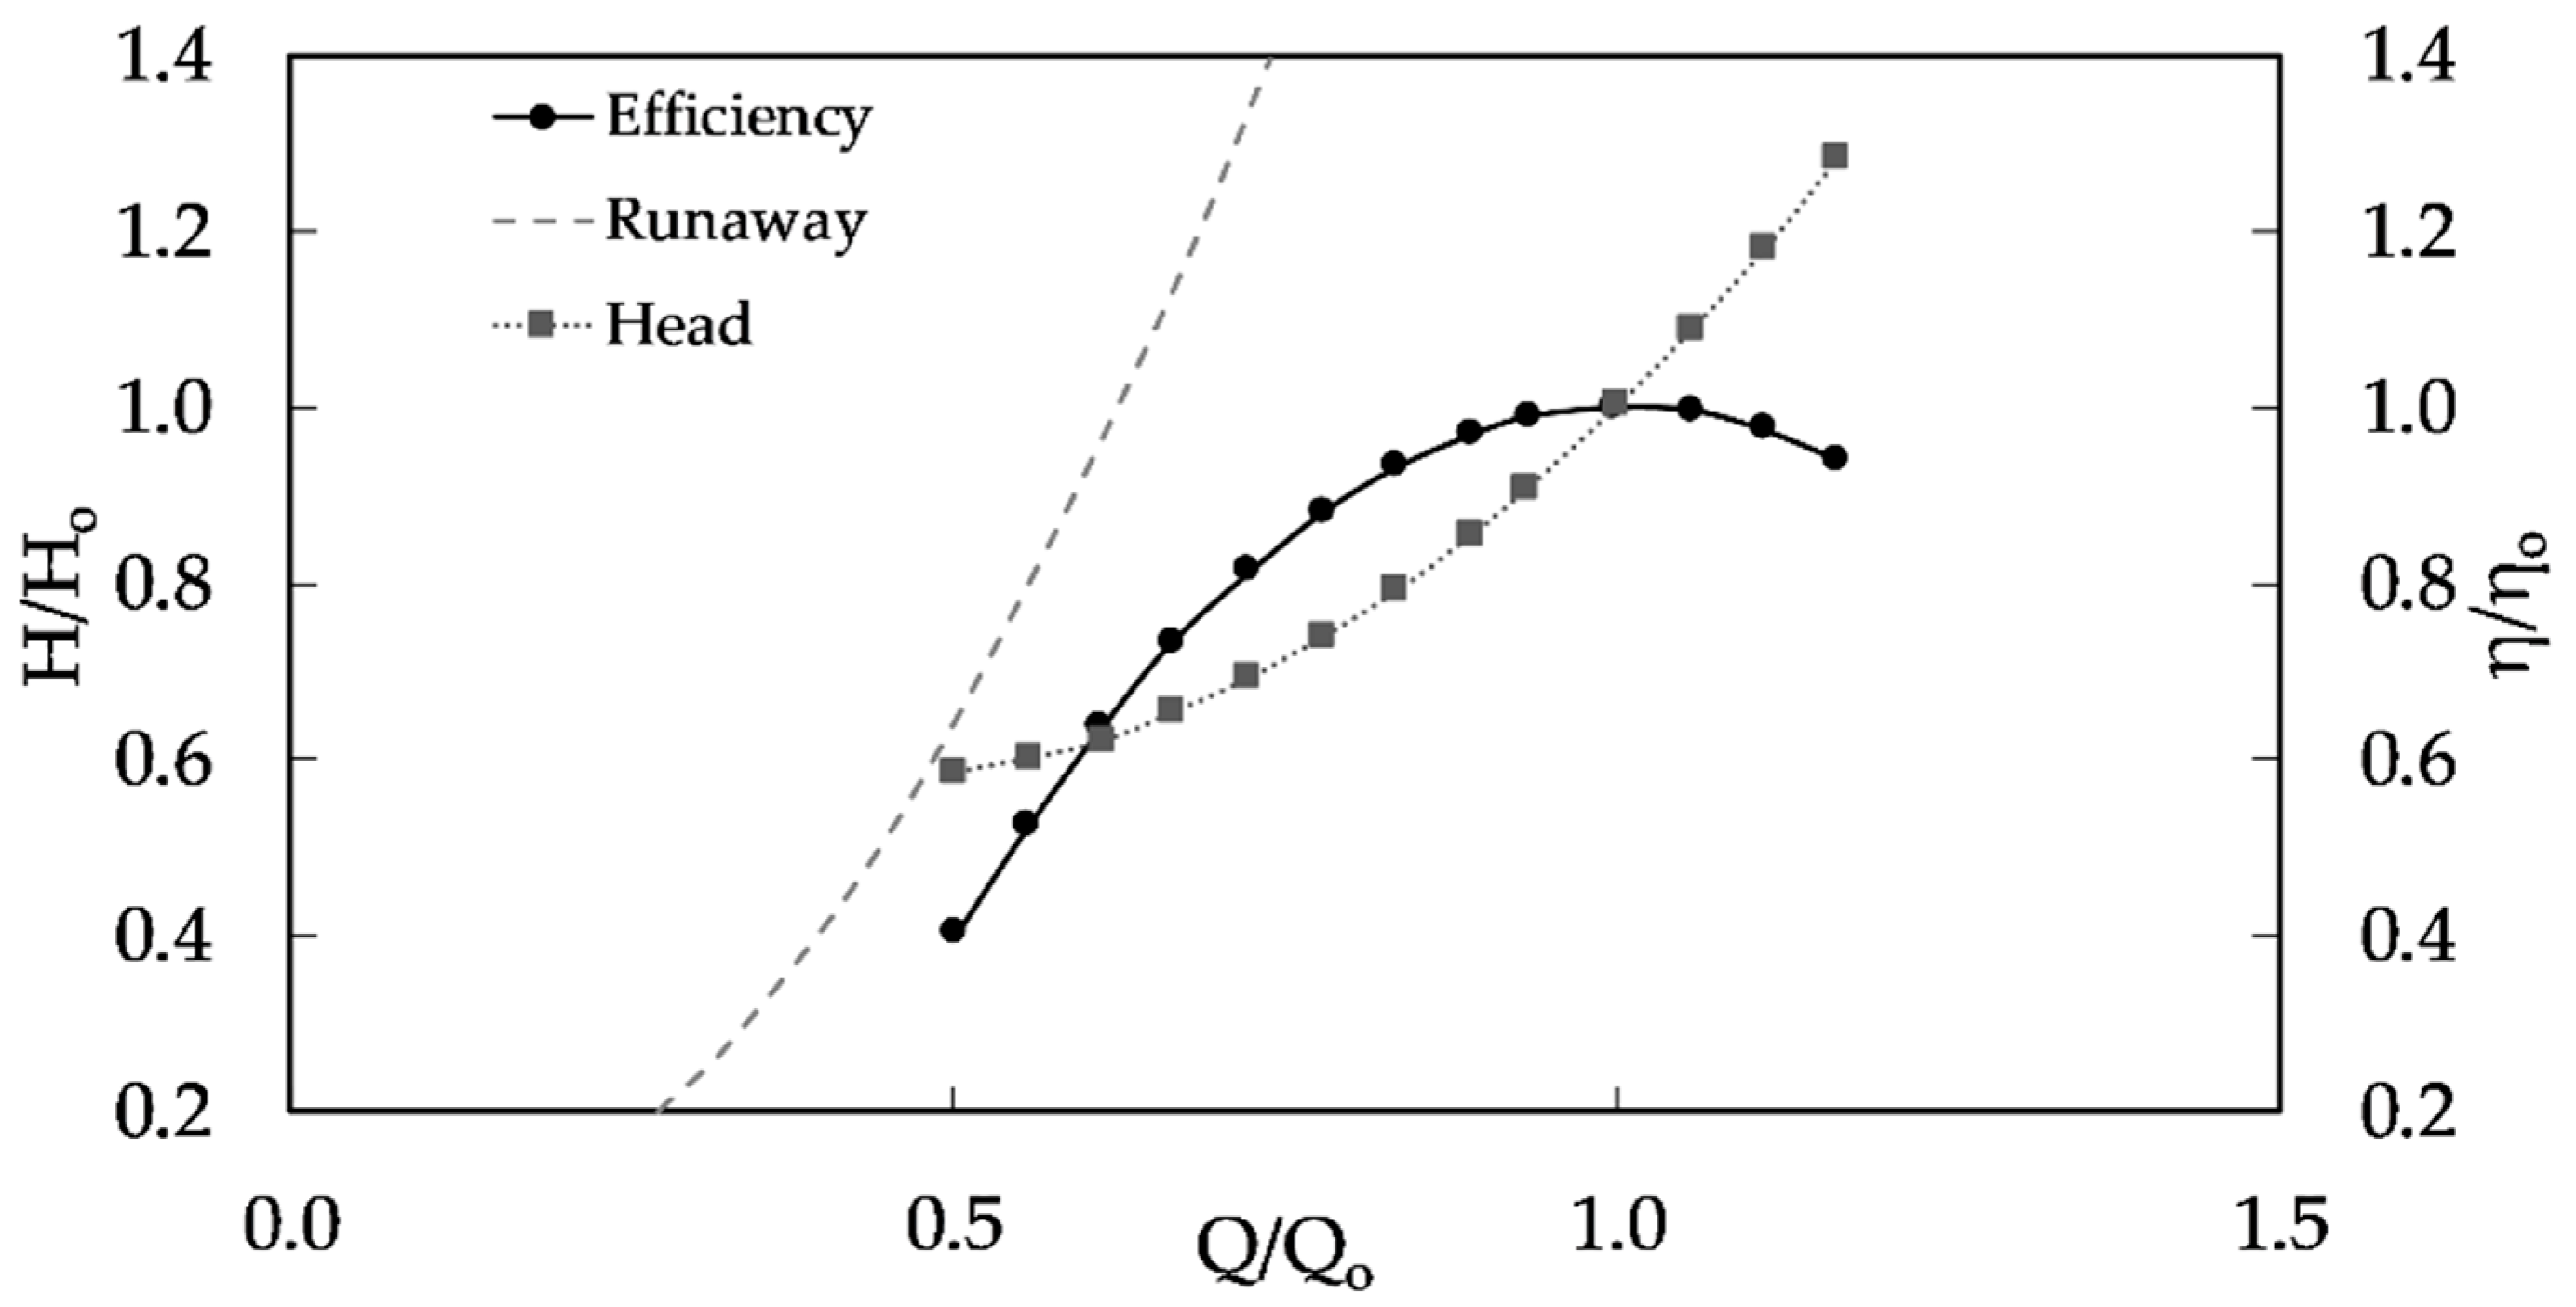
2.2. Pump as Turbine Curves

When a pump works in the turbine zone, the motor will operate as a generator. During pump operation, the discharge, Q , is a function of the rotating speed, n, and the pumping head, H , whereas the alteration of the speed will depend upon the torque of the motor, T .
For normal turbine operation, the rotating speed ( n ) and discharge ( Q ) were negatives and the head ( H ) and torque ( T ) were positives (Figure 4).
Based on pumps operating as turbines, the turbine characterization was developed by the following next steps: (i) different parameters must be defined based on an established database of synthetic PATs (a large number of different PATs) through characteristic curves that are shown in Figure 5 as well as changing the specific speed ( n s T ) defined according to Equation (3):
n s T = N R P R 1 / 2 H R 3 / 4 ( in m , k W )
where N R is the rated rotational speed in rpm, P R is the rated power in kW, H R is the rated head in m, since R means the rated conditions or the PAT design point for the best efficiency condition; (ii) when the specific speed is defined, n s T the values of head number ( ψ ) for each flow rate number ( φ ) can be estimated. When the specific speed was defined and the ns was not known, the values of head number ( ψ int ) and efficiency ( η int ) for each discharge number value ( φ int ) were estimated by linear interpolation. When the non-dimensional number was defined, for each diameter and rotational speed ( N ) the head and efficiency curves were determined by Equations (4)–(6):
Q = φ int N D 3
H = ψ int N 2 D 2 g
η = η int ( φ int )
Hence, the correspondent net head and flow rate for the turbine mode will be also influenced by the system curve of the hydraulic system as represented in Figure 5.

3. Methodology

This research used a hydraulic numerical simulation model of an energy recovery system to evaluate the conceptual idea of an IPSH solution and also to estimate the potential energy available in a WSS. This approach used an experimental apparatus of a pumping system to collect the required data of pressure, flow rate, efficiency and rotational speed of a pump for a certain controlling flow. These data were exploited to establish a numerical model using a WaterGEMS simulation tool and also to calibrate the model for different operating conditions. When the numerical model for the pumping system was validated to reproduce the measured data, it was upgraded by adding a by-pass branch to create the desired energy recovery system. The numerical results from the model were used to estimate the energy output of a possible energy recovery solution. This approach has been depicted in the current section by, first, discussing the experimental system and presenting measurement data. The experimental system is known as the base pumping system (BPS) since it is the base of the future energy recovery system. Then a discussion about the calibration of the numerical model will be provided. This section will be closed by introducing the energy recovery system known as inline pumped-storage hydropower (IPSH) through numerical modelling in a WaterGEMS environment.

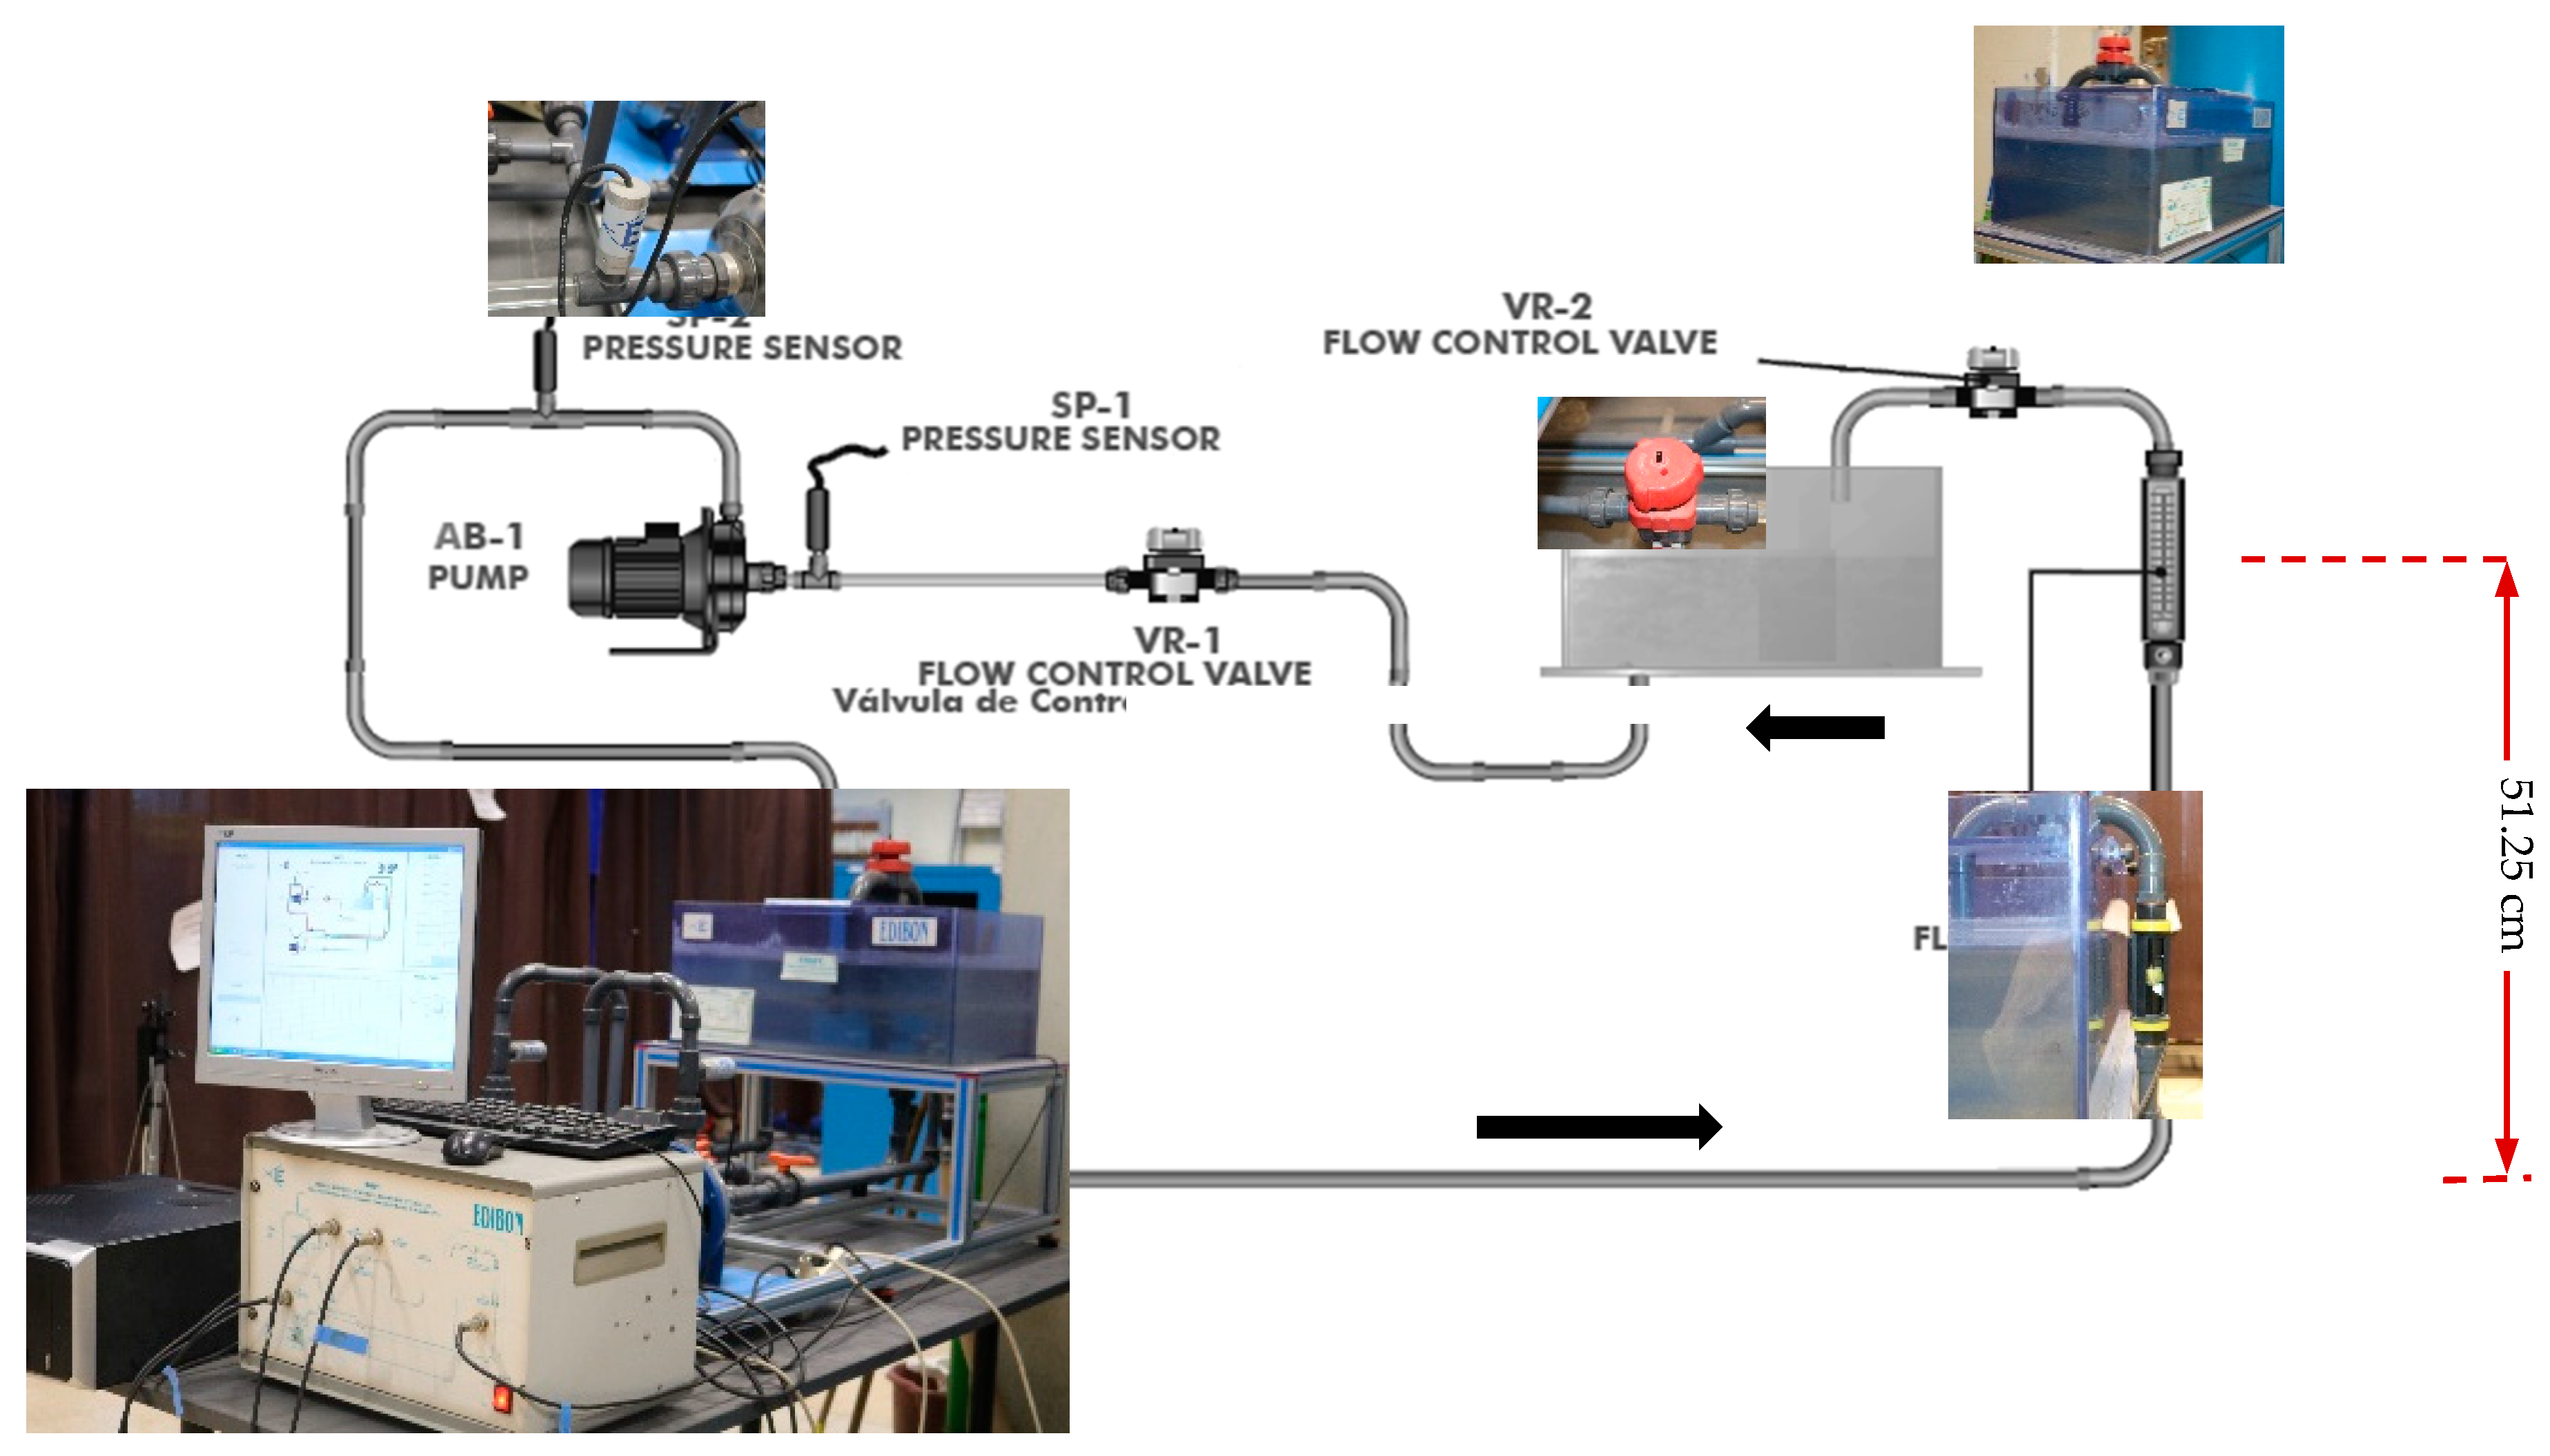
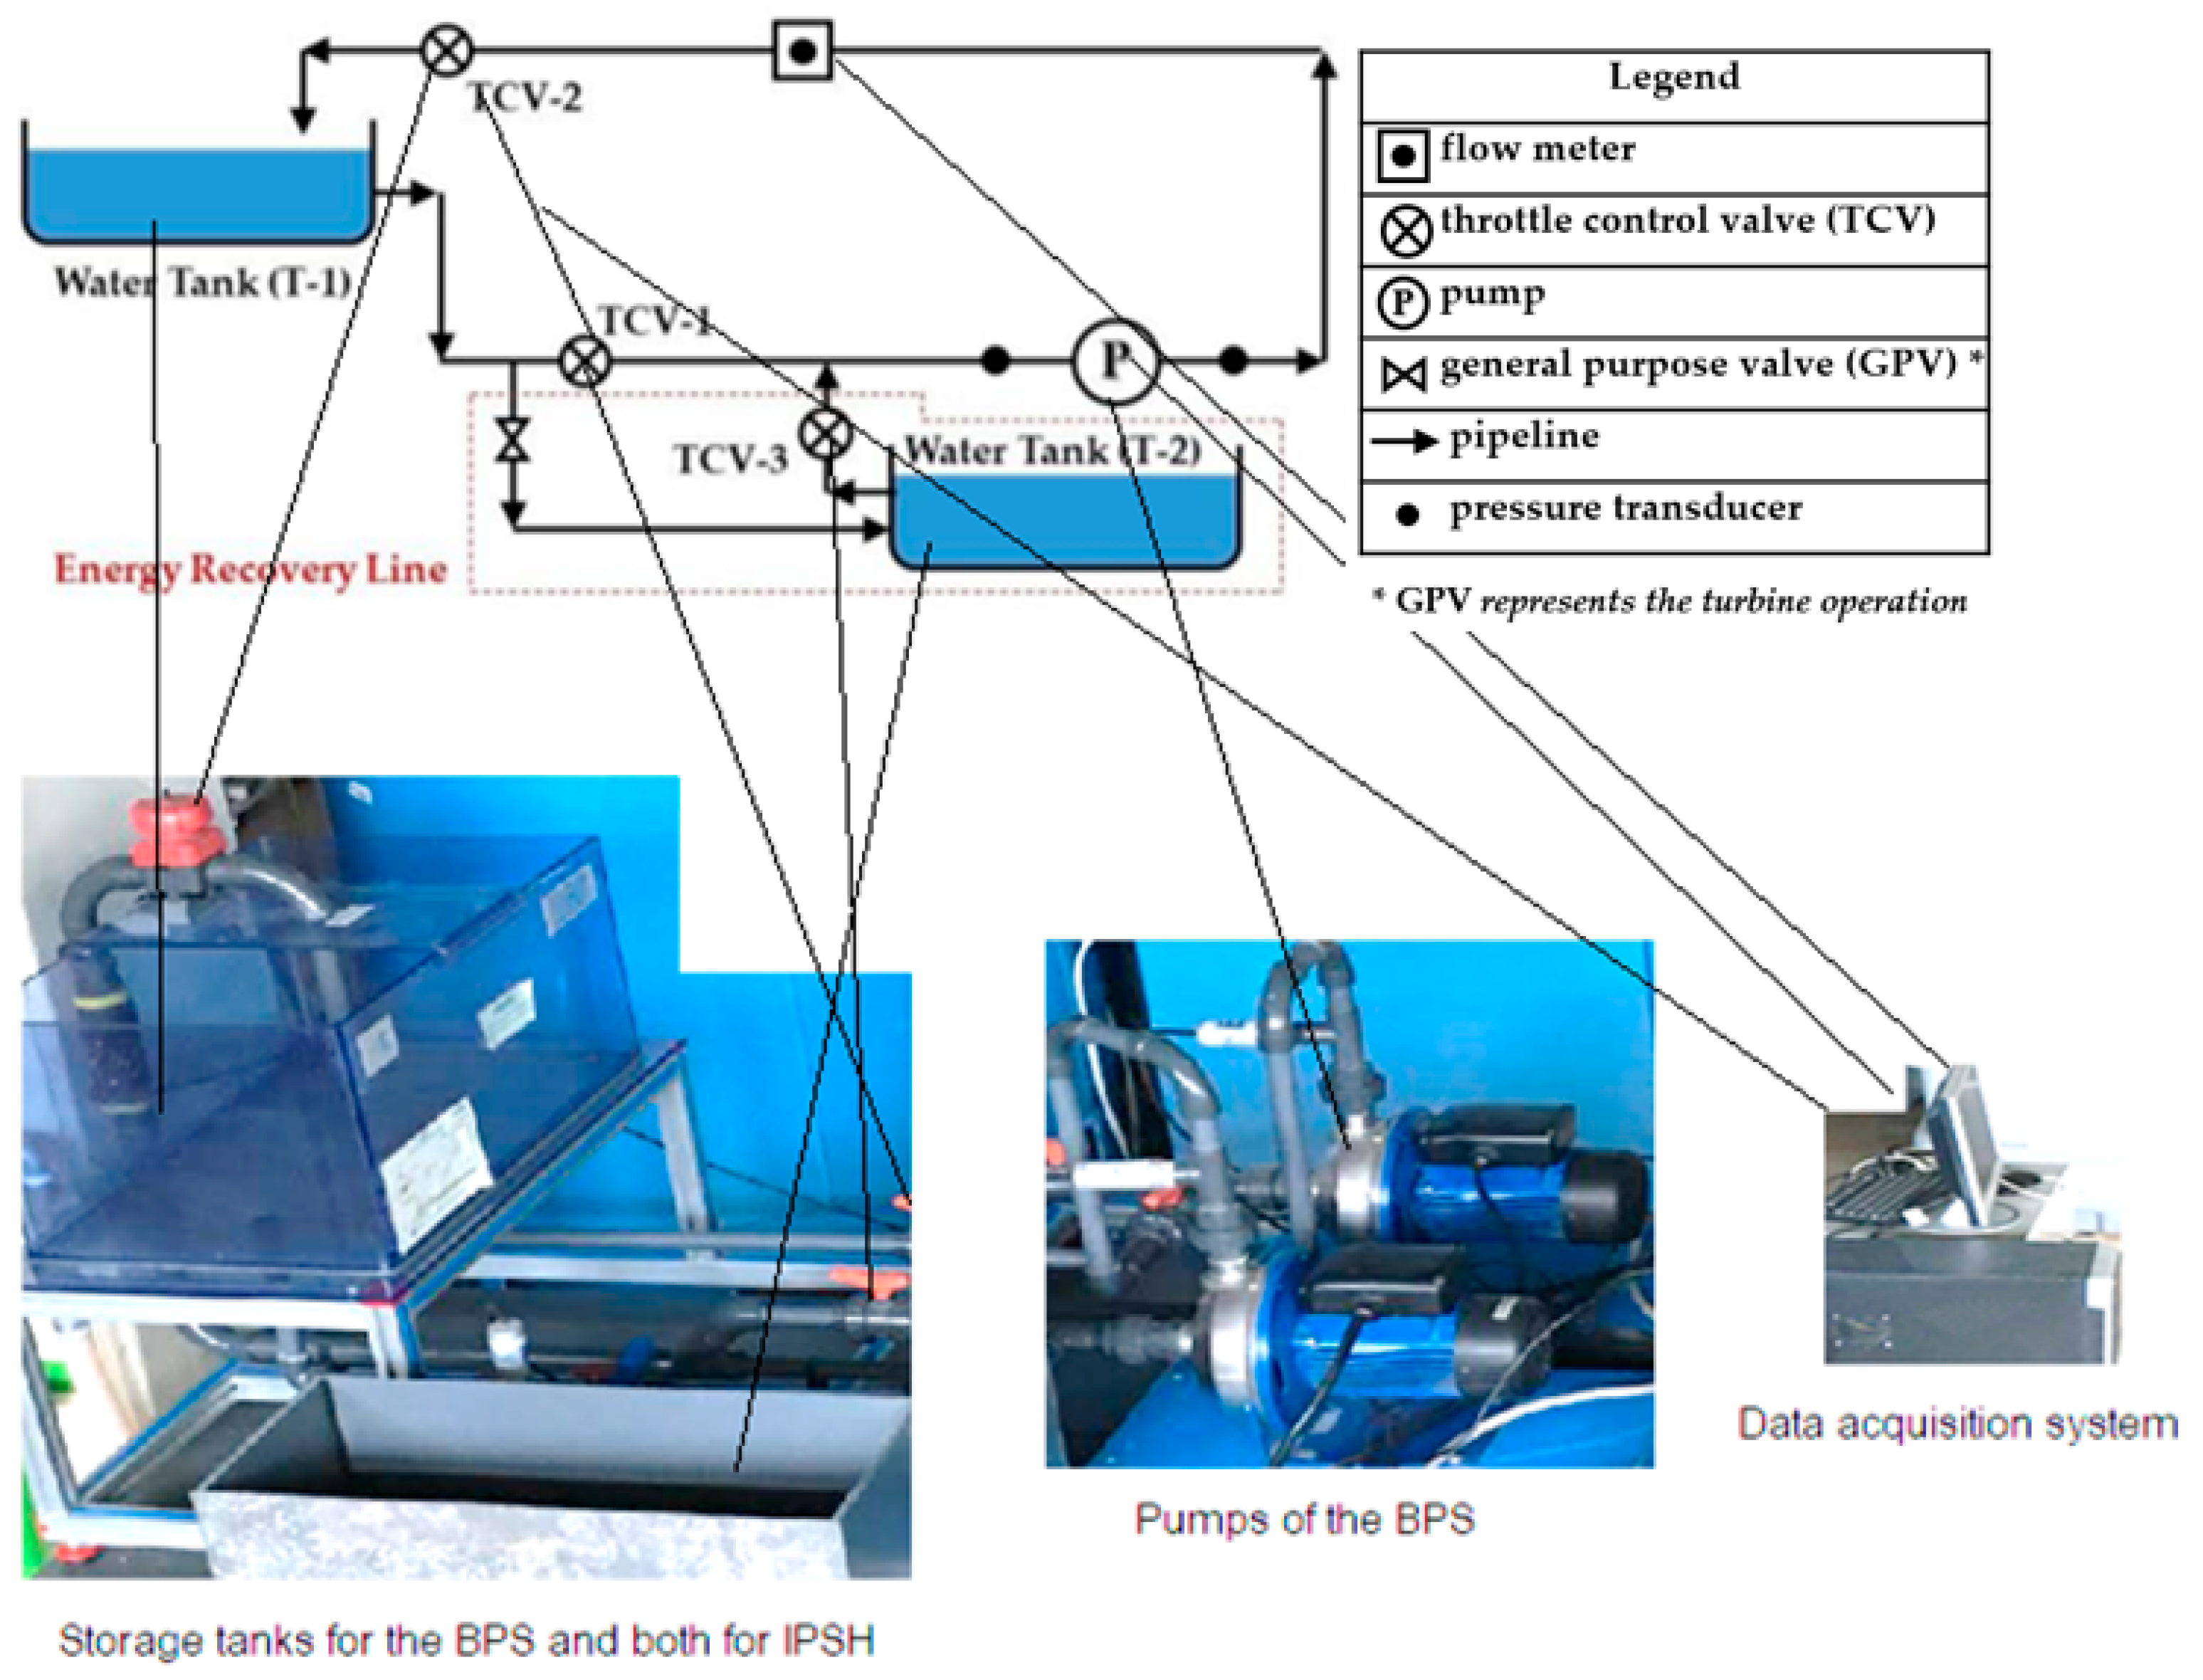
3.1. Base Pumping System (BPS) and Experimental Results

3.1.1. System Configuration

The experimental facility BPS is located at the laboratory of hydraulic (LH), Instituto Superior Técnico, Universidade de Lisboa and consists of several components (Figure 6): (a) a centrifugal pump that feeds the loop pipe system; (b) an interface control panel; (c) an electromagnetic flow meter to measure the instant flow (SC-1); (d) flow control valves along the pipe at the inlet and outlet of the pumps (VR-1 and VR-2); (e) pressure transducers (SP-1 and SP-2) to record the pressures; (f) a free-surface reservoir (water tank). Pipes are made of polyethylene with a diameter of 25 mm and a total length of 198 cm.
The measuring range of the mentioned sensors is presented in Table 1. A three-phase motor activated the pump, while the interface control panel provided the possibility of adjustment and measurement of the rotating speed and also the transmitted mechanic torque.
A free surface tank with a capacity of 85 dm3 existed at downstream of the operating system. A valve located at downstream made it possible to induce flow variations by maneuvering and applying local head loss of the valve. An electromagnetic flowmeter (SC-1) and two pressure transducers (SP-1 and SP-2) were used to record the flow rate and pressure data, respectively. Different tests were carried out for different conditions depending on the different opening percentages of the VR-2 valve and also the pump rotational speeds, as presented in Table 2. The data measurements included the flow rate ( Q ), head ( H ), rotational speed ( N ), pump upstream and downstream pressures, the efficiency of the pump ( η ) and hydraulic and mechanic powers P h and P M , respectively).

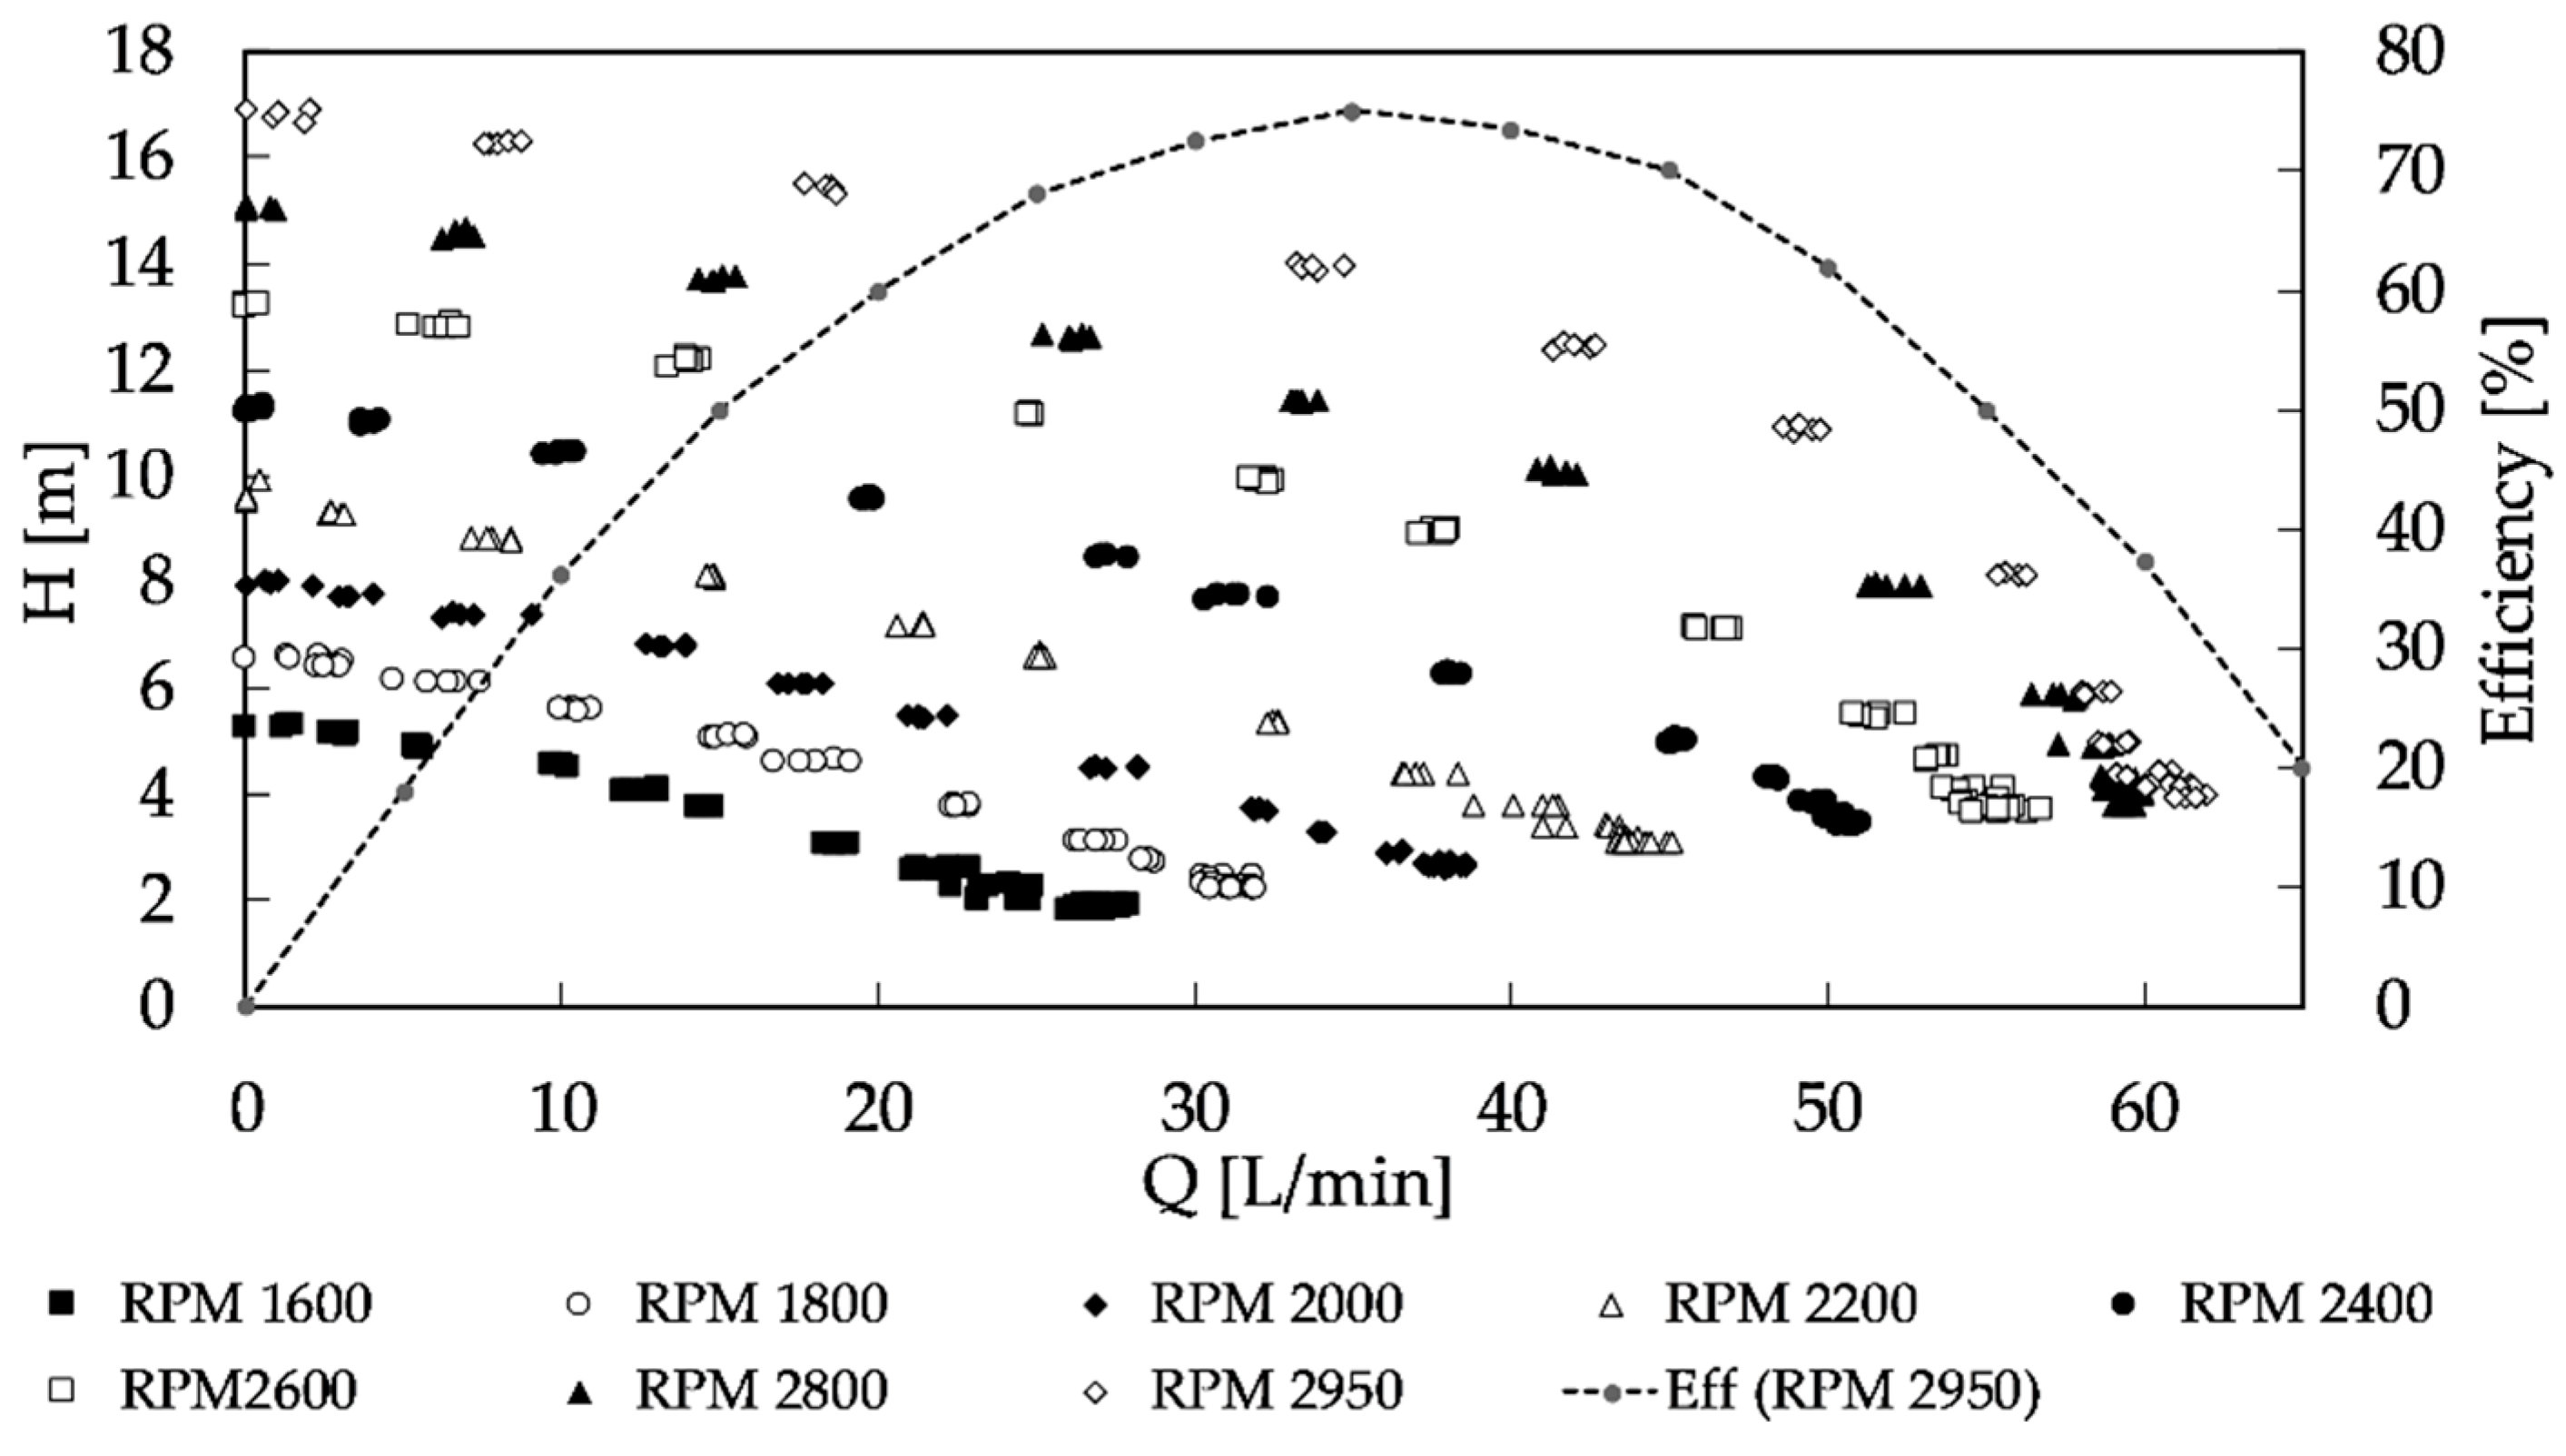
3.1.2. Experimental Results

During the pump operation, the flow rate was a function of the rotational speed and the pumping head [35]. The flow rate varied from zero, for a fully closed valve, to 61.98 L/min for a rotational speed of 2950 rpm, as shown in Figure 7. Additionally, the minimum and maximum measured heads were 1.8 and 16.92 m for rotational speeds of 1600 and 2950 rpm, respectively. Hence, Figure 7 presents characteristic curves for different rotational speeds, flow rate and head, covering the range of operation for the pumped storage system and efficiency variation for N = 2950 rpm.

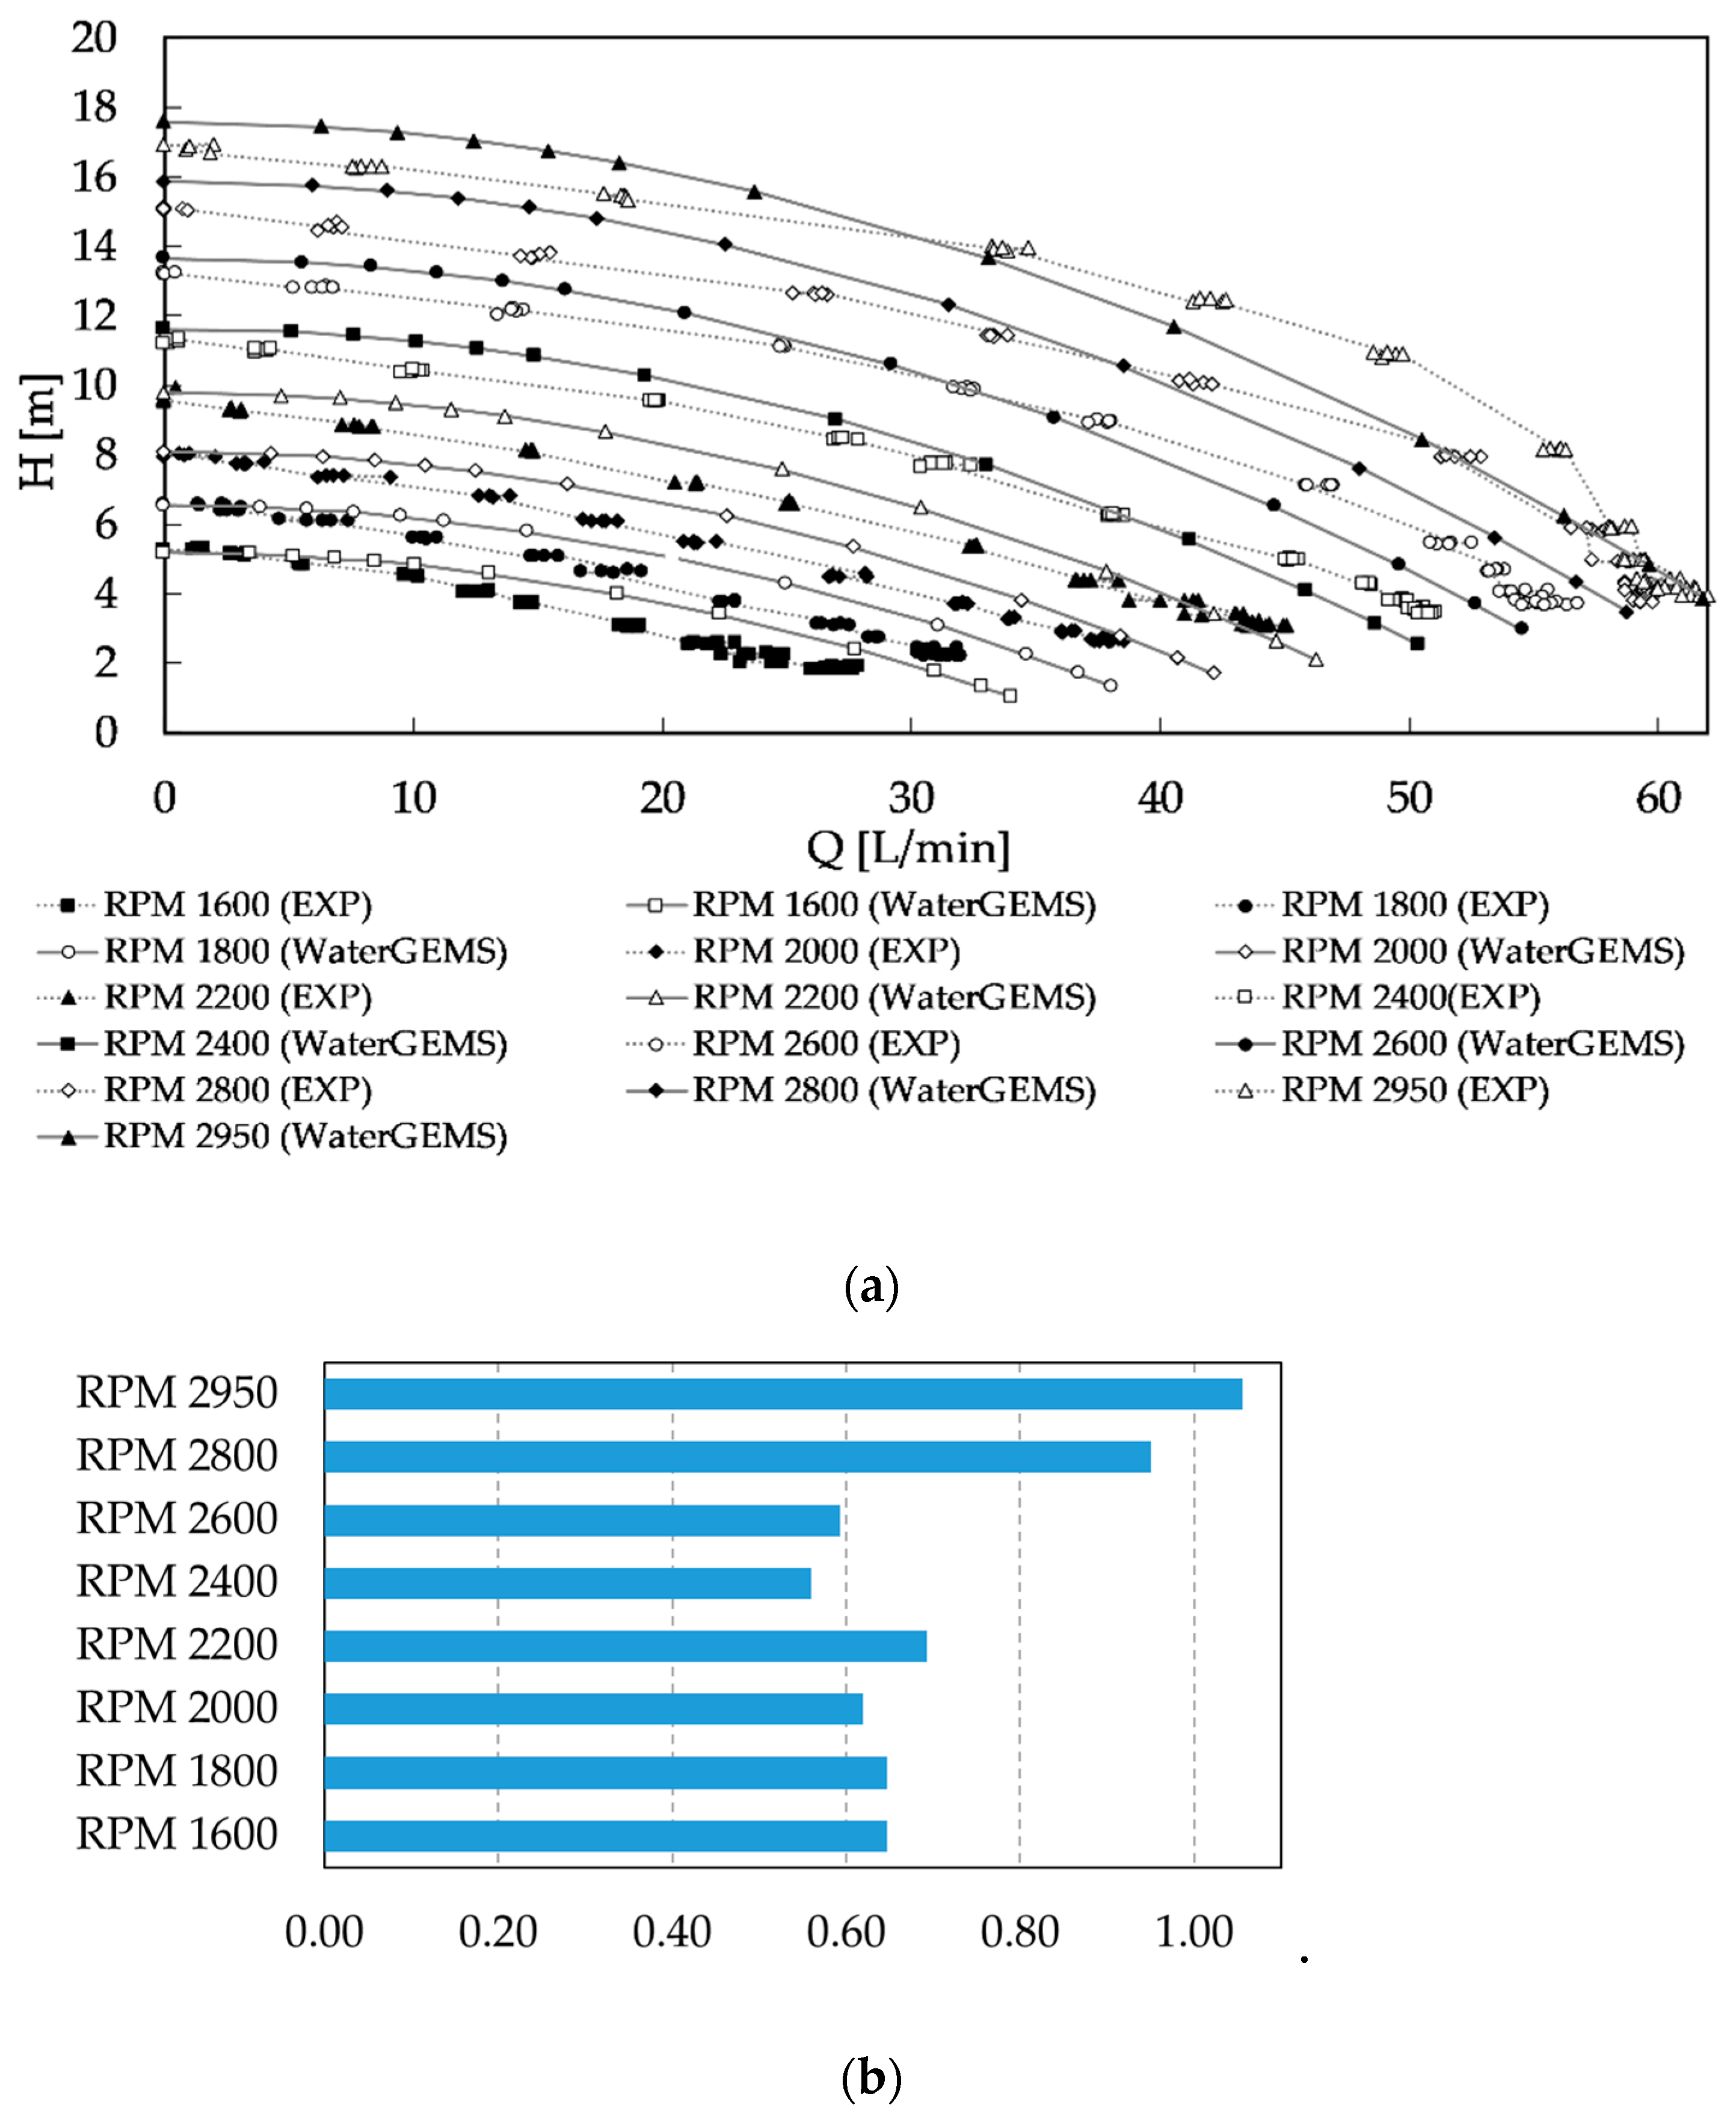
3.2. Model Calibration

To perform the system analyses, it was necessary to calibrate the numerical model based on the measured data. The WaterGEMS software from Bentley was used for numerical simulation providing an optimized simulation tool and a user-friendly environment for water distribution networks. WaterGEMS calculated the hydraulic head and pressure at every node along with the flow rate, the flow velocity and the head loss in each pipe branch and as well as the hydraulic head using the gradient algorithm based on the EPANET solver. The water system shown in Figure 8 was built by including one tank, one centrifugal pump and two flow control valves similar to the experimental setup. The experimental setup (shown in Figure 6) is called BPS (base pumping system) in this paper.
The calibration process involved the optimization of BPS parameters correspondent to actual measured conditions [35,36]. The BPS was calibrated considering the characteristic curves of the pump, for several pump rotational speeds and valve opening percentages (TCV-2).
Hence, in the simulation process, a variable speed pump (as a VSD) was introduced into WaterGEMS through proper pump curves. The rated pump characteristic curve was defined for the maximum rotational speed, i.e., 2950 rpm, and for each different rotational speed a relative speed factor (RSF) was defined as a coefficient of this maximum rotational speed. A throttle control valve was also defined to induce different flow rates into the system by the partial opening of the valve. In summary, each test was simulated by defining proper RSF and then changing opening flow percentages as in Table 2. This process was repeated for different RSFs until all the rotational speeds were simulated. During this simulation process, the valve discharge coefficients and other associated losses were optimized and calibrated. Results obtained from the simulation by WaterGEMS presented in Figure 9a show good relative accordance with the measured data, associated with scale effects, offering the root mean square errors (RMSEs) shown in Figure 9b with an average of around 0.72. The numerical model calibration based on experimental data guaranteed reliability to follow simulations that take place to assess the behavior of a new adaptation system for energy recovery.
A traditional pumping system is composed of different elements that correspond to energy consumption and head losses. However, interesting potential usually exists in pipe branches of pumping systems for energy recovery which can supply energy to treatment plants, electric data base measurement and control devices, and in general, reduce costs of energy in water networks.

3.3. Pumping System Operation

The best efficiency point ( Q R , H R , η R ) of the pump was characterized by a flow rate of 35 L/min, with a head of 13.5 m and an efficiency of 75% for the rotational speed of 2950 rpm and specific speed 10.05 (Table 3).
The characteristic curves in the dimensionless form (Figure 10) were constructed based on a rated condition associated with the best efficiency point. The dimensionless curves provided a tool to transfer information to other equivalent systems.
The best efficiency point of the pump was selected to present the head and efficiency variations with a flow rate, for the rated rotational speed of 2950 rpm, in Figure 11.

3.4. Inline Pumped-Storage Hydropower (IPSH)

In this stage, the numerical model was ready to be upgraded to an energy recovery system. The improvement was performed by adding a by-pass line, as shown in Figure 12. In order to examine the IPSH solution, a free surface tank (T-2) was installed in the by-pass branch that was added to the base pumping system (BPS) with the capacity of 0.032 m3. The by-pass line was equipped with a throttle control valve (TCV) working in an open or closed position to include or isolate the by-pass line. The T-2 was located at a lower elevation to generate a gravity flow from T-1 to T-2. The new IPSH system was considered as a loop system to use the previously assessed characteristics attained in the experimental loop system. It is worth mentioning that the idea is not limited to loop systems but can be adapted to a real system with direct flow condition. In a direct flow system, based on the available head at T-1 and downstream demand, the by-pass line can be activated to use the available head difference for energy generation. Hence, a turbine was considered in the by-pass line to generate energy from the gravity flow. Since WaterGEMS does not include a built-in turbine element, the general purpose valve (GPV) was used for this purpose by defining the flow-head loss curve correspondent to the turbine characteristic curves.
The numerical simulation was used to assess the main variations in the IPSH system. The characteristic curves in Figure 13 were used to adjust the flow rate in the main pipe branch by changing the rotational speed of the pump and the TCV-2 opening based on the flow rate in gravity by-pass line for energy recovery. The simulations were carried out for an extended period of 24 h. Two scenarios were considered, i.e., identical and variable flow rates in the pipe system. If the flow rates in different branches of the system were equal, it led to a steady flow regime resulting in a constant water level in T-1 and T-2 (Figure 13). In this case, a gravity flow rate of 29.11 L/min existed from T-1 to T-2. To maintain this flow rate in the main pipe, a pump rotational speed of 2600 rpm and a TCV-2 opening of 72.5% were found to be appropriate based on the experimental measurements. In other words, the characteristic curves gave the ability to accurately adjust the pump working condition and valve opening percentage in order to establish a flow rate equal to the gravity flow between T-1 and T-2. Based on that, the water levels in T-1 and T-2 for the identical flow rate scenario over 24 h remained constant, as 0.50 and 0.18 m, respectively.
In a water supply system, there was a pattern of flow demand along each 24 h. This pattern had a typical representation of each system characterization depending on the flow consumption used for water network design. Therefore, in this research, the same procedure was adopted since the flow pattern varied along the time, between rush consumption or peak hours to fewer consumptions, normally associated with the night period—the one which was also used for leak detection, since the level of consumption attained the minimum. Hence, a suitable design project for this extended period of 24 h represents a more granted solution to face flow and water level variations, head losses, leakages occurrence associated with high pressure values, along the hydraulic system and machine operation adaptation, which fit both results as the operating point. This is a complex issue that requires an extended period and is typically used in the design of water systems. Under some operating conditions, the flow rate in different branches can be variable and unequal. Then, to evaluate this scenario, a flow rate pattern of 24 h was adapted, based on a typical demand configuration, as presented in Figure 14a. A TCV-2 valve closure pattern was then calibrated to induce the desired flow rate in the hydraulic system (Figure 14b).
Despite the previous case of having a balance of flow rate in the whole system and constant water levels in tanks, the water level in both tanks changed with time, as shown in Figure 15. The water level variations in T-1 and T-2 were correlated, decreasing in T-1, in turbine mode and increasing in T-2, in pump mode, in a controlled optimized way between the maximum and minimum limits for tank water levels (Figure 15).
The operating curve of the GPV valve (acting as a turbine) was calculated with the available gross head and total head losses to obtain the net head of the turbine, as presented in the dimensionless graph of Figure 13. Equation (7) was used to calculate turbine power:
P = γ Q H η
where P is the power, γ is the specific weight of the water, Q is the flow rate, H is the turbine head and η is the efficiency. Equation (7) was exploited to calculate the power for two different mentioned scenarios of constant and variable flow rates, as presented in Figure 16. The energy production of the system for a fixed flow rate of 35 L/min was 1.24 kWh, while the variable scenario led to 1.81 kWh daily energy production.

4. Dimensional Analysis and Discussion

Experimental tests are used to predict the performance of a real device including the behavior under different operating conditions. In this case, the model was evaluated on a laboratory scale, and then the results were simulated for real conditions. The similarity theory requires principles of geometric, kinetic and dynamic parities between a model and a prototype. These affinity laws in different categories can be attained by expressing shape, size, velocity component and acting forces [37]. In this study, the scales of velocity and flow rate were calculated based on the Froude criterion, as analyzed in [38], from the length scale ( λ L ) using the following equations:
λ L = L mod L p r o
Flow rate scale :   Q = V . A λ Q = λ V . λ L 2 λ Q = λ L 5 / 2 ,
Velocity scale :   V mod V p r o = V mod ( g L mod ) 1 / 2 = V p r o ( g L p r o ) 1 / 2 V mod V p r o = ( g L mod ) 1 / 2 ( g L p r o ) 1 / 2 λ V = λ L 1 / 2 .
Classic similarity laws for pumps and turbines with the same impeller diameter state that the discharge is proportional to the rotational speed, while the head is proportional to the squared rotational speed as Equation (1). Then based on [39,40], the correlation between pump and turbine mode was proved to be:
n S T   ( in   m ,   m 3 / s ) = 0.8793 n S P
Q T Q P = 1.3595 N T N P
To evaluate the results of the model in a technical approach, for a loop system where QT = QP the length scales of 20 and 50 were considered. Additionally, for geometrically similar impellers operating at the same specific speed, the affinity laws are as follows:
N mod N p r o = ( H mod H p r o ) 1 / 2 D p r o D mod = ( H mod H p r o ) 3 / 4 ( Q p r o Q mod ) 1 / 2 = ( P p r o P mod ) 1 / 2 ( H mod H p r o ) 5 / 4
or separating by specific flow, head and power:
Q p r o Q mod = ( N p r o N mod ) ( D p r o D mod ) 3 H p r o H mod = ( N p r o N mod ) 2 ( D p r o D mod ) 2 P p r o P mod = ( N p r o N mod ) 3 ( D p r o D mod ) 5
The results are presented in Table 4. The power of the model was 0.052 kW but, by upscaling, it grew to values of 1532 and 41,657 kW, for scales of 20 and 50, respectively.

5. Conclusions

In a base pumping system (BPS), the characteristic curves in pump and turbine modes were defined and analyzed in order to obtain the best operating conditions in water networks. The research study included experimental analyses, hydraulic simulations and optimized conditions to better define the best operating point. The experimental results were exploited to calibrate a numerical hydraulic simulator model in the WaterGEMS environment, which uses optimization in searching for the best operating conditions. This numerical model was then used to evaluate a smart conceptual energy recovery solution of an inline pumped-storage hydropower (IPSH) system. The characteristic parameters (i.e., flow rate, velocity, impeller diameter, rotational speed, head and power) of this novel model were calculated to provide a background for the energy estimation. As a result, the following main conclusions can be pointed out:
  • Characteristic curves of turbomachines in pump and turbine mode were defined for the best selection which conducts the best energy solution, avoiding eventual induced operating instabilities.
  • An inline pumped-storage hydropower (IPSH) solution was defined and adapted from a base pumping system (BPS) in some existing water infrastructures of small to large scales, while not requiring significant changes and investments based on a by-pass and a lower tank upstream the pumping station.
  • The energy generation using the gravitational flow appears to be an economic advantage in the definition of the energy recovery solution, as demonstrated through the achieved power.
  • Depending on the type of demand (i.e., a constant flow between tanks or a variable demand pattern with water level compensation), the application shows a smart pressure and flow control in an energy recovery solution, replacing classical flow control valves.
  • Based on similarity laws for the hydraulic system and the turbomachinery between pumps and turbines, a scaling-up approach for larger hydro energy converters was developed showing promising results.
  • The smart approach based on a controlled recovery energy solution, which would be dissipated and the increasing of the system flexibility by a new bottom tank allowing two types of flow conditions (i.e., pump and turbine modes), can significantly improve the energy efficiency in the water sector, allowing us to better face the associated existent energy costs (e.g., pumping, treatment plants, water leakage, expansion and reparation of infrastructures and water bill for costumers).

Author Contributions

Conceptualization—H.M.R.; Methodology and formal analysis—H.M.R., A.D., M.B.; Writing, review & editing—H.M.R., A.D., M.B. and K.A.; Data collection and validation—A.D. and M.B.; Supervision—H.M.R. and K.A.; Funding acquisition—H.M.R. and K.A. All authors have read and agreed to the published version of the manuscript.

Funding

This work was supported by funding from REDAWN European project (www.redawn.eu).

Acknowledgments

The authors would like to thank CERIS (Civil Engineering, Research, and Innovation for Sustainability) Centre from Instituto Superior Técnico, Universidade de Lisboa, Portugal for providing the experimental facilities and also the European project REDAWN (Reducing Energy Dependency in Atlantic Area Water Networks) EAPA_198/2016 from the INTERREG ATLANTIC AREA PROGRAMME 2014–2020 for the grants support.

Conflicts of Interest

The authors declare no conflict of interest.

Nomenclature

Symbols
Dturbomachinery diameter [m]
Hhead [m]
Llength [m]
n rotational speed [rpm]
n s p specific speed of the pump
n s T specific speed of the turbine
Ppower [kW]
Qflow rate [L/min] or [m3/s]
ttime [s]
Vflow velocity [m/s]
Indices
hhydraulic
intinterpolated value
modmodel
Mmechanical
proprototype
Rrated or best efficiency point
Trelated to turbine
Greek letters
γ specific weight [N/m3]
η efficiency
ψ head number
φ flow rate number
Abbreviations
BPSbase pumping system
IPSHinline pumped-storage hydropower
MHPmicro-hydropower
PATpump as turbine
WDNwater distribution network
WSSwater supply system

References

  1. UN General Assembly. Transforming Our World: The 2030 Agenda for Sustainable Development. 21 October 2015. A/RES/70/1. Available online: refworld.org/docid/57b6e3e44.html (accessed on 14 February 2020).
  2. IEA (International Energy Agency). Renewables: Market Analysis and Forecast from 2019 to 2024, Paris. 2019. Available online: iea.org/reports/renewables-2019 (accessed on 13 February 2020).
  3. Ramos, J.S.; Ramos, H.M. Solar powered pumps to supply water for rural or isolated zones: A case study. Energy Sustain. Dev. 2009, 13, 151–158. [Google Scholar] [CrossRef]
  4. Ramos, J.S.; Ramos, H.M. Sustainable application of renewable sources in water pumping systems: Optimised energy system configuration. Energy Policy 2009, 37, 633–643. [Google Scholar] [CrossRef]
  5. Hoes, O.A.C.; Meijer, L.J.J.; Van der Ent, R.J.; Van de Giesen, N.C. Systematic high-resolution assessment of global hydropower potential. PLoS ONE 2017, 12. [Google Scholar] [CrossRef]
  6. Dadfar, A.; Besharat, M.; Ramos, H.M. Storage ponds application for flood control, hydropower generation and water supply. Int. Rev. Civ. Eng. 2019, 10. [Google Scholar] [CrossRef]
  7. Kougias, I.; Aggidis, G.; Avellan, F.; Deniz, S.; Lundin, U.; Moro, A.; Muntean, S.; Novara, D.; Pérez-Díaz, J.I.; Quaranta, E.; et al. Analysis of emerging technologies in the hydropower sector. Renew. Sustain. Energy Rev. 2019, 113. [Google Scholar] [CrossRef]
  8. Besharat, M.; Dadfar, A.; Viseu, M.T.; Brunone, B.; Ramos, H.M. Transient-flow induced compressed air energy storage (TI-CAES) system towards new energy concept. Water 2020, 12, 601. [Google Scholar] [CrossRef] [Green Version]
  9. Ramos, H.M.; Zilhao, M.; López-Jiménez, P.A.; Pérez-Sánchez, M. Sustainable water-energy nexus in the optimization of the BBC golf-course using renewable energies. Urban Water J. 2019, 16, 215–224. [Google Scholar] [CrossRef]
  10. Samora, I.; Hasmatuchi, V.; Münch-Allign, C.; Franca, M.J.; Schleiss, A.J.; Ramos, H.M. Experimental characterization of a five blade tubular propeller turbine for pipe inline installation. Renew. Energy 2016, 95, 36–366. [Google Scholar] [CrossRef]
  11. Carravetta, A.; Fecarotta, O.; Ramos, H.M.; Mello, M.; Rodriguez-Diaz, J.A.; Morillo, J.G.; Kemi Adeyeye, K.; Coughlan, P.; Gallagher, J.; McNabola, A. Reducing the Energy Dependency of Water Networks in Irrigation, Public Drinking Water, and Process Industry: REDAWN Project. Proceedings 2018, 2, 681. [Google Scholar] [CrossRef] [Green Version]
  12. Samora, I.; Manso, P.; Franca, M.J.; Schleiss, A.J.; Ramos, H.M. Energy Recovery Using Micro-Hydropower Technology in Water Supply Systems: The Case Study of the City of Fribourg. Water 2016, 8, 344. [Google Scholar] [CrossRef] [Green Version]
  13. Fecarotta, O.; Aricò, C.; Carravetta, A.; Martino, R.; Ramos, H.M. Hydropower Potential in Water Distribution Networks: Pressure Control by PATs. Water Resour. Manag. 2014, 29, 699–714. [Google Scholar] [CrossRef]
  14. Gallagher, J.; Harris, I.M.; Packwood, A.J.; McNabola, A.; Williams, A.P. Strategic assessment of energy recovery sites in the water industry for UK and Ireland: Setting technical and economic constraints through spatial mapping. Renew. Energy 2015, 81, 808–815. [Google Scholar] [CrossRef]
  15. Qian, Z.; Wang, F.; Guo, Z.; Lu, J. Performance evaluation of an axial-flow pump with adjustable guide vanes in turbine mode. Renew. Energy 2016, 99, 1146–1152. [Google Scholar] [CrossRef]
  16. Carravetta, A.; Derakhshan Houreh, S.; Ramos, H.M. Pumps as Turbines; Springer Tracts in Mechanical Engineering; Springer: Cham, Switzerland, 2018. [Google Scholar]
  17. Vieira, F.; Helena, M.; Ramos, H.M. Optimization of operational planning for wind/hydro hybrid water supply systems. Renew. Energy 2009, 34, 928–936. [Google Scholar] [CrossRef]
  18. Pérez-Sánchez, M.; Sánchez-Romero, F.J.; Ramos, H.M.; López-Jiménez, P.A. Energy Recovery in Existing Water Networks: Towards Greater Sustainability. Water 2017, 9, 97. [Google Scholar] [CrossRef] [Green Version]
  19. Fontana, N.; Giugni, M.; Glielmo, L.; Marini, G.; Raffaele, Z. Use of hydraulically operated PRVs for pressure regulation and power generation in water distribution networks. J. Water Resour. Plann. Manag. 2020, 146. [Google Scholar] [CrossRef]
  20. Postacchini, M.; Darvini, G.; Finizio, F.; Pelagalli, L.; Soldini, L.; Di Giuseppe, E. Hydropower Generation Through Pump as Turbine: Experimental Study and Potential Application to Small-Scale WDN. Water 2020, 12, 958. [Google Scholar] [CrossRef] [Green Version]
  21. Carravetta, A.; Del Giudice, G.; Fecarotta, O.; Ramos, H.M. PAT Design Strategy for Energy Recovery in Water Distribution Networks by Electrical Regulation. Energies 2013, 6, 411–424. [Google Scholar] [CrossRef] [Green Version]
  22. Fontana, N.; Giugni, M.; Glielmo, L.; Marini, G.; Verrilli, F. Real time control of a PRV in water distribution networks for pressure regulation: Theoretical framework and laboratory experiments. J. Water Resour. Plann. Manag. 2018, 144. [Google Scholar] [CrossRef]
  23. Creaco, E.; Campisano, A.; Fontana, N.; Marini, G.; Page, P.R.; Walski, T. Real time control of water distribution networks: A state-of-the-art review. Water Res. 2019, 161. [Google Scholar] [CrossRef]
  24. Puleo, V.; Fontanazza, C.M.; Notaro, V.; De Marchis, M.; Freni, G.; La Loggia, G. Pumps as turbines (PATs) in water distribution networks affected by intermittent service. J. Hydroinform. 2013. [Google Scholar] [CrossRef] [Green Version]
  25. Alberizzi, J.C.; Renzi, M.; Righetti, M.; Pisaturo, G.R.; Rossi, M. Speed and Pressure Controls of Pumps-as-Turbines Installed in Branch of Water-Distribution Network Subjected to Highly Variable Flow Rates. Energies 2019, 12, 4738. [Google Scholar] [CrossRef] [Green Version]
  26. Chacón, M.C.; Rodríguez Díaz, J.A.; Morillo, J.G.; McNabola, A. Hydropower energy recovery in irrigation networks: Validation of a methodology for flow prediction and pump as turbine selection. Renew. Energy 2020, 147, 1728–1738. [Google Scholar] [CrossRef]
  27. Pérez-Sánchez, M.; Sánchez-Romero, F.J.; López-Jiménez, P.A.; Ramos, H.M. PATs selection towards sustainability in irrigation networks: Simulated annealing as a water management tool. Renew. Energy 2018, 116, 234–249. [Google Scholar] [CrossRef]
  28. Morillo, J.G.; McNabola, A.; Camacho, E.; Montesinos, P.; Rodríguez Díaz, J.A. Hydro-power energy recovery in pressurized irrigation networks: A case study of an Irrigation District in the South of Spain. Agric. Water Manag. 2018, 204, 17–27. [Google Scholar] [CrossRef]
  29. Pérez-Sánchez, M.; Sánchez-Romero, F.J.; Ramos, H.M.; López-Jiménez, P.A. Modeling Irrigation Networks for the Quantification of Potential Energy Recovering: A Case Study. Water 2016, 8, 234. [Google Scholar] [CrossRef] [Green Version]
  30. Pérez-Sánchez, M.; Sánchez-Romero, A.J.; Ramos, H.M.; López-Jiménez, P.A. Optimization Strategy for Improving the Energy Efficiency of Irrigation Systems by Micro Hydropower: Practical Application. Water 2017, 9, 799. [Google Scholar] [CrossRef] [Green Version]
  31. Besharat, M.; Tarinejad, R.; Aalami, M.T.; Ramos, H.M. Study of a compressed air vessel for controlling the pressure surge in water networks: CFD and experimental analysis. Water Resour. Manag. 2016, 30, 2687–2702. [Google Scholar] [CrossRef]
  32. Pottie, D.L.F.; Ferreira, R.A.M.; Maia, T.A.C.; Porto, M.P. An alternative sequence of operation for Pumped-Hydro Compressed Air Energy Storage (PH-CAES) systems. Energy 2019. [Google Scholar] [CrossRef]
  33. Odukomaiya, A.; Abu-Heiba, A.; Graham, S.; Momen, A.M. Experimental and analytical evaluation of a hydro-pneumatic compressed-air Ground-Level Integrated Diverse Energy Storage (GLIDES) system. Appl. Energy 2018, 221, 75–85. [Google Scholar] [CrossRef] [Green Version]
  34. Ramos, H.; Borga, A. Pumps as turbines: An unconventional solution to energy production. Urban Water 1999, 1, 261–263. [Google Scholar] [CrossRef]
  35. Ramos, H.; Borga, A. Pumps yielding power. Dam Eng. Water Power Dam Constr. 2000, 10, 197–217. [Google Scholar]
  36. Fontanella, S.; Fecarotta, O.; Molino, B.; Cozzolino, L.; Della Morte, R. A Performance Prediction Model for Pumps as Turbines (PATs). Water 2020, 12, 1175. [Google Scholar] [CrossRef] [Green Version]
  37. Chaker, M.A.; Triki, A. Investigating the branching redesign strategy for surge control in pressurized steel piping systems. Int. J. Pres. Ves. Pip. 2020, 180, 104044. [Google Scholar] [CrossRef]
  38. Kapelan, Z. Calibration of Water Distribution System Hydraulic Models. Ph.D. Thesis, University of Exeter, Exeter, UK, 2010. [Google Scholar]
  39. Wylie, E.; Streeter, V.; Suo, L.F. Fluid Transient in Systems; Prentice-Hall: Englewood, NJ, USA, 1993. [Google Scholar]
  40. Ramos, H.M. Simulação e Controlo de Transitórios Hidráulicos em Pequenos Aproveitamentos Hidroelétricos. Ph.D. Thesis, Civil Engineering, Instituto Superior Técnico, Universidade de Lisboa, Lisboa, Portugal, 1995. (In Portuguese). [Google Scholar]
Figure 1. Typical pump characteristic curves: head, efficiency, NPSH and power curves.
Water 12 02224 g001
Figure 2. Representation of a single and parallel pump curves.
Water 12 02224 g002
Figure 3. Different pumps and system curves for different head losses.
Water 12 02224 g003
Figure 4. Pump operation zone in the third quadrant and characteristic parameters [34].
Water 12 02224 g004
Figure 5. Pump as turbine (PAT) characteristic curves for different specific speed values, based on experimental tests and affinity laws (adapted from [25]): (a) efficiency curves; (b) head curves.
Water 12 02224 g005
Figure 6. Experimental facility at Instituto Superior Técnico (IST) lab.
Water 12 02224 g006
Figure 7. Characteristic curves obtained from the experimental tests.
Water 12 02224 g007
Figure 8. Scheme of the base pumping system (BPS) in the mathematical model and experimental apparatus.
Water 12 02224 g008
Figure 9. Comparison of experimental and numerical results for the BPS; (a) head and flow rate; (b) root mean square error (RMSE).
Water 12 02224 g009
Figure 10. Dimensionless pump characteristic curves for different rotational speeds.
Water 12 02224 g010
Figure 11. Dimensionless pump curves for the rotational speed of 2950 rpm.
Water 12 02224 g011
Figure 12. Scheme and visualization of the experimental set-up of the inline pumped-storage hydro (IPSH) solution.
Water 12 02224 g012
Figure 13. Dimensionless turbine characteristic curves based on numerical simulations.
Water 12 02224 g013
Figure 14. A real system pattern: (a) flow rate pattern; (b) valve closure pattern.
Water 12 02224 g014
Figure 15. The water level in T-1 and T-2 based on the variable demand pattern.
Water 12 02224 g015
Figure 16. Power in the fixed and variable demand patterns.
Water 12 02224 g016
Table 1. Measuring range of test parameters.
ParametersMeasuring Range
Pump head [m]1.8 to 16.92
Flowmeter Rate [L/min]0 to 61.98
Rotational speed of the pump [rpm]1600 to 2950
Opening valve VR2 [%]0 to 100
Table 2. Experimental tests specifications.
Variable ParametersTested Values
VR-2 closure percentage [%]4.16, 6.25, 8.33, 10.41, 12.5, 16.66, 25, 33.33, 50, 66.60, 83.33, 100
Pump rotational speed, N [rpm]1600, 1800, 2000, 2200, 2400, 2600, 2800, 2950
Table 3. Best efficiency point in the pumping system.
ParameterValue
Flow rate [L/min]35
Head [m]13.5
Efficiency [%]75
Rotational speed [rpm]2950
Specific speed (Equation (2))10.05
Table 4. Scale-up parameters for a hydraulic system and turbomachine affinity characteristic parameters with n s T (in m, m3/s) = 8.8.
Parameter UnitHydraulic SystemTurbine ImpellerTurbine Affinity Laws
QVDNTHTPT
[m3/s][m/s][mm][rpm][m][kW]
Model0.60 × 10−30.9925217010.640.052
1/201.044.425004702001532
1/5010.316.99125029850341,657

