1. Introduction
The term meta-evaluation is introduced by Scriven 1969 [
1] and is defined as any evaluation of an evaluation, evaluation system or evaluation device. According to Mathison 2005 [
2], meta-evaluation is a tool applied for aggregating findings from a series of evaluations.
The indexing approach has been applied by many researchers for the evaluation of groundwater quality [
3,
4,
5,
6,
7,
8]. Water Quality Indices (WQIs) are mathematical approaches to classify water quality. Although many studies have been performed on assessing groundwater quality by applying Water Quality Indices, only a limited number of studies has been found contributing to the comparison of their performance [
9,
10,
11,
12]. Modern methods which apply supervised machine learning algorithms for the prediction of WQIs values were also suggested [
13].
The meta-evaluation of WQIs is a crucial issue for several reasons, as follows: (a) the obvious one arises because water users and social development depend on the quantity and quality of water resources; (b) it is an essential matter for policymakers and stakeholders because it helps to develop management strategies for controlling deterioration of water quality; (c) it is involved in many other applied indices of evaluation such as the sustainable development goals, as introduced by Agenda 2030 [
14].
Traditionally, evaluations of water quality have sought to answer the questions, “Is this water suitable for human consumption and irrigation purposes?”, and “Is this water body classified into good chemical status?”. Advancing this discussion to “Is the evaluation approach suitable for the questions as mentioned above?” requires characterizing and analyzing vast amounts of data and their methods of analysis. Stakeholders need meta-evaluations of WQIs to assist them to improve their evaluations. Water users need meta-evaluations to avoid accepting invalid evaluative findings of water quality, water distribution and water-related services.
Groundwater resources play a vital role in the Mediterranean region and have become critical for drinking and economic sectors. Due to agricultural practices and associated anthropogenic activities in cultivated areas of Mediterranean countries, their groundwater resources are prone to major and trace element contamination. Nowadays, groundwater contamination is a sensitive case in many countries since it is directly related to water usage, food safety and human health. Evaluation of water quality is of great importance in the management of water supplies [
15]. Water quality is considered as a severely limiting factor to public health and economic development.
The determination of aquifers’ chemical status is a crucial element for the implementation of both 2000/60/EC Water Framework Directive (WFD) [
16] and Groundwater Directive 2006/118/EC (GWD) [
17], as adopted by the Hellenic Republic [
18]. The monitoring of groundwater under the WFD framework, requires the classification of a system in terms of its quality into one class, like “good” and “poor”. The WFD only provides general guidance to evaluate a groundwater system based on physicochemical parameters; at the same time, the GWD sets out specific provisions for the protection of groundwater against pollution and deterioration and reported that the Member States would establish threshold values for all contaminants and indicators of contamination.
Many regions worldwide suffer from deterioration of water quality mainly caused by (a) the geological processes [
5,
7,
19]; (b) the application of agrochemicals [
3,
20]; (c) the weathering of bedrocks and minerals [
21,
22]; (d) overexploitation [
23,
24]; and (e) mining and industrial activities [
22,
24,
25,
26].
The present study delineates an approach for the evaluation of WQIs using popular statistical tools. The objectives are (a) to evaluate two widely applied WQIs into groundwater resources; (b) to provide a comparative investigation of the applied WQIs by testing their performance; and (c) to propose a meta-evaluation approach for WQIs applied into groundwater resources.
While, until now, limited studies of comparative assessment of groundwater quality by WQIs have been performed worldwide, the emphasis is placed on the comparative assessment of surface water bodies. The explanation for the placed emphasis on surface water bodies is that rivers and streams are considered as the surface water bodies most vulnerable to contamination. Furthermore, Lumb et al., 2011 [
27] reported that the WQIs are largely developed for surface water. Previous studies on the application of WQIs in the area studied are non-existent. The previous assessments of water quality in the study area have been conducted by Gamvroula 2013 [
28] and Gamvroula et al., 2013 [
26], only by comparing the values of water quality parameters with criteria given by the literature.
Although the application of WQIs in groundwater resources is well established for the evaluation of groundwater quality [
3,
4,
5,
6,
7,
8,
9,
10,
12,
25] according to the author’s knowledge, no comprehensive work was dedicated to the meta-evaluation of WQIs which are applied into groundwater resources. There is no simple procedure to test the performance of WQIs or, in other words, to perform their meta-evaluation. The main scope of the applied meta-evaluation methodology is to provide an evaluation approach of two widely used WQIs and suggestions for selecting one or both of them for application in EU groundwater quality assessment.
2. Materials and Methods
Canadian Council of Ministers of Environment Water Quality Index (CCME-WQI) [
29,
30] and the National Sanitation Foundation Water Quality Index (NSF-WQI) [
31,
32] were selected for evaluation. The CCME-WQI is determined based on the selection of appropriate water quality parameters to produce a single number that varies between 0 and 100, with 100 denoting “excellent” quality [
29,
30]. According to the score, the CCME-WQI classifies the water quality status into five categories as follows: “excellent”, “good”, “fair”, “marginal” and “poor”. A spreadsheet which contains all the required equations for users to calculate the score of CCME-WQI has been developed by CCME and is freely available. The NSF-WQI is calculated based on selecting water quality parameters and producing a score which also ranges from 0 to 100, with 100 indicating “excellent” quality [
31,
32]. Based on the value, the NSF-WQI categorizes the quality of the water body into five classes as follows: “ excellent”, “ good”, “medium”, “bad” and “very bad” [
31,
32]. A very illustrative presentation of the structure, aggregation formula, and reported number of variables in CCME and NSF-WQI is reported by Alexakis et al., 2016 [
15], and Kachroud et al., 2019 [
8].
The Groundwater Directive 2006/118/EC-Threshold Values (GWD-TV) approach is a methodology proposed to evaluate the chemical status of the body of groundwater in relation to the application of 2006/118/EC [
17,
18]; it was used as a reference methodology for comparison. According to GWD-TV, the chemical status of a body of groundwater can be classified as “good” and “poor”. Threshold values (TV) for the contaminants and indicators of contamination in accordance with the procedure set out in Part A of Annex II of Groundwater Directive (GWD) 2006/118/EC established by the Hellenic Republic were applied in this study [
18].
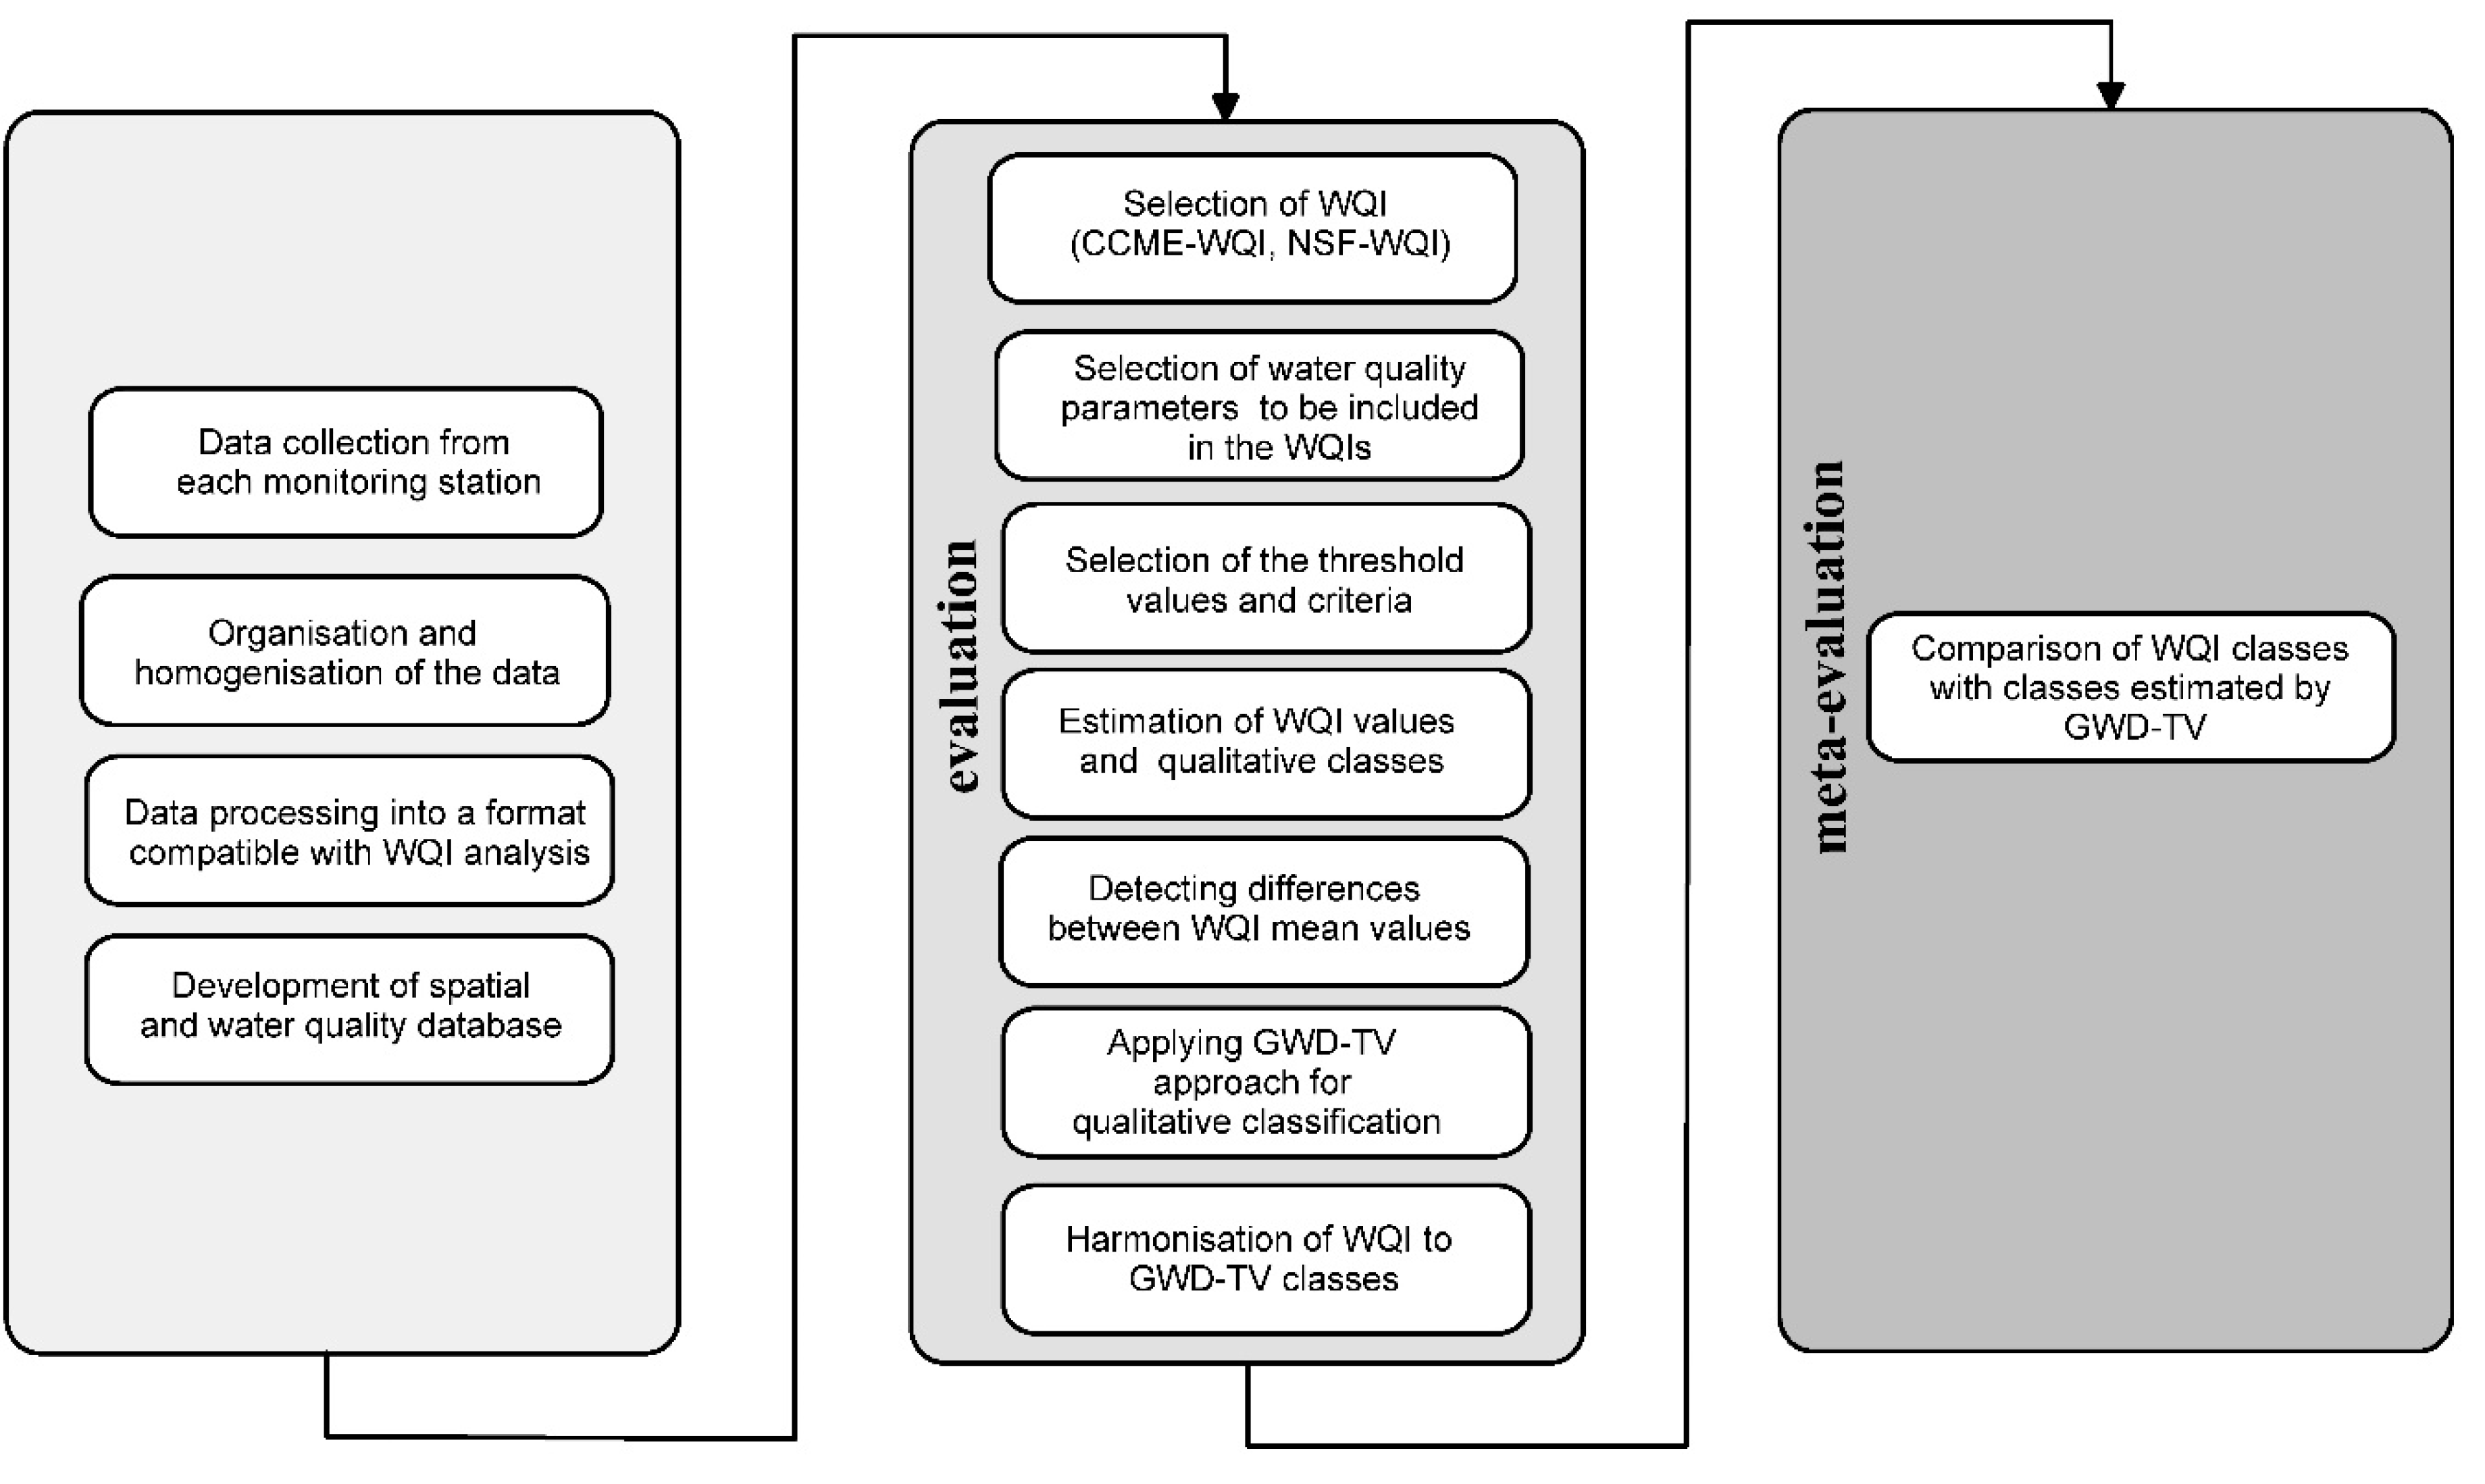
The central concept in developing a meta-evaluation method consists of using the qualitative classification of WQIs to test their performance, instead of using the WQIs value. However, there is not a widely accepted reference value of WQI for testing their performance which is conducted by comparing the WQI classification to the classification derived by GWD-TV approach [
17,
18]. The applied methodology in this study is illustrated in
Figure 1.
3. The Case Study
3.1. Regional and Hydrogeological Setting
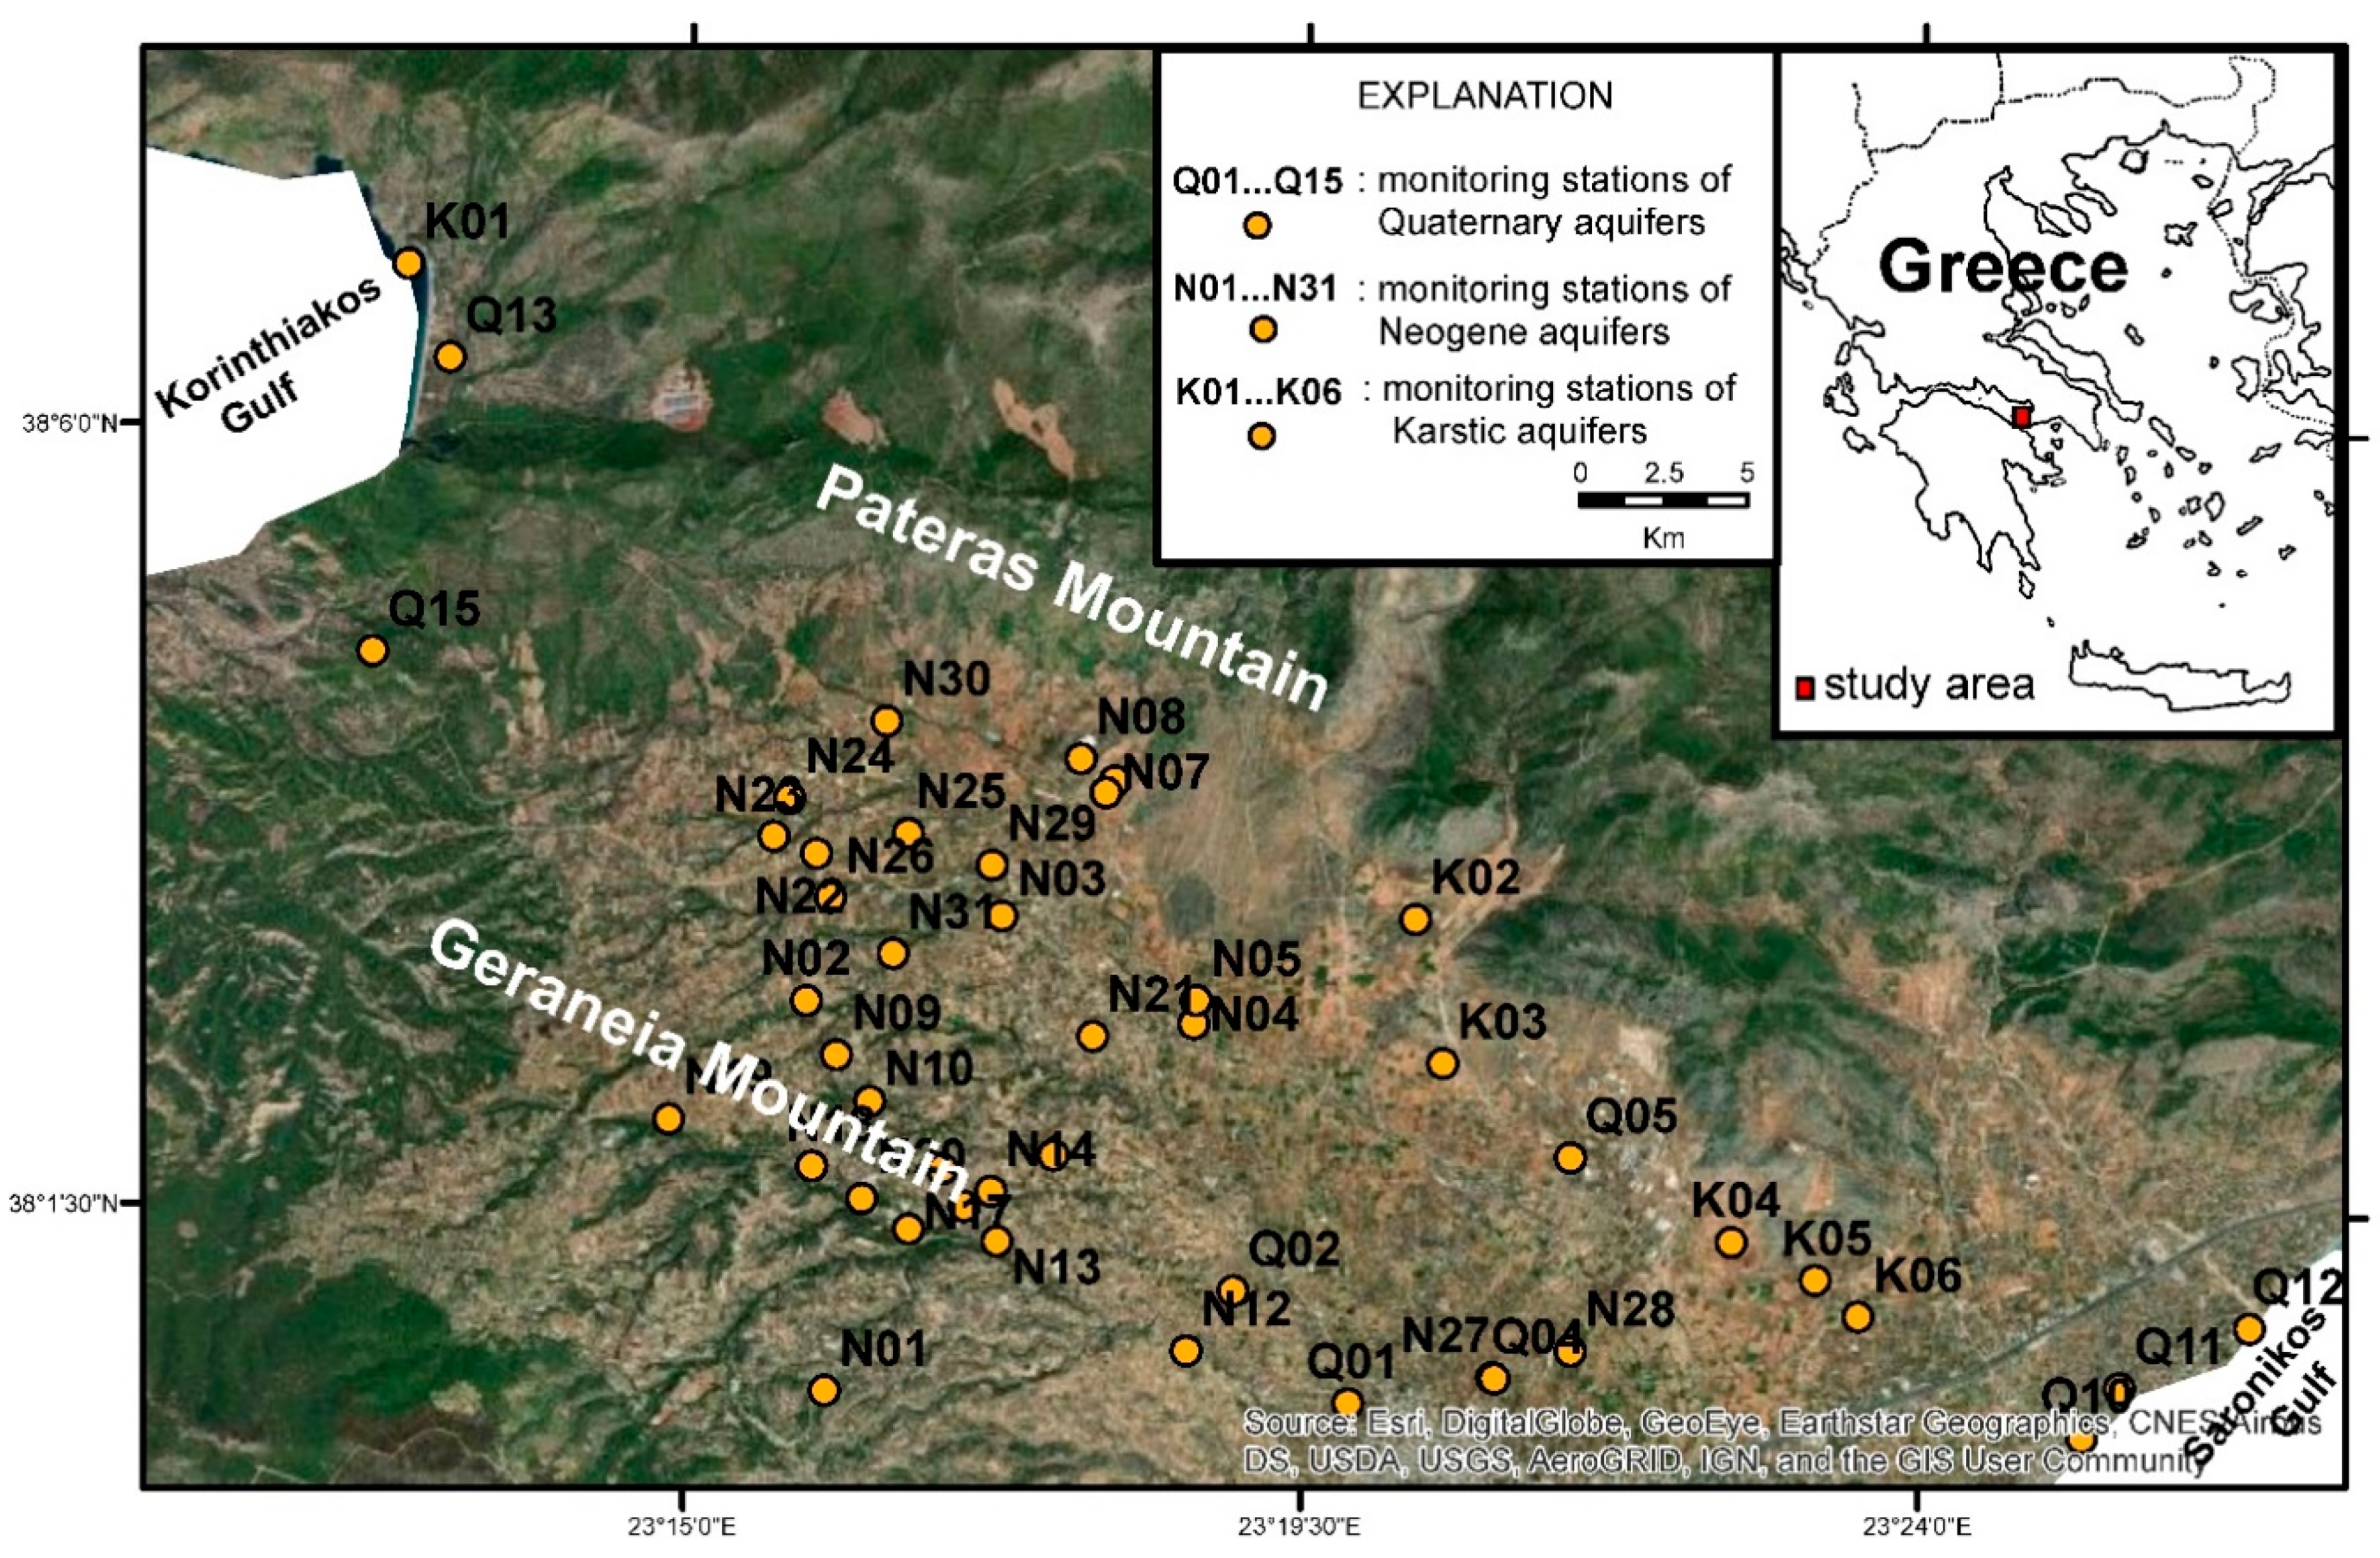
A basin which is among the most productive agricultural areas in Greece is selected for the application of the proposed methodology (
Figure 2).
Figure 2 presents world imagery modified from Google Earth [
33] and the geographical location of the area studied with the distribution of groundwater monitoring stations.
The updated Köppen-Geiger climate classification is adopted for this study [
34]. The climate of the area studied belongs to the Csa type which is Temperate-Dry-Hot Summer climate, where the temperature of the hottest month is above 10 °C, the average temperature of the coldest month varies between 0 and 8 °C, and at least one month’s average temperature is above 22 °C [
34]. The precipitation of the driest month in summer is below 40 mm and is less than the 33% of the precipitation in the wettest month of winter [
34]. It should be reported that the hydrological year in Temperate climate type consists of a wet (October through March) and a dry (April to September) period.
The study area is located in Megara basin and lies within the coordinates of 37°57′ N to 38°08′ N latitudes and 23°16′ E to 23°27′ E longitudes. It extends from the Geraneia Mountain (highest summit 1351 m) in the west to the Pateras Mountain (highest summit 1132 m) in the east. Korinthiakos and Saronikos Gulf bordered the study area north-western and south coastlines, respectively (
Figure 2). A complex hydrographic network which includes three major streams originated mostly in slopes of Geraneia Mountain which fed the Megara basin with surface water.
The geology of Megara basin consists of crystalline basement rocks, alpine basement rocks and post alpine sediments [
26,
35,
36,
37]. The crystalline basement rocks include the oldest rocks (Permian–U.Carboniferous) in the area: argillaceous shales, lenses of limestones, sandstones, bodies of igneous rocks and tuffites [
35,
36,
37]. These rocks are mainly impermeable rocks which control the groundwater flow regionally. The alpine basement rocks consist of cherts, sandstones and schists (L.–M.Triassic age), karstified limestones and dolomites (M.–U.Triassic–L.Jurassic age), limestones, marbles, dolomites and cipolins (M.–U.Triassic age), limestones of L.–M.Jurassic age, schist-chert formation (M.–U.Jurassic age) containing Mn-layers and bauxites [
35,
36,
37]. The limestones and dolomite rocks show high permeability due to their intense karstification and fracture porosity, allowing groundwater to be stored and migrate over long distances. These rock formations constitute the most important aquifer of the study area-the Karstic aquifer. The infiltration water of karstic aquifer moves laterally to the surrounding Neogene and Quaternary deposits [
26]. The post-alpine sediments consist mainly of Neogene and lignite bearing deposits, marly limestones, sandy marls, organic material, lignite intercalations, marly formations with manganese oxides and ultrabasic rock fragments. Neogene deposits consist of permeable and impermeable layers or lenses—the Neogene aquifer. The Quaternary deposits consist mainly of alterations of clays, loams and conglomerates [
37]. Quaternary deposits constitute an aquifer which presents low hydraulic characteristics—the Quaternary aquifer.
3.2. Primary Data, Determinations and Data Treatment
This study uses all the available water quality data (52 monitoring stations × 2 sampling periods × 15 water quality parameters) systematically collected of the study area during the regional hydrogeochemical study, as conducted by Gamvroula 2013 [
28] and Gamvroula et al., 2013 [
26]. A one-hydrological-year sampling campaign (wet and dry period) was performed at the area studied. Groundwater monitoring stations were distributed over an area of about 250 km
2. The locations of monitoring stations were recorded using a geographical positioning system (Spectra Precision GPS with an Ashtech Global Navigation Satellite System Receiver; Trimble, Spectra, Westminster, USA). Geological maps, literature sources and relevant databases were employed in order to build the spatial and water quality databases. The groundwater monitoring network (
n = 52) was designed in the study area for representative sampling of the aquifers: (a) the shallow alluvial aquifer of Quaternary deposits which shows low hydraulic characteristics (
n = 15); (b) the deep aquifer hosted in permeable layers of Neogene deposits (
n = 31); and (c) the deep aquifer hosted in intensively karstified carbonate formations that constitute the most important aquifer of the area studied (
n = 6).
The dataset of groundwater quality parameters was categorised into six sub-datasets: (a) Quaternary aquifer-Wet period; (b) Quaternary aquifer-Dry period; (c) Neogene aquifer-Wet period; (d) Neogene aquifer-Dry period; (e) Karstic aquifer-Wet period; and (f) Karstic aquifer-Dry period.
Dissolved oxygen (DO), electrical conductivity (CND) and hydrogen ion concentration (pH) were determined in the field at the time of sample collection with YSI Professional Plus portable meter. Water samples were stored into 1000-mL high-density polypropylene bottles, which were rinsed several times prior to sample storage. Each water sample was then divided into two water subsamples: (a) the first set of subsamples was filtered on-site by a 0.22-μm disposable syringe filter, acidified to pH < 2 with ultrapure HNO3, then stored in a 100-mL bottle and transported to the laboratory for cadmium (Cd), chromium (Cr), copper (Cu), lead (Pb), manganese (Mn), nickel (Ni) analysis by inductively coupled plasma mass spectrometry (ICP-MS; model 7700 MassHunter, Agilent, Santa Clara, USA); and (b) the second set of subsamples was stored in a 1000-mL bottle and transferred to the laboratory where, after filtration through 0.45-μm pore size membrane filters was used for ammonium (NH4+), chloride (Cl−), nitrate (NO3−), nitrite (NO2−), sodium (Na+) and sulphate (SO42−) determinations by ion chromatography (IC; ICS-3000 system, Dionex, Thermo Fisher Scientific, Waltham, MA, USA).
All water samples were kept in a cooled plastic box at 4 °C. Certified standards from Dionex and Agilent corporations were used for the calibration of the instruments. A water purification system supplied by Human Corporation was applied for the preparation of ultrapure water (resistivity 18.3 MΩ at 25 °C) which was used for the dilution of the standard solutions. One set of reference materials and two standards were analyzed routinely. The analytical errors for ICP-MS and IC were <10% and <5%, respectively.
The software codes Microsoft® Excel 2019 and IBM® SPSS v.26 licensed for faculty members of the University of West Attica were applied for the statistical treatment of the dataset. A map showing the locations of monitoring stations and the WQI classes of qualitative classification was developed using the software platform ArcView 10.4 GIS (ESRI®).
3.3. Application of Meta-Evaluation of WQIs Using Six Sub-Datasets of the Area Studied
Table 1 tabulates the selected parameters and associated criteria used in CCME-WQI and NSF-WQI calculations. The associated criteria and threshold values criteria are included in parenthesis (
Table 1). The CCME-WQI values were calculated for the groundwater samples collected in Megara basin, applying criteria provided by CCME [
29,
30].
The computation of CCME-WQI values was performed by using an application, developed by the CCME, which automates the process [
38]. The NSF-WQI values were obtained by the freely available calculator prepared by NSF [
31,
39].
Typology criteria established by the GWD [
17] and the Hellenic Republic [
18] were applied for the classification of the chemical status of groundwater bodies of the area studied. The variables included in the GWD are presented in
Table 1. Once the WQI and GWD-TV values have been calculated, the qualitative water quality classes were determined. The “One-Out All-Out” procedure was adopted for the classification using GWD-TV, i.e., the worst scenario was applied which states that the overall quality class is determined by the water quality parameter with the lowest value.
Table 2 shows the relation of each calculated WQI and GWD-TV variable value. The CCME-WQI and CCME-NSF have endorsed a “five-class” scale, while GWD-TV has adopted a “two-class” scale. The option of merging the five classes of CCME-WQI and CCME-NSF into fewer classes is selected in terms of harmonization and compatibility (
Table 2). The harmonization of the qualitative water quality classes promotes the comparative investigation of the examined indices. Accurately, the “bad–very bad” NSF ratings and “marginal–poor” CCME ratings were both categorized into “Class 1” to be related with the “bad” rating and “Class 1” as given by GWD-TV (
Table 2). The ratings “excellent–good–medium” and “excellent–good–fair” of NSF-WQI and CCME-WQI, respectively, were merged into “good” rating to be related with the “good” rating and “Class 2” as provided by GWD-TV.
Treatment and analysis of the water quality dataset include: (a) the development of X–Y line graphs depicting the temporal variation of the WQI values over the monitoring period; (b) spatial variation of NSF-WQI, CCME-WQI and GWD-TV classes in groundwater monitoring stations; (c) the application of conventional statistical hypotheses for detecting possible differences between the two examined WQIs; and (d) the development of column charts presenting the normalized frequency (Frequency/ Number of samples) which shows which each WQI falls into each quality class.
Specifically, the null hypothesis, Ho: NSFmean Aquifer (x)−Period (y) = CCMEmean Aquifer (x)−Period (y) (it means that there is no statistically significant difference between the NSF and CCME mean values for the examined aquifers and periods) against the alternative hypothesis, H1: NSFmean Aquifer (x)−Period (y) ≠ CCME mean Aquifer (x)−Period (y) (it means that there is a statistically significant difference between the NSF and CCME mean values for the examined aquifers and periods), are investigated with a paired (two tail) Student’s t-test which is performed at a significance level a = 0.05. The subscripts Aquifer (x) and Period (y) indicate the Quaternary, Neogene and Karstic aquifer, and wet and dry period, respectively.
4. Results and Discussion
Most of the work on the WQIs has been focused on the comparative assessment of various quality indices in surface water bodies [
15,
20,
40,
41]. Aleem et al., 2018 [
25], investigated groundwater quality for drinking and irrigation purposes in an industrial zone of Pakistan by applying NSF-WQI and spatial analysis. According to Aleem et al., 2018 [
25], NSF-WQI in combination with spatial analysis proved powerful tools for assessing groundwater contamination in industrial areas. Considering that only a few of the existing studies [
5,
27] until now discuss the meta-evaluation methodology as this applied in the groundwater bodies of the Megara basin, it is rather hard to comprehensively confirm the results of the present work against previous findings. However, many researchers [
15,
20,
41] have discussed results related to the performance of WQIs in surface water bodies of the Mediterranean region.
At a significance level a = 0.05 for the WQI values of the area studied, the paired (two tail) students’ t-test revealed that the null hypothesis was rejected for all the examined sub-datasets, except only for the “Karstic aquifer—Dry period” sub-dataset (
Table 3). This result shows that the CCME-WQI mean values are statistically significant (
p < 0.05) lower compared to NSF-WQI mean values of the entire monitoring period for all the examined aquifers, except only the WQI mean values of the “Karstic aquifer-Dry period” sub-dataset (
Table 3). Similar findings are also reported by Alexakis et al., 2016 [
15], for surface water of an artificial reservoir located in the Mediterranean region. At a significance level a = 0.05, the null hypothesis was accepted for the “Karstic aquifer-Dry period” sub-dataset; in other words, there is not strong evidence that the difference between NSF-WQI and CCME-WQI mean values is statistically significant.
The variation of WQI values over the monitoring period is presented in
Figure 3. It can be observed that NSF-WQI values are similar at the three groundwater bodies and periods. As can be seen from
Figure 3, the CCME-WQI values of the wet period at all sampling sites are both significantly lower compared to NSF-WQI values of the wet period and NSF-WQI and CCME-WQI values of the dry period.
The much higher variability of CCME-WQI values of the dry period compared to the variability of CCME-WQI of the wet period is observed at Neogene aquifer. By analyzing the graphs of
Figure 3, it becomes clear that the application of different WQI methodologies produces considerable differences in the qualitative classification. These differences are mainly due to the different number of selected parameters and criteria or threshold values.
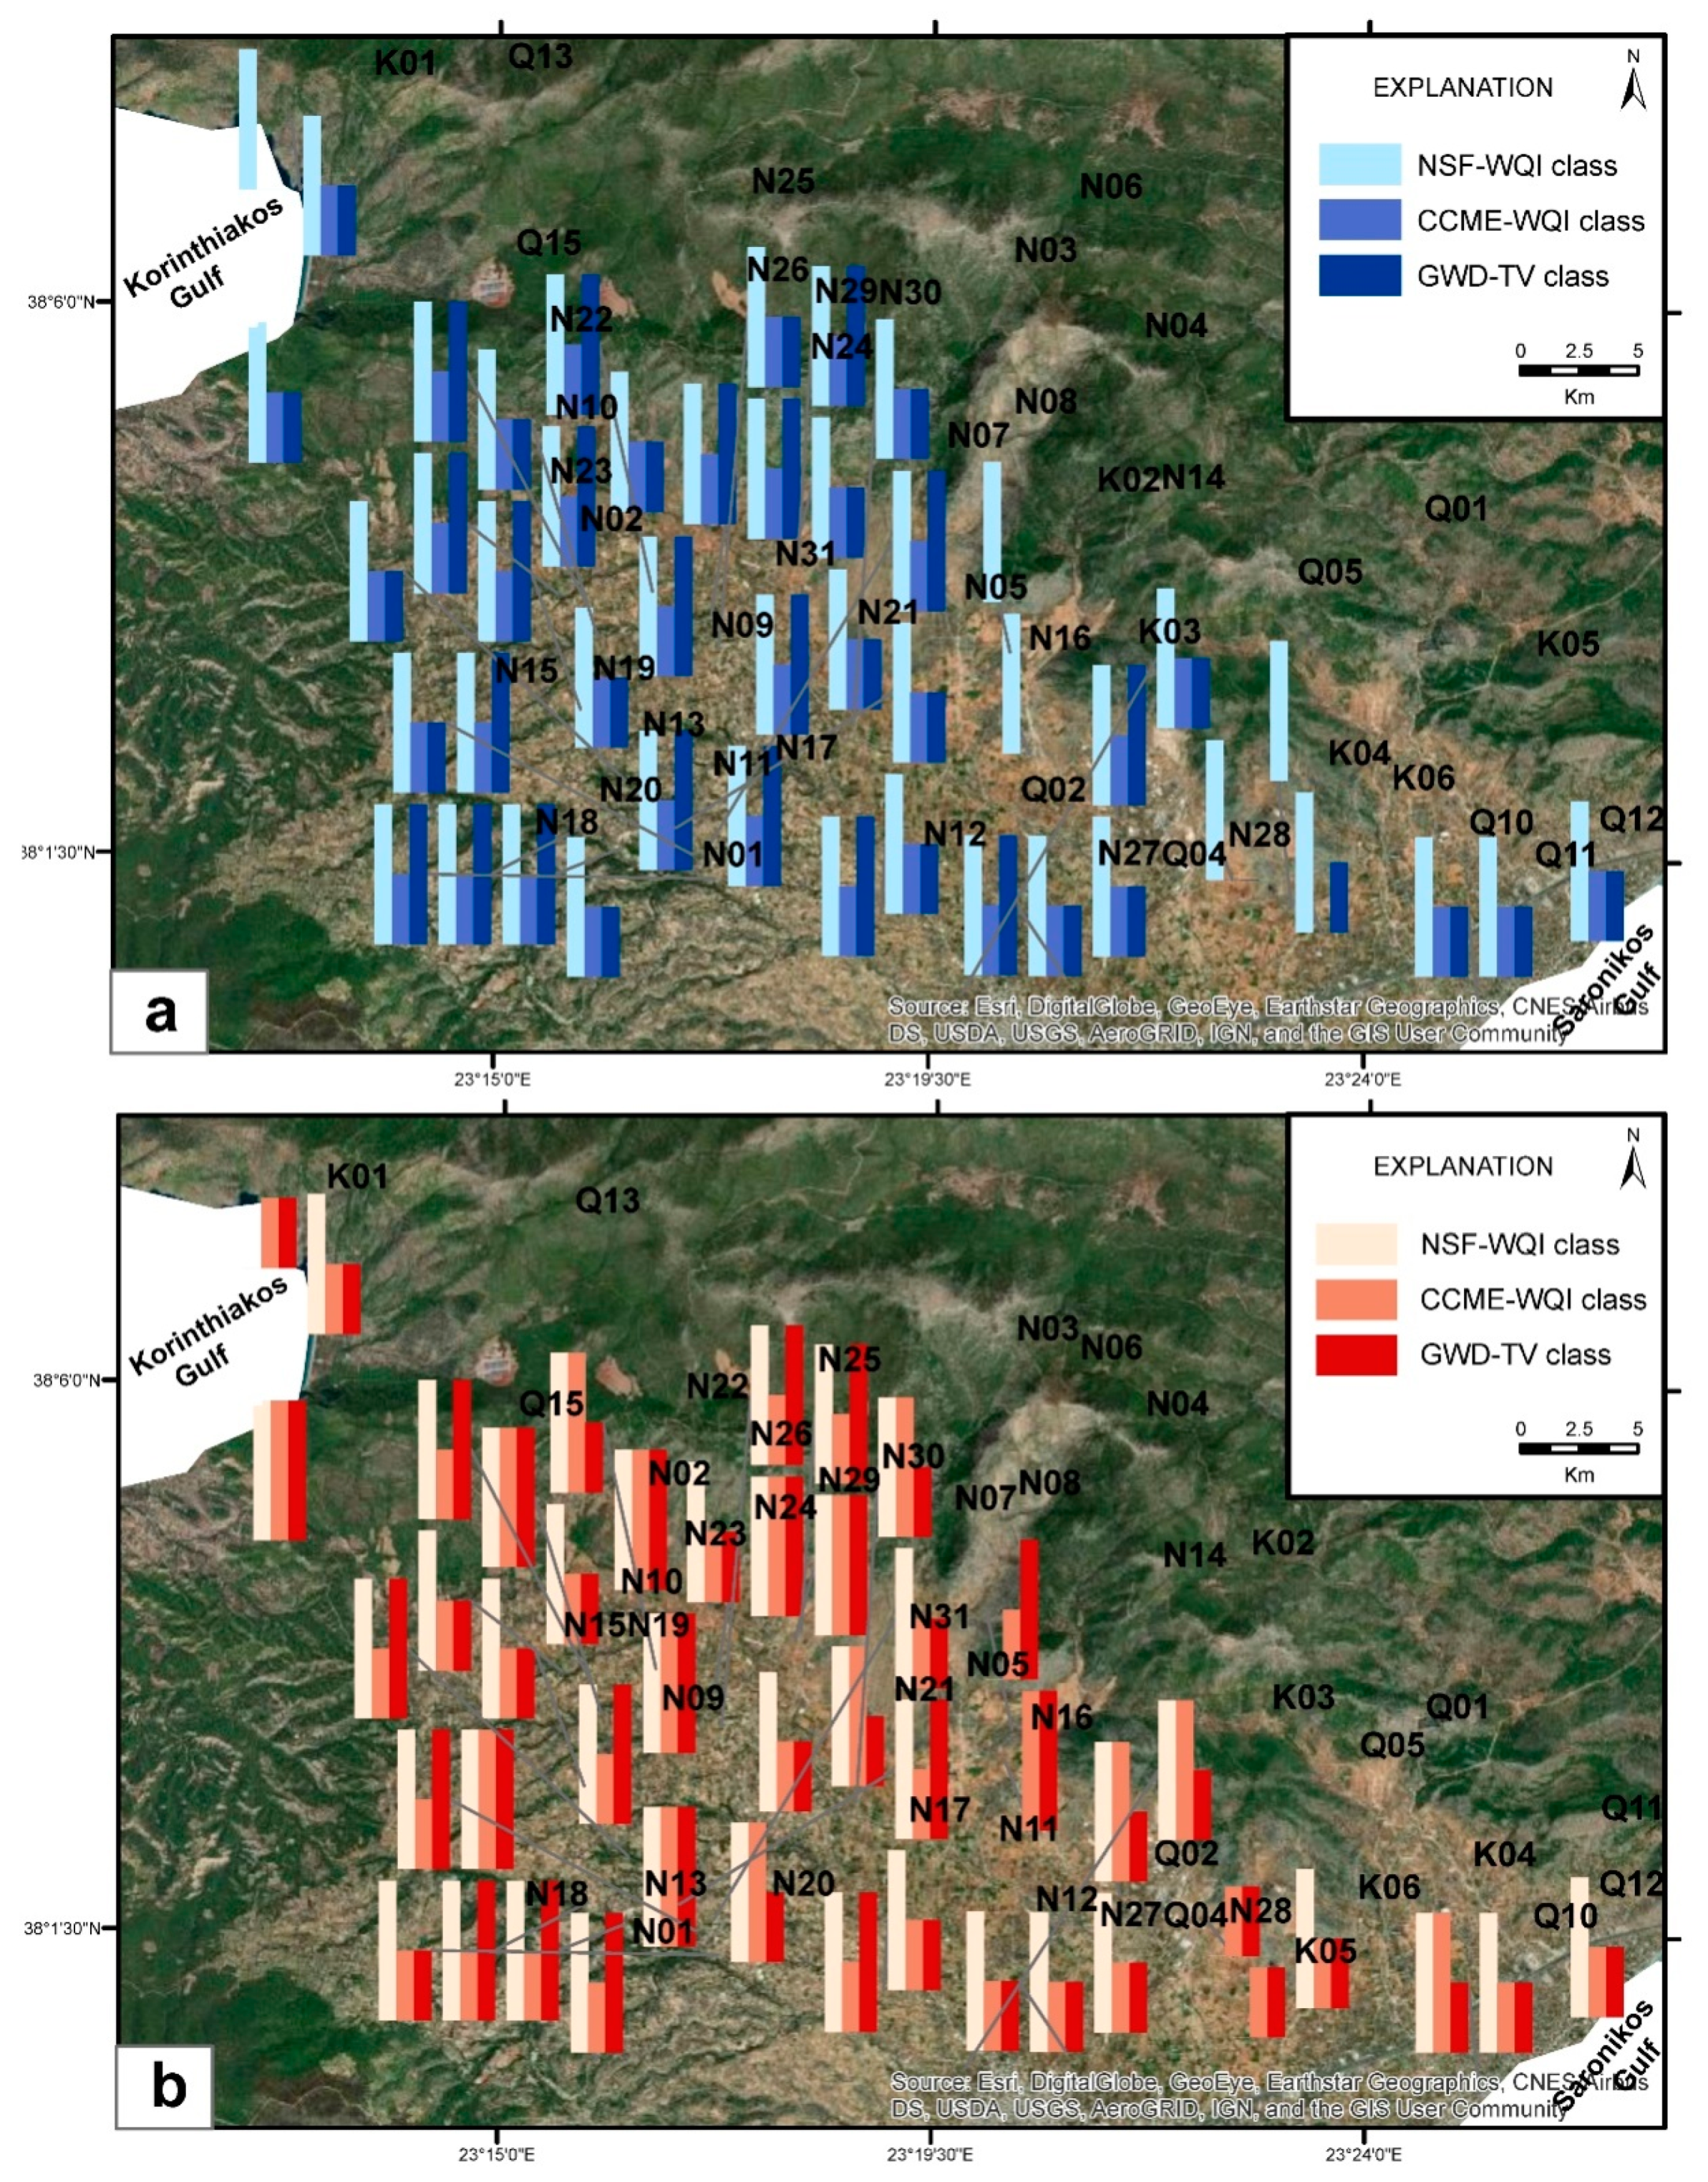
The spatial variation of the quality class derived by the application of CCME-WQI, NSF-WQI and GWD-TV is similar for all the applied methodologies (
Figure 4). The subscripts (w) and (d) shown in
Figure 4, indicate the wet and dry period, respectively. Mainly, taking into account all the groundwater monitoring stations at the Megara basin, it is clear that only a few monitoring stations present differences in the qualitative classification for the entire monitoring period.
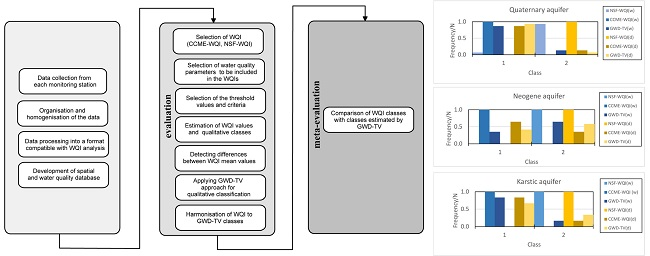
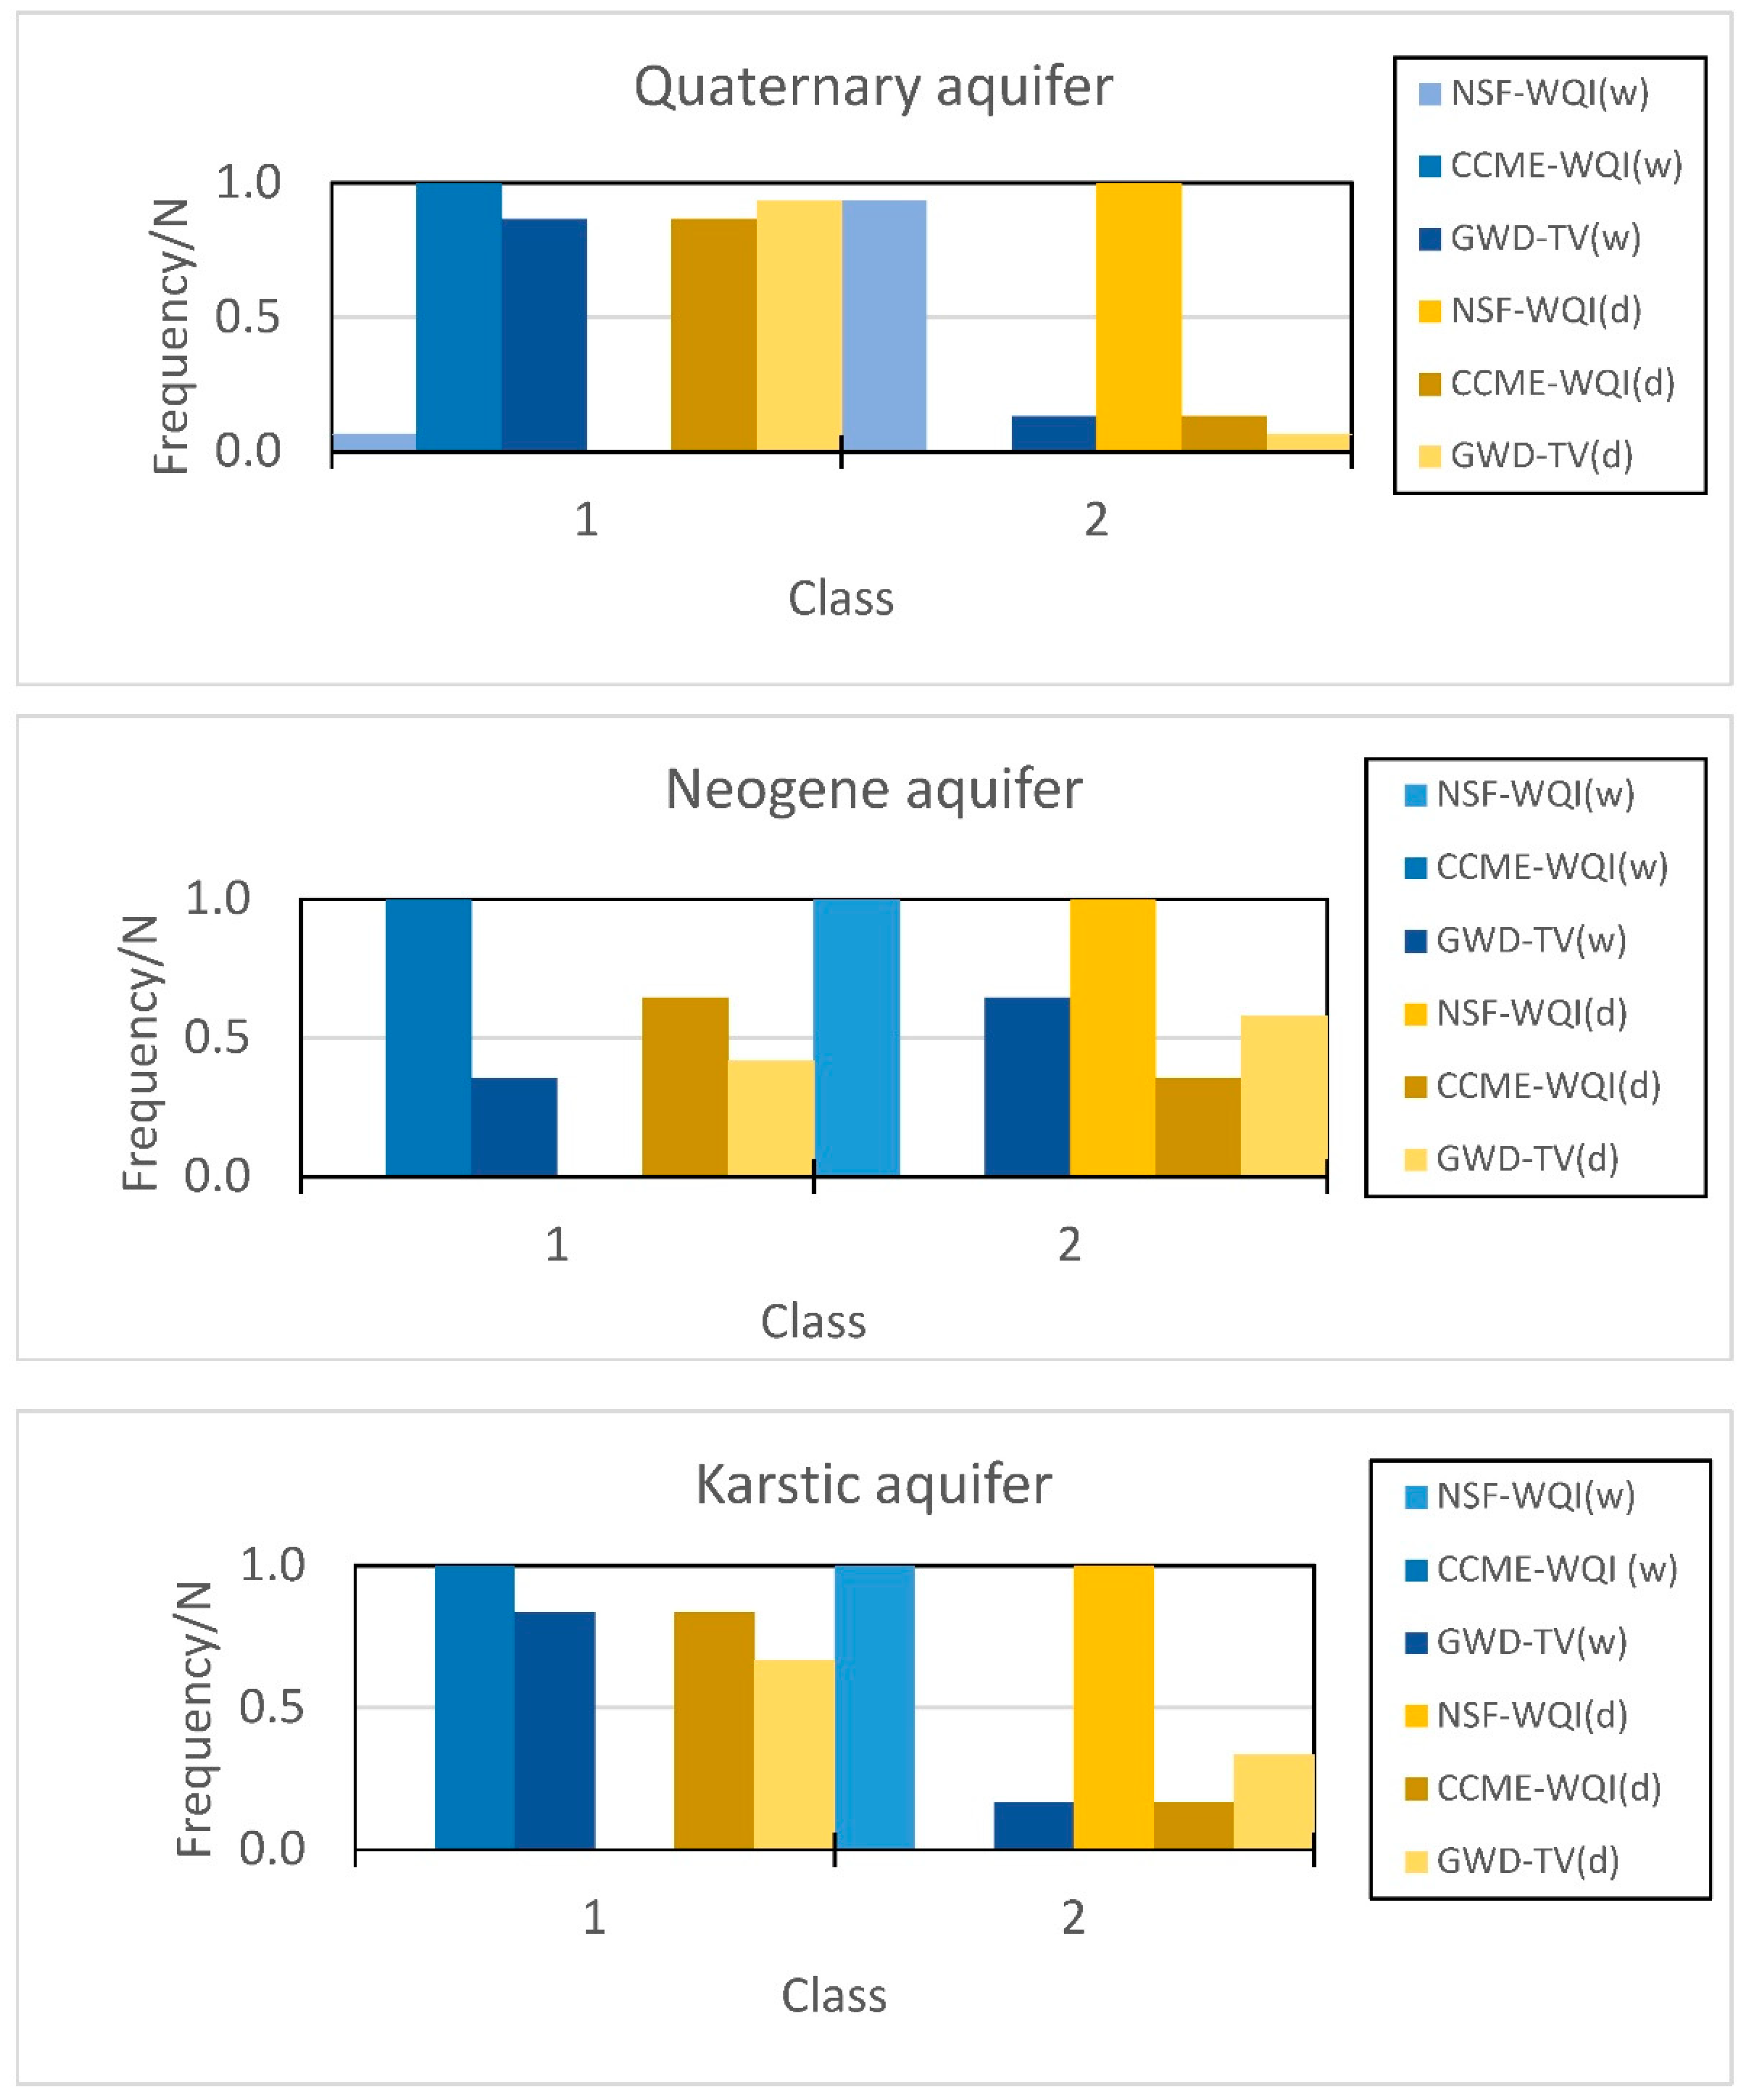
Figure 5 depicts the frequencies of description for each qualitative class by each CCME-WQI, NSF-WQI and GWD-TV. The subscripts (w) and (d) observed in
Figure 5 indicate the wet and dry periods, respectively.
It is observed that CCME-WQI and GWD-TV classifies for both wet and dry periods the Quaternary and Karstic aquifers into lower quality class (Class 1) compared to the NSF-WQI. In contrast, NSF-WQI classifies Quaternary and Neogene aquifers mostly into the highest class (Class 2) for the entire monitoring period (
Figure 5). This suggests that the classifications using CCME-WQI and GWD-TV are stricter compared to the ranking which applies NSF-WQI for the Quaternary and Karstic aquifers. A comparative evaluation of WQIs conducted by Alexakis et al., 2016 [
15], into the surface water of an artificial reservoir located in the Mediterranean region, also verifies the finding that the classification by applying CCME-WQI is stricter compared to that using NSF-WQI. Only the GWD-TV classifies the Neogene aquifer mostly into the highest class (Class 2), which is clearly explained by the exclusion of DO in the GWD-TV classification (
Table 1). The CCME-WQI and NSF-WQI having been established for a broader contamination assessment are, therefore, also susceptible to the variable DO, which strongly contributes to relegating the classification of the Neogene aquifer.
5. Conclusions
This research presents an approach to evaluate two widely used water quality indices through the classification proposed by the GWD. Previous surveys on the application of WQIs in the study area—as well as on meta-evaluation methodology, as this applied in the groundwater resources—are non-existent. For the estimation of NSF-WQI and CCME-WQI values and qualitative classes, a series of one hydrological year dataset of water quality parameters in Megara basin were applied.
It can be concluded that applying different WQI methodologies produces appreciable differences in the estimated WQI values and qualitative classification. The comparison of CCME-WQI and NSF-WQI values shows that CCME-WQI is a rather strict index since it estimates statistically significant lower values than the NSF-WQI. For the meta-evaluation of NSF-WQI and CCME-WQI, their qualitative classes were compared to those estimated by the GWD. At a significance level a = 0.05 for the calculated WQI values of the area studied, the student’s t-test revealed that CCME-WQI values are statistically significantly lower compared to NSF-WQI values. CCME-WQI and GWD-TV classify the Quaternary and Karstic aquifers more strict compared to NSF-WQI for the entire monitoring period. It is depicted that, based on the sub-datasets of Quaternary and Karstic aquifers for the entire monitoring period, the CCME-WQI classification findings are nearer those of the GWD-TV.
The concluding remarks of the meta-evaluation of WQIs are based on a series of water quality datasets of three groundwater bodies in an agricultural area of Mediterranean region, and can be theorized only if the WQIs are applied to a large variety of case studies representing a different type of land uses as well as hydrogeological and climatic conditions. Furthermore, there is always room for improvement of the WQIs, especially when applying to the groundwater resources. With such improvement, there is a further need to test the performance of WQIs applying less rigid and more objective formulations. The performance of WQIs should also be evaluated concerning the variety of the included parameters along with the naturally occurring levels of contaminants.


