Article

Optimization of Electrocoagulation Conditions for the Purification of Table Olive Debittering Wastewater Using Response Surface Methodology

1
Department of Food Chemistry, Research Institute of Food Science and Technology, Mashhad, Iran
2
Department of Plant Sciences, Faculty of Biological Science, Alzahra University, Tehran, Iran
3
Department of Environment and Energy, Sejong University, Seoul 05006, Korea
*
Authors to whom correspondence should be addressed.
Water 2020, 12(6), 1687; https://doi.org/10.3390/w12061687
Submission received: 24 April 2020 / Revised: 6 June 2020 / Accepted: 9 June 2020 / Published: 12 June 2020
(This article belongs to the Special Issue Advanced Applications of Electrocoagulation in Water and Wastewater)

Abstract

:
In the present study, the optimization of electrocoagulation (EC) conditions for the purification of olive debittering wastewater (ODW) was investigated by response surface methodology (RSM). For this purpose, a central composite design (CCD) was employed to optimize the process variables including current density (3.0–30.0 mA/cm2) and EC time (10.0–60.0 min). The results showed a significant effect of current density and EC time on the removal efficiency of total phenolic compounds (TPC) and chemical oxygen demand (COD). The best models obtained using the central composite design were quadratic polynomial for TPC (R2 = 0.993), COD (R2 = 0.982), and the inverse square root of turbidity (R2 = 0.926). Additionally, the square root of electrode consumption and energy consumption were appropriately fitted to the two-factor interaction (2FI) model (R2 = 0.977) and quadratic polynomial (R2 = 0.966) model, respectively. The predicted optimum conditions based on the highest removal efficiency for TPC were a current density of 21.1 mA cm−2 and an EC time of 58.9 min, in which the obtained model predicted 82.6% removal for TPC. This prediction was in agreement with the laboratory result (83.5%). The amount of energy consumption and the operating cost in these conditions was estimated to be 14.92 kWh and USD 6.49 m−3 per ODW, respectively.

1. Introduction

Olive food products are known for nutritional and health benefits. The fruits are widely used for the extraction of oil and are also consumed in processed forms. In 2018, an amount of 2.87 million metric tons of table olive was produced worldwide, of which 108,895 tons belonged to Iran according to agriculture statistics [1]. Virgin olive oil and its fruits have a characteristic taste because they contain phenolic compounds that are derived from oleuropein hydrolysis [2,3].
The processing of fruits includes cleaning, debittering, and fermentation. In the debittering step, they are soaked in alkaline or NaCl solutions and are washed with water frequently. The whole process consumes a large quantity of water, which is entirely converted to the waste stream [4]. Generally, olive industries use about 0.4–0.8 m3 water per ton of green olives in the debittering stage. A previous study in Greece showed that olive treatment factories produce 3.9–7.5 m3 wastewater per ton of green olives and 0.9–1.9 m3 wastewater per ton of black olives [5]. The generated discharge contains different organic compounds such as phenolic compounds, as well as inorganic compounds with environmental risks that require appropriate remediation methods [6]. Generally, these industrial wastewaters have high chemical oxygen demand (COD) values due to high organic load; for example, for olive mill wastewater this value is 48,500 mg L−1 [7], and for potato chips manufacturing wastewater it is 2800 mg L−1 [8]. Phenolic compounds are considered primacy pollutants which are dangerous to organisms and may have adverse effects on human health. They are distributed in different concentrations in industrial wastewaters; for example, olive mill wastewater has a concentration of 2400 mg L−1 [9] while oil refinery wastewater has a concentration of 13 mg L−1 [10]. The treatment of industrial effluents containing phenolic compounds encountered operating problems due to their poor biodegradability, high toxicity, and ecological status, such as the generation of toxic by-products [10].
A variety of methods are traditionally practiced for the refining of industrial wastewater. The wastewaters have variable compositions, so different physicochemical or biological strategies are needed with sufficient capability and acceptable operating charges. Usually, the biological treatment methods are time-consuming, require high capacity reactors, and the organisms are sensitive to pH, temperature, and toxic components [8,9,10]. Solid-phase extraction methods are encountered with limited adsorption capacity and expensive production of adsorbents. Furthermore, a pre-filtration step is required to remove suspended solids or oils, and the regeneration of the adsorbent is a challenging issue [11,12]. In the chemical coagulation method, colloidal particulates are destabilized by the addition of some chemicals. The particles form bigger aggregates that can be removed through filtration or flocculation [13].
A variety of procedures based on electrochemical principles have been developed for the treatment of wastewaters such as electrocoagulation, electroflotation, and electrochemical oxidation. Electrocoagulation (EC) is a promising technology used for the removal of organic compounds, colloidal particles, color, heavy metals, and microorganisms. EC can be considered as a coagulation, sedimentation, flotation, and oxidation method [12].
In electrocoagulation, coagulant ions are generated in situ and from the anode material (commonly Al or Fe). The hydrolysis of metal ions generates different ionic species (in the main cationic forms). Subsequently, the colloids with negative charge neutralize through electrostatic interactions. The aluminum (or iron) hydroxide flocs are known as efficient coagulants and have a large surface area that can adsorb dissolved contaminants, such as color and turbidity. Simultaneously, when the metal hydroxides precipitate, the impurities can also be trapped and removed. On the other hand, the generation of gas bubbles on the cathode can float another part of the coagulated spices and pollutants. During an EC treatment, a significant portion of the generated particles floats on the cell surface and can be transferred easily. The insoluble agglomerates can be settled using settling tanks, media filtration, ultrafiltration and other technologies to achieve water quality goals. The color and turbidity can be removed as a result of the physical adsorption on the polynuclear metal hydroxide complexes. Moreover, the process can reduce microbial load via the cell membrane rupture when the electrical field applied [14,15,16]. In addition, the generation of hydrogen bubbles at the cathode supports the flotation of coagulated species and simplifies their separation from the treated water [8,17].
Electrochemical methods, such as EC, have little or no adverse effects on the environment because harmful reagents are not used in these methods. Electrochemical reactions are less sensitive to the condition of the wastewater and can continue until a current is supplied to the electrode. It needs simple equipment with straightforward operation, and the process generates a reduced amount of sludge with fewer problems for disposal. In comparison with traditional chemical coagulation, EC is capable of removing the smallest colloidal particles. During the EC process, the liquid is not enriched with anions, the salt content does not increase, and a more compact sludge is produced. Furthermore, the obtained hydrogen bubbles (resulting as a product of water electrolysis at the cathode) capture the dispersed particles that are then separated by flotation [10,13,14].
A literature review reveals that treatment mechanisms in EC depend on the characteristic of effluent and the design of the EC apparatus. The effectiveness of EC methodology (effect of charge loading, electrode materials, coagulant-aid, current density, type and number of the electrode, etc.), is reported in the purification of different industrial effluents, especially in food industries [18,19,20]. Benekos et al. (2019) used EC (different current densities) for the treatment of table olive processing wastewaters (different initial COD) to determine maximum COD and color removal. In the pilot-scale reactor, they reached 42.5% and 85.3% COD and color removal, respectively, in a current density of 5.65 mA cm−2 [21]. García-García et al. (2011) employed EC to treat wastewaters from the green table olive packaging industry. They reported that the best results were obtained (40% COD removal and approximately complete removal of phenols and color) using aluminum in the anode and iron in the cathode, a current density of 25 mA cm−2, a distance between electrodes of 0.6 cm and a time of 50 min [22]. The EC treatment of olive mill wastewater using an aluminum electrode was also studied. The evolution of the physicochemical parameters during the EC treatment showed that under the following conditions: electrolysis time of 15 min, NaCl concentration of 2 g L−1, initial pH of 4.2 and current density of 250 Am−2, the discoloration of the olive sample, the reduction in COD and the reduction in polyphenols exceeded 70%, the consumption of the electrodes was 0.085 kg Al/kg COD removed, and the specific energy consumed was 2.63 kWh kg−1 COD removed [23]. Other methods were attempted to purify wastewater from table olive processing; for example, eight white-rot fungi were grown in wastewater produced by the debittering process of green olives for 1 month and the reduction in total phenolic compounds, the decolorization activity and the related enzyme activities were compared. Phenolic compounds were efficiently reduced by Pleurotus ostreatus (52%) and Abortiporus biennis (55%), followed by Panellus stipticus (42%) and Dichomitus squalens (36%), but only Pleurotus ostreatus had high decolorization efficiency (49%) [6]. A comparative study of chemical coagulation and EC in treating the pharmaceutical effluent was made to find a more efficient and cost-effective technology. The results showed that although chemical coagulation brought a considerable decrease in COD, suspended solids and chlorides, the extent of the decrease in the total dissolved solids (TDS) was only 14.05% using aluminum and 26.3% using FeCl3. Contrastingly, the EC method which reduced both COD and TDS to a greater extent (92.3% and 91.5%, respectively) proved more efficient with Fe-Al assembly using the lowest current of 0.04 A at a time interval of 15 min. Coagulant consumption is also less in EC compared to in chemical coagulation, rendering it a cost-effective technology [13].
Treatment efficiency is commonly evaluated in terms of total organic carbon (TOC), chemical oxygen demand (COD), turbidity, color, or the concentration of a particular species such as a metal ion. The sacrificial anodes are dissolved and need to be replaced at regular intervals. Furthermore, the formation of an oxide layer at the surface of the cathode may lead to a decrease in treatment efficiency. High conductivity is necessary for the wastewater to decrease electrical energy consumption [24,25].
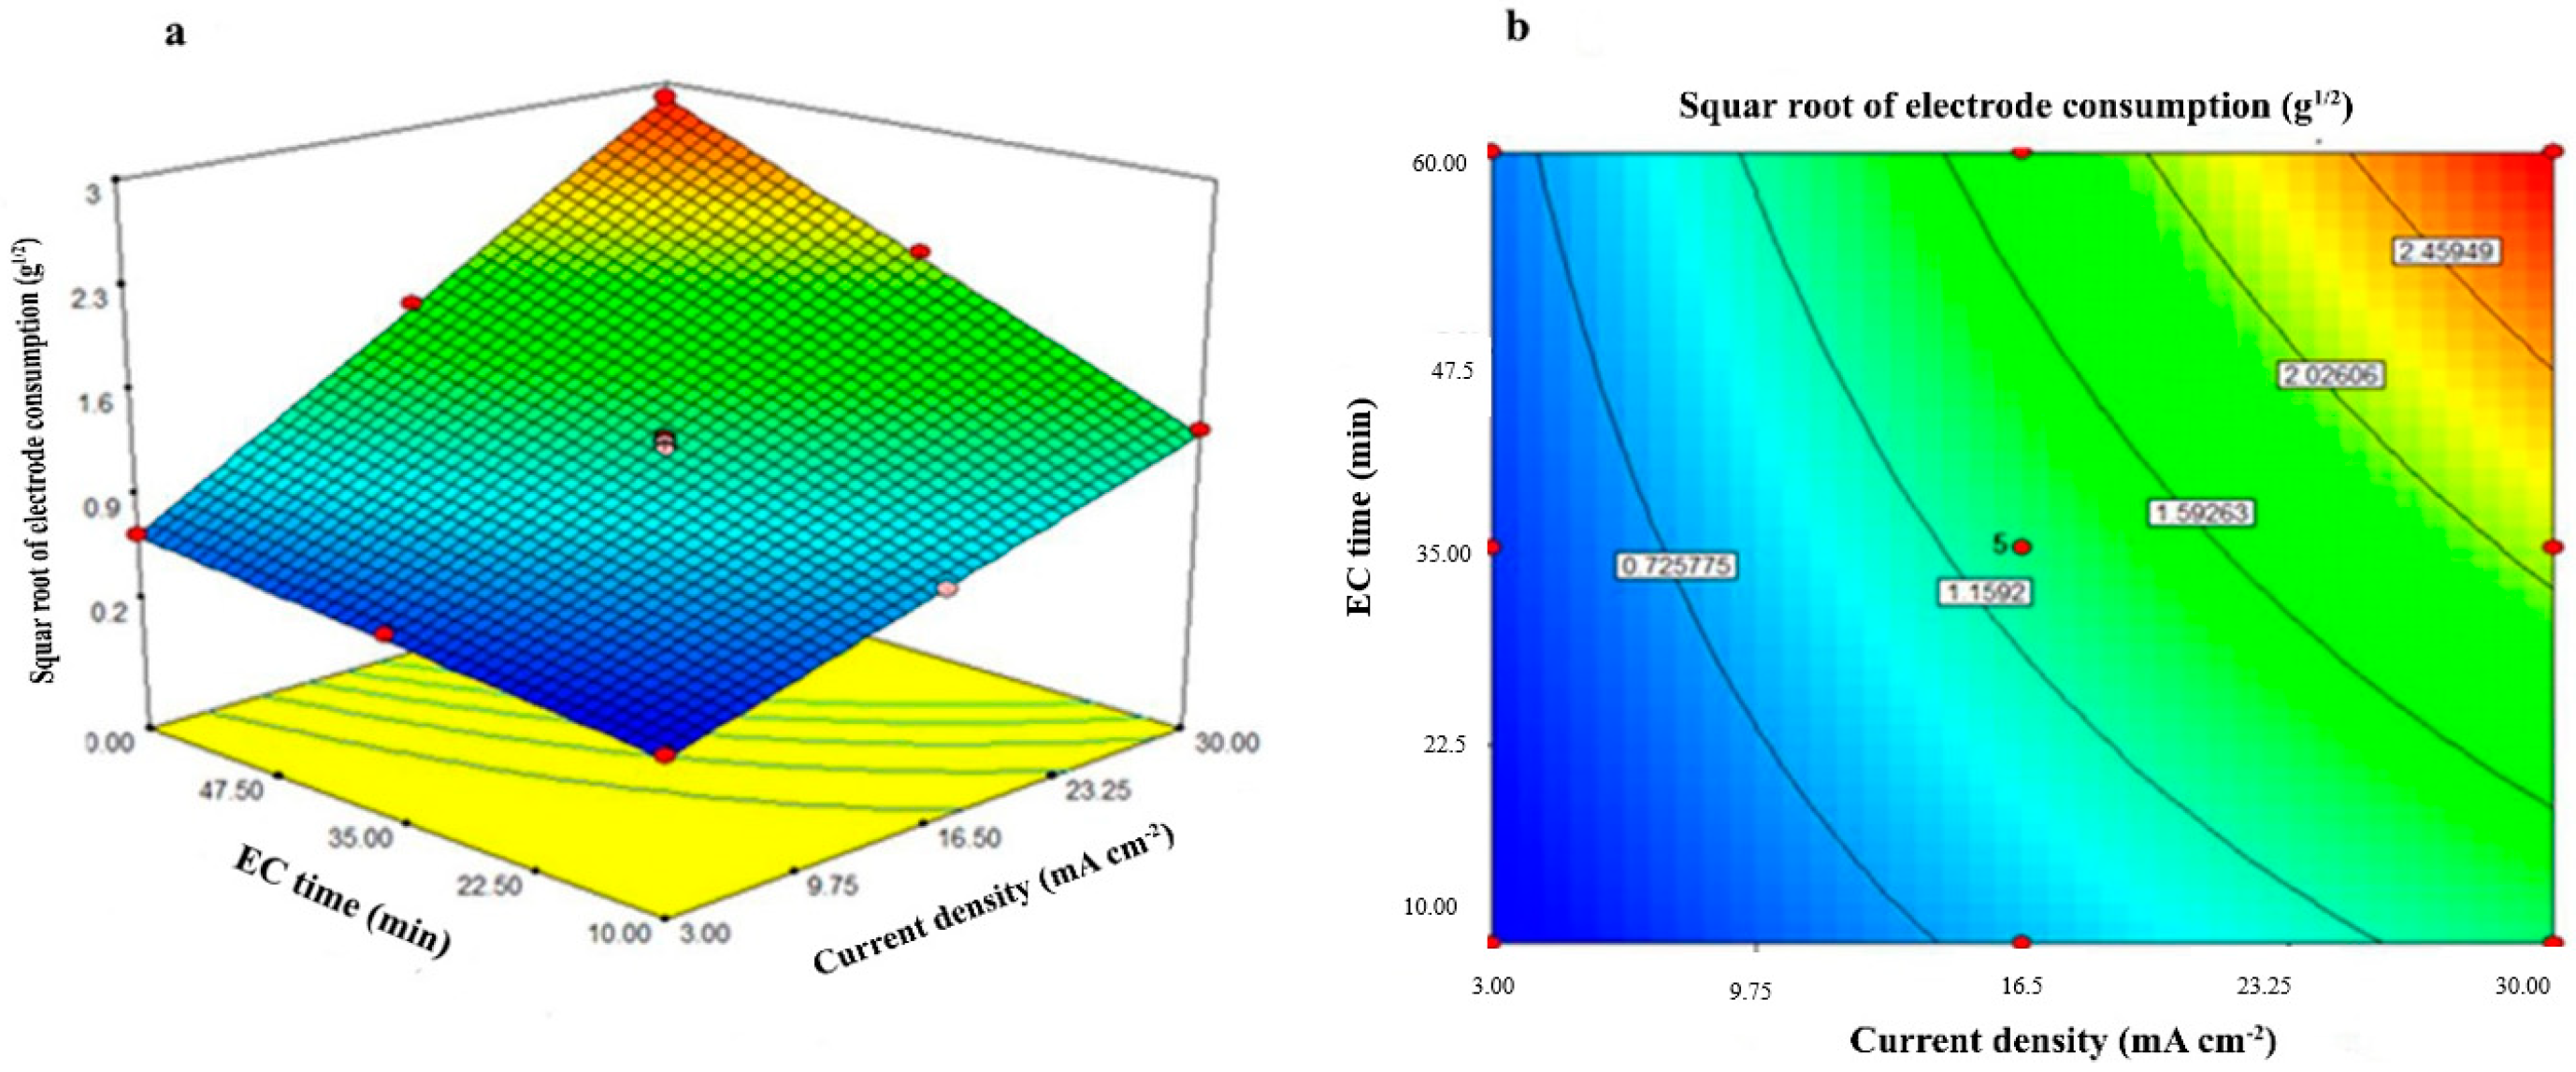
In the electrocoagulation, current density and EC time are two of the most important parameters for achieving maximum removal of impurities [26] and their optimal selection can greatly help in reducing energy consumption and thus reduce operating costs.
The ratio of practical current to the actual anode surface area toward a solution is defined as current density [17]. The current density is an important parameter in the EC process which directly has an effect on the growth rate of the flocs, bubble production, and coagulation rate. Higher current densities produce higher concentrations of metal ions in the solution and generally enhance the removal efficiency of the EC process. A larger current density means a smaller EC unit. However, the use of high currents density is likely to waste electrical energy in the form of heat. More importantly, too high current densities can reduce current efficiency [
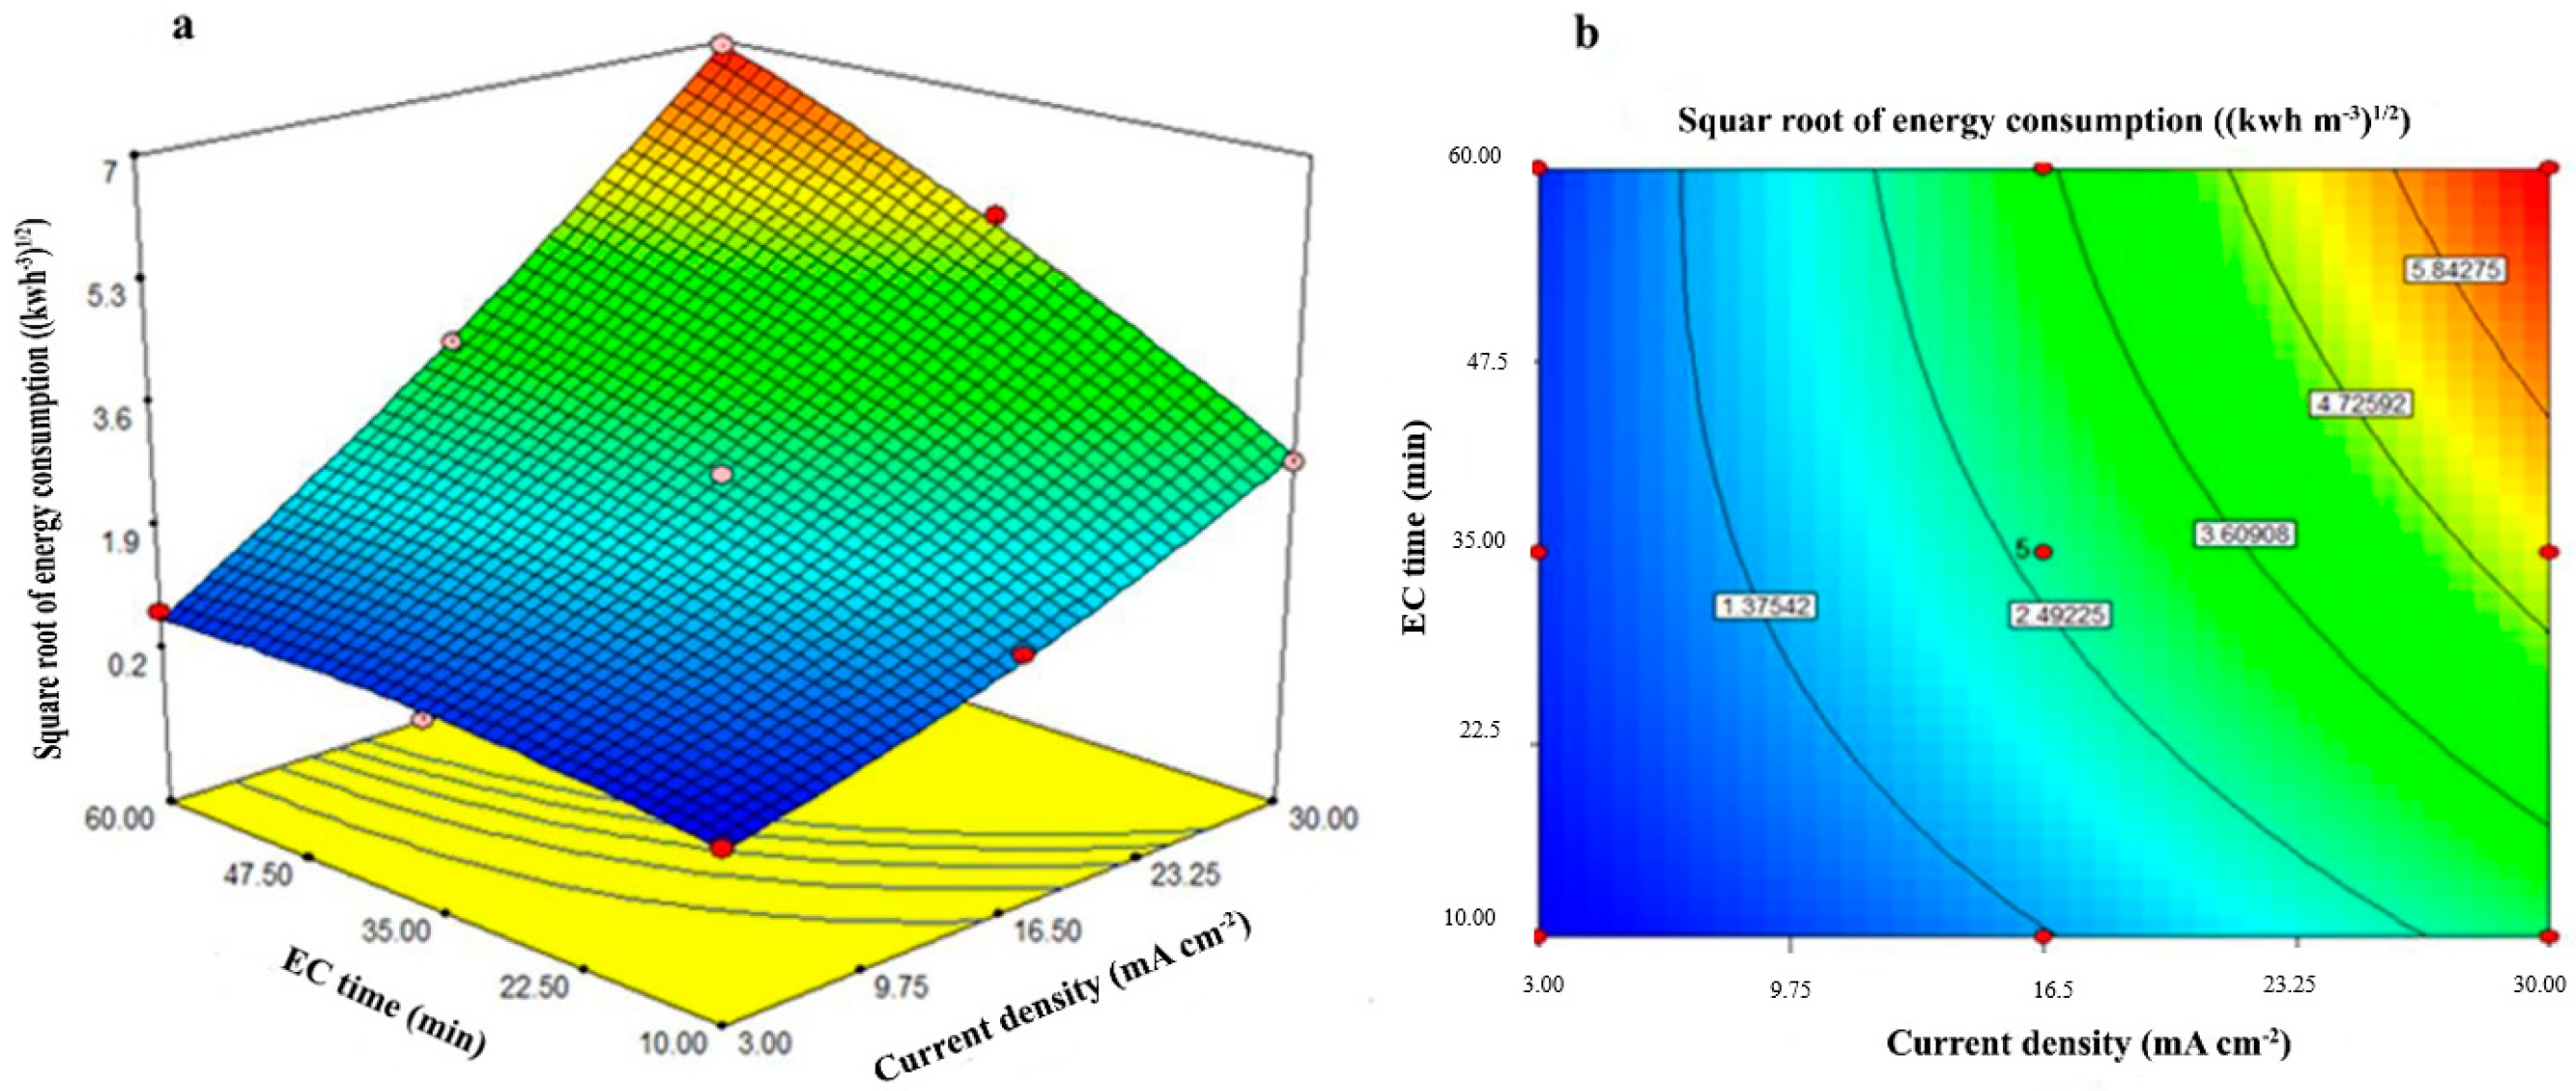
26]. Results of Yassine et al. (2018) showed that the increase in electrolysis time (to 150 min) and the intensity of the current (1–3 A) significantly improved the efficiency of EC (aluminum electrode) in oxidizing the organic matter and, subsequently, reduced the pollutant power of olive mill wastewater. However, the consumption of energy and electrodes increased simultaneously [27]. Benekos et al. (2019) stated that an increase in the electric current in EC (Al and Fe electrodes) of table olive processing wastewaters was accompanied by a proportionate rise in energy consumption, thus, increasing the current density from 3.87 mA cm−2 to 5.65 mA cm−2 caused an increase in energy consumption from 0.68 kWh m−3 to 0.99 kWh m−3 in the same treatment time (50 min) [21].
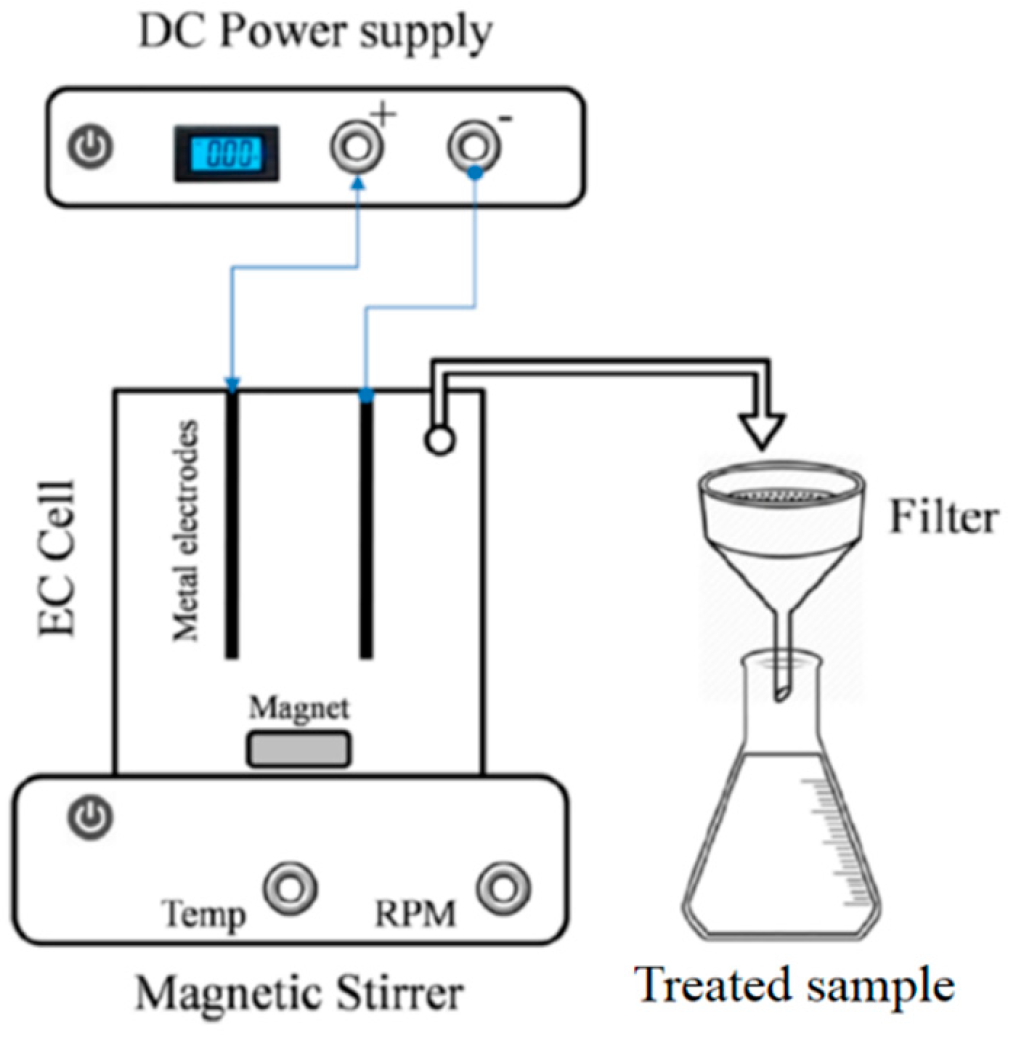
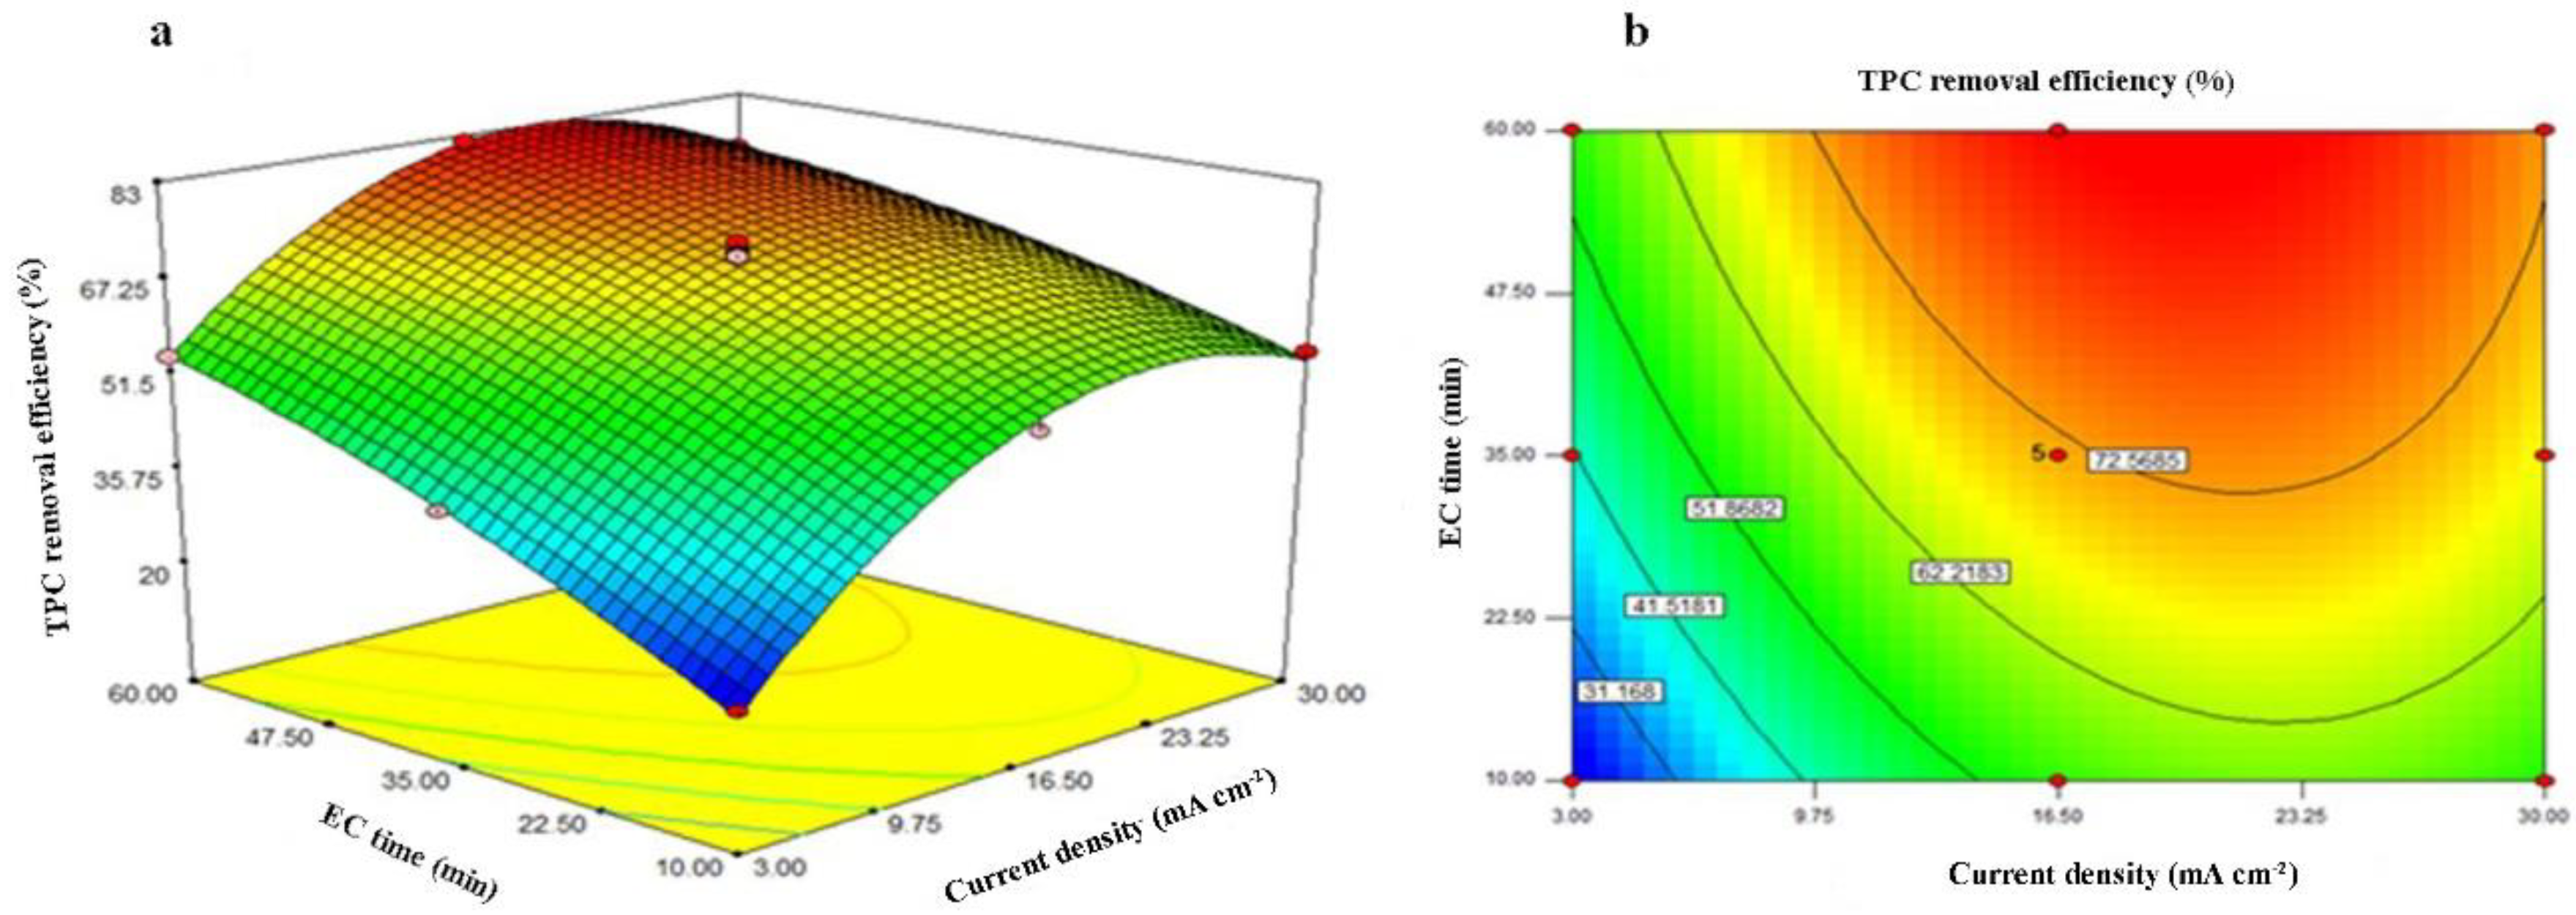
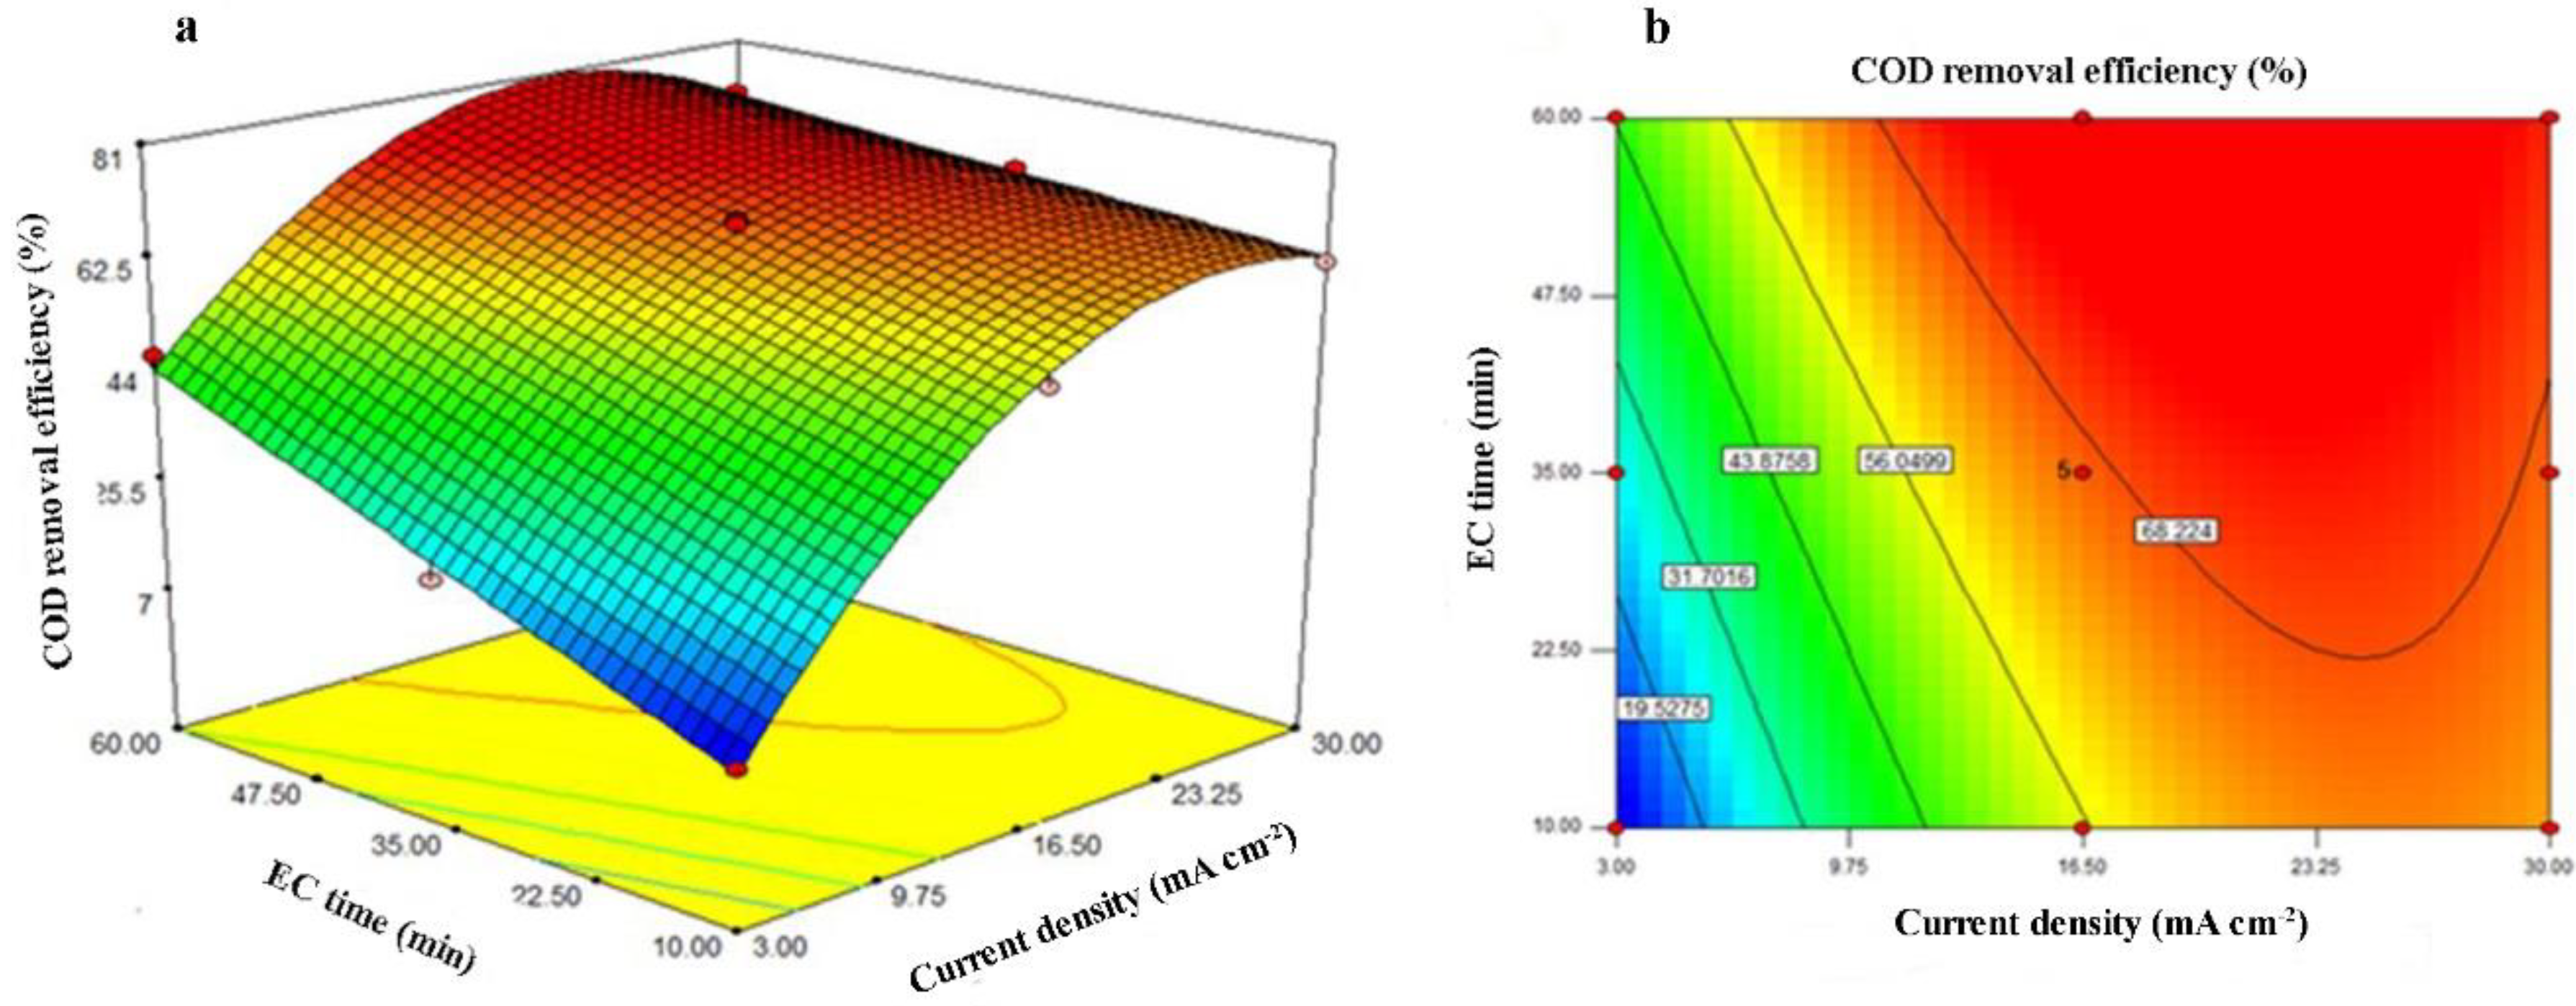
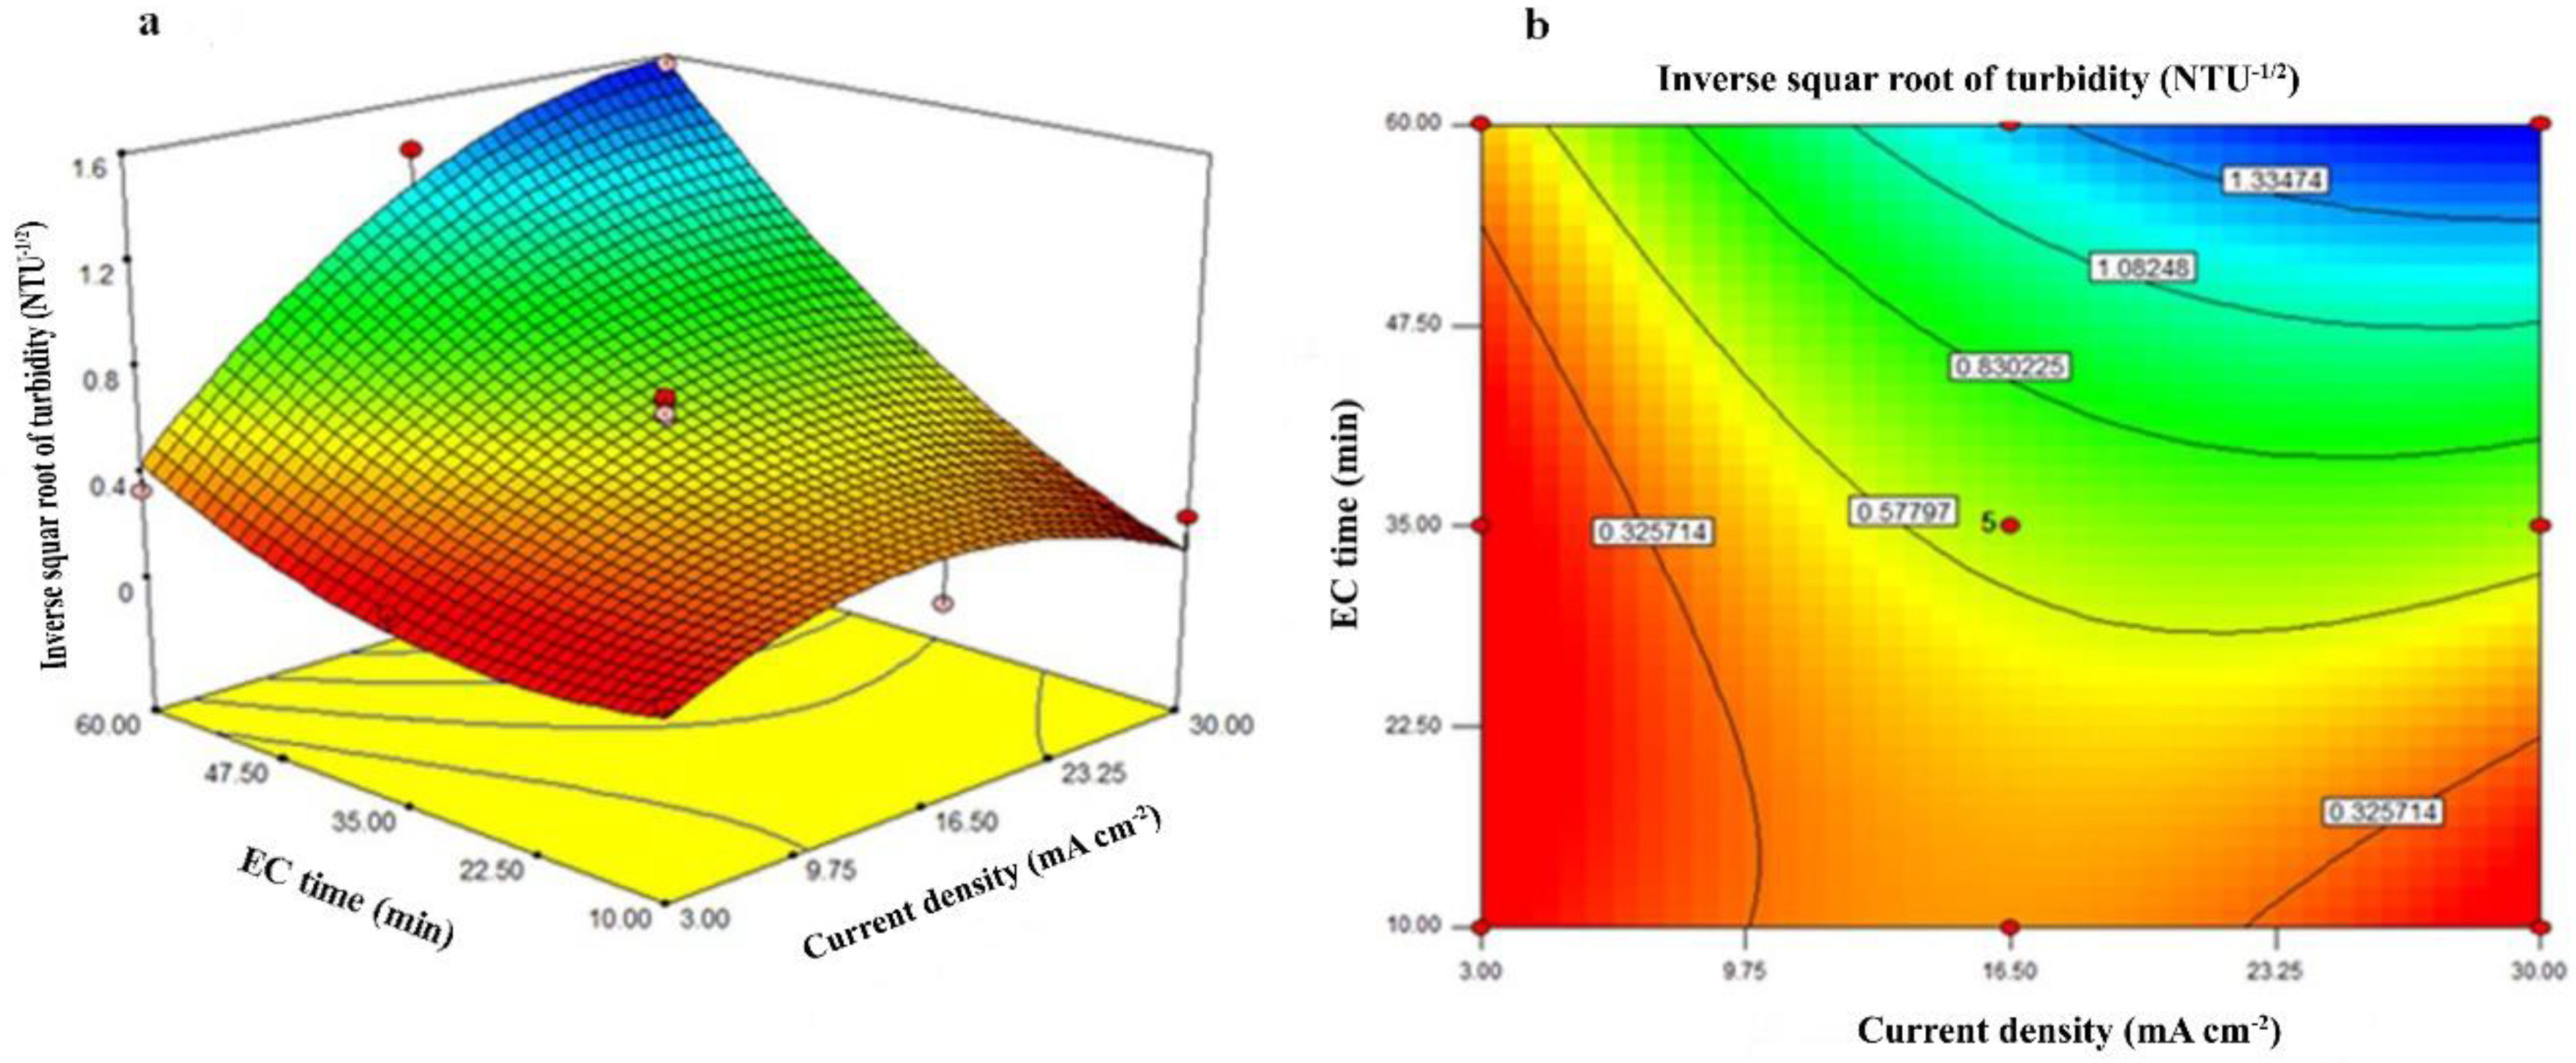
The main objective of the present study was the evaluation of electrocoagulation in the treatment of olive debittering wastewater (ODW). Furthermore, the response surface methodology (RSM) was used to optimize the efficiency of EC under different electrolysis times and current densities.

2. Materials and Methods

2.1. Materials

The fresh olive debittering wastewater (initial pH: 4.40 ± 0.04, Brix: 19.9 ± 0.2% and total soluble solids (TSS): 12.7 ± 0.4 g L−1) was collected from Mahrad Chashni Toos Co. Mashhad, Iran. The samples were kept within plastic containers in the dark and at temperature of 8 °C. The main chemical properties of the ODW sample prior to treatment are presented in Table 1. The Folin–Ciocalteu reagent, ferrous sulfate, hydrogen peroxide, hydrochloric acid (37% wt), and other chemicals were supplied from Merck (Darmstadt, Germany) or Sigma-Aldrich (Louis, MO, USA).

2.2. Analytical Procedures

The total phenolic compounds (TPC) were determined by the spectrophotometric Folin–Ciocalteu method [28] with distilled water and diluted Folin–Ciocalteu reagent (1:10 ratio). To determine the biochemical oxygen demand (BOD), an OxiTop respirometry measuring system (WTW, Weilheim, Germany) was used with a limited measurement area up to 4000 mg L−1 of BOD. The COD was measured by the standard test method (method 8000) with proper COD vials (Hach, Loveland, CO, USA). The sample was poured in COD vials and put in a thermostat digestion reactor (Hach, LT200, Loveland, CO, USA) at 150 °C for two hours, followed by a direct spectrophotometric (DR 5000 UV–Vis, Hach, Loveland, CO, USA) reading at 620 nm [24]. The turbidity of samples was determined by an AL450T-IR turbidity meter (AQUALYTIC, Dortmund, Germany). A digital conductometer (Mettler Toledo, Greifensee Schweiz, Switzerland) was applied to measure the conductivity of samples. All the fresh and EC-treated samples were initially filtered (Whatman filter paper No. 42; 2.5 µm) and then used for the measurement of the mentioned parameters. The total amount of soluble solids was determined in °Brix with an RX-5000 digital refractometer (Atago, Tokyo, Japan). Total suspended solids (TSS) were measured according to standard test methods [29].

2.3. Electrocoagulation Procedure

The EC treatments were done in a handmade plexiglass cell (15 × 15 × 20 cm) under the constant electrical current (Figure 1). The EC-cell is equipped with a digital DC power supply to deliver a steady current from 0 to 20 A at a variable voltage from 0 to 30 V. Two rectangular planar sheets (10 × 10 × 0.5 cm) of aluminum were served as the cathode and anode electrodes. The electrodes were placed vertically at a distance of 1 cm. They were placed 1 cm above the cell bottom, allowing the sample to be stirred during the electrolysis. Initially, the electrodes were rubbed with sandpaper to eliminate adsorbed impurities. Then, the electrodes were washed with a hydrochloric acid solution (10%), acetone, water, and then were dried at 100˚C. The aluminum plates were weighed before and after each EC run. After minor pH adjustment at 4 (with 0.1 mol/L NaOH and HCl solutions), the EC cell was loaded with 2 L of ODW.
The Al plates were immersed in the solution and the electrical current was established between electrodes. After a given time interval, the power source was removed, and 10 mL of the sample was vacuum filtered. The filtrate was used to measure residual TPC, COD, and turbidity. The effect of the EC time (10 to 60 min) and current density (3 to 30 mA m−3) were investigated.
According to Equations (1), (2) and (3), the removal efficiency (R) of each case including specific electrical energy consumption (SEEC) and electrical energy consumption (EEC) were calculated [24]:
R (%) = ((C0 − C1)/C0) × 100
EEC (kWh/m) = (V × I × t)/(60 × v)
SEEC (kWh/g) = EEC/(C0 − C1)
where C0 and C1 are the initial and final concentrations of the organic load (mg L−1), respectively, I is the electrical current (A), v is the sample volume (L), V is the working electrical potential (in volts), and t is the EC time (min). Therefore, the SEEC is stated in terms of kWh per unit mass of the organic load (g) [17,30,31]. The electrode consumption (ELC), meaning the electrode mass (g) consumed per cubic meter (m3) of the wastewater, was determined depending on the weight loss of the anode electrode during each EC run. The operating cost (OPC) was considered using Equation. (4).
OPC (USD/m3) = (a × EEC) + (b × ELC)
where, a (USD/kWh) and b (USD/g) are unit prices of the electrical energy and electrode material, which were calculated in the Iranian market in June 2019 [30]. All the EC runs were performed at room temperature (25 °C). The experiments were done triplicate, and the means are reported.

2.4. Statistical Analysis

The response surface methodology was used to design the experiments and analyze the data. The central composite design (CCD) was employed to determine the optimum EC conditions. The complete design was involved 13 points, including 8 experiments and 5 central points. The independent variables selected in this study were electrolysis time and current density. The TPC removal efficiency and COD removal efficiency, turbidity, electrode consumption, and energy consumption were the responses. Modelling of the obtained results was performed and then optimal points for the operation were extracted. The design of the experiments was performed using a face central composite design (FCCD) and Design Expert software version 7. The appropriate high and low range for current density (3 to 30 mA cm−2) and EC time (10 and 60 min) were selected based on some pretests. The quadratic polynomial equation (Equation (5)) was used to predict the optimal conditions.
y = β 0 + i = 1 k β i x i + i = 1 k β ij x i 2 + 1 i j k β ij x i x j + ε
where k represents the number of variables, β0 is the constant-coefficient, βi is the linear parameter coefficient, Xi and Xj are variables, βij is quadratic parameter coefficient, and ε is random error of experiments. The quality of model fitting was expressed by the coefficient of determination (R2). The experimental data were fitted to different models (linear, quadratic, third-order polynomials, and two factor interactions (2FI)). They were then statistically analyzed to select the appropriate model. Statistically, it is a suitable model with no significant lack of fit and it has the highest value of R2, R2Adjusted, R2Predicted, and low predicted residual error sum of squares (PRESS). The factors of the models were evaluated at a 95% confidence level. A 3D response surface and contour plots were drawn to evaluate the studied properties. Finally, to validate the results of the model under optimum conditions, the lab experiment was performed and was compared with the predicted results.
In the normal plots of residuals resulting from all studied parameters, no particular trend of increase or decrease in the variance were observed, assuming the residual variance to be constant. In the plots of residuals versus the experimental runs, there was no trend involving the sinusoidal process that confirms the assumption of independence between the data. Thus, the plots were not shown.

3. Results and Discussion

3.1. Model Fitting

The results of fitting different models on the obtained data showed that for most of the data, the quadratic polynomial model was more suitable than the other models. Table 2 shows the bivariate CCD obtained by RSM and the corresponding responses. This table reveals the TPC and COD contents and turbidity of ODW, as well as the amount of electrode and energy consumption after electrocoagulation treatment according to RSM runs. The data of removal efficiency of TPC, COD and turbidity value as well as of electrode and energy consumptions were evaluated using analysis of variance (ANOVA). The results are discussed below.
The ANOVA results of the effect of current density and EC time on TPC and COD removal efficiencies are presented in Table 3, respectively. The effect of current density and EC time on removal efficiency of TPC and COD were significant (p < 0.05). The lack of fit for the TPC-obtained model was not significant (F = 3.76), indicating a strong signal of the model compared to its noise. High values of R2, R2Adjusted and R2Predicted (0.996, 0.993 and 0.975, respectively) and low values of PRESS (81.93) indicate the validity and suitability of the model to fit the removal efficiency data.
The lack of fit was significant (p < 0.05) for the obtained model for COD (F = 164.92), indicating high noise in the model. Despite the high coefficients of R2, R2Adjusted and R2Predicted (0.988, 0.982 and 0.957, respectively) and low coefficient variable (CV = 4.72%) due to the significant lack of fit, using the obtained model is not reliable for predicting removal efficiency.
Due to the high maximum to the minimum ratio (79.27), turbidity data were normalized by converting them to the inverse square root, and then ANOVA was applied. The ANOVA results of the effect of current density and EC time on the inverse square root of the removal efficiency of turbidity are presented in Table 3. The best-fitting model was the quadratic polynomial, which is significant (p < 0.05). The current density and EC time have a significant effect on turbidity (p < 0.05). The lack of fit was significant (p < 0.05) for the model (F = 21.66), indicating high noise in the model. Based on the significant lack of fit and despite the high coefficients of R2 = 0.957 and R2Adjusted = 0.926, and a low value of PRESS = 0.96, using the model to predict removal efficiency of turbidity is not reliable.
Because of the high ratio of maximum to minimum, the electrode consumption (83.9) and the energy consumption (600) data were first normalized by converting them to their square root. The ANOVA results for the effect of EC working conditions on the square root of electrode consumption and the energy consumption are given in Table 4.
The best-obtained models for the square root of the electrode consumption and the energy consumption were the two-factor interaction (2FI) and quadratic polynomial models, respectively. The effects of current density and EC time on them were significant (p < 0.05).
The lack of fit for the obtained model for the electrode consumption was not significant (F = 1.94), indicating weak noise of the model compared to its signal. High values of R2, R2Adjusted and R2Predicted (0.997, 0.996 and 0.995, respectively) and low value of PRESS (0.028) indicate the validity and suitability of the obtained model to fit the removal efficiency data.
The lack of fit for the energy consumption model was significant (p < 0.05) for the obtained model, indicating the high noise of the model. Despite the high coefficients of R2, R2Adjusted and R2Predicted and low value of PRESS (Table 4), due to the significant lack of the fit, using the obtained model for prediction of the square root of energy consumption is not reliable.

3.2. TPC Removal Efficiency

A quadratic model with real independent variables for predicting TPC removal efficiency was obtained and is presented in Table 5. As can be seen beside the current density and EC time, the second power and interaction between them are effectively the same as the prediction model.
The 3D response surface and contour plots of the effect of current density and EC time on TPC removal efficiency are shown in Figure 2a,b, respectively. As the current density and time of the electrocoagulation increased, the removal efficiency (in percent, %R) of TPC also increased. The removal efficiency of TPC was improved when the current density increased to approximately 20 mA cm−2 and remained nearly constant at higher current densities. The highest R% of TPC was observed at the current density of 16.5 mA cm−2 and 60 min.
The two compelling steps in the EC process are the destabilization of the suspended charged particles through neutralization pursued by aggregation. The first step is commonly slow and considered as the rate-determining step. Certainly, the dosage of metal ions was not enough in short electrolysis durations to destabilize all fine and colloidal suspended particles, and as a result, low removal efficiencies were achieved. Due to the formation of new flocs and saturation of released ions from the electrodes, the removal efficiency remained stable at higher retention times [32].
Ogando et al. (2019) reported that total phenolic compounds of sugarcane treated by EC decreased more in treatments with higher voltage. Assays of 65, 55, 45 and 35 V after 60 min presented reductions of 35.2, 27.5, 19.4 and 12.7%, respectively [33].
Jeong et al. (2019) stated that the highest removal rate of phenolic compounds of hydrolysates resulting from hydrolysis of Mongolian oak was obtained at pH 5–8, which was attributed to the actions of Al(OH)3. They explained that the removal rate of TPC reached about 40% (39.9%) at 30 min, and by increasing EC time to 240 min, the TPC removal efficiency rose to 44.3% but remained in the range of 40–45% [34].
It was reported that at the low concentrations of aluminum, the predominant species are the complexes Al(OH)2+ and Al(OH)4 at the pH range of 6–7. The TPC are negatively charged compounds and the positive complex would prefer to destabilize them. Thus, changes towards more acidic pH involve positively charged aluminum ions, while changes towards more alkaline pH would not favor destabilization. At higher aluminum concentration, the presence of unclear species such as Al8(OH)204+ is enhanced, but the precipitate form, Al(OH)3, predominates, leading to trap or coagulate contaminants (phenolic compounds) in the liquid phase [35].

3.3. Removal Efficiency of COD

Table 5 presents a corrected quadratic model with real independent variables for predicting COD removal efficiency obtained after removing terms (the second power of EC time) that were not statistically significant in the model. The 3D response surface and contour plots of the effect of current density and operating time on COD removal efficiency are shown in Figure 3a,b, respectively.
By increasing the current density up to approximately center point (16.5 mA cm−2), the removal efficiency was clearly increased and then decreased, while increasing the EC time to 60 min improved COD removal.
Khoufi et al. (2007) showed that 33.6% of the initial COD of olive mill wastewater was decreased during an EC process (iron electrodes at a distance of 2 cm, a current density of 20 A, and an EC time of 2 h). They also reported that most of the low molecular weight phenolic compounds and ortho-diphenols significantly reduced through the EC. This was attributed to the polymerization of simple aromatic compounds as well as the physical and/or chemical absorption of phenols to the solid particles in the residual sludge [36].
Tchamange et al. (2016) reported that the amount of COD and turbidity of the leather effluent after applying EC (electrode: Fe, current density: 0.4 A and EC time: 40 min) decreased rapidly, and 10 min after beginning the operation, the removal efficiencies of color and COD were 95.69% and 66.56%, respectively [37]. The low COD removal was attributed to the presence of organic compounds in the effluent that could not be eliminated by the EC.

3.4. Turbidity

A quadratic model with real independent variables is presented in Table 5 for predicting the inverse square root of turbidity. In the obtained model, the second power of current density EC time, and their interaction were effective for predicting turbidity.
Figure 4a,b show the 3D response surface and contour plots for the effect of current density and electrolysis time on the inverse square root of turbidity removal efficiency, respectively. As the current density and EC time increased, the ODW turbidity decreased, and while higher turbidity was obtained when current densities and EC times further increased, a more appropriate turbidity was obtained in milder conditions. In agreement with Faraday’s law, the amount of the electrode that dissolves in an electrochemical cell corresponds to the electrical current. At more elevated current densities, the production of gas bubbles and coagulant species is increased, resulting in faster removal of pollutants through sedimentation or flotation [16,17,38,39]. Since the consumption of both electricity and electrode material becomes enhanced, very high current densities are not favored. The turbidity depends on the amount of produced suspended solids and the presence of gas bubbles during the electrolysis. At the beginning of the EC process, the color intensity increased due to the polymerization of the initial phenols and tannins in the sample. The increase in color intensity was followed by darkening, and finally a decrease in color intensity. [36]. The lower the turbidity of ODW and the closer it is to drinkable water (below 1 NTU), the more efficiently the system acts.

3.5. Electrode Consumption

Table 5 presents a 2FI model with real independent variables for predicting the square root of electrode consumption. The second power of current density and EC time were not effective in the predicted model, so they were removed.
Figure 5a,b present the 3D response surface and contour plots related to the impact of EC current density and time in the square root of electrode consumption, respectively. As the current density and EC time increased, the rate of electrode consumption increased, as is expected in an electrolytic process. The lowest electrode consumption (0.1 g) was obtained at a current density of 3 mA cm−2 and 10 min, while the highest electrode consumption (8.39 g) resulted in a current density of 30 mA cm−2 and 60 min. The current density showed a more significant effect on electrode consumption than EC time, so in an EC time of 35 min with an increasing current density from 3 to 16.5 mA cm−2 and 16.5 to 30 mA cm−2, the electrode consumption increased 6.4 and 2.9 times, respectively. In other words, at a constant EC time of 35 min and with an increasing current density from 3 to 30 mA cm−2, the electrode consumption increased 18.5 times (Table 2). At a current density of 16.5 mA cm−2, the increase in EC time from 10 to 35 and from 10 min 60 min was associated with a 2.5 and 5 times increase in electrode consumption, respectively. Bazrafshan et al. (2014) also reported that an increase in voltage from 10 to 60 V caused an increase in electrode consumption from 0.14 to 0.56 kg/m3 of BR−18 dye [40].

3.6. Energy Consumption

A quadratic polynomial model with real independent variables is presented in Table 5 which is for predicting the square root of energy consumption obtained. None of the terms removed because they statistically were significant in the model (p < 0.05).
Figure 6a,b show the 3D response surface and contour plots of the effect of current density and working time on the square root of energy consumption, respectively. As the current density and EC time increased, the amount of energy consumption increased. The effect of current density on energy consumption is higher than time. The lowest energy consumption (0.08 kWh m−3) was linked to the current density of 3 mA cm−2 and 10 min, while the highest energy consumption (48 kWh m−3) was observed at the current density of 30 mA cm−2 and 60 min. As can be seen in Table 2, in EC time of 35 min, with increasing current density from 3 to 16.5 mA cm−2, 16.5 to 30 mA cm−2, and 3 to 30 mA cm−2, the electrode consumption increased 25, 4, and 100 times, respectively, while at a current density of 16.5 mA cm−2, the increase in EC time from 10 to 35, 35 to 60, and 10 to 60 min was associated with a 3.5, 1.7 and 6 times increase in electrode consumption, respectively. Tian et al. (2016) studied the treatment of the household wastewater by the EC (anode: aluminum, cathode: activated carbon, electrode distance: 1.5 cm and electrolysis time: 4 h). The results showed an enhancement in the removal efficiency of pollutants along with increasing current density, which is associated with the increase in energy consumption [41].

3.7. Optimization of Electrocoagulation Operating Conditions

The optimum conditions for conducting an electrocoagulation operation were obtained by RSM based on the variables of current density and EC time. Considering the importance of phenolic compounds and their removal from the ODW, and considering the significance of the obtained model and the insignificant lack of fit for it, the optimization was first performed based on the removal efficiency of TPC. The current density and EC time were optimized in the studied range, and their importance and weight in the software were set at 3 and 1, respectively. The optimization was performed to achieve maximum TPC removal efficiency with an importance of 5 and a weight of 10. The predicted values by the model under optimal conditions are presented in Table 6. In the second step, the optimal conditions were obtained based on the maximum removal efficiency of TPC and COD. As can be seen, there was not much difference between the optimal conditions in the two procedures. To check the accuracy of the model, a practical test was performed under the predicted optimal conditions. As presented in Table 6, the predicted and real data are very close to each other, confirming the validity of the obtained models. Deghles and Kurt, used the Taguchi design to optimize the parameters affecting the removal of pollutants from leather effluent by the EC method [42]. They considered the parameters of current density, EC time, and pH as variables. The results showed that at the optimum conditions (a pH of 7.0, a current density of 50 mA cm−2, and an EC time of 25 min), the removal efficiency of COD, Cr, and color were 63.3%, 99.7%, and 82%, respectively. The operating cost was USD 0.7 m−3 per effluent.
Table 7 shows the other properties of the ODW treated under the optimum conditions predicted by the obtained models. There was no significant difference between the laboratory results in terms of electrode consumption and energy consumption. However, the ODW sample treated based on the TPC predicted model had lower turbidity. Under optimum conditions of EC, the amount of produced sludge was 7% and the water recovery efficiency was 85%. The operating cost under optimum conditions obtained based on the TPC predicted model was about USD 5.88 m−3. Kobya et al. (2006) considered the prices of USD 0.06/kWh and USD 1.80/kg Al, and estimated the EC operating cost in the current density between 50 and 300 A m−2 (for 20 min) to be USD 0.48 to 5.42 m−3 of chips wastewater. They also estimated the EC operating cost of the wastewater for 5 and 40 min to be USD 0.62 and USD 6.32 m−3 wastewater, respectively [8].

4. Conclusions

The present study aimed to optimize EC operation conditions for the reduction of TPC, COD and turbidity from ODW using RSM methodology. The optimization of EC operation conditions (current density and EC time) was performed using the central composite design. The optimal predicted conditions based on the highest removal efficiency for the TPC were a current density of 21.14 mA cm−2 and an EC time of 58.93 min, which in this case, the obtained model predicted 82.57% TPC removal. This prediction was in agreement with the laboratory result (83.5%). The results also showed that at optimum conditions, COD and turbidity were reduced to an acceptable level, and it is worthy to say that the electrode and energy consumptions in these conditions are reasonable. It seems that the characteristics of the treated ODW have sufficient standards for reuse in the production line and the debittering operation which is significant in terms of economic and environmental aspects. The debittering of olive was completed by salt solution (15% NaCl) and as a result, the ODW even after EC treatment (140.4 g L−1) contains a high concentration of salt. Therefore, serving treated ODW on the production line will save both water and salt consumption. Based on the results, it is confirmed that EC is an applicable treatment for ODW samples due to its process being faster than biological treatments. Some future studies are suggested to confirm the practical viability of the process. To run wastewater treatment on a large scale, it is required to optimize the construction of EC apparatus.

Author Contributions

Conceptualization, methodology, formal analysis, writing—original draft and review of the final manuscript, R.N.; investigation, resources, writing and review, M.J.; writing, F.S.; review and editing, S.R. All authors have read and agreed to the published version of the manuscript.

Funding

This research did not receive any specific grant from funding agencies in the public, commercial, or not-for-profit sectors.

Conflicts of Interest

The authors declare that they have no competing interests.

References

  1. Ahmadi, K.; Ebadzadeh, H.R.; Hatami, F.; Hossainpoor, R.; Abdoshah, H. Agricultural Statistics: Horticultural Crops; Ministry of Agriculture: Tehran, Iran, 2018. [Google Scholar]
  2. Omar, S.H. Oleuropein in olive and its pharmacological effects. Sci. Pharm. 2010, 78, 133–154. [Google Scholar] [CrossRef] [PubMed] [Green Version]
  3. Rajaeifar, M.A.; Akram, A.; Ghobadian, B.; Rafiee, S.; Heidari, M.D. Energy-economic life cycle assessment (lca) and greenhouse gas emissions analysis of olive oil production in iran. Energy 2014, 66, 139–149. [Google Scholar] [CrossRef]
  4. Gutiérrez-Rosales, F.; Rios, J.; Gomez-Rey, M.L. Main polyphenols in the bitter taste of virgin olive oil. Structural confirmation by on-line high-performance liquid chromatography electrospray ionization mass spectrometry. J. Agric. Food Chem. 2003, 51, 6021–6025. [Google Scholar] [CrossRef] [PubMed]
  5. Parinos, C.; Stalikas, C.; Giannopoulos, T.S.; Pilidis, G. Chemical and physicochemical profile of wastewaters produced from the different stages of spanish-style green olives processing. J. Hazard. Mater. 2007, 145, 339–343. [Google Scholar] [CrossRef]
  6. Aggelis, G.; Ehaliotis, C.; Nerud, F.; Stoychev, I.; Lyberatos, G.; Zervakis, G. Evaluation of white-rot fungi for detoxification and decolorization of effluents from the green olive debittering process. Appl. Microbiol. Biotechnol. 2002, 59, 353–360. [Google Scholar]
  7. Inan, H.; Dimoglo, A.; Şimşek, H.; Karpuzcu, M. Olive oil mill wastewater treatment by means of electro-coagulation. Sep. Purif. Technol. 2004, 36, 23–31. [Google Scholar] [CrossRef]
  8. Kobya, M.; Hiz, H.; Senturk, E.; Aydiner, C.; Demirbas, E. Treatment of potato chips manufacturing wastewater by electrocoagulation. Desalination 2006, 190, 201–211. [Google Scholar] [CrossRef]
  9. Adhoum, N.; Monser, L. Decolourization and removal of phenolic compounds from olive mill wastewater by electrocoagulation. Chem. Eng. Process. Process Intensif. 2004, 43, 1281–1287. [Google Scholar] [CrossRef]
  10. Abdelwahab, O.; Amin, N.; El-Ashtoukhy, E.Z. Electrochemical removal of phenol from oil refinery wastewater. J. Hazard. Mater. 2009, 163, 711–716. [Google Scholar] [CrossRef]
  11. Gupta, V.K.; Ali, I.; Saleh, T.A.; Nayak, A.; Agarwal, S. Chemical treatment technologies for waste-water recycling—An overview. RSC Adv. 2012, 2, 6380–6388. [Google Scholar] [CrossRef]
  12. Kim, T.; Kim, T.-K.; Zoh, K.-D. Removal mechanism of heavy metal (Cu, Ni, Zn, and Cr) in the presence of cyanide during electrocoagulation using Fe and Al electrodes. J. Water Process Eng. 2020, 33, 101–109. [Google Scholar] [CrossRef]
  13. Padmaja, K.; Cherukuri, J.; Reddy, M.A. A comparative study of the efficiency of chemical coagulation and electrocoagulation methods in the treatment of pharmaceutical effluent. J. Water Process Eng. 2020, 34, 101–153. [Google Scholar] [CrossRef]
  14. Asselin, M.; Drogui, P.; Benmoussa, H.; Blais, J.-F. Effectiveness of electrocoagulation process in removing organic compounds from slaughterhouse wastewater using monopolar and bipolar electrolytic cells. Chemosphere 2008, 72, 1727–1733. [Google Scholar] [CrossRef]
  15. Boudjema, N.; Drouiche, N.; Abdi, N.; Grib, H.; Lounici, H.; Pauss, A.; Mameri, N. Treatment of oued el harrach river water by electrocoagulation noting the effect of the electric field on microorganisms. J. Taiwan Inst. Chem. Eng. 2014, 45, 1564–1570. [Google Scholar] [CrossRef]
  16. Janpoor, F.; Torabian, A.; Khatibikamal, V. Treatment of laundry waste-water by electrocoagulation. J. Chem. Technol. Biotechnol. 2011, 86, 1113–1120. [Google Scholar] [CrossRef]
  17. Kuokkanen, V.; Kuokkanen, T. Recent applications of electrocoagulation in treatment of water and wastewater—A review. Green Sustain. Chem. 2013, 3, 89–121. [Google Scholar] [CrossRef] [Green Version]
  18. Chen, X.; Chen, G.; Yue, P.L. Separation of pollutants from restaurant wastewater by electrocoagulation. Sep. Purif. Technol. 2000, 19, 65–76. [Google Scholar] [CrossRef]
  19. Şengil, İ.A. Treatment of dairy wastewaters by electrocoagulation using mild steel electrodes. J. Hazard. Mater. 2006, 137, 1197–1205. [Google Scholar] [CrossRef]
  20. Ün, Ü.T.; Uğur, S.; Koparal, A.; Öğütveren, Ü.B. Electrocoagulation of olive mill wastewaters. Sep. Purif. Technol. 2006, 52, 136–141. [Google Scholar]
  21. Benekos, A.K.; Zampeta, C.; Argyriou, R.; Economou, C.N.; Triantaphyllidou, I.-E.; Tatoulis, T.I.; Tekerlekopoulou, A.G.; Vayenas, D.V. Treatment of table olive processing wastewaters using electrocoagulation in laboratory and pilot-scale reactors. Process Saf. Environ. Prot. 2019, 131, 38–47. [Google Scholar] [CrossRef]
  22. García-García, P.; López-López, A.; Moreno-Baquero, J.M.; Garrido-Fernández, A. Treatment of wastewaters from the green table olive packaging industry using electro-coagulation. Chem. Eng. J. 2011, 170, 59–66. [Google Scholar] [CrossRef]
  23. Hanafi, F.; Assobhei, O.; Mountadar, M. Detoxification and discoloration of moroccan olive mill wastewater by electrocoagulation. J. Hazard. Mater. 2010, 174, 807–812. [Google Scholar] [CrossRef] [PubMed]
  24. Niazmand, R.; Jahani, M.; Kalantarian, S. Treatment of olive processing wastewater by electrocoagulation: An effectiveness and economic assessment. J. Environ. Manag. 2019, 248, 109262. [Google Scholar] [CrossRef] [PubMed]
  25. Zongo, I.; Maiga, A.H.; Wethe, J.; Valentin, G.; Leclerc, J.-P.; Paternotte, G.; Lapicque, F. Electrocoagulation for the treatment of textile wastewaters with Al or Fe electrodes: Compared variations of cod levels, turbidity and absorbance. J. Hazard. Mater. 2009, 169, 70–76. [Google Scholar] [CrossRef]
  26. Chen, G. Electrochemical technologies in wastewater treatment. Sep. Purif. Technol. 2004, 38, 11–41. [Google Scholar] [CrossRef]
  27. Yassine, W.; Akazdam, S.; Zyade, S.; Gourich, B. Treatement of olive mill wastewater using electrocoagulation process. J. Appl. Surf. Interfaces 2018, 4, 1–13. [Google Scholar]
  28. Jalali Mousavi, S.R.; Niazmand, R.; Noghabi, M.S. Antioxidant activity of purslane (portulaca oleracea l.) seed hydro-alcoholic extract on the stability of soybean oil. J. Agric. Sci. Technol. 2015, 17, 1473–1480. [Google Scholar]
  29. Carranzo, I.V. Standard methods for examination of water and wastewater. In Anales De Hidrología Médica; Universidad Complutense de Madrid: Madrid, Germany, 2012; Volume 5, p. 185. [Google Scholar]
  30. Olya, M.E.; Pirkarami, A. Electrocoagulation for the removal of phenol and aldehyde contaminants from resin effluent. Water Sci. Technol. 2013, 68, 1940–1949. [Google Scholar] [CrossRef]
  31. Un, U.T.; Koparal, A.S.; Ogutveren, U.B. Electrocoagulation of vegetable oil refinery wastewater using aluminum electrodes. J. Environ. Manag. 2009, 90, 428–433. [Google Scholar]
  32. Benaissa, F.; Kermet-Said, H.; Moulai-Mostefa, N. Optimization and kinetic modeling of electrocoagulation treatment of dairy wastewater. Desalin. Water Treat. 2016, 57, 5988–5994. [Google Scholar] [CrossRef]
  33. Ogando FI, B.; de Aguiar, C.L.; Viotto JV, N.; Heredia, F.J.; Hernanz, D. Removal of phenolic, turbidity and color in sugarcane juice by electrocoagulation as a sulfur-free process. Food Res. Int. 2019, 122, 643–652. [Google Scholar] [CrossRef] [PubMed]
  34. Jeong, H.; Lee, J.; Ju, Y.M.; Lee, S.M. Using electro-coagulation treatment to remove phenolic compounds and furan derivatives in hydrolysates resulting from pilot-scale supercritical water hydrolysis of mongolian oak. Renew. Energy 2019, 138, 971–979. [Google Scholar] [CrossRef]
  35. Terrazas, E.; Vázquez, A.; Briones, R.; Lázaro, I.; Rodríguez, I. Ec treatment for reuse of tissue paper wastewater: Aspects that affect energy consumption. J. Hazard. Mater. 2010, 181, 809–816. [Google Scholar] [CrossRef] [PubMed]
  36. Khoufi, S.; Feki, F.; Sayadi, S. Detoxification of olive mill wastewater by electrocoagulation and sedimentation processes. J. Hazard. Mater. 2007, 142, 58–67. [Google Scholar] [CrossRef]
  37. Tchamango, S.; Kamdoum, O.; Donfack, D.; Babale, D.; Ngameni, E. Comparison of electrocoagulation and chemical coagulation in the treatment of artisanal tannery effluents. Niger. J. Technol. 2016, 35, 219–225. [Google Scholar] [CrossRef]
  38. El-Ashtoukhy, E.; El-Taweel, Y.; Abdelwahab, O.; Nassef, E. Treatment of petrochemical wastewater containing phenolic compounds by electrocoagulation using a fixed bed electrochemical reactor. Int. J. Electroch. Sci. 2013, 8, 1534–1550. [Google Scholar]
  39. Nanseu-Njiki, C.P.; Tchamango, S.R.; Ngom, P.C.; Darchen, A.; Ngameni, E. Mercury (II) removal from water by electrocoagulation using aluminium and iron electrodes. J. Hazard. Mater. 2009, 168, 1430–1436. [Google Scholar] [CrossRef]
  40. Bazrafshan, E.; Mahvi, A.H. Textile wastewater treatment by electrocoagulation process using aluminum electrodes. Iran. J. Health Sci. 2014, 2, 16–29. [Google Scholar] [CrossRef] [Green Version]
  41. Tian, Y.; He, W.; Zhu, X.; Yang, W.; Ren, N.; Logan, B.E. Energy efficient electrocoagulation using an air-breathing cathode to remove nutrients from wastewater. Chem. Eng. J. 2016, 292, 308–314. [Google Scholar] [CrossRef]
  42. Deghles, A.; Kurt, U. Treatment of raw tannery wastewater by electrocoagulation technique: Optimization of effective parameters using taguchi method. Desalin. Water Treat. 2016, 57, 14798–14809. [Google Scholar] [CrossRef]
Figure 1. The electrocoagulation–filtration set-up used in the laboratory analysis.
Water 12 01687 g001
Figure 2. 3D response surface plot (a), and contour plot (b) of the effect of current density and EC time on removal efficiency of TPC.
Water 12 01687 g002
Figure 3. 3D response surface plot (a), and contour plot (b) of the effect of current density and EC time on removal efficiency of COD.
Water 12 01687 g003
Figure 4. 3D response surface (a) and contour (b) plots of the effect of current density and EC time on the inverse square root of turbidity.
Water 12 01687 g004
Figure 5. 3D response surface (a) and contour (b) plots of the effect of current density and EC time on the square root of electrode consumption.
Water 12 01687 g005
Figure 6. 3D response surface (a) and contour (b) plots of the effect of current density and EC time on the square root of energy consumption.
Water 12 01687 g006
Table 1. Chemical properties (mean ± SD) of the fresh olive debittering wastewater sample.
Parameter Level
Total phenolic compounds (mg L−1)(3.330 ± 0.014) × 103
Chemical oxygen demand (mg L−1)(2.0124 ± 0.0073) × 104
Biochemical oxygen demand for 5 days at 20 °C (mg L−1)(1.000 ± 0.052) × 102
Salt concentration (g L−1)(1.580 ± 0.063) × 102
Conductivity (mS cm−1)(1.628 ± 0.023) × 102
Turbidity (NTU)(1.52 ± 0.06) × 101
Table 2. Properties of ODW after EC treatment based on RSM.
Experiment No.Current Density (mA/cm2)EC Time (min)TPC (mg L−1)COD (mg L−1)Turbidity (NTU)Electrode Consumption (g)Energy Consumption (kWh m−3)
116.53510858908.42.141.677
216.56070075960.53.2112
316.53510268822.62.051.587
43010171510,724181.828
5310301025,87031.51.00.08
6360174315,070.28.90.40.48
716.510180613,125.4220.642
816.53511159050.12.51.487
916.535106288802.71.637
103035131991563.24.6228
1116.53511028920.42.51.57
12306010207952.80.418.3948
13335229621,75632.50.250.28
Table 3. ANOVA results of the model obtained for the effect of current density and EC time on TPC, COD, and turbidity removal efficiency (R).
SourceDOFMSF Valuep Value
RTPCRCODRturbidityRTPCRCODRturbidityRTPCRCODRturbidityRTPCRCODRturbidity
Model545659.221218.980.44360.49165.9831.04<0.0001<0.00010.0001
Current density1111011.232554.600.46552.99347.8532.44<0.0001<0.0001<0.0001
EC time1111061.131061.131.20580.27580.2784.04<0.0001<0.0001<0.0001
Current density × EC time11155.33203.210.3430.2627.6723.910.00090.00080.0018
Current density2111854.101351.330.19467.06184.0013.14<0.0001<0.0001<0.0084
EC time21-127.65-0.09515.12-6.670.0060-0.0364
Residuals7871.837.340.014------
Lack of fit3433.1514.600.0313.76164.9221.660.11670.00010.0062
Pure error4440.840.0841.450 × 10−3------
Total121212---------
RTPC
Std. Dev. = 1.35Mean =61.99R2pred = 0.9752R2 = 0.9961R2Adjusted = 0.9934C.V% = 2.18PRESS = 81.93
RCOD
Std. Dev = 2.71Mean =57.43R2pred = 0.9568R2 = 0.9881R2Adjusted = 0.9821C.V% = 4.72PRESS = 212.96
Rturbidity
Std. Dev = 0.12Mean =0.61R2pred = 0.5848R2 = 0.9568R2Adjusted = 0.9260C.V% = 19.60PRESS = 0.96
DOF: Degrees of freedom; MS: Mean of squares; C.V: Coefficient of variable.
Table 4. ANOVA results of models obtained for the effect of current density and EC time on the electrode and energy consumptions.
SourceDOFMSF Valuep Value
Electrode ConsumptionEnergy ConsumptionElectrode ConsumptionEnergy ConsumptionElectrode ConsumptionEnergy ConsumptionElectrode ConsumptionEnergy Consumption
Model351.948.271199.95958.98<0.0001<0.0001
Current density114.0830.572524.133543.11<0.0001<0.0001
EC time111.367.17841.12831.18<0.0001<0.0001
Current density × EC time110.383.40234.60394.490.0001<0.0001
Current density2-1-0.18-20.75-0.0026
EC time2-1-0.13-15.01-0.0061
Residuals971.616 × 10−38.628 × 10⁻³----
Lack of fit532.058 × 10−30.0201.94-0.2705-
Pure error441.062 × 10−30.00----
Total1212------
Electrode Consumption
Std. Dev = 0.040Mean = 1.28R2pred = 0.9952R2 = 0.997C.V% = 3.13R2Adjusted = 0.9967PRESS = 0.028
Energy Consumption
Std. Dev = 0.093Mean = 2.67R2pred = 0.9852R2 = 0.9985C.V% = 3.48R2Adjusted = 0.9975PRESS = 0.61
DOF: Degrees of freedom; MS: Mean of squares; C.V: Coefficient of variable.
Table 5. Experimental models for predicting the studied parameters of ODW after applying the EC treatment.
Parameters Equation for Real Variables
TPC removal efficiency (%)−1.75273 + 4.53150A + 1.06814B − 0.011020AB − 0.096490A2 − 5.06237E − 003B2
COD removal efficiency (%)−16.92197 + 5.97080A + 0.80065B − 0.021119AB − 0.11222A2
Inverse square root of turbidity (NTU−½)0.15305 + 0.037499A − 0.017195B + 8.65932E − 004AB − 1.43084E − 003A2 + 2.97155E − 004B2
Square root of electrode consumption (g½)0.137680 + 0.029145A + 3.98708E − 003B + 9.12036E − 004AB
Square root of energy consumption (Kwh/m3)½−0.10653 + 0.025439A + 0.022889B + 2.73318E − 003AB + 1.39699E − 003A2 − 3.46508E − 004B2
A: Current density (range 3 to 30 mA cm−2); B: EC time (range 10 to 60 min).
Table 6. Optimal conditions of predicted and laboratory variables and responses based on TPC and COD removal efficiency.
The Basis of OptimizationCurrent Density (mA/cm2)EC Time (min)TPC Removal (%)COD Removal (%)Desirability
PredictedRealPredictedReal
TPC removal efficiency21.158.982.683.5--1.00
TPC and COD removal efficiency19.958.482.685.278.675.31.00
Table 7. Other properties of ODW after electrocoagulation under predicted optimal conditions by FCCD.
Sample ModelTurbidity (NTU)Electrode Consumption (Kg m−3)Energy Consumption (Kwh m−3)Operating Cost (USD m−3)
Fresh ODW-17.8---
Treated ODWBased on TPC optimization (current density: 19.98 mA cm−2, EC time: 58.39 min)0.361.914.015.88
Based on TPC and COD optimization (current density: 21.14 mA cm−2, EC time: 58.93 min)0.752.114.926.49

