Article

Urban Water Demand Prediction for a City That Suffers from Climate Change and Population Growth: Gauteng Province Case Study

1
Department of Civil Engineering, Wasit University, Wasit 52001, Iraq
2
Department of Applied Mathematics, Liverpool John Moores University, Liverpool L3 3AF, UK
3
Department of Mechanical Engineering, Wasit University, Wasit 52001, Iraq
4
Built Environment and Sustainable Technologies (BEST) Research Institute, Liverpool John Moores University, Liverpool L3 3AF, UK
5
Department of Environment Engineering, Babylon University, Babylon 51001, Iraq
6
Department of Medical Instrumentation Techniques Engineering, Electrical Engineering Technical College, Middle Technical University, Baghdad 10022, Iraq
*
Author to whom correspondence should be addressed.
Water 2020, 12(7), 1885; https://doi.org/10.3390/w12071885
Submission received: 24 May 2020 / Revised: 25 June 2020 / Accepted: 26 June 2020 / Published: 1 July 2020
(This article belongs to the Special Issue Advanced Applications of Electrocoagulation in Water and Wastewater)

Abstract

:
The proper management of a municipal water system is essential to sustain cities and support the water security of societies. Urban water estimating has always been a challenging task for managers of water utilities and policymakers. This paper applies a novel methodology that includes data pre-processing and an Artificial Neural Network (ANN) optimized with the Backtracking Search Algorithm (BSA-ANN) to estimate monthly water demand in relation to previous water consumption. Historical data of monthly water consumption in the Gauteng Province, South Africa, for the period 2007–2016, were selected for the creation and evaluation of the methodology. Data pre-processing techniques played a crucial role in the enhancing of the quality of the data before creating the prediction model. The BSA-ANN model yielded the best result with a root mean square error and a coefficient of efficiency of 0.0099 mega liters and 0.979, respectively. Moreover, it proved more efficient and reliable than the Crow Search Algorithm (CSA-ANN), based on the scale of error. Overall, this paper presents a new application for the hybrid model BSA-ANN that can be successfully used to predict water demand with high accuracy, in a city that heavily suffers from the impact of climate change and population growth.

1. Introduction

Urban water security is essential to get a resilient environment in smart cities, particularly under the stress of climate change and socio-economic factors [1,2]. Moreover, cities located close to water resources are driven by all kinds of industries, hence a lack of water lack is considered a classic problem for decision makers [3,4]. Since the last century, gradual changes in freshwater resources have been observed [5]. Recent studies related to climate change have shown that it plays a key role in freshwater resources due to the potential decrease in rainfall amount [6]. Specifically, it has been shown that climate change adversely impacts freshwater resources in the center of cities, which in turn impacts the sustainable development of water availability and consequently impacts socio-economic activities [7]. In addition, several studies have shown that freshwater resources are generally adversely affected by pollution [8,9].
Different regions in the world have been facing water scarcity situations, which implies that the gap between water supply and demand is likely to increase in the future. The European Environment Agency in 2010 reported that municipal water consumption is driven by complicated interactions between anthropogenic and natural system factors at multiple spatial and temporal scales [10,11,12]. In the Gauteng Province, the Republic of South Africa, the municipal water delivered has been less than the demand. This imbalance is due to the impact of climate change, rainfall reduction, as well as others that are human related, such as economic expansion and population growth. The lack of freshwater resources and the increase in water demand has put pressure on the municipal water supply system. This highlights the importance of using the prediction of water demands as an effective approach for optimizing the operation and management of the system, or planning for future expansion or reduction under the variability of climate and socio-economic factors [2,13,14].
House-Peters and Chang [15], Donkor et al. [16], Ghalehkhondabi et al. [17] and de Souza Groppo et al. [18] stated that different methods and models have been applied in previous studies to predict municipal water demand, including traditional, Artificial Intelligence (AI), and hybrid AI models. Traditional models, such as time-series analysis and regression [19,20], were firstly employed in water demand simulation. However, traditional approaches lacked accuracy when forecasting water demand, which can cause significant issues in the operation and management of the water supply system. Additionally, the growth of the impact of climate change and urbanization cause high uncertainty, making the prediction and forecasting more complex, which also motivated researchers to further develop their models [21], including the use of AI techniques.
Data-driven techniques have far-ranging applications, such as wastewater [22,23], water demand [24,25], and groundwater levels [26]. Some of these techniques include the support vector machine (SVM) [27], extreme learning machine (ELM) [24], and random forest (RF) [28]. One of these AI techniques is Artificial Neural Networks (ANN) [29], which is a powerful technique that has been widely used in hydraulic modelling in recent years. It has the capability to deal with complex and nonlinear relationships between inputs and outputs [30,31]. The results obtained when applying ANN have been superior to all types of conventional model in many scenarios, for example, Mouatadid and Adamowski [32] and Guo et al. [33]. However, there are cases where conventional methods performed as well as or even better than ANN in terms of accuracy, such as Li et al. [27]. The latter can be due to a number of reasons, for example that the models falling into a local instead of the global minimum, leading to a sub-optimal solution [34], or not using the right network design or hyperparameters for training the neural network [35]. Hence, in order to avoid these drawbacks, different approaches have been combined with the ANN model, such as heuristic algorithms [36], and different hybrid models have been proposed.
A hybrid model contains two or more techniques; one of them would work as the primary model, while others would act as pre-processing or post-processing approaches [37]. Hybrid models have been used to simulate municipal water demand using different techniques and in different scenarios, and the results have revealed that these models are robust and insightful, e.g., Altunkaynak and Nigussie [38], Seo et al. [24], Pacchin et al. [39], Ebrahim Banihabib and Mousavi-Mirkalaei [2] and Rasifaghihi et al. [40].
Eggimann et al. [41] reviewed various techniques of data pre-processing that have been used for municipal water management. The reviewed article reveals that data pre-processing techniques have an important potential advantage for optimizing the performance of prediction models. It has applied successfully in different areas of study, e.g., monthly rainfall forecasting [42], irrigation water prediction [43] and urban water demand prediction [24].
Various optimization techniques have been applied to solve problems in engineering applications. The optimization algorithms aim to detect optimal values for the parameters of the system under various conditions [44]. Lately, the crow search algorithm (CSA), a recently proposed metaheuristic algorithm, has been used to tackle a variety of optimization engineering issues [45]. CSA was applied to solve optimization issues in different engineering sectors, such as the optimization of energy problems [45], economic environmental dispatch [46], the selection of the optimal size of conductor in radial distribution networks [47], water demand prediction [48] and to solve constrained engineering [49]. In this study, the CSA will be hybridized with the ANN model to select the best hyperparameters of the ANN model.
From the application area viewpoint, another significant consideration is the selection of the best model input that drives the dependent variable [50,51]. Several techniques were applied in different studies, such as principal component analysis (PCA) [52,53], variance inflation factor (VIF) [21,35] and mutual information (MI) [54,55]. In this study, the mutual information technique was used to select the best scenario of model input based on several historical observed water consumption data.
According to the literature review, another significant consideration is that most of the studies focus on a short-term water demand estimate, while only a few deal with medium- to long-term prediction. Lately, various studies, such as [33,56,57,58], have employed historical data of water consumption as a single input in their short-term prediction models.
However, a challenge still exists for managers of water utilities and policymakers due to the uncertainty to gain knowledge about the capacity of the water system under potential rapid growth in urban water demand as a consequence of socio-economic, demographic and climate factors. Moreover, as mentioned previously, only a few studies have considered medium-term municipal water demand based on previous water consumption. Therefore, these aforementioned problems motivated us to propose an approach that would refine those existing approaches, providing managers with scientific, more accurate insights about the future water demand, reducing the uncertainty.
The main objectives of this research study are:
  • To improve the quality of the data and to choose the best model input scenario by applying data pre-processing techniques.
  • To select the optimum values of ANN hyperparameters by using the Backtracking Search Algorithm and Artificial Neural Network (BSA-ANN) technique. Moreover, to evaluate how BSA-ANN performs in comparison with a CSA-ANN algorithm.
  • To assess the performance of the novel methodology to predict medium-term municipal water demand in relation to some lags time of observed water consumption.
  • To reduce the uncertainty for decision makers by using a novel and refined model, which involves data pre-processing methods (to improve the quality of data and select the model input), and employing a more sophisticated approach for model prediction (using combined techniques to enhance the accuracy of results, and the stand-alone ANN to confirm the results of the hybrid model).
Based on the literature review, the research is thought to be the first study that used this novel combined methodology, which includes data pre-processing and automated machine learning to forecast municipal water demand depending on some lags’ values of water consumption as model input. As such, it is considering the effect of all climate, demographic and socio-economic factors.

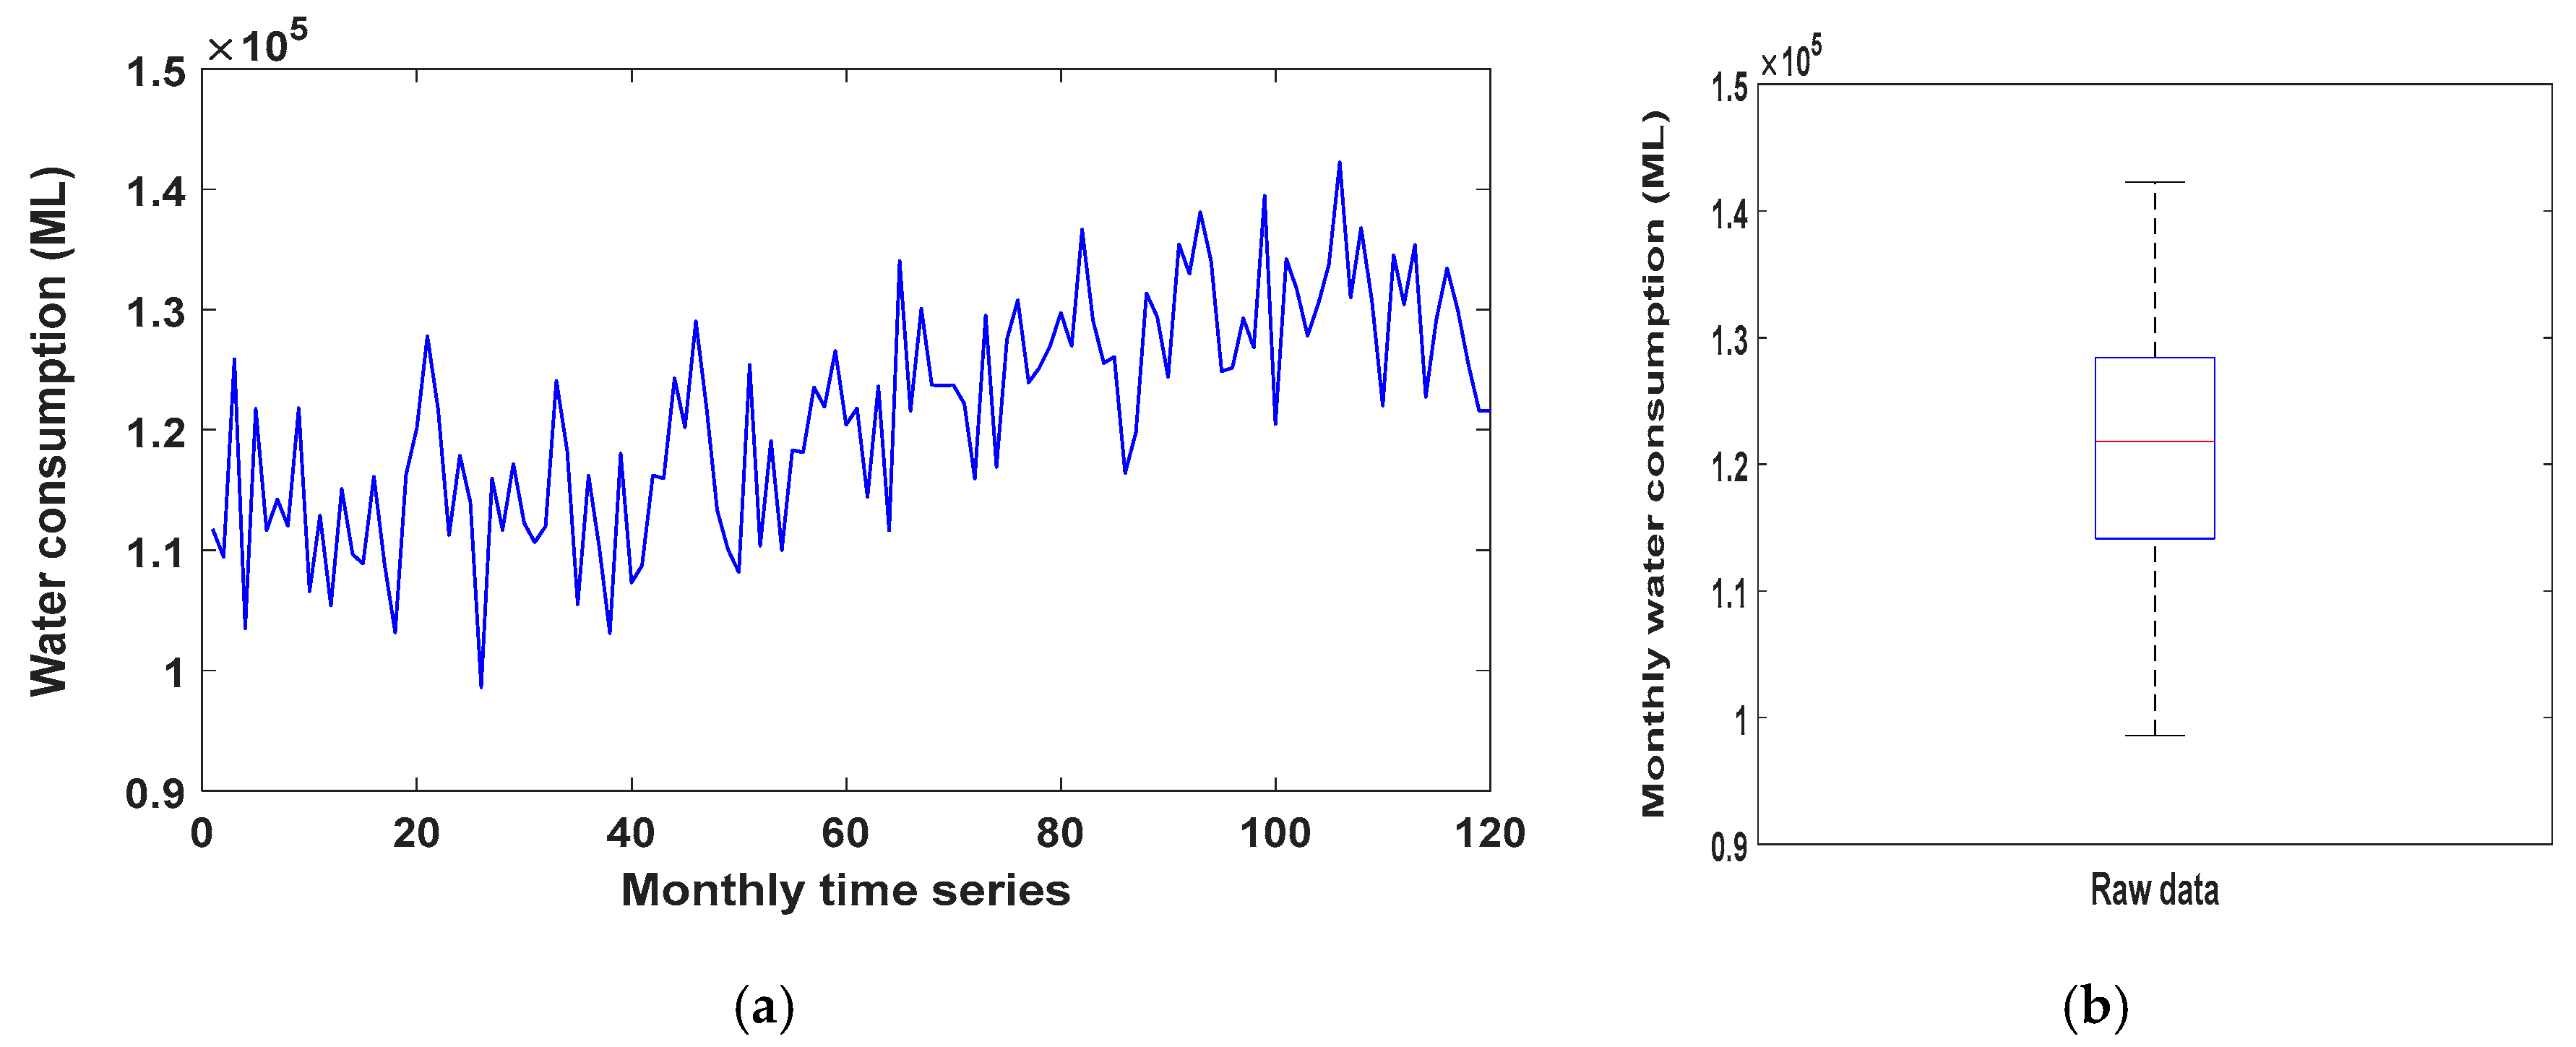
2. Study Area and Data Collection

Gauteng province is the economic powerhouse of the Republic of South Africa, which has eight metropolitan municipalities. This city faced water stress that resulted from climate change, the average annual rainfall was below the world’s average of 363 mm, and from human factors (such as population growth and economic expansion). More than 60% of the population live in the urban regions in South Africa, and Gauteng province receives the most migrants in this country. For this city, it is anticipated that the water demand would outstrip the water delivered by 2025. For more than a century, the company Rand Water has delivered municipal water to more than 9 million people and different industries in the Gauteng province, with more than 3000 km of pipeline. The lack of freshwater resources in the Gauteng province has motivated Rand Water to increase storage capacity by constructing new dams and water transfer schemes from several rivers of different regions, such as the Vaal, Tugela and Orange rivers [13,59,60].
Historical monthly data of municipal water consumption (in Mega liters, ML) over ten years from 2007 to 2016 were provided by Rand Water and used to build and assess the model. Two pre-tests were applied to these data by SPSS (24) package, one of them being Komarov-Semenove test to assess normality and the other one being a box-whisker test to check for outliers. The results show that these data are normally distributed, the value of significance is 0.2 > 0.05, and data are clean from outliers. The data lies between ±1.5 IQR (interquartile range). These results increase the reliability on the quality of data received from the company. Figure 1 shows the municipal water consumption: (a) monthly time series, (b) boxplot for Rand Water company.

3. Methodology

The proposed methodology can be divided into four parts, including data pre-processing, Artificial Neural Network, Backtracking Search Algorithm and model evaluation.

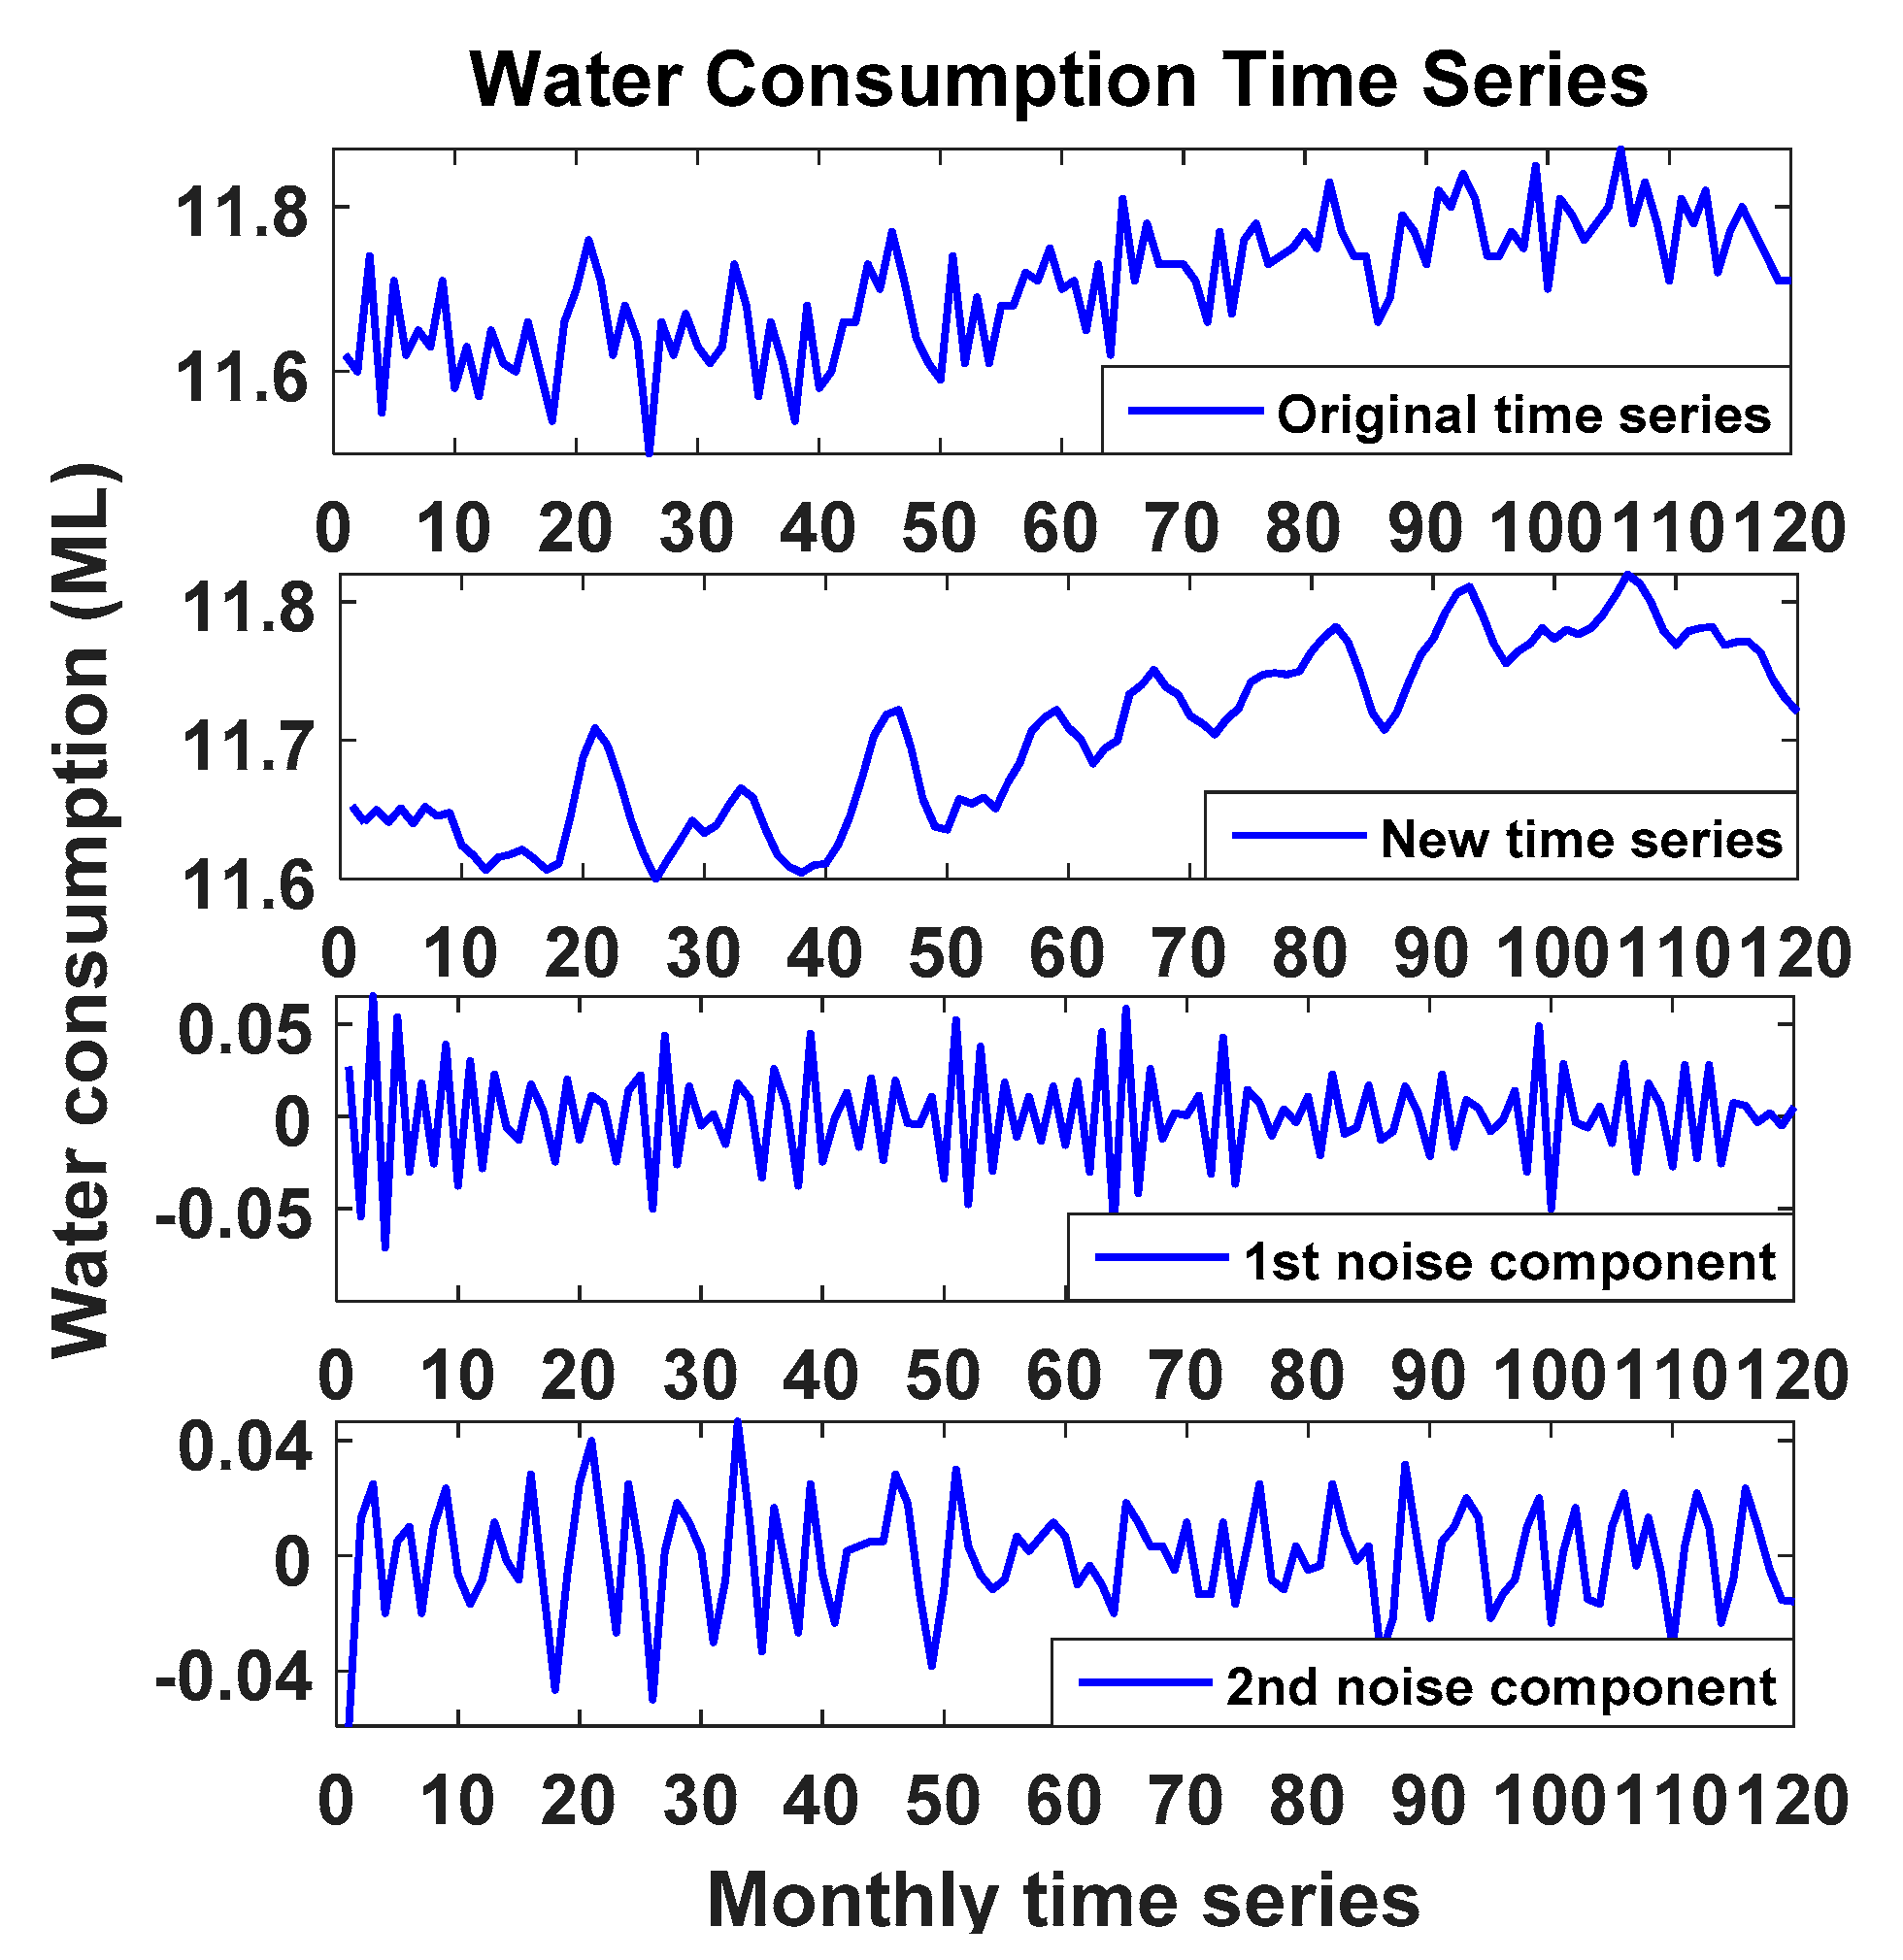
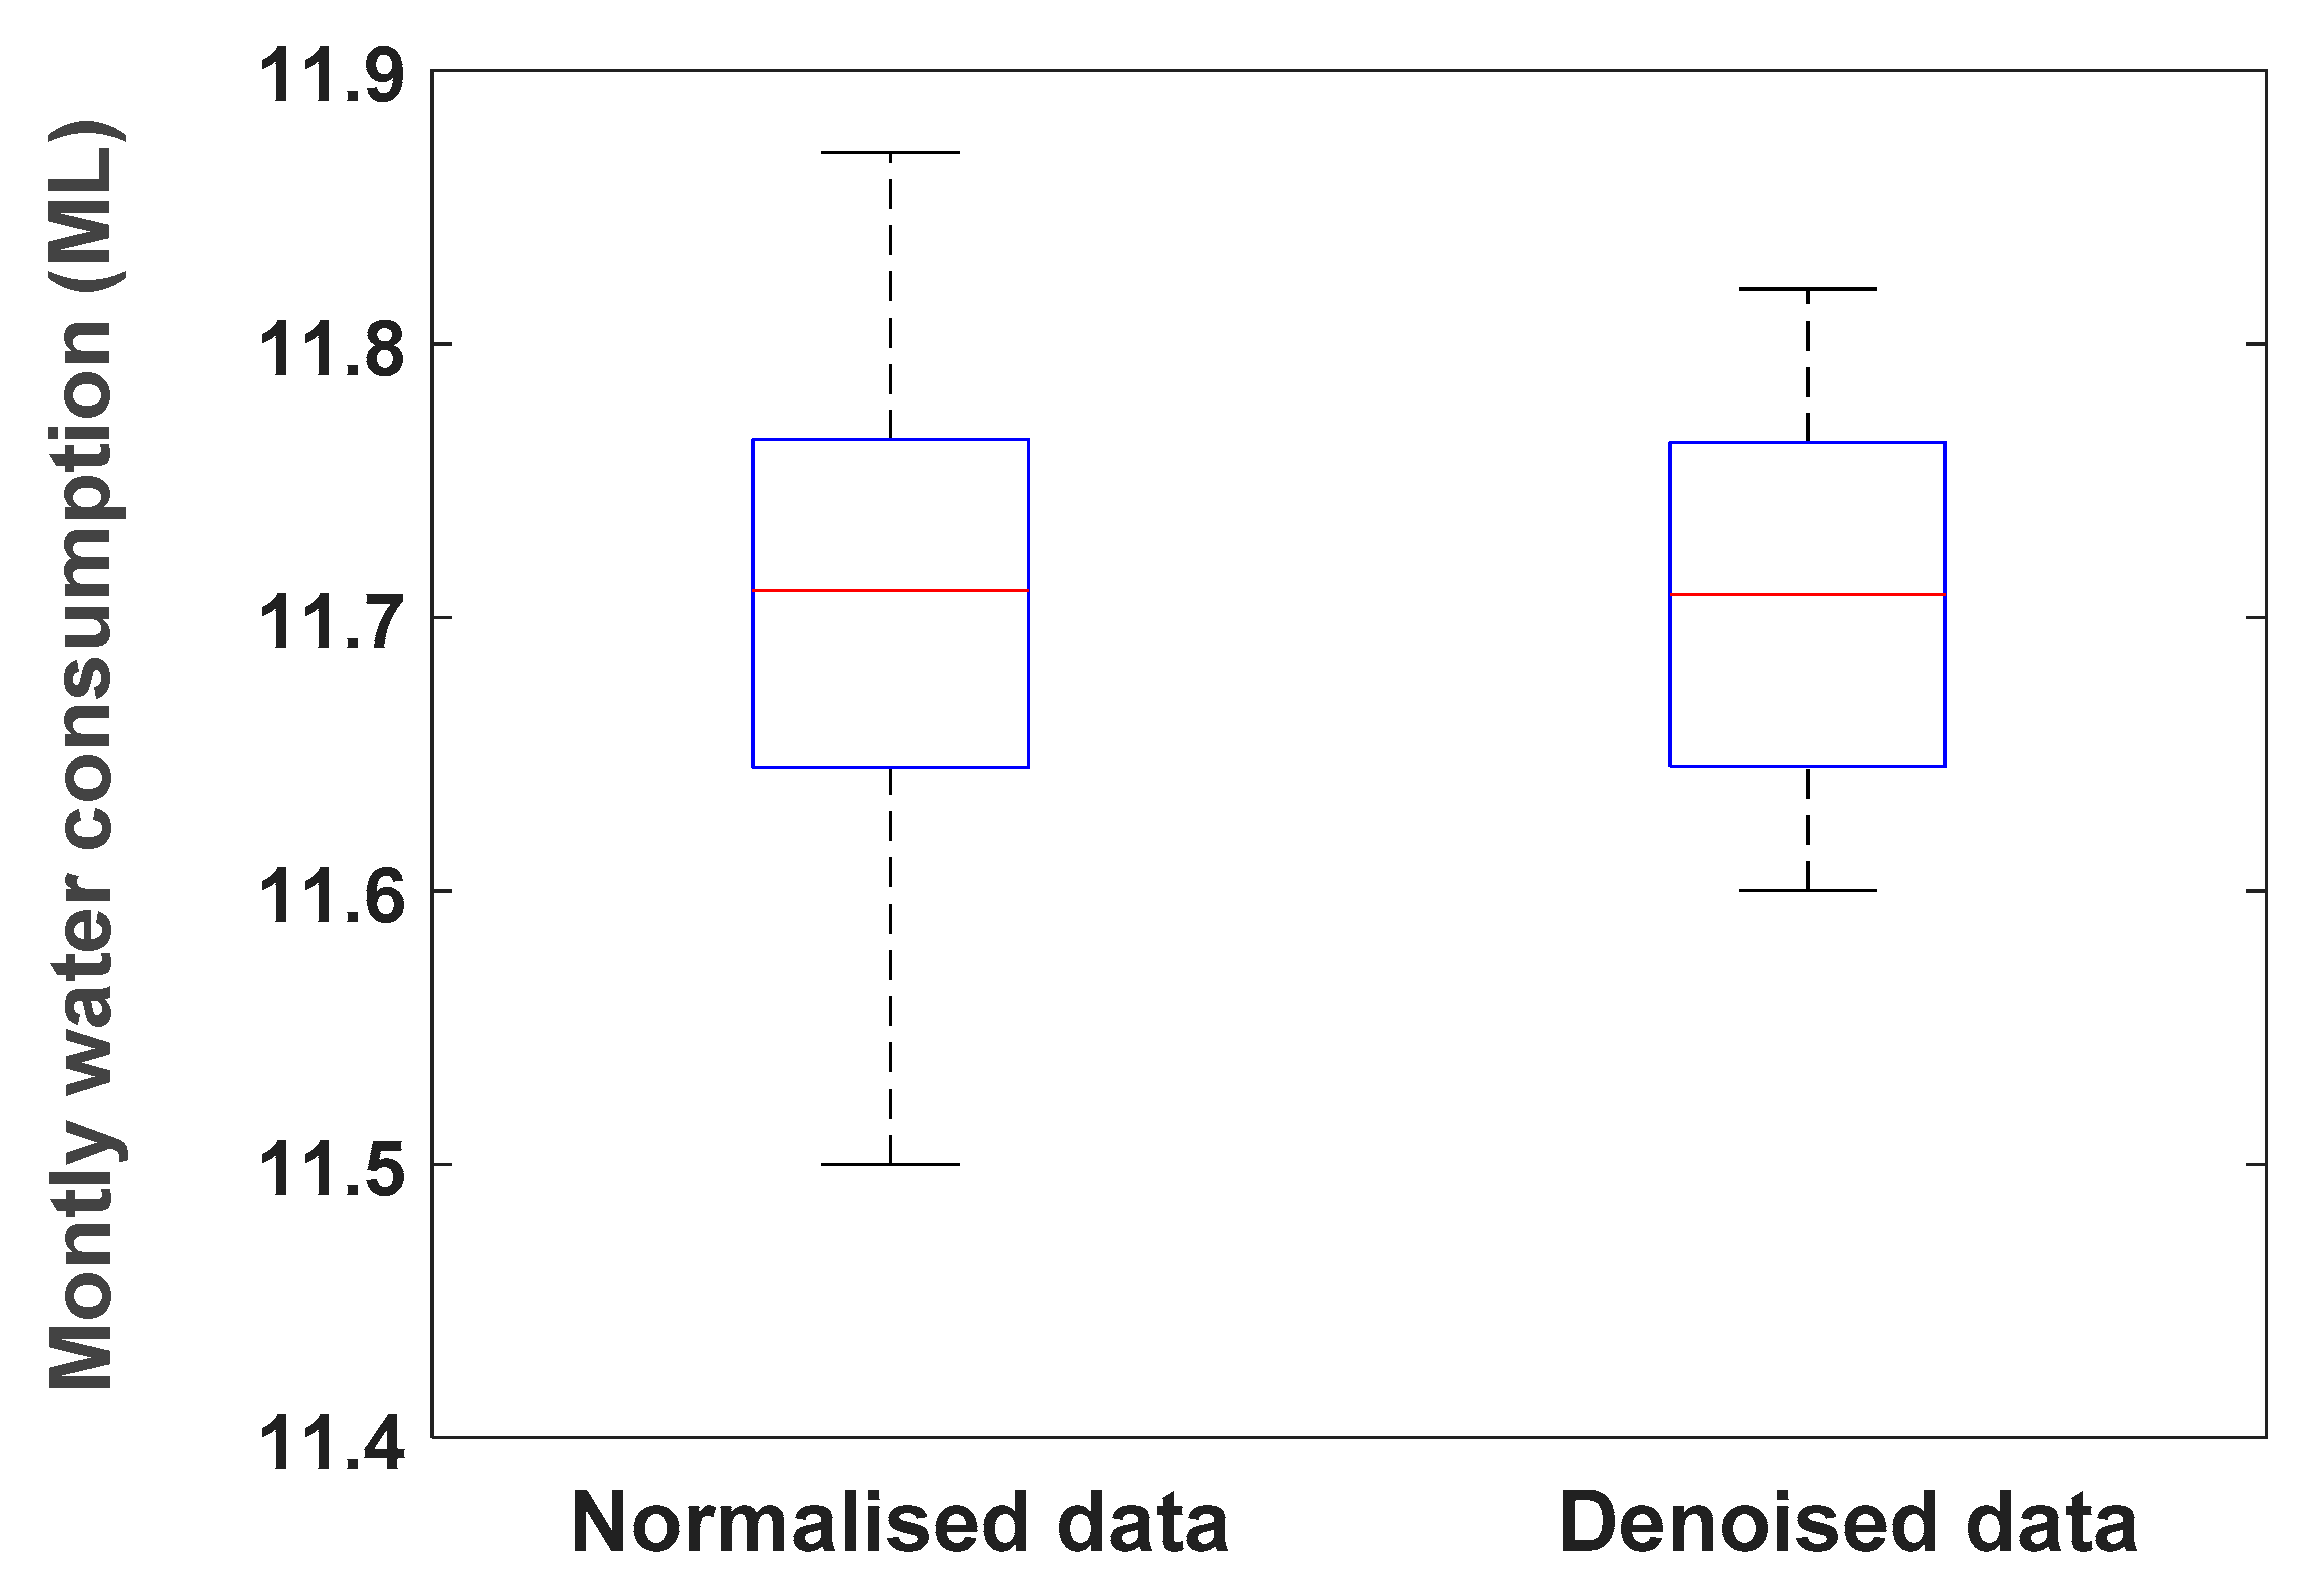
3.1. Data Pre-processing

Pre-processing the data has a significant effect on the quality of the model produced. At this stage, we perform three steps: the normalization, cleaning and selection of the best model inputs. Data normalization aims to have the same range of values for each of the inputs to the ANN model and to make the time series normally or close to normally distributed, as it would assist the stable convergence of the weights and biases as well as reduce the impact of noise [61]. In this research, a natural logarithm was used for normalizing the data because it has the ability to minimize the effects of the multicollinearity between independent variables [37].
The aim of the cleaning approach is to detect and remove the noise from the time series to increase the regression coefficient and decrease the scale of error [21]. All the time series have different components of noise, and the pre-treatment signal is one of the best approaches that denoises the raw time series by decomposing them into different components [62]. This approach can be applied for both linear and nonlinear time series with different sample sizes—short, medium and long term. It does not need any assumption of statistical criteria such as normality of error, linearity and stationery of the series [62,63]. More details about the pre-treatment technique can be found in Golyandina and Zhigljavsky [64]. This technique has been applied in several research areas, including predicting stochastic processes [65], hydrology [66] and economics [63].
The selection of the best model input represents one of the most important stages in data pre-processing in general, which is also the case when modelling the forecast of water demand [31]. In this research, the choice of the best explanatory variables is performed by applying Mutual Information (MI) technique. It is used for measuring the statistical correlation between the original time series and the lagged components. This technique enables the selection of the highest correlation components that have the greater mutual information [67].

3.2. Artificial Neural Network (ANN)

ANN is a method inspired by the way the human brain processes data, and emulates its functionality by using similar operations and connectivity as a biological neural system [29,30,68]. Recently, ANN models have been widely utilized in water resources and hydrology applications because of its ability to extract complex nonlinear relationships, which exist within the hydrology data [30,31].
In this study, the multilayer perceptron (MLP) is applied to simulate municipal water demand. MLP has been frequently and successfully used for the forecast of water resources and hydrology applications. Its architecture and hyperparameters (as shown in Table 1) are layered as a feedforward neural network (FFNN) and can be trained using learning algorithms such as the backpropagation of the error (BP) [69] and the Levenberg–Marquardt (LM) [70,71]. It has been reported that the latter is better at limiting the errors of the ANN [30,31]. As in Zubaidi et al. [37,48], the structure of the MLP contains four layers, the first one being the input layer, which has the model inputs representing water consumption lags, followed by two hidden layers and one output layer, which has the water demand. Two types of activation functions have been used: a tan-sigmoidal function in the hidden layers, as in Yonaba et al. [72], and a linear activation function in the output layer for covering the positive values of urban water demand, as successfully used in Zubaidi et al. [21]. The ANN model was integrated by using backtracking search optimization algorithm (BSA-ANN) to locate the optimum hidden neurons’ number and optimal coefficient of learning rate that maximizes the ability and reliability of the ANN technique [36,73]. The training process of the ANN model is repeated a large number of times over an epoch (i.e., 1000 iterations) until the error between the observed and simulated urban water reaches its minimum. The data were split randomly into three sets 70% for training, 15% for testing and 15% for validation, as previously conducted by Zubaidi et al. [21] and Zubaidi et al. [35]. As in Gharghan et al. [36], cross-validation was used to ensure the generalization capabilities of the model and avoid overfitting, and the stopping criterion for training was done using the root mean square error (RMSE) as an objective function (i.e., error not more than the value of RMSE in the testing stage). This procedure was also used successfully by Zubaidi et al. [37,48].

3.3. Backtracking Search Algorithm (BSA)

The BSA algorithm is an evolutionary algorithm, proposed by Civicioglu to remedy the complex problems of numerical optimization, e.g., highly nonlinear, non-differentiable, constrained design problems and multimodality [73,74,75]. BSA has been broadly applied to tackle different types of engineering optimization issues, e.g., numerical function optimization [74], constrained engineering optimization problems [75], wireless sensor [36], and home energy management [44]. It can be sorted into five stages: initialization, selection-I, mutation, crossover, and selection-II [75].
Initialization: this stage initializes primary population P and history population oldP with Equations (1) and (2), respectively:
P i , j   ~   U ( l o w j ,   u p j )
o l d P i , j   ~   U ( l o w j ,   u p j )
where,
i = 1, 2, 3, …., N; N is the population size; U is the uniform distribution.
j = 1, 2, 3… D; D is the problem dimension.
BSA’s Selection-I: in this stage, the BSA algorithm re-chooses a new oldP to calculate the search direction through the ‘if-then’ rule in Equation (3) and the permuting’s function in Equation (4) is utilized to randomly change individuals’ order in oldP. This stage confirms that the BSA algorithm has memory.
o l d P : = P / a , b   ~   U ( 0 , 1 )
o l d P : = p e r m u t i n g ( o l d P )
Mutation: in this stage, the BSA algorithm generates the initial trail population form M based on Equation (5):
M = P + F . ( o l d P P )
where F is responsible for controlling the amplitude of the search direction matrix. It can be obtained by applying Equation (6), where randn is a standard normal random number.
F = 3 · r a n d n
In this study, we used F = 3 as was used before in Gharghan et al. [36].
Crossover: the last formula of trial population T is generated at this stage. The value of T is limited within the acceptable boundary limitations. The unique crossover phase of BSA algorithm contains two primary phases. The first stage is to adjust a binary integer-valued matrix (map) with size N × D via utilizing map (1: N, 1: D) = 1. Then, two various crossover strategies are randomly conducted to set the map, as presented in Equation (7). The second stage is used for updating T based on the defined map utilizing Equation (8).
m a p i , u = 0 { u = m i x r a t e · r a n d · D , i f   c < d / c , d   ~ U ( 0 , 1 ) , u = r a n d i ( D ) , e l s e ,
T i , j = { M i , j , i f   m a p i , j = 0 , P i , j , e l s e ,
where mixrate is the mix rate parameter, which controls the elements’ number that will be altered.
A boundary control mechanism is conducted via applying Equation (9), for avoiding the individuals in T exceeding the search space limits.
T i , j = r a n d · ( u p j l o w j ) + l o w j ,   i f ( T i , j < l o w j )   o r   ( T i , j > u p j ) .
Selection-II: this is the final stage of the BSA algorithm, which evaluates the fitness values of the trial population T and population P, and updates the individuals of P according to a greedy selection, as presented in Equation (10).
P i = { T i , if   f i t n e s s ( T i ) < f i t n e s s ( P i ) , P i , e l s e .
More details about the BSA algorithm can be found in Civicioglu [73]. In our research study, we have hybridized BSA with ANN to choose the best hyperparameters of the ANN model, as opposed to using trial and error as it may not be reliable. As briefly mentioned earlier, these ANN hyperparameters include the neurons’ number in both hidden layers and the coefficient of the learning rate.

3.4. Evaluation Model

Several standard statistical measures can be employed to appraise the performance of the methodology in the validation stage for the selection of the best model that has a minimum mean error to decrease deviations in future forecasts [16]. In this research, five criteria were utilized to examine the accuracy of the forecast model: root mean square error (RMSE), mean absolute error (MAE), mean absolute relative error (MARE), coefficient of efficiency (CE) and coefficient of determination (R2). Moreover, four tests were applied to assess residual data, the Kolmogorov–Smirnov, Shapiro–Wilk, Augmented Dickey–Fuller (ADF) and Kwiatkowski–Phillips–Schmidt–Shin (KPSS) tests.

4. Results and Discussion

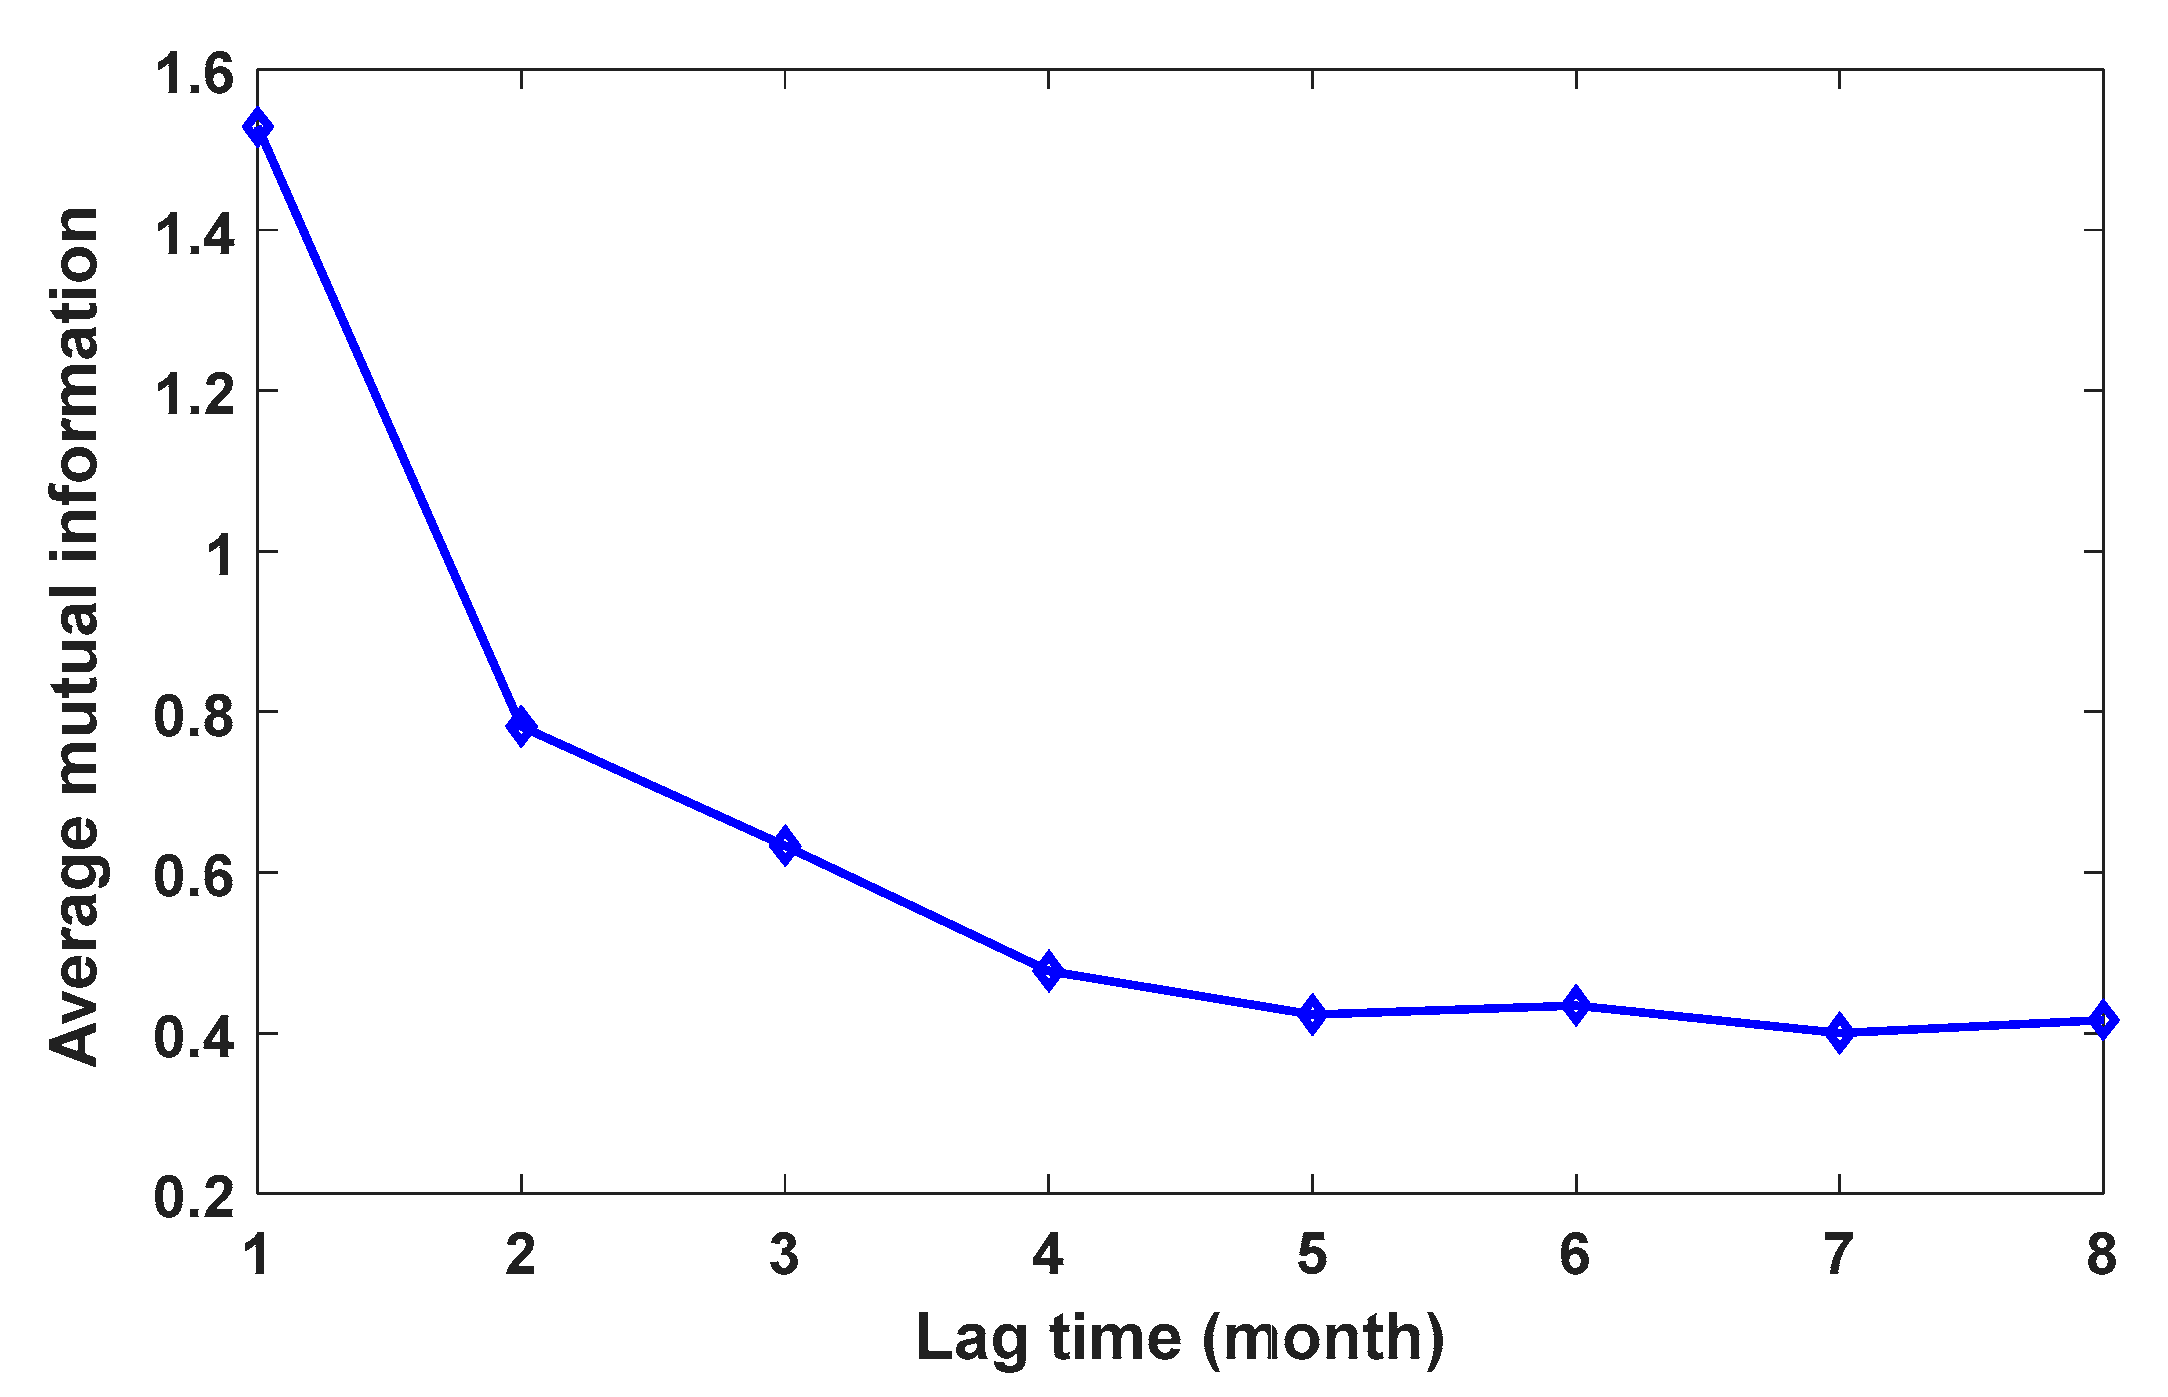
4.1. Development Model Input

After normalizing the data by applying the natural logarithm, the pre-treatment signal technique was employed to obtain the time series data of urban water consumption without noise (this was performed by decomposing the original time series into three signals). Figure 2 shows the original time series (top row), the new time series (second row) and two noise signals (third and fourth rows). Data pre-processing enhances the correlation coefficients between dependent and independents variables for different lags of monthly water consumption, e.g., the correlation coefficient of raw data of Lag1 increased significantly from 0.63 to 0.96. The correlation coefficients for the first four lags are 0.96, 0.91, 0.84 and 0.78, respectively.
Two boxplots’ shapes for normalized and denoised data are shown in Figure 3. It can be seen that there are no outlier’s data for both shapes. Additionally, both shapes almost have the same median, the upper and lower quartiles, while the upper and lower extremes of the denoised data are less than those for normalized data because of noise elimination. Moreover, the shape of denoised data is near to normal distribution pattern, better than the normalized data shape.
Further to this, the MI technique was applied to select the best scenario of model input for the prediction model, as shown in Figure 4. According to the literature, the first minimum of average mutual information (AMI) is selected as the time lag [76,77]. Based on the figure of AMI, four lags (Lag1 to Lag4) of monthly historical water consumption were used to simulate future water demand.
Tabachnick and Fidell [61] indicated that the relationship between the size’s sample (N) and the independent variables’ number should comply with Equation (11).
N ≥ 50 + 8 m
m = the number of predictors variables.
In this research, the cases’ number is N = 116, which is more than the 82 needed, which indicates compliance with the proposition from Tabachnick and Fidell [61].

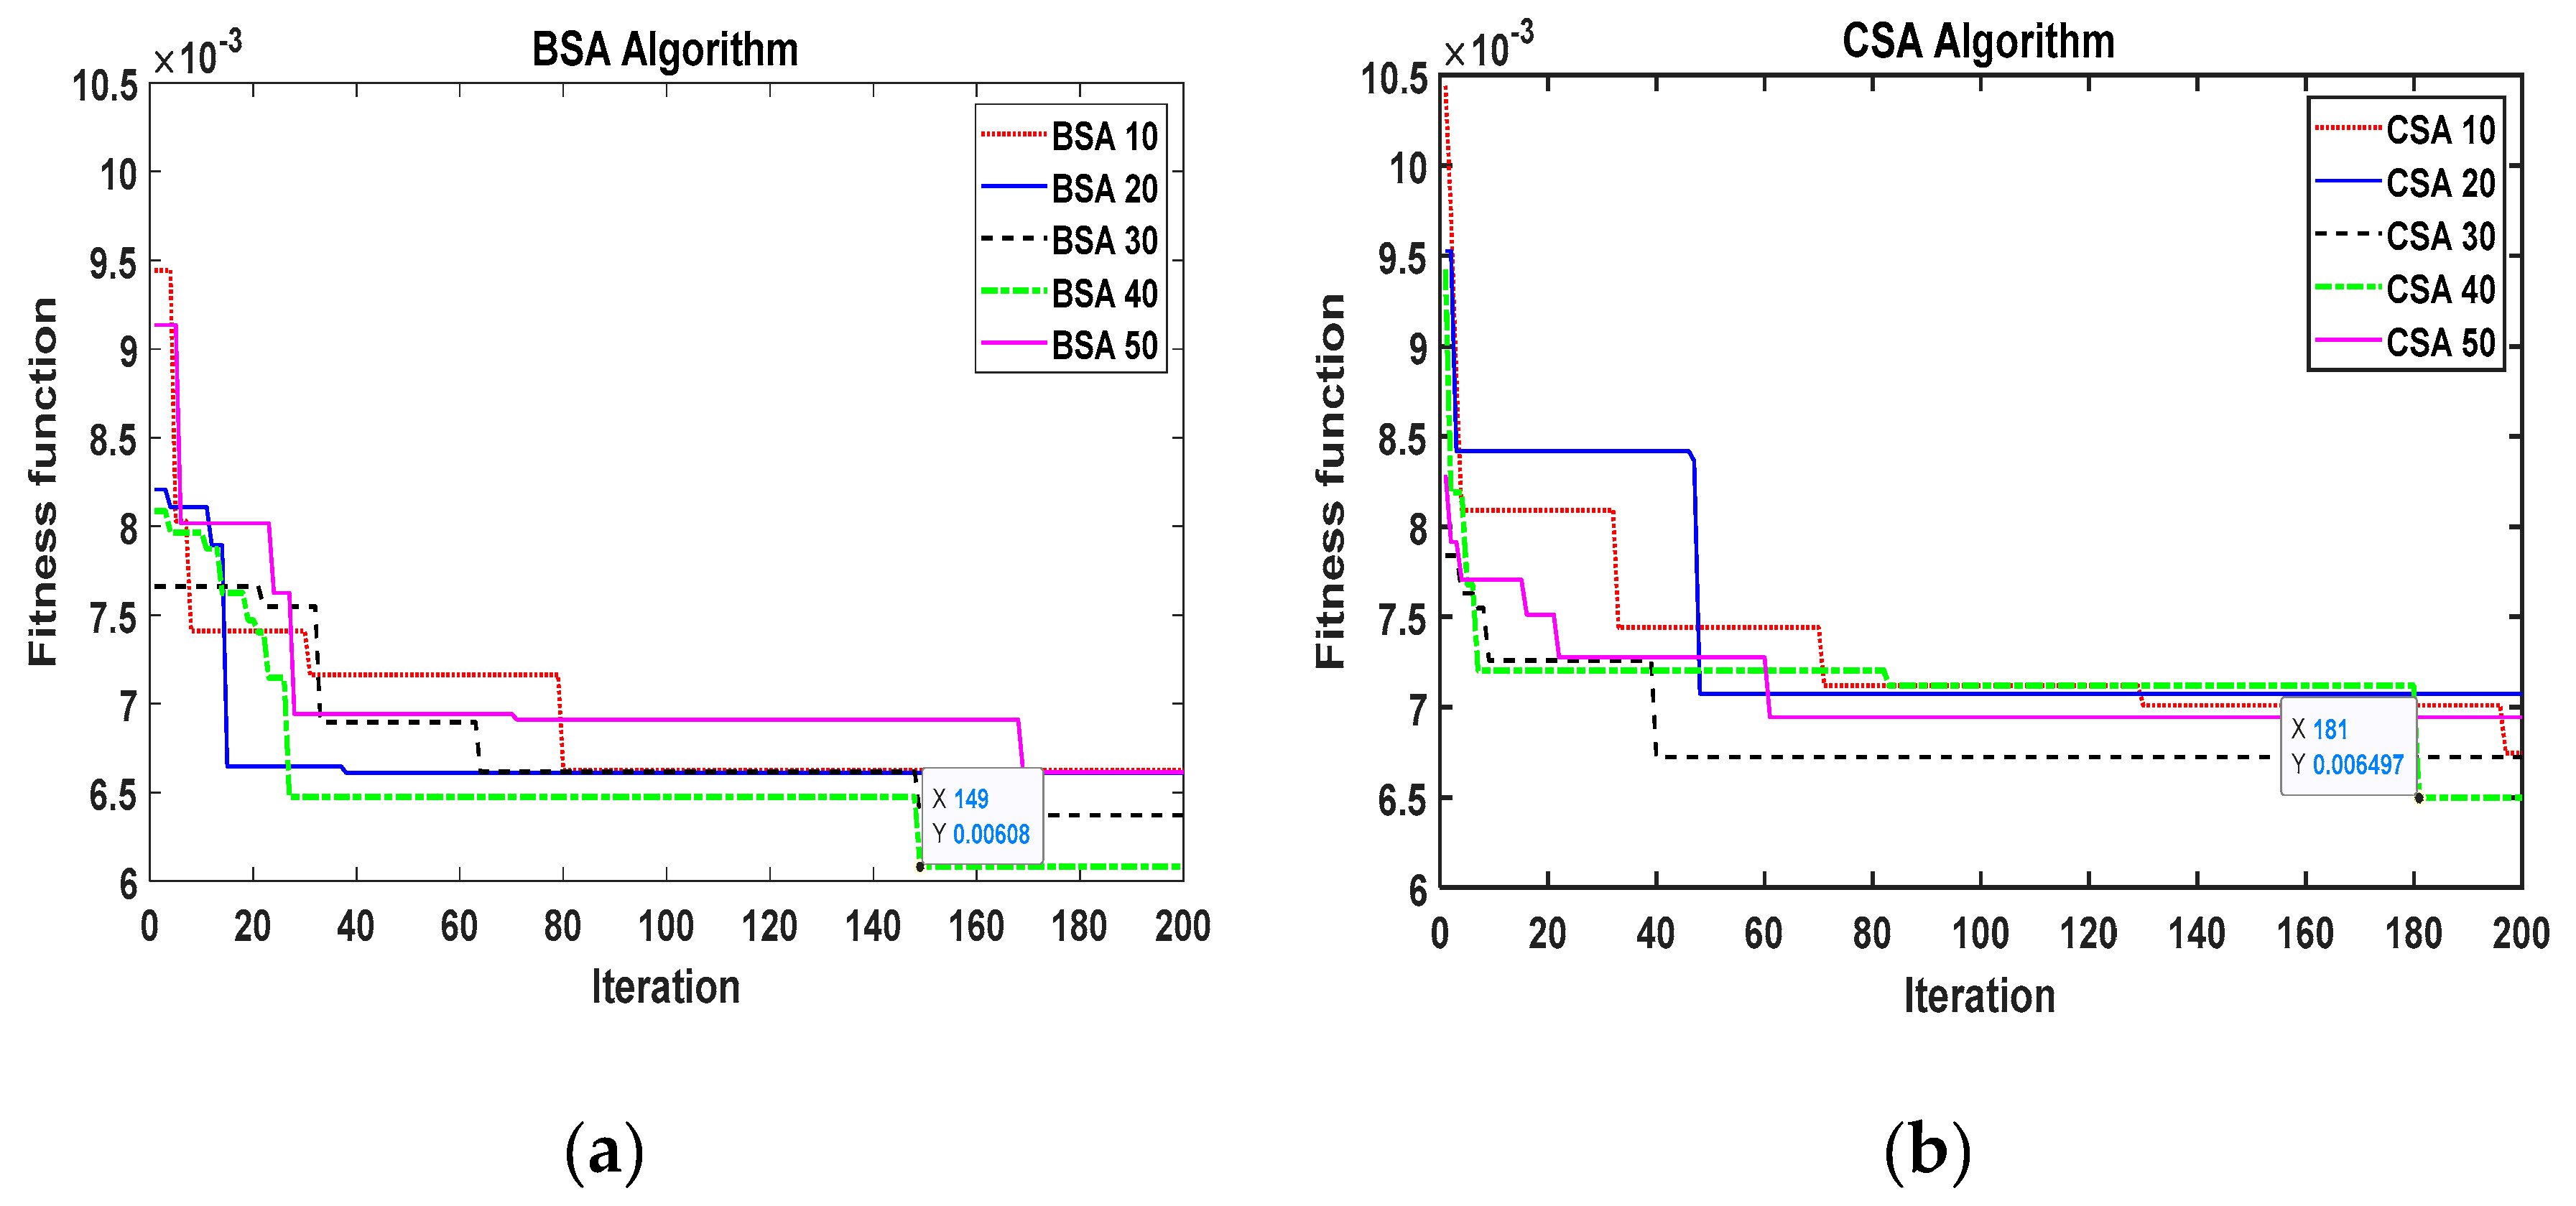
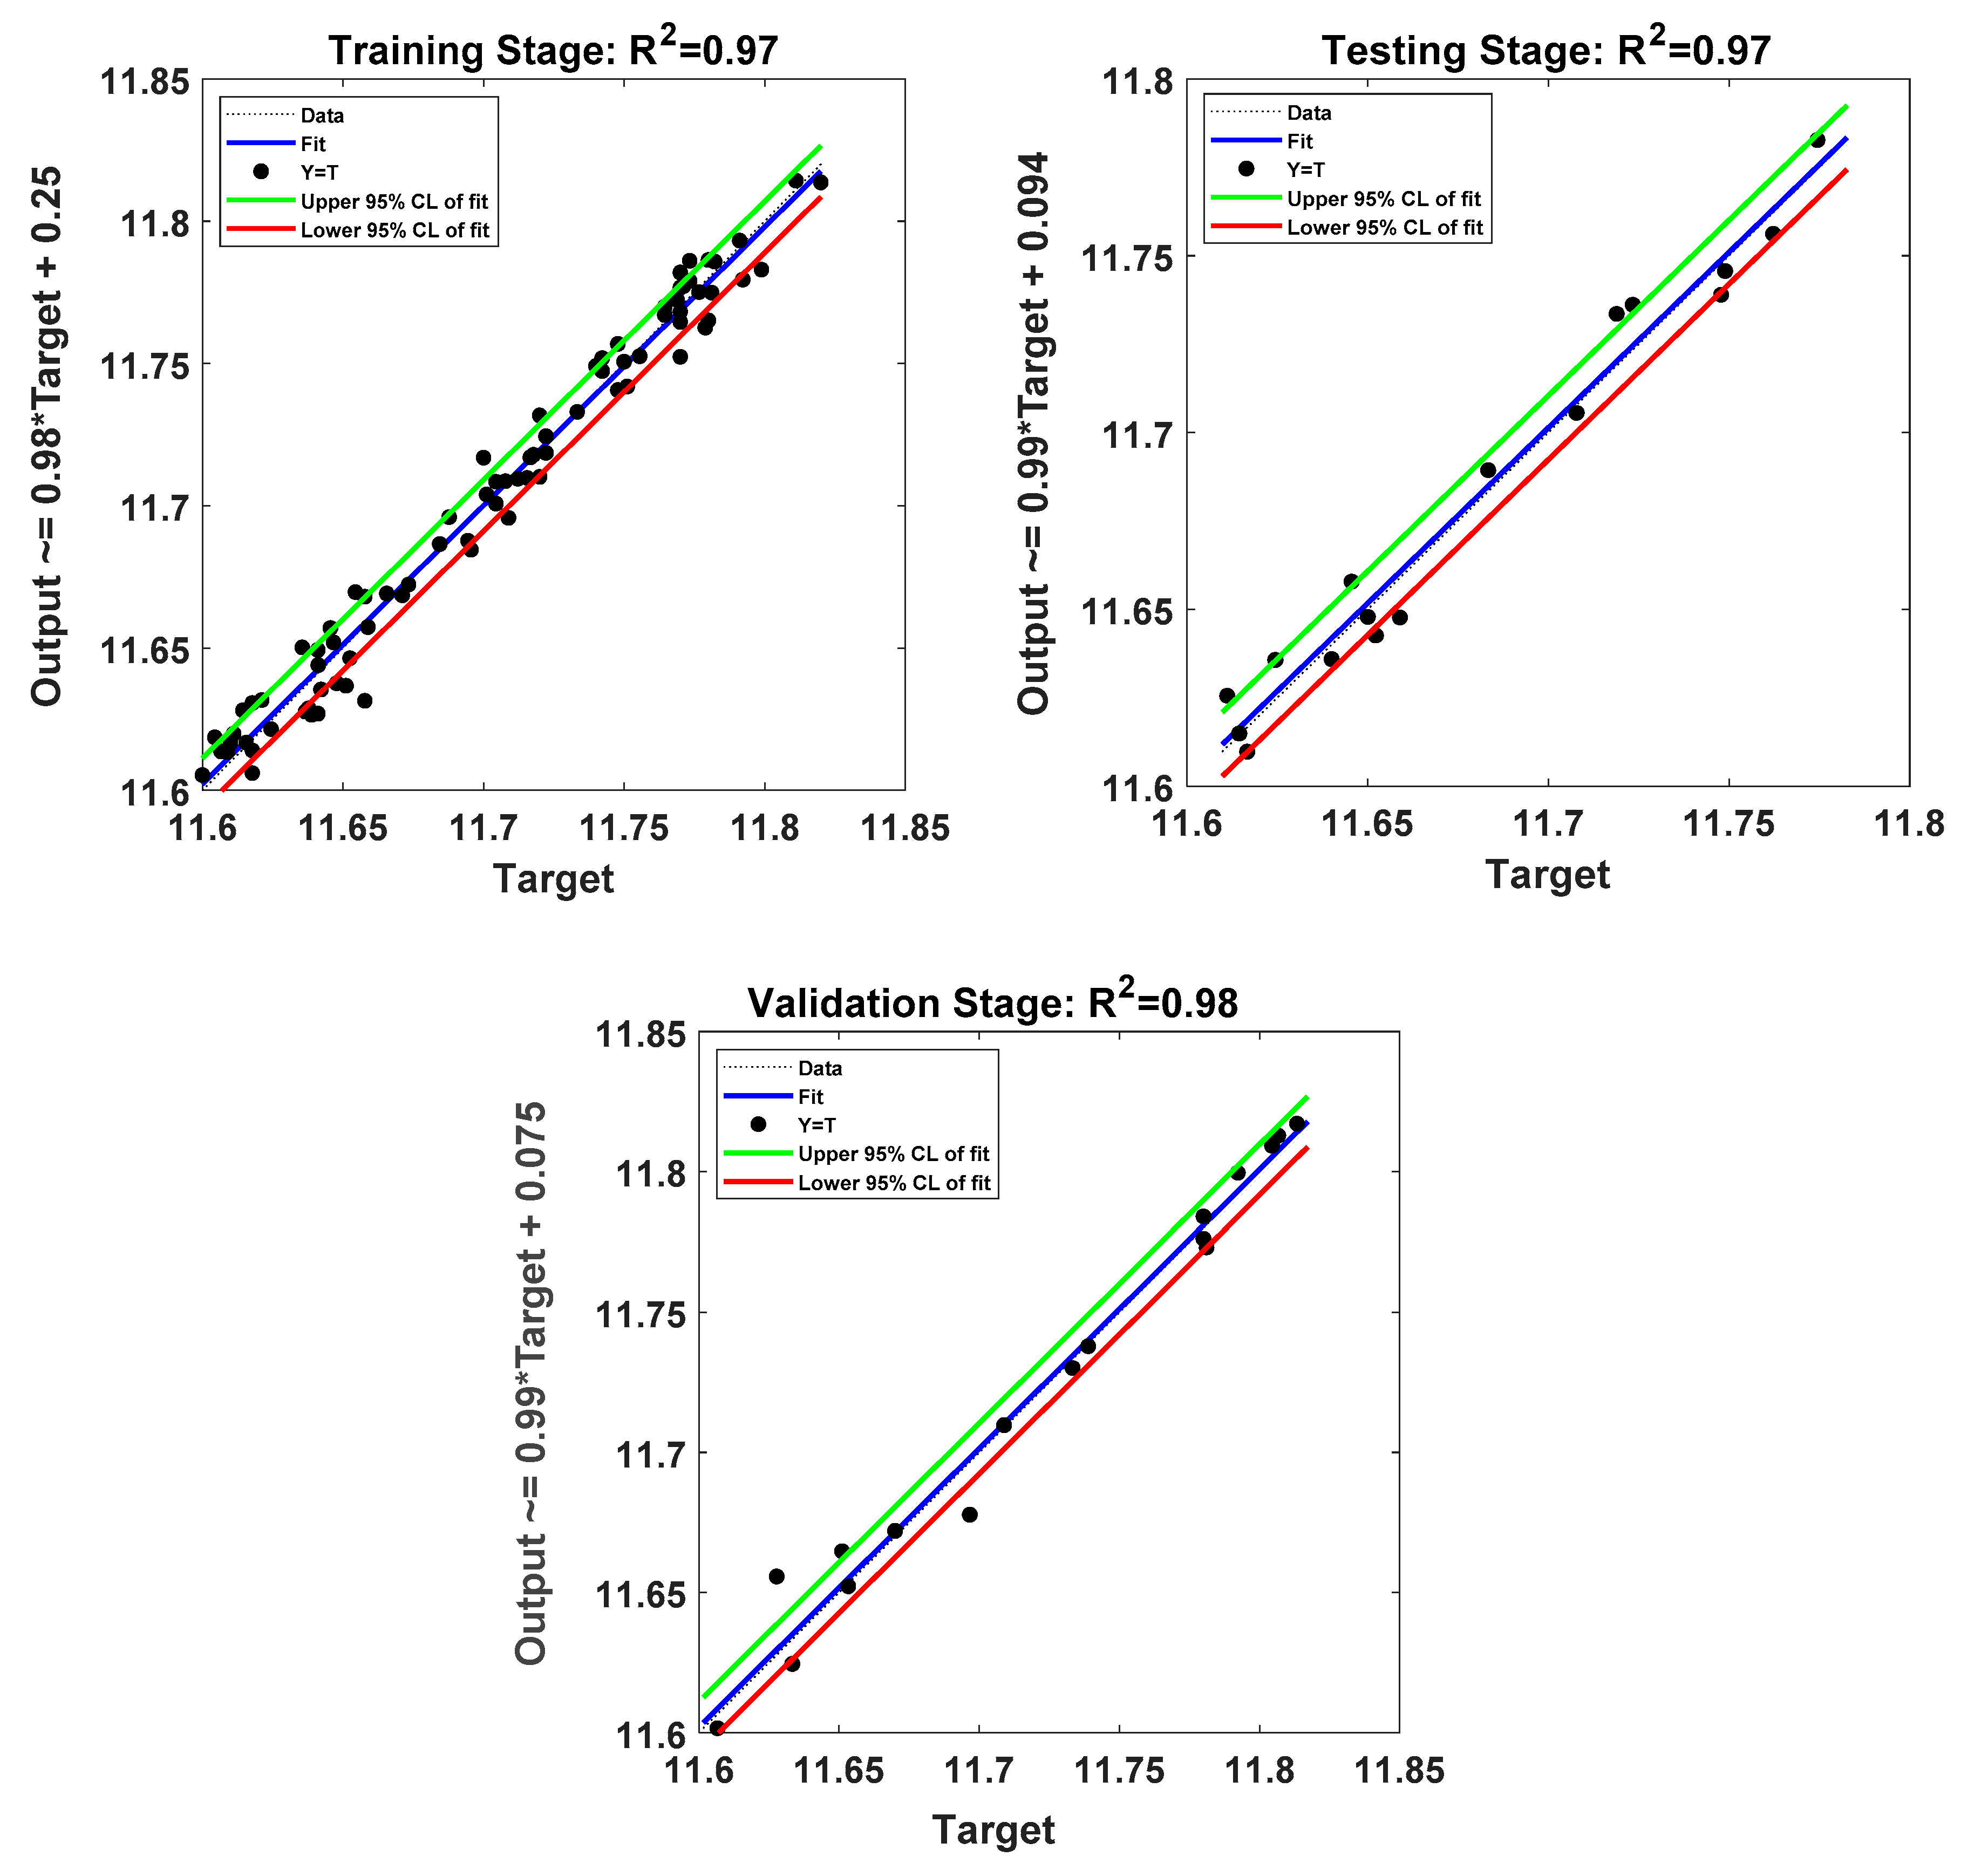
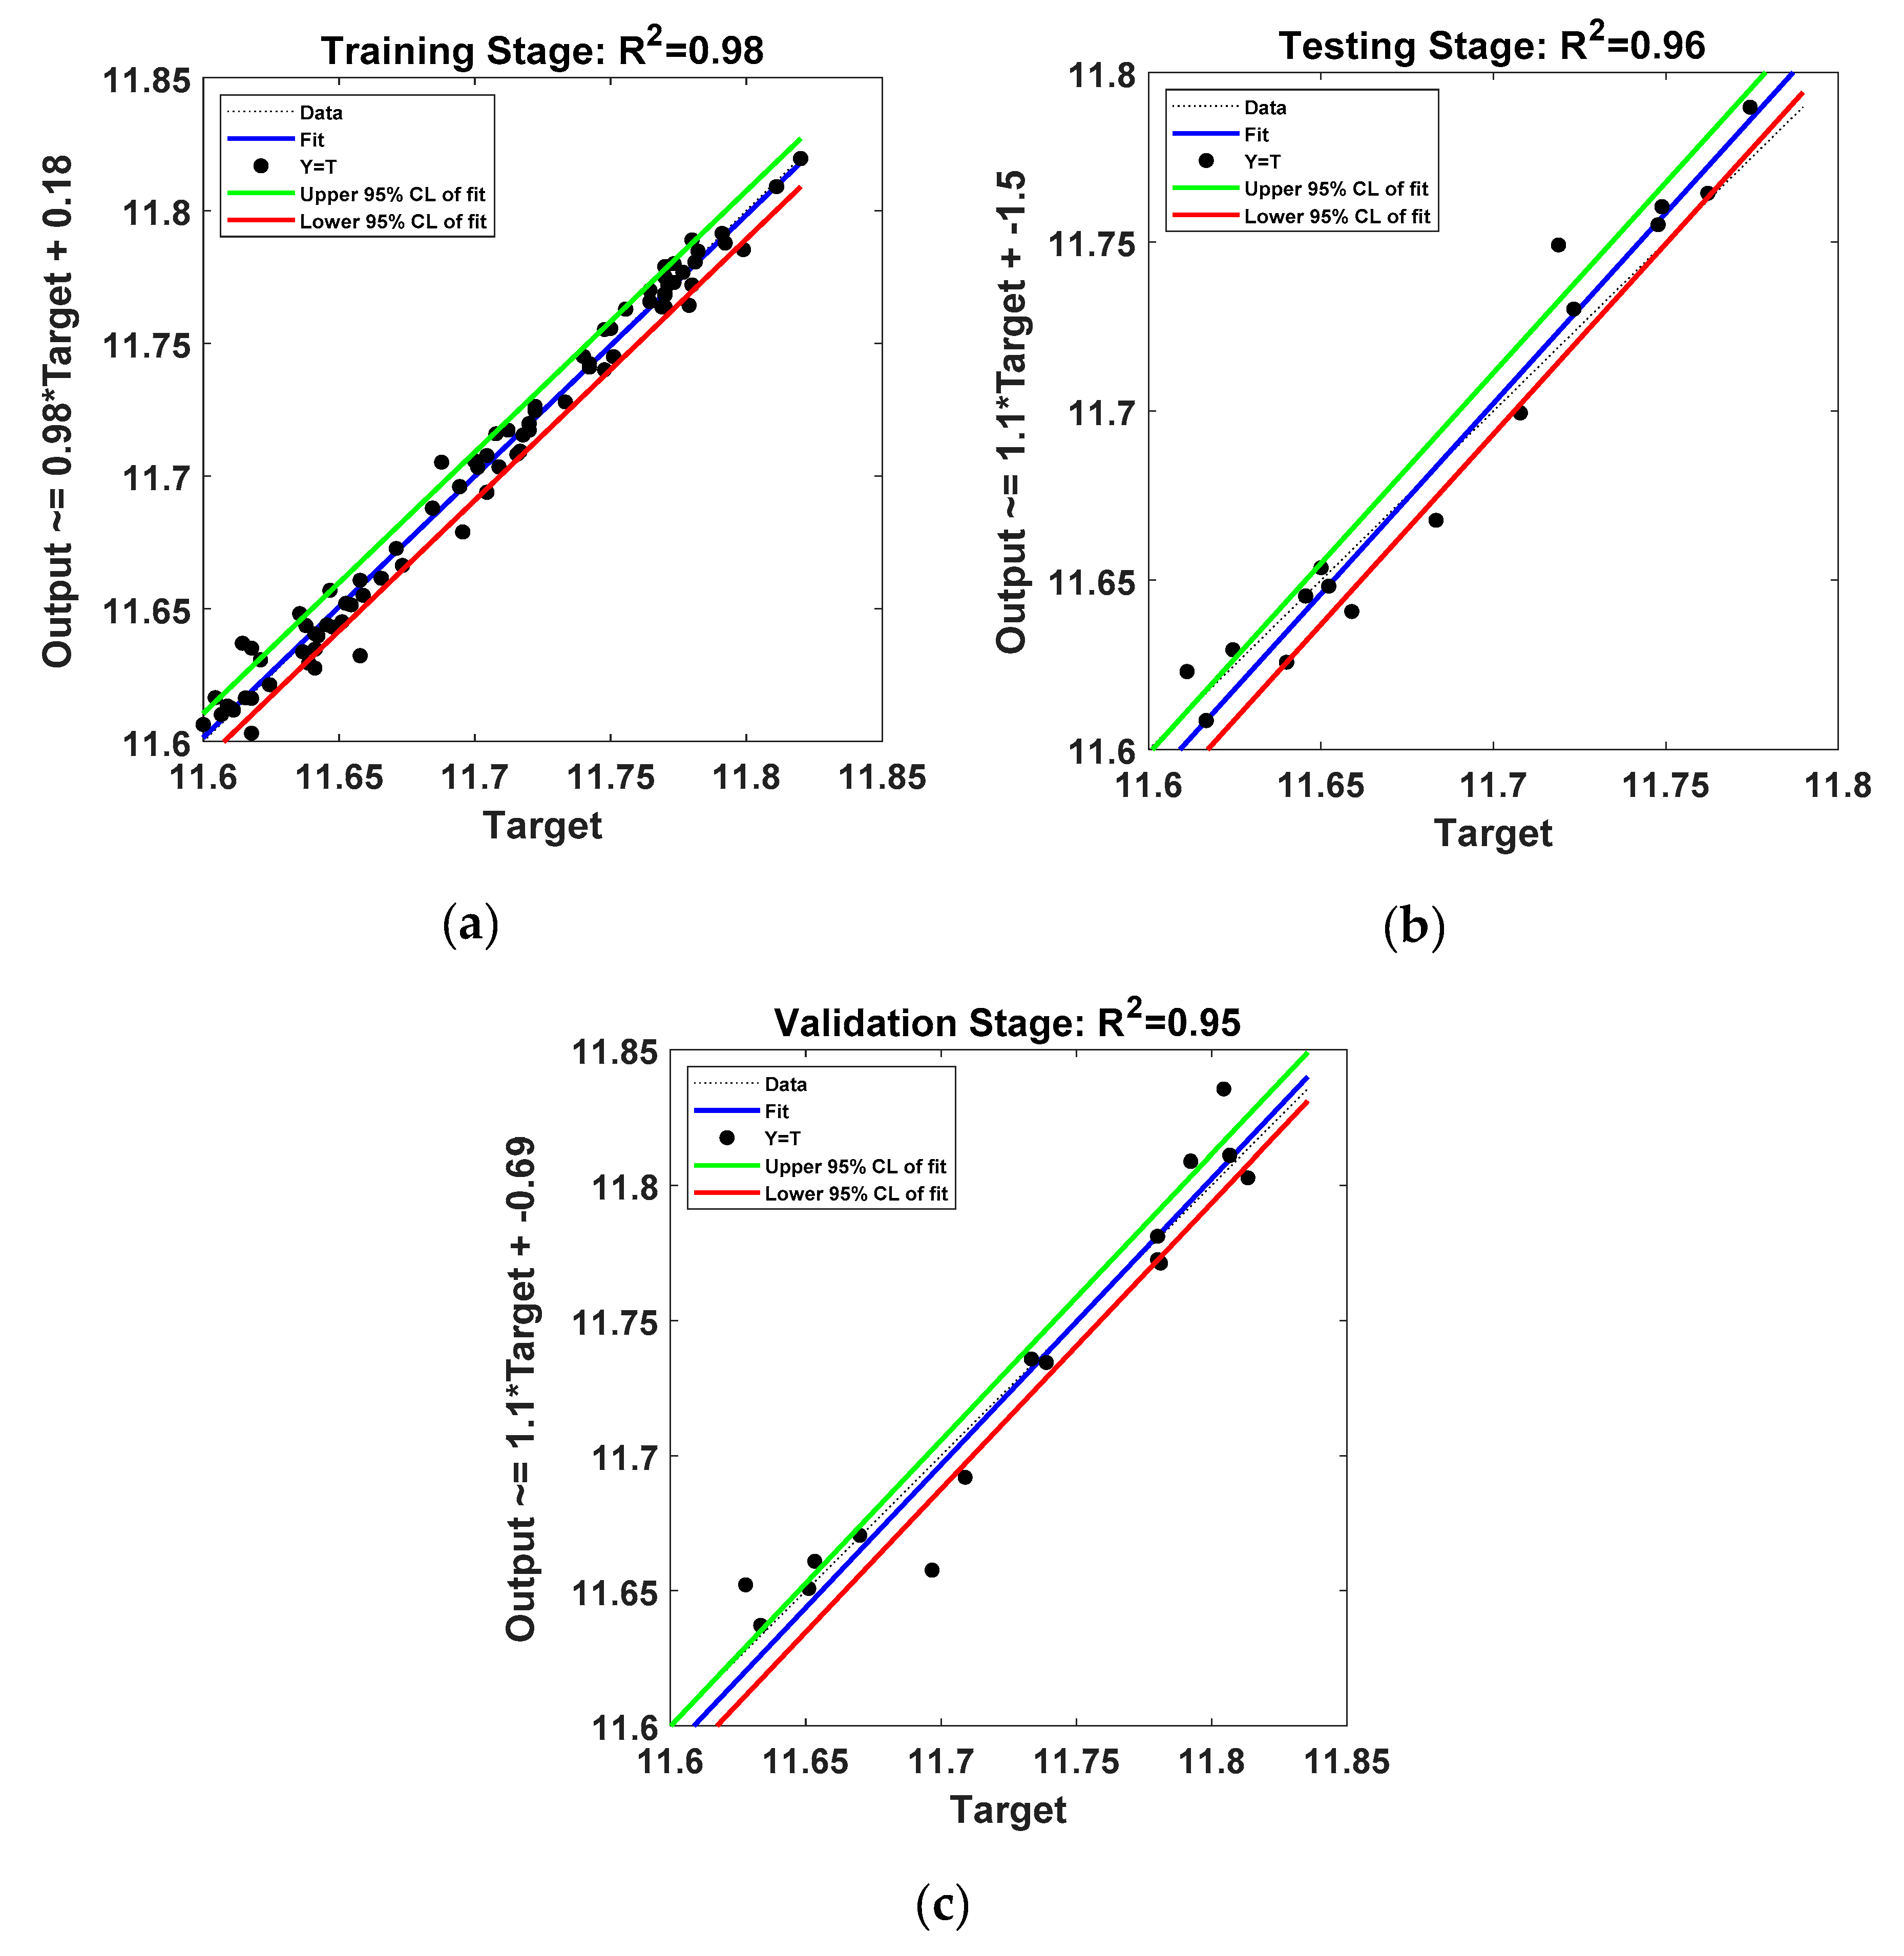
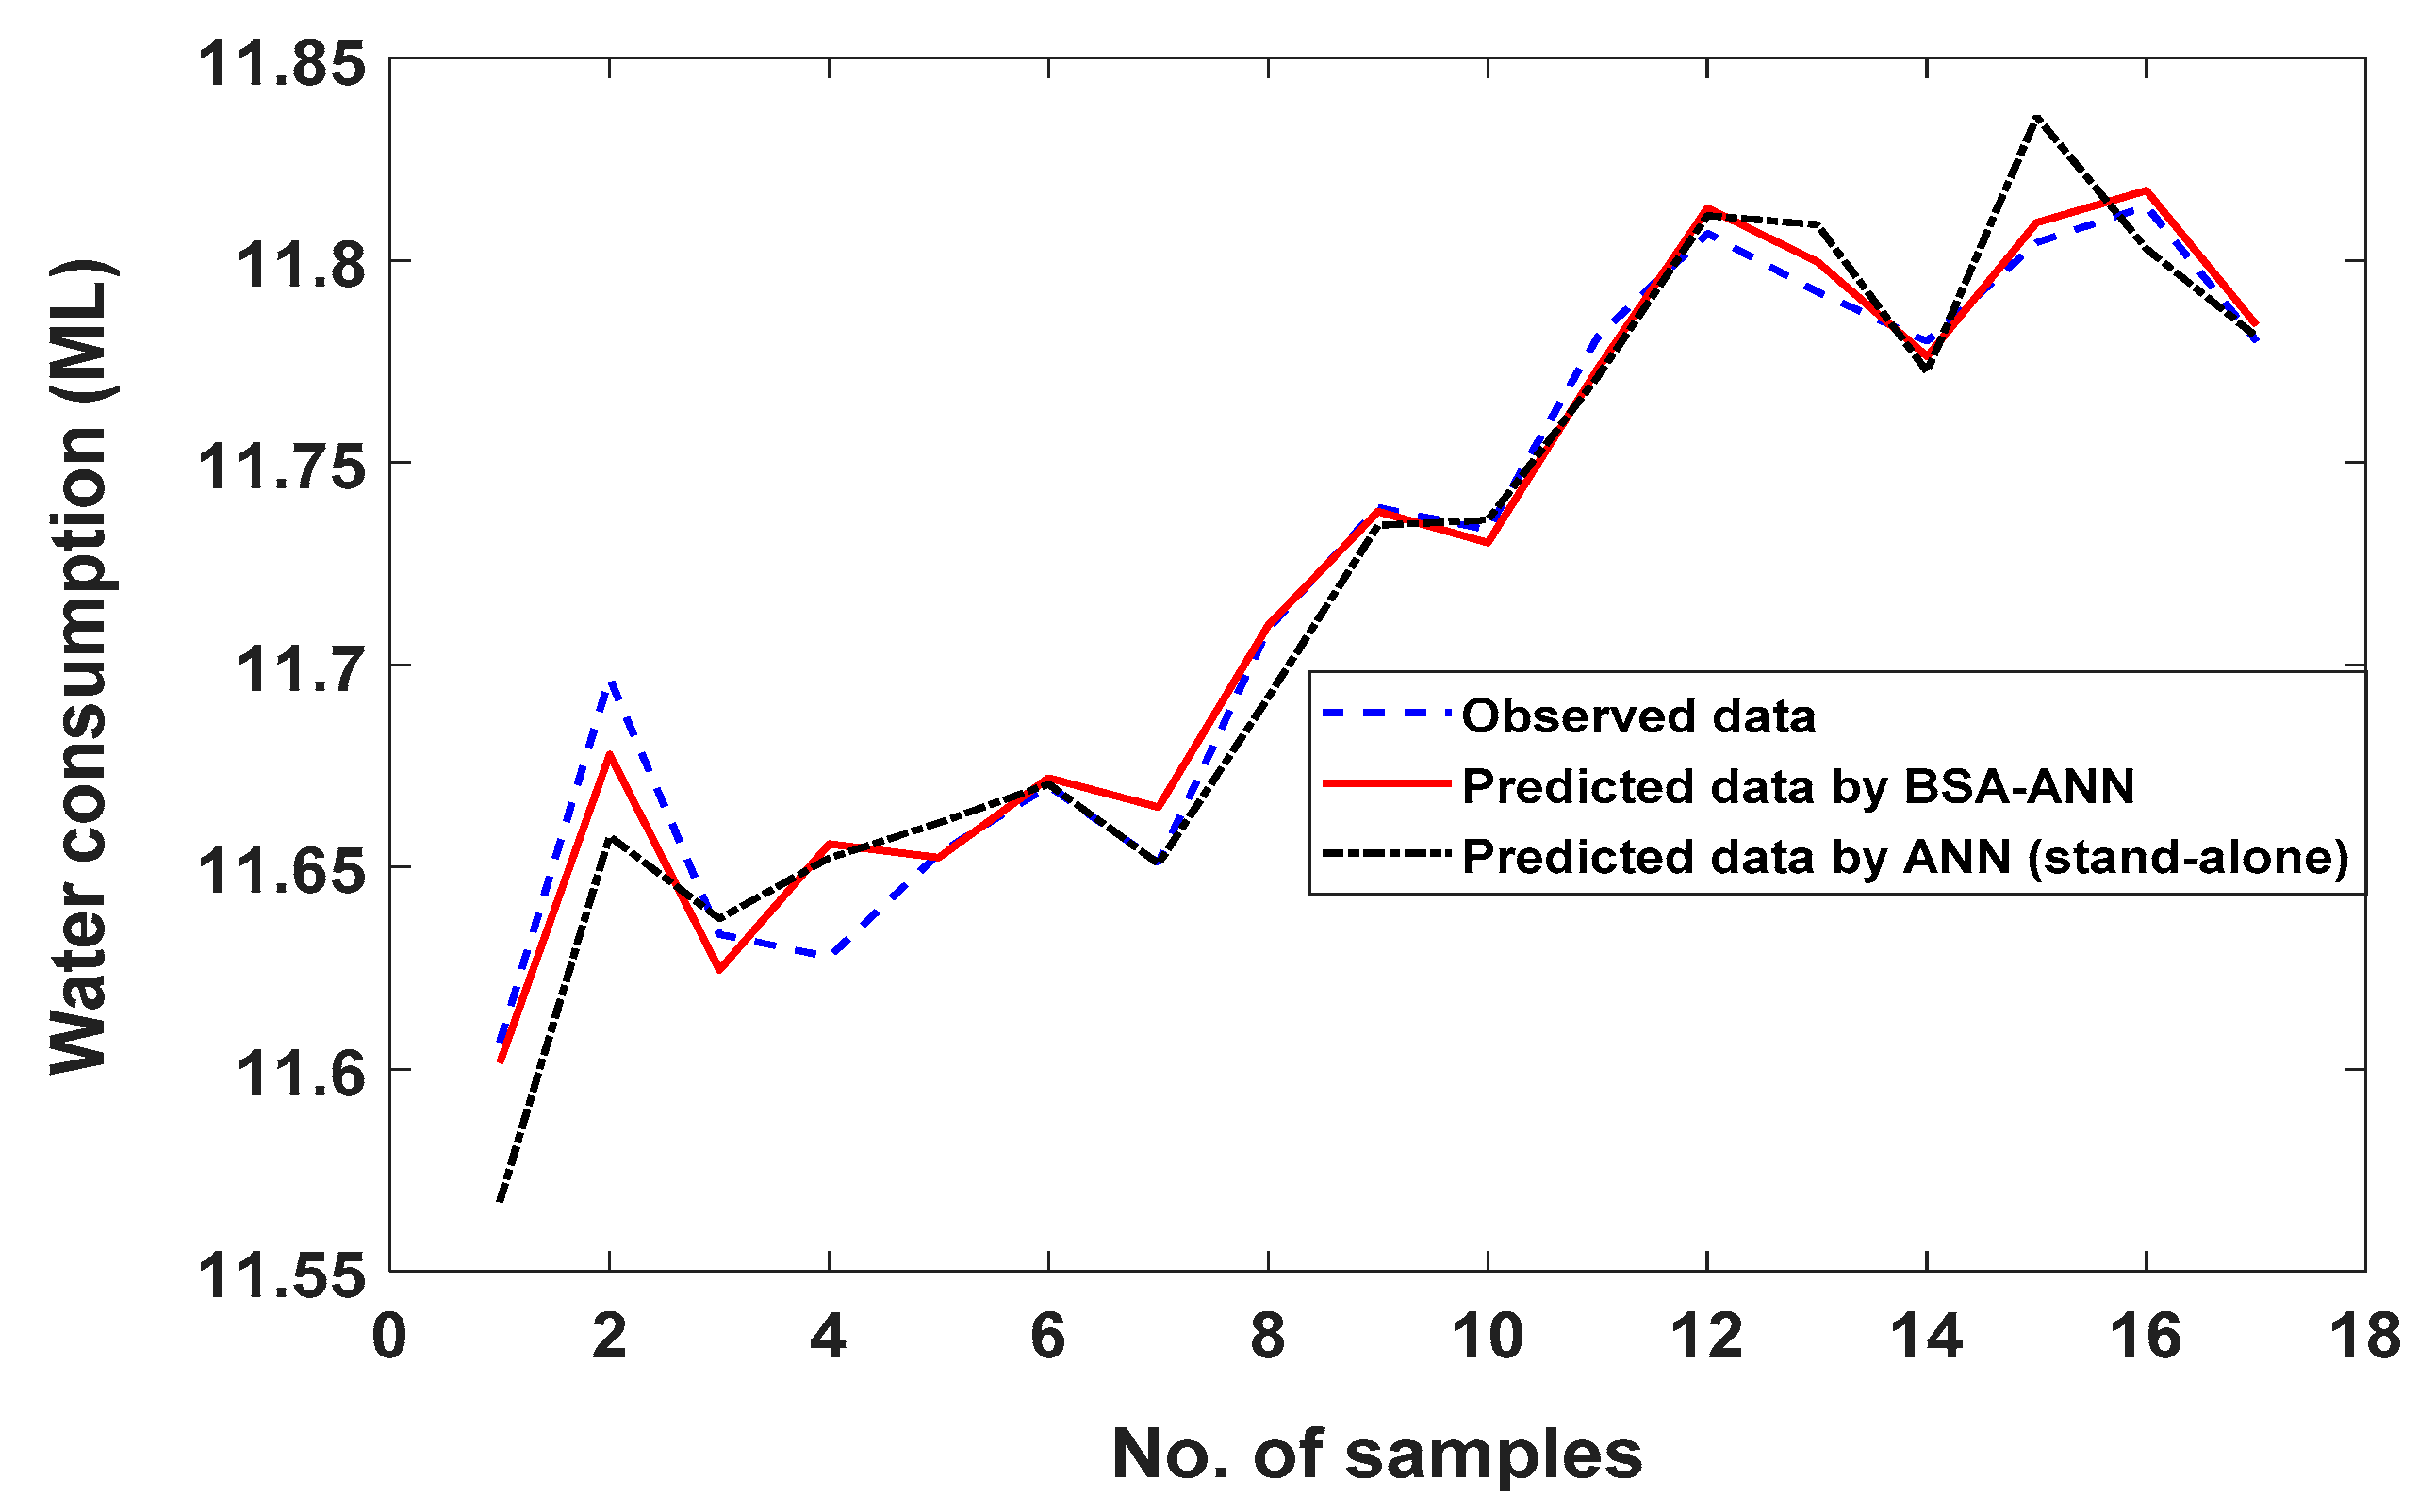
4.2. Application Hybrid Heuristic Algorithms-ANN Techniques

After performing data pre-processing methods, data were split into three datasets, training, testing and validation, as presented in Table 2. The table tabulates four statistical standards for all data sets include maximum consumption (Cmax), minimum consumption (Cmin), mean consumption (Cmean), standard deviation (Cstd) and total sample size for each data set (T). The outcomes show that all sets mostly have the same style.
Five sizes of the population (10, 20, 30, 40 and 50) were used to simulate the hybrid BSA-ANN algorithm in the MATLAB toolbox, to locate the optimal population size that offers the best learning rate coefficient and the number of neurons in both hidden layers of the ANN technique. Figure 5a shows that the population size of 40 offers the optimal answer with less fitness function equal to (0.00608 × 10⁻³) after 149 iterations. A CSA-ANN algorithm is applied as well to attain the same objective for the same populations’ size and to then to be compared with the outcomes from the hybrid BSA-ANN algorithm, as revealed in Figure 5b. Figure 5b reveals that the population size of 40 gives the optimal solution with less fitness function equal to (0.006497 × 10⁻³) after 181 iterations. The result gained from the BSA-ANN algorithm was associated with these from the CSA-ANN algorithm to compare with the new technique. The hybrid BSA-ANN model has a lower RMSE (with less iteration) in comparison to the CAS-ANN. The results of the BSA algorithm have been employed to enhance the ANN capabilities in the modeling of municipal water demand. Accordingly, the hyperparameters of the ANN obtained from the best population size were: learning rate coefficient: 0.3954, the number of neurons: 5 and 2 for hidden layer one and two, respectively.
The ANN technique was designed to estimate the effect of using the BSA algorithm in conjunction with the ANN, and to validate the results of the combined model. Consequently, extensive trial and error technique scenarios were implemented to determine the ANN model’s factors (LR, N1, and N2) that offer the optimal precise of prediction. Accordingly, the outcomes show that the values of LR, N1, and N2 are 0.3, 7, and 10, respectively.
To explore the capability and accuracy of the combined model for generalization, the coefficient of determination (R2) was estimated between the observed and simulated water demand for training, testing and validation sets, as presented in Figure 6. The measured municipal water consumption is indicated in the x-axis and plotted against the simulated water demand in the y-axis. Moreover, the dataset of the testing stage was employed to plot a regression calibration curve between the observed versus simulated water consumption time series, with a 95% confidence interval (CI). The figure shows that there are neither any irregular data nor a particular pattern trend, and high levels of consistency between the observed and simulated data. Moreover, the hybrid model was significant R2 = 0.97, 0.97, and 0.98 for training, testing, and validation datasets, respectively. These results support the capabilities of the BSA-ANN model to accurately generalize unseen data (i.e., a dataset that was not considered before in training and testing stages).
The coefficient of determination (R2) criterion was utilized again to evaluate the accuracy of the ANN model (stand-alone) and its capability for generalizing data in the validation stage, as presented in Figure 7. The figure shows that R2 = 0.98, 0.96 and 0.95 for training, testing and validation datasets. Although the values of coefficient of determinations for training and testing stages are slightly bigger than the value of the same criteria for the validation stage, this is not considered a problem, as was also discussed in Dawson et al. [78]. Hence, we can confidently say that this statistical criterion supports the increased generalization capabilities of the BSA-ANN model compared with the ANN model (stand-alone).
Moreover, the performance of the BSA-ANN and ANN model (stand-alone) was further examined by using four different statistical indicators RMSE, MAE, MARE and CE for training, testing and validation stages. These indicators are a valuable criterion for examining the nonlinear time series as municipal water time series, as presented in Table 3. According to Dawson et al. [78], the results of these four statistical criteria indicate the ability of the models, BSA-ANN and ANN (stand-alone), to accurately simulate municipal water demand. However, the capability of the BSA-ANN model for generalizing data in the validation stage is still better than the ANN (stand-alone) model (e.g., the value of CE = 0.979 for BSA-ANN is better than CE = 0.931 for ANN (stand-alone) model.
Furthermore, a graphical test was utilized to examine the capability of the combined model to generalize water data time series in the validation stage. Figure 8 presents the observed water data in blue and predicted water data by BSA-ANN and ANN (stand-alone) in red and black, respectively. It can be noticed that the predicted data by BSA-ANN follow the trend and periodicity of the observed data, and it is very close to the observed data based on the scale of error better than data that was predicted by ANN (stand-alone). Therefore, these results support the generalization capability of the combined model to forecast the municipal water time series compared with the ANN (stand-alone) model.
Moreover, Kolmogorov–Smirnov and Shapiro–Wilk tests agree that the residual data are normally distributed base on the significant values. In addition, the residual data are stationary based on ADF and KPSS tests. Accordingly, the values of residual data and its pattern distribution confirm the capabilities of the combined model.
Based on the above outcomes of statistical criteria, data analysis and a graphical test, it can be concluded that: (1) data pre-processing techniques have been applied successfully for enhancing the quality of the data and to choose the best model input scenario. (2) The BSA-ANN algorithm is more efficient and accurate than the CSA-ANN algorithm, based on the fitness function value (RMSE), to locate the optimum hyperparameters of the ANN model. (3) The hybrid model BSA-ANN can accurately generalize data in the validation stage compared with the ANN (stand-alone) model based on several statistical criteria. (4) The combined technique, data pre-processing and BSA-ANN algorithm, has proven to be robust for the prediction of water demand with less error, in relation to previous water consumption. (5) Using metaheuristic algorithms to detect the best hyperparameters of the ANN method and comparing the outcomes of the hybrid technique with the results of the ANN (stand-alone) model leads to increasing the validation of the proposed methodology and reduce the uncertainty.
Finally, this study highlights the importance and suitability of data pre-processing and hybrid models in predicting medium-term urban water demand for the city that suffers from variability in climate and socio-economic factors, such the Gauteng province. Rand Water can take benefit from the outcomes of this research to evolve effective plans for optimized system operation and ensure balancing between water delivered and need under good quality and sufficient pressure. Moreover, this combined technique considered all the factors that affect water demand, including socio-economic, strategic, demographic and climatic. So, it is recommended to be applied in different cities that suffer from the impact of the same factors.

5. Conclusions

In this manuscript, the performance of novel combined models that include pre-treatment signal, mutual information and the BSA-ANN technique were assessed to estimate the monthly municipal water needed based on previous water consumption. Historical data of monthly water consumption over ten years from the Gauteng province, South Africa, was utilized to build and evaluate the predictive model developed. The outcomes show that data pre-processing is a crucial step to enhance the quality of the data before feeding it into the model by denoising time series and selecting the best scenario of model input. Moreover, the hybrid BSA-ANN algorithm can be successfully applied to select optimum ANN hyperparameters, and it outperforms the CSA-ANN algorithm based on fitness function (RMSE). In addition, the ANN model (stand-alone) was used to decrease the uncertainty by validating the outcomes of the hybrid model (BSA-ANN). Moreover, the results confirm the appropriateness of the combined model to forecast water demand depending on the historical water consumption of a city under variability in climate and socio-economic factors, such the Gauteng province. The advantages of the proposed methodology are: easy to be implemented, high accuracy with less uncertainty, time-saving qualities, and applicability when the climate and socio-economic factors are missing (i.e., lost the information of factors that drive water demand). Hence, these results can accurately inform Rand Water (i.e., its decision makers and managers), helping this water utility company to better manage the existing municipal water system and to better plan for extensions in response to the increasing consumption, which would lead to better service and the better management of resources in the Gauteng province. Therefore, taking into consideration all the benefits mentioned before, we recommend that additional studies are conducted in other regions with similar or different climatic and socio-economic factors, or regions that lack climatic and socio-economic factors but have reliable water consumption data. Moreover, based on the outputs of the current study, we recommend exploring the use of different techniques of data pre-processing and several hybrid models in the simulation of municipal water demand depending on historical water consumption for other cities in the world due to the fact that there is no global method that surpasses all the models for predicting water demand.

Author Contributions

Conceptualization, Data curation, Methodology, Formal analysis, Writing—original draft, Project administration, S.L.Z.; Conceptualization, Methodology, Formal analysis, and Writing—review & editing, S.O.-M.; Writing—original draft, Data curation, H.A.-B.; Conceptualization and Methodology, I.O.; Methodology, K.S.H.; Writing—review & editing and Methodology, S.K.G.; Software, P.K.; Project administration and Review & editing, R.A.-K. All authors have read and agreed to the published version of the manuscript.

Funding

This research received no external funding.

Acknowledgments

Authors are grateful to the Rand Water Company for providing the historical municipal water data for this study.

Conflicts of Interest

The authors declare no conflict of interest.

References

  1. Farhan, S.L.; Abdelmonem, M.G.; Nasar, Z.A. The Urban Transformation of Traditional City Centres: Holy Karbala as a Case Study. Int. J. Arch. Res. ArchNet IJAR 2018, 12, 53–67. [Google Scholar] [CrossRef]
  2. Ebrahim Banihabib, M.; Mousavi-Mirkalaei, P. Extended linear and non-linear auto-regressive models for forecasting the urban water consumption of a fast-growing city in an arid region. Sustain. Cities Soc. 2019, 48. [Google Scholar] [CrossRef]
  3. Farhan, S.L.; Hashim, I.A.J.; Naji, A.A. The Sustainable House: Comparative Analysis of Houses in Al Kut Neighborhoods-Iraq. In Proceedings of the 2019 12th International Conference on Developments in eSystems Engineering (DeSE), Kazan, Russia, 7–10 October 2019; pp. 1031–1036. [Google Scholar]
  4. Farhan, S.L.; Jasim, I.A.; Al-Mamoori, S.K. The Transformation of The City of Najaf, Iraq: Analysis, Reality and Future Prospects. J. Urban Regen. Renew. 2019, 13, 1–12. [Google Scholar]
  5. Zubaidi, S.L.; Kot, P.; Hashim, K.; Alkhaddar, R.; Abdellatif, M.; Muhsin, Y.R. Using LARS–WG model for prediction of temperature in Columbia City, USA. IOP Conf. Ser. Mater. Sci. Eng. 2019, 584, 1–9. [Google Scholar] [CrossRef]
  6. Osman, Y.Z.; Abdellatif, M.; Al-Ansari, N.; Knutsson, S.; Jawad, S. Climate Change and Future Precipitation in An Arid Environment of The Middle East: Case Study of Iraq. J. Environ. Hydrol. 2017, 25, 1–18. [Google Scholar]
  7. Zubaidi, S.L.; Al-Bugharbee, H.; Muhsen, Y.R.; Hashim, K.; Alkhaddar, R.M.; Hmeesh, W.H. The Prediction of Municipal Water Demand in Iraq: A Case Study of Baghdad Governorate. In Proceedings of the 2019 12th International Conference on Developments in eSystems Engineering (DeSE), Kazan, Russia, 7–10 October 2019; pp. 274–277. [Google Scholar]
  8. Hashim, K.S.; Al-Saati, N.H.; Alquzweeni, S.S.; Zubaidi, S.L.; Kot, P.; Kraidi, L.; Hussein, A.H.; Alkhaddar, R.; Shaw, A.; Alwash, R. Decolourization of Dye Solutions by Electrocoagulation: An Investigation of The Effect of Operational Parameters. IOP Conf. Ser. Mater. Sci. Eng. 2019, 584, 1–8. [Google Scholar] [CrossRef]
  9. Hashim, K.S.; Hussein, A.H.; Zubaidi, S.L.; Kot, P.; Kraidi, L.; Alkhaddar, R.; Shaw, A.; Alwash, R. Effect of Initial Ph Value on The Removal of Reactive Black Dye from Water by Electrocoagulation (EC) Method. J. Phys. Conf. Ser. 2019, 1294, 1–6. [Google Scholar] [CrossRef]
  10. Ashoori, N.; Dzombak, D.A.; Small, M.J. Identifying water price and population criteria for meeting future urban water demand targets. J. Hydrol. 2017, 555, 547–556. [Google Scholar] [CrossRef]
  11. Toth, E.; Bragalli, C.; Neri, M. Assessing the significance of tourism and climate on residential water demand: Panel-data analysis and non-linear modelling of monthly water consumptions. Environ. Model. Softw. 2018, 103, 52–61. [Google Scholar] [CrossRef]
  12. Hashim, K.S.; Kot, P.; Zubaidi, S.L.; Alwash, R.; Al Khaddar, R.; Shaw, A.; Al-Jumeily, D.; Aljefery, M.H. Energy Efficient Electrocoagulation Using Baffle-Plates Electrodes for Efficient Escherichia Coli Removal from Wastewater. J. Water Process. Eng. 2020, 33, 1–7. [Google Scholar] [CrossRef]
  13. Msiza, I.S.; Nelwamondo, F.V.; Marwala, T. Water demand forecasting using multi-layer perceptron and radial basis functions. In Proceedings of the International Joint Conference on Neural Networks, Orlando, FL, USA, 12–17 August 2007. [Google Scholar]
  14. Kusangaya, S.; Warburton Toucher, M.L.; van Garderen, E.A. Evaluation of uncertainty in capturing the spatial variability and magnitudes of extreme hydrological events for the uMngeni catchment, South Africa. J. Hydrol. 2018, 557, 931–946. [Google Scholar] [CrossRef]
  15. House-Peters, L.A.; Chang, H. Urban water demand modeling: Review of concepts, methods, and organizing principles. Water Resour. Res. 2011, 47. [Google Scholar] [CrossRef] [Green Version]
  16. Donkor, E.A.; Mazzuchi, T.H.; Soyer, R.; Roberson, J.A. Urban water demand forecasting: Review of methods and models. J. Water Resour. Plan. Manag. 2014, 140, 146–159. [Google Scholar] [CrossRef]
  17. Ghalehkhondabi, I.; Ardjmand, E.; Young, W.A., 2nd; Weckman, G.R. Water demand forecasting: Review of soft computing methods. Environ. Monit. Assess. 2017, 189, 313. [Google Scholar] [CrossRef]
  18. de Souza Groppo, G.; Costa, M.A.; Libânio, M. Predicting water demand: A review of the methods employed and future possibilities. Water Supply 2019. [Google Scholar] [CrossRef]
  19. Gato, S.; Jayasuriya, N.; Roberts, P. Forecasting residential water demand: Case study. J. Water Resour. Plan. Manag. 2007, 133, 309–319. [Google Scholar] [CrossRef]
  20. Gato, S.; Jayasuriya, N.; Roberts, P. Temperature and rainfall thresholds for base use urban water demand modelling. J. Hydrol. 2007, 337, 364–376. [Google Scholar] [CrossRef]
  21. Zubaidi, S.L.; Dooley, J.; Alkhaddar, R.M.; Abdellatif, M.; Al-Bugharbee, H.; Ortega-Martorell, S. A Novel approach for predicting monthly water demand by combining singular spectrum analysis with neural networks. J. Hydrol. 2018, 561, 136–145. [Google Scholar] [CrossRef]
  22. Boyd, G.; Na, D.; Li, Z.; Snowling, S.; Zhang, Q.; Zhou, P. Influent Forecasting for Wastewater Treatment Plants in North America. Sustainability 2019, 11, 1764. [Google Scholar] [CrossRef] [Green Version]
  23. Zhang, Q.; Li, Z.; Snowling, S.; Siam, A.; El-Dakhakhni, W. Predictive models for wastewater flow forecasting based on time series analysis and artificial neural network. Water Sci. Technol. 2019, 80, 243–253. [Google Scholar] [CrossRef] [PubMed]
  24. Seo, Y.; Kwon, S.; Choi, Y. Short-Term Water Demand Forecasting Model Combining Variational Mode Decomposition and Extreme Learning Machine. Hydrology 2018, 5, 54. [Google Scholar] [CrossRef] [Green Version]
  25. Shabani, S.; Candelieri, A.; Archetti, F.; Naser, G. Gene Expression Programming Coupled with Unsupervised Learning: A Two-Stage Learning Process in Multi-Scale, Short-Term Water Demand Forecasts. Water 2018, 10, 142. [Google Scholar] [CrossRef] [Green Version]
  26. Polomˇcic´, D.; Gligoric´, Z.; Bajic´, D.; Cvijovic´, C.E. A Hybrid Model for Forecasting Groundwater Levels Based on Fuzzy C-Mean Clustering and Singular Spectrum Analysis. Water 2017, 9, 541. [Google Scholar] [CrossRef] [Green Version]
  27. Li, X.; Li, Z.; Huang, W.; Zhou, P. Performance of statistical and machine learning ensembles for daily temperature downscaling. Theor. Appl. Clim. 2020, 140, 571–588. [Google Scholar] [CrossRef]
  28. Seo, Y.; Kim, S.; Singh, V.P. Comparison of different heuristic and decomposition techniques for river stage modeling. Environ. Monit. Assess. 2018, 190, 392. [Google Scholar] [CrossRef]
  29. Hopfield, J.J. Neural networks and physical systems with emergent collective computational abilities. Proc. Natl. Acad. Sci. USA 1982, 79, 2554–2558. [Google Scholar] [CrossRef] [Green Version]
  30. Hameed, M.; Sharqi, S.S.; Yaseen, Z.M.; Afan, H.A.; Hussain, A.; Elshafie, A. Application of artificial intelligence (AI) techniques in water quality index prediction: A case study in tropical region, Malaysia. Neural Comput. Appl. 2016, 28, 893–905. [Google Scholar] [CrossRef]
  31. Bayatvarkeshi, M.; Mohammadi, K.; Kisi, O.; Fasihi, R. A new wavelet conjunction approach for estimation of relative humidity: Wavelet principal component analysis combined with ANN. Neural Comput. Appl. 2018. [Google Scholar] [CrossRef]
  32. Mouatadid, S.; Adamowski, J. Using extreme learning machines for short-term urban water demand forecasting. Urban Water J. 2016, 14, 630–638. [Google Scholar] [CrossRef]
  33. Guo, G.; Liu, S.; Wu, Y.; Li, J.; Zhou, R.; Zhu, X. Short-Term Water Demand Forecast Based on Deep Learning Method. J. Water Resour. Plan. Manag. 2018, 144. [Google Scholar] [CrossRef]
  34. Gharghan, S.K.; Nordin, R.; Ismail, M.; Ali, J.A. Accurate wireless sensor localization technique based on hybrid pso-ann algorithm for indoor and outdoor track cycling. IEEE Sens. J. 2016, 16, 529–541. [Google Scholar] [CrossRef]
  35. Zubaidi, S.L.; Gharghan, S.K.; Dooley, J.; Alkhaddar, R.M.; Abdellatif, M. Short-Term Urban Water Demand Prediction Considering Weather Factors. Water Resour. Manag. 2018, 32, 4527–4542. [Google Scholar] [CrossRef]
  36. Gharghan, S.K.; Nordin, R.; Ismail, M. A Wireless Sensor Network with Soft Computing Localization Techniques for Track Cycling Applications. Sensors 2016, 16, 1043. [Google Scholar] [CrossRef] [PubMed] [Green Version]
  37. Zubaidi, S.L.; Ortega-Martorell, S.; Kot, P.; Alkhaddar, R.M.; Abdellatif, M.; Gharghan, S.K.; Ahmed, M.S.; Hashim, K. A Method for Predicting Long-Term Municipal Water Demands Under Climate Change. Water Resour. Manag. 2020, 34, 1265–1279. [Google Scholar] [CrossRef]
  38. Altunkaynak, A.; Nigussie, T.A. Monthly water demand prediction using wavelet transform, first-order differencing and linear detrending techniques based on multilayer perceptron models. Urban Water J. 2018, 15, 177–181. [Google Scholar] [CrossRef]
  39. Pacchin, E.; Gagliardi, F.; Alvisi, S.; Franchini, M. A Comparison of Short-Term Water Demand Forecasting Models. Water Resour. Manag. 2019, 33, 1481–1497. [Google Scholar] [CrossRef]
  40. Rasifaghihi, N.; Li, S.S.; Haghighat, F. Forecast of urban water consumption under the impact of climate change. Sustain. Cities Soc. 2020, 52. [Google Scholar] [CrossRef]
  41. Eggimann, S.; Mutzner, L.; Wani, O.; Schneider, M.Y.; Spuhler, D.; Moy de Vitry, M.; Beutler, P.; Maurer, M. The Potential of Knowing More: A Review of Data-Driven Urban Water Management. Environ. Sci. Technol. 2017, 51, 2538–2553. [Google Scholar] [CrossRef] [Green Version]
  42. Ouyang, Q.; Lu, W. Monthly Rainfall Forecasting Using Echo State Networks Coupled with Data Preprocessing Methods. Water Resour. Manag. 2017, 32, 659–674. [Google Scholar] [CrossRef]
  43. Zhang, J.; Li, H.; Shi, X.; Hong, Y. Wavelet-Nonlinear Cointegration Prediction of Irrigation Water in the Irrigation District. Water Resour. Manag. 2019, 33, 2941–2954. [Google Scholar] [CrossRef]
  44. Ahmed, M.S.; Mohamed, A.; Khatib, T.; Shareef, H.; Homod, R.Z.; Ali, J.A. Real time optimal schedule controller for home energy management system using new binary backtracking search algorithm. Energy Build. 2017, 138, 215–227. [Google Scholar] [CrossRef]
  45. Díaz, P.; Pérez-Cisneros, M.; Cuevas, E.; Avalos, O.; Gálvez, J.; Hinojosa, S.; Zaldivar, D. An Improved Crow Search Algorithm Applied to Energy Problems. Energies 2018, 11, 571. [Google Scholar] [CrossRef] [Green Version]
  46. Abou El Ela, A.A.; El-Sehiemy, R.A.; Shaheen, A.M.; Shalaby, A.S. Application of the Crow Search Algorithm for Economic Environmental Dispatch. In Proceedings of the Nineteenth International Middle East Power Systems Conference (MEPCON), Menoufia University, Nasr City, Egypt, 19–21 December 2017; pp. 78–83. [Google Scholar]
  47. Abdelaziz, A.Y.; Fathy, A. A novel approach based on crow search algorithm for optimal selection of conductor size in radial distribution networks. Eng. Sci. Technol. Int. J. 2017, 20, 391–402. [Google Scholar] [CrossRef]
  48. Zubaidi, S.L.; Al-Bugharbee, H.; Ortega-Martorell, S.; Gharghan, S.K.; Olier, I.; Hashim, K.S.; Al-Bdairi, N.S.S.; Kot, P. A Novel Methodology for Prediction Urban Water Demand by Wavelet Denoising and Adaptive Neuro Fuzzy Inference System Approach. Water 2020, 12, 1628. [Google Scholar] [CrossRef]
  49. Askarzadeh, A. A novel metaheuristic method for solving constrained engineering optimization problems: Crow search algorithm. Comput. Struct. 2016, 169, 1–12. [Google Scholar] [CrossRef]
  50. Zhou, P.; Li, Z.; Snowling, S.; Baetz, B.W.; Na, D.; Boyd, G. A random forest model for inflow prediction at wastewater treatment plants. Stoch. Environ. Res. Risk Assess. 2019, 33, 1781–1792. [Google Scholar] [CrossRef]
  51. Ghaith, M.; Siam, A.; Li, Z.; El-Dakhakhni, W. Hybrid Hydrological Data-Driven Approach for Daily Streamflow Forecasting. J. Hydrol. Eng. 2020, 25. [Google Scholar] [CrossRef]
  52. Gedefaw, M.; Hao, W.; Denghua, Y.; Girma, A.; Khamis, M.I. Variable selection methods for water demand forecasting in Ethiopia: Case study Gondar town. Cogent Environ. Sci. 2018, 4. [Google Scholar] [CrossRef]
  53. Haque, M.M.; Rahman, A.; Hagare, D.; Chowdhury, R.K. A Comparative Assessment of Variable Selection Methods in Urban Water Demand Forecasting. Water 2018, 10, 419. [Google Scholar] [CrossRef] [Green Version]
  54. Zhang, X.; Qiu, J.; Leng, G.; Yang, Y.; Gao, Q.; Fan, Y.; Luo, J. The Potential Utility of Satellite Soil Moisture Retrievals for Detecting Irrigation Patterns in China. Water 2018, 10, 1505. [Google Scholar] [CrossRef] [Green Version]
  55. Kim, K.; Joo, H.; Han, D.; Kim, S.; Lee, T.; Kim, H.S. On Complex Network Construction of Rain Gauge Stations Considering Nonlinearity of Observed Daily Rainfall Data. Water 2019, 11, 1578. [Google Scholar] [CrossRef] [Green Version]
  56. Gagliardi, F.; Alvisi, S.; Kapelan, Z.; Franchini, M. A Probabilistic Short-Term Water Demand Forecasting Model Based on the Markov Chain. Water 2017, 9, 507. [Google Scholar] [CrossRef]
  57. Pacchin, E.; Alvisi, S.; Franchini, M. A Short-Term Water Demand Forecasting Model Using a Moving Window on Previously Observed Data. Water 2017, 9, 172. [Google Scholar] [CrossRef]
  58. Bata, M.T.H.; Carriveau, R.; Ting, D.S.K. Short-Term Water Demand Forecasting Using Nonlinear Autoregressive Artificial Neural Networks. J. Water Resour. Plan. Manag. 2020, 146. [Google Scholar] [CrossRef]
  59. RW. Rand Water’s Integrated Annual Report; RW: Johannesburg, South Africa, 2013; p. 236. [Google Scholar]
  60. Muringathuparambil, R.J.; Musango, J.K.; Brent, A.C.; Currie, P. Developing building typologies to examine energy efficiency in representative low cost buildings in Cape Town townships. Sustain. Cities Soc. 2017, 33, 1–17. [Google Scholar] [CrossRef]
  61. Tabachnick, B.G.; Fidell, L.S. Using Multivariate Statistics, 6th ed.; Pearson Education, Inc.: London, UK, 2013. [Google Scholar]
  62. Al-Bugharbee, H.; Trendafilova, I. A Fault Diagnosis Methodology for Rolling Element Bearings Based on Advanced Signal Pretreatment And Autoregressive Modelling. J. Sound Vib. 2016, 369, 246–265. [Google Scholar] [CrossRef] [Green Version]
  63. Hassani, H.; Webster, A.; Silva, E.S.; Heravi, S. Forecasting U.S. Tourist arrivals using optimal Singular Spectrum Analysis. Tour. Manag. 2015, 46, 322–335. [Google Scholar] [CrossRef]
  64. Golyandina, N.; Zhigljavsky, A. Singular Spectrum Analysis for Time Series; Springer: New York, NY, USA, 2013. [Google Scholar] [CrossRef]
  65. Khan, M.A.R.; Poskitt, D.S. Forecasting stochastic processes using singular spectrum analysis: Aspects of the theory and application. Int. J. Forecast. 2017, 33, 199–213. [Google Scholar] [CrossRef]
  66. Zubaidi, S.L.; Kot, P.; Alkhaddar, R.M.; Abdellatif, M.; Al-Bugharbee, H. Short-Term Water Demand Prediction in Residential Complexes: Case Study in Columbia City, USA. In Proceedings of the 2018 11th International Conference on Developments in eSystems Engineering (DeSE), Cambridge, UK, 2–5 September 2018; pp. 31–35. [Google Scholar]
  67. Kinney, J.B.; Atwal, G.S. Equitability, mutual information, and the maximal information coefficient. Proc. Natl. Acad. Sci. USA 2014, 111, 3354–3359. [Google Scholar] [CrossRef] [Green Version]
  68. Nguyen-ky, T.; Mushtaq, S.; Loch, A.; Reardon-Smith, K.; An-Vo, D.-A.; Ngo-Cong, D.; Tran-Cong, T. Predicting water allocation trade prices using a hybrid Artificial Neural Network-Bayesian modelling approach. J. Hydrol. 2018, 567, 781–791. [Google Scholar] [CrossRef] [Green Version]
  69. Rumelhart, D.E.; Hinton, G.E.; Williams, R.J. Learning representations by back-propagating errors. Nature 1986, 323, 533–536. [Google Scholar] [CrossRef]
  70. Levenberg, K. A method for the solution of certain non-linear problems in least squares. Quart. Appl. Math. 1944, 2, 164–168. [Google Scholar] [CrossRef] [Green Version]
  71. Marquardt, D. An Algorithm for Least-Squares Estimation of Nonlinear Parameters. J. Soc. Ind. Appl. Math. 1963, 11, 431–441. [Google Scholar] [CrossRef]
  72. Yonaba, H.; Anctil, F.; Fortin, V. Comparing Sigmoid Transfer Functions for Neural Network Multistep Ahead Streamflow Forecasting. J. Hydrol. Eng. 2010, 15, 275–283. [Google Scholar] [CrossRef]
  73. Civicioglu, P. Backtracking Search Optimization Algorithm for numerical optimization problems. Appl. Math. Comput. 2013, 219, 8121–8144. [Google Scholar] [CrossRef]
  74. Civicioglu, P.; Besdok, E.; Gunen, M.A.; Atasever, U.H. Weighted differential evolution algorithm for numerical function optimization: A comparative study with cuckoo search, artificial bee colony, adaptive differential evolution, and backtracking search optimization algorithms. Neural Comput. Appl. 2018. [Google Scholar] [CrossRef]
  75. Wang, H.; Hu, Z.; Sun, Y.; Su, Q.; Xia, X. A novel modified BSA inspired by species evolution rule and simulated annealing principle for constrained engineering optimization problems. Neural Comput. Appl. 2018. [Google Scholar] [CrossRef]
  76. Stergiou, N. Nonlinear Analysis for Human Movement Variability; CRC Press: Cleveland, OH, USA, 2016. [Google Scholar]
  77. Aldrich, C.; Auret, L. Unsupervised Process Monitoring and Fault Diagnosis with Machine Learning Methods; Springer: Berlin, Germany, 2013. [Google Scholar]
  78. Dawson, C.W.; Abrahart, R.J.; See, L.M. HydroTest: A web-based toolbox of evaluation metrics for the standardised assessment of hydrological forecasts. Environ. Model. Softw. 2007, 22, 1034–1052. [Google Scholar] [CrossRef] [Green Version]
Figure 1. Municipal water consumption: (a) monthly time series, (b) boxplot for Rand Water Company.
Water 12 01885 g001
Figure 2. Original time series (top row) and three components of water consumption obtained by the pre-treatment signal technique (2nd to 4th rows). The 2nd row represents the new time series, while the 3rd and 4th represent noise.
Water 12 01885 g002
Figure 3. Box plot distribution for normalized and denoised data.
Water 12 01885 g003
Figure 4. Average mutual information (AMI) function of the water consumption time series.
Water 12 01885 g004
Figure 5. Metaheuristic algorithms simulation for five population size; (a) BSA; (b) CSA.
Water 12 01885 g005
Figure 6. Performance of the combined model in training, testing and validation stages.
Water 12 01885 g006
Figure 7. Performance of ANN (stand-alone) model in the (a) training stage, (b) testing stage and (c) validation stage.
Water 12 01885 g007
Figure 8. Presents the comparison between observed and predicted data for BSA-ANN and ANN (stand-alone) for the validation stage.
Water 12 01885 g008
Table 1. ANN hyperparameters.
ParameterType
Number of inputsEstimated by Mutual Information (MI) technique
Number of outputsOur target, which is water demand
Number of hidden layersTwo hidden layers
Number of neurons in hidden layer N1Estimated by metaheuristic algorithm
Number of neurons in hidden layer N2Estimated by metaheuristic algorithm
Learning rate coefficientEstimated by metaheuristic algorithm
Learning algorithmLevenberg-Marquardt (LM)
Activation function in hidden layer N1Tansigmoidal activation function
Activation function in hidden layer N2Linear activation function
Number of epochs1000 iterations
Table 2. Statistical parameters for training, testing, and validation sets.
Water Consumption (ML)CmaxCminCmeanCStdT
Training set11.8111.6011.700.06282
Testing set11.8211.6111.710.07017
Validation set11.7911.6111.720.05717
Table 3. Performance evaluation for validation data stage.
ModelData StageRMSEMAEMARECE
BSA-ANNTraining0.00910.00750.000640.999
Testing0.00900.00790.000440.972
Validation0.00990.00710.000400.979
ANN (stand-alone)Training0.00780.00580.000491.0
Testing0.01380.01120.000630.935
Validation0.01810.01290.000720.931

